
Abstract
Objective:
Depression affects many Australian adolescents. Research points to the potential of lifestyle improvement for the population-level prevention of mental disorders. However, most studies examine single relationships without considering the combined contribution of lifestyle factors to variance in depression. This study examined associations between adolescent diet, physical activity and screen time behaviours and depressive symptomatology.
Methods:
A cross-sectional sample of year 8 and 10 students was recruited from 23 participating schools in 18 Victorian communities. Students were recruited using opt-out consent, resulting in 3295 participants from 4680 registered school enrolments (Participation Rate: 70.4%). Participants completed a supervised self-report questionnaire comprising Moods and Feelings Questionnaire–Short Form, an assessment of physical activity and sedentary behaviours during and outside school, and weekly food intake. Surveyed covariates included hours of sleep per night, age, socio-economic status and measured anthropometry. A hierarchical regression stratified by gender was conducted, with dichotomised Moods and Feelings Questionnaire–Short Form score as the outcome, and screen time, physical activity and dietary patterns as predictors. Nested regression analyses were then conducted to ascertain the variance in Moods and Feelings Questionnaire–Short Form score attributable to each significant predictor from the initial regression.
Results:
Increased scores on an unhealthy dietary pattern (odds ratio = 1.18; 95% confidence interval = [1.07, 1.32]) and physical activity guideline attainment (0.91; [0.85, 0.97]) were associated with depressive symptomatology in males, while screen time guideline attainment (0.95; [0.91, 0.98]) was associated with depression in females. No association was observed between healthy diet pattern and Moods and Feelings Questionnaire–Short Form. Overall, effect sizes were generally small, and the regression model accounted for 5.22% of Moods and Feelings Questionnaire–Short Form variance.
Conclusion:
Gender-specific associations were observed between physical activity and both sedentary and dietary behaviours and depressive symptomatology among adolescents, although reverse causality cannot be refuted at this stage. Lifestyle behaviours may represent a modifiable target for the prevention of depressive symptomatology in adolescents.
Introduction
Depressive disorders are responsible for 2.5% of global disease burden and are the fourth highest cause of disease burden in Australasia (Murray et al., 2012). One in six (15%) Australian adolescents reported symptoms of depression in 2007 (Slade et al., 2009). A South Australian study of adolescents reported that the prevalence of major depression increased between 1998 (7%) and 2008 (10%) (Goldney et al., 2010). Adolescence is a particularly important period for mental disorder onset; the average age of onset for depression may be as low as 13 years in Western populations (Merikangas et al., 2010), and half of all adult mental disorders have their onset during adolescence (Belfer, 2008). Despite this, 16- to 24-year-olds are the least likely age group to access mental health services (Slade et al., 2009).
Alcohol consumption, tobacco use, unhealthy diet and a lack of physical activity are all associated with and may increase the risk of adolescent depression (Cairns et al., 2014). Physical activity, sedentary behaviour and unhealthy diet are particularly promising targets (Jacka et al., 2013) amenable to large-scale population intervention (Hayward et al., 2014) and which have featured in recent clinical practice guidelines for the management of depression (Malhi et al., 2015).
Many studies have reported associations between either diet quality or physical activity/sedentary behaviour and depressive symptoms. One prospective study of 3040 Australian adolescents found that healthy diet was associated with better mental health and unhealthy diet with worse mental health cross-sectionally, while healthy diet also predicted better mental health over time (Jacka et al., 2011). A cross-sectional study of 1324 West Australian adolescents found that those with a healthy diet had better mental health using the Child Behaviour Checklist (Oddy et al., 2009). Similarly, the Australian Healthy Neighbourhoods Study found those reporting consistently healthy or unhealthy diet patterns reported more or less depressive symptoms, respectively, even after adjustment for a range of important familial factors (Jacka et al., 2010). The results of a systematic review support a relationship between unhealthy diet and depression in children and adolescents (O’Neil et al., 2014).
Evidence for the association between physical activity/sedentary behaviour and reduced depressive symptoms in Australian adolescents has been supported by other studies. A study of over 8000 adolescents from Victoria, New South Wales and Queensland found meeting physical activity guidelines was associated with reduced depressive symptomatology (odds ratio [OR] = 0.62; 95% confidence interval [CI] = [0.44, 0.88]) as did attainment of the screen time (ST) guidelines among 12- to 14-year-old participants (OR = 0.77; 95% CI = [0.59, 0.99]) (Kremer et al., 2014).
While many studies have examined the diet–depression and physical activity/sedentary behaviour–depression associations, few have done so in the same analysis. Of those examining these relationships together, one study reported associations between sedentary time and depressive symptomatology in both male and female adolescents and between sweetened beverage consumption and depressive symptomatology in females (Hoare et al., 2014a). The lack of studies of Australian adolescents examining the possible contribution of physical activity and dietary patterns to the variance in depressive symptomatology simultaneously represents a gap in the literature. Thus, we aimed to establish the associations and relative contribution of each factor, singly and in combination, to the variance in depressive symptoms within a sample of male and female adolescents.
Methods
The methods are presented in accordance with the Strengthening the Reporting of Observational Studies in Epidemiology (STROBE) guidelines for reporting on observational studies (von Elm et al., 2007).
Setting
Data for this study were drawn from the baseline assessment of adolescents participating in a cluster-randomised control trial on adolescent anthropometry and obesogenic behaviours (Strugnell et al., 2015). Participants were recruited from year 8 (aged 14–16) and 10 (aged 16–19) classes in consenting secondary schools and data collected during school term 3 (July–September) 2014. No significant differences were observed between intervention and comparison communities for body mass index (BMI) Z-score at baseline, allowing the data to be combined for cross-sectional analysis.
Participants and recruitment
Participants were 3295 year 8 and 10 secondary school students from 18 communities across Victoria, Australia. Within each community, secondary schools were randomised, and three were invited to participate. Where no schools agreed to participate, additional schools were invited in groups of three until a participant school consented. In total, 146 schools were invited and 23 schools accepted (school response rate of 16%).
All eligible students in each school were invited to participate. Opt-out consent was used and a letter containing the plain language statement and consent forms was sent home. Students were considered to have provided informed consent unless the student or their parent/guardian withdrew them from the study, and verbal consent was confirmed with students again at the time of measurement. Of 4680 students invited from consenting schools, 4127 consented to participate (relative risk [RR] = 88%). After absences, n = 3295 students were available on data collection days, with data collected from n = 1528 students from year 8 and n = 1767 students from year 10.
Measures
The dependent variable, depressive symptomatology, was measured using the Moods and Feelings Questionnaire–Short Form (SMFQ; Angold et al., 1995). The SMFQ has been used reliably in other community-based studies with adolescent populations (Chipman et al., 2007) and asks participants to endorse 13 symptoms of depression as ‘not true’ (coded 0), ‘sometimes true’ (coded 1) or ‘true’ (coded 2) for the last 2 weeks. Examples of individual symptoms include ‘I felt miserable or unhappy’, ‘I felt so tired I just sat around and did nothing’ and ‘I hated myself’. Possible scores range from 0 to 26, and the measure was dichotomised using a validated cut point of 8, indicating probable depression (referred to henceforth as ‘depressive symptomatology’) with a specificity of 60% and sensitivity of 85% for clinical depression in adolescent participants (Angold et al., 1995).
Dietary intake was measured using the Simple Dietary Questionnaire (SDQ; (Parletta et al., unpublished)). Items from this questionnaire were used to measure consumption of fruit, vegetable, takeaway, energy-dense nutrient-poor snack foods, sugar-sweetened beverages (SSBs), caffeinated beverages and sweetened and plain dairy foods. Up to 25 different food groups can be measured using the SDQ; however, the above categories were prioritised due to study constraints. Participants indicated the average number of fruit and vegetable serves they had consumed per day over the week preceding the survey. Possible responses range from none to more than seven serves per day, in half-serve increments. All other food groups were measured on an 8-point scale, ranging from ‘rarely or never’ to ‘3 times or more per day’. The SDQ has been tested in Australian adolescent populations and demonstrates good test–retest reliability over 1–2 weeks and good validity when assessed against a 24-hour food recall. Vegetable consumption demonstrated test–retest reliability of r = 0.76, p < 0.05 and validity of r = 0.42, p < 0.05; fruit consumption performed similarly: test–retest r = 0.73, p < 0.05; validity r = 0.57, p < 0.05 (Parletta et al., in press).
Moderate–vigorous physical activity (MVPA) time and ST were measured using an item from the Core Indicators and Measures of Youth Health Survey (Kroeker et al., 2012). Students responded to a 6-point scale for each of the 7 days preceding the survey representing total MVPA minutes. Options included none, 1–14 minutes, 15–29 minutes, 30–59 minutes, 1–2 hours and more than 2 hours. Test–retest reliability for this item was moderate overall, with responses for individual days ranging from κ = 0.42 (Friday) to 0.51 (Tuesday). The ST measure asked students to indicate screen-based ST for the 7 days preceding the survey on a 5-point scale for each day, with responses including none, less than 1 hour, 1–2 hours, 2–5 hours and more than 5 hours. Test–retest reliability for this item was moderate overall, κ ranging from = 0.43 (Saturday) to 0.52 (Thursday/Sunday). Responses to these items were dichotomised according to whether the participant attained the Australian guideline for MVPA (>1 hour/day) (Commonwealth Department of Health, 2014) or ST (<2 hours/day) on each day, and categorical variables were generated to specify the number of days in the preceding week that the participant attained the MVPA and ST guidelines.
Covariates
Sleep was measured using a 9-point scale, with participants responding to the question ‘During the past 7 days, how much time did you usually spend sleeping per night?’ Possible responses began at ‘less than 5 hours’ and increased from ‘5 hours’ to ‘more than 12 hours’ in 1-hour increments. Previous research has shown sleep during adolescence to be associated with both physical activity and depression (Kredlow et al., 2015; Sivertsen et al., 2014). The item was written for this questionnaire and was constructed to capture self-reported sleep duration around US National Sleep Foundation recommendation of 8–10 hours sleep per night for adolescents (Hirshkowitz et al., 2015). The question was time-bound to the preceding week to maximise accuracy in self-reporting (Matricciani, 2013).
Height and weight were measured by trained data collectors, using Charder HM200P stadiometers (Charder HM200P Portstad; Charder Electronic Co. Ltd, Taichung City, Taiwan) and A&D UC-321 scales (A&D Precision Scale UC-321; A7D Medical, San Jose, CA, USA). Height and weight were measured according to standardised procedures that have been described in previous publications (Strugnell et al., 2015). If results differed by more than 0.05 kg in weight, or 0.5 cm in height, a third measure was taken and the result averaged. Height and weight were used, in conjunction with age, to calculate BMI-for-age Z-score according to World Health Organization (WHO) growth references (De Onis et al., 2007).
Date of birth was collected to calculate age in years. Postcode was collected to identify economic advantage/disadvantage of the participants’ usual area of residence according to the Australian Bureau of Statistics’ Socio-Economic Index for Areas (SEIFA; Australian Bureau of Statistics, 2006). Participants’ SEIFA scores were divided by decile and used in all analyses as a categorical variable.
Ethical approval for this study was given by the Deakin University Human Research Ethics Committee (ref 2013_095), the Victorian Government Department of Education and Training (ref 2013_002013) and the Catholic Education Offices, Archdiocese of Melbourne, Ballarat, Sandhurst and Sale.
Statistical methods
Principal component analysis (PCA) was used in order to determine the underlying patterns in participants’ dietary behaviour. Fruit and vegetable serves per day, frequency of consumption of takeaway foods, snack foods, SSBs and sweetened and unsweetened dairy foods were included in the analysis. The resulting components were subjected to an equamax rotation, and factors with loadings ⩾|0.3| were retained. Based on the recommendations of Tabachnick and Fidell (2013), factors with an eigenvalue ⩾1 were retained in order to exclude components with less explanatory power than the individual dietary variables.
A hierarchical logistic regression was designed, with dichotomised SMFQ as the outcome. The regression was stratified by gender as previous studies have shown gender difference in the MVPA and physical activity/ST–depression associations (Hoare et al., 2014a). Model 1 was an unadjusted model with only the independent variables of physical activity and ST guideline attainment days, and diet pattern and the dependent variable – dichotomised SMFQ scores – entered into the model. Model 2 included Model 1 with the addition of age and SEIFA deciles. The final model, Model 3, was the fully adjusted model, which comprised Model 2 with the addition of sleep and BMI Z-scores.
Nested hierarchical regression models were used to observe the model R2 attributable to each significant predictor of dichotomised SMFQ from the hierarchical regression model. The fully adjusted model was re-run once for each significant predictor, and the change in R2 (referred to onwards as ΔR2) was observed after the predictor was removed from the model. Statistical significance was determined using likelihood ratio tests.
Results
Descriptive statistics
Students reported meeting the physical activity guidelines on average, 2.49 (standard deviation [SD] = 2.25) days out of the week preceding the survey, although year 8 students were slightly more active than year 10 students (year 8 m = 2.62 days, year 10 m = 2.38 days, t = 3.06, p < 0.001). Students reported meeting the ST guidelines on average, 3.55 (SD = 2.85) days out of the week preceding the survey, and again, year 8 students more frequently met the guidelines (year 8 m = 3.81 days, year 10 m = 3.32 days, t = 4.94, p < 0.001).
Attainment of the guidelines for at least two serves of fruit on a usual day was reported by 67% of students, with a small but significant difference by year level (year 8 = 70%, year 10 = 65%, χ2 = 10.10, p < 0.01). Attainment of the guidelines for at least five serves of vegetables on a usual day was reported by only 7% of students, with no significant difference by year level. When examined for attainment of both the fruit and vegetable intake guidelines, 6% of students met both guidelines simultaneously. Descriptive statistics for the broader set of study measures are provided in Table 1.
Descriptive statistics.
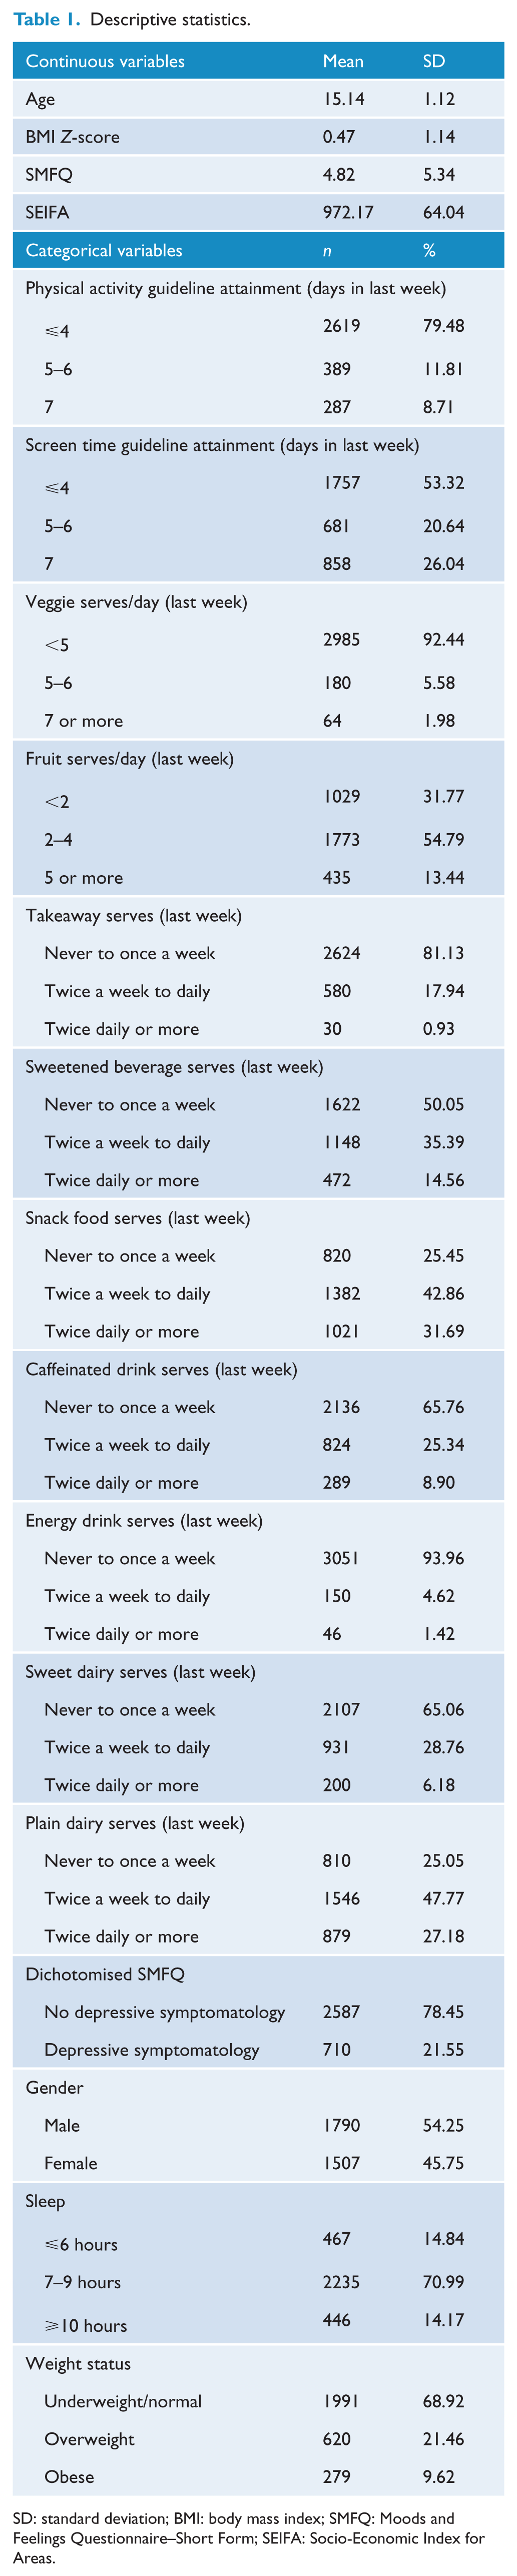
SD: standard deviation; BMI: body mass index; SMFQ: Moods and Feelings Questionnaire–Short Form; SEIFA: Socio-Economic Index for Areas.
PCA
The PCA revealed three factors with an eigenvalue above 1.00, so the first three factors were investigated for use in the analysis. The PCA was then re-run specifying a three-factor solution, and the loadings of the individual dietary intake variables were examined in order to interpret the factors.
The first factor had strong positive loadings for consumption of takeaway foods, sweetened beverages, caffeinated beverages and energy drinks. The second factor had strong positive loadings on serves of fruits and vegetables per day. The third factor had strong positive loadings on consumption of snack foods, sweetened dairy and plain dairy foods. The first factor was labelled the ‘unhealthy’ diet pattern, the second factor the ‘healthy’ pattern and the third the ‘snacking’ pattern. Internal consistency within the factors ranged from 0.38 to 0.72, and the factors were weakly correlated (Table 2).
Properties of the principal component analysis.
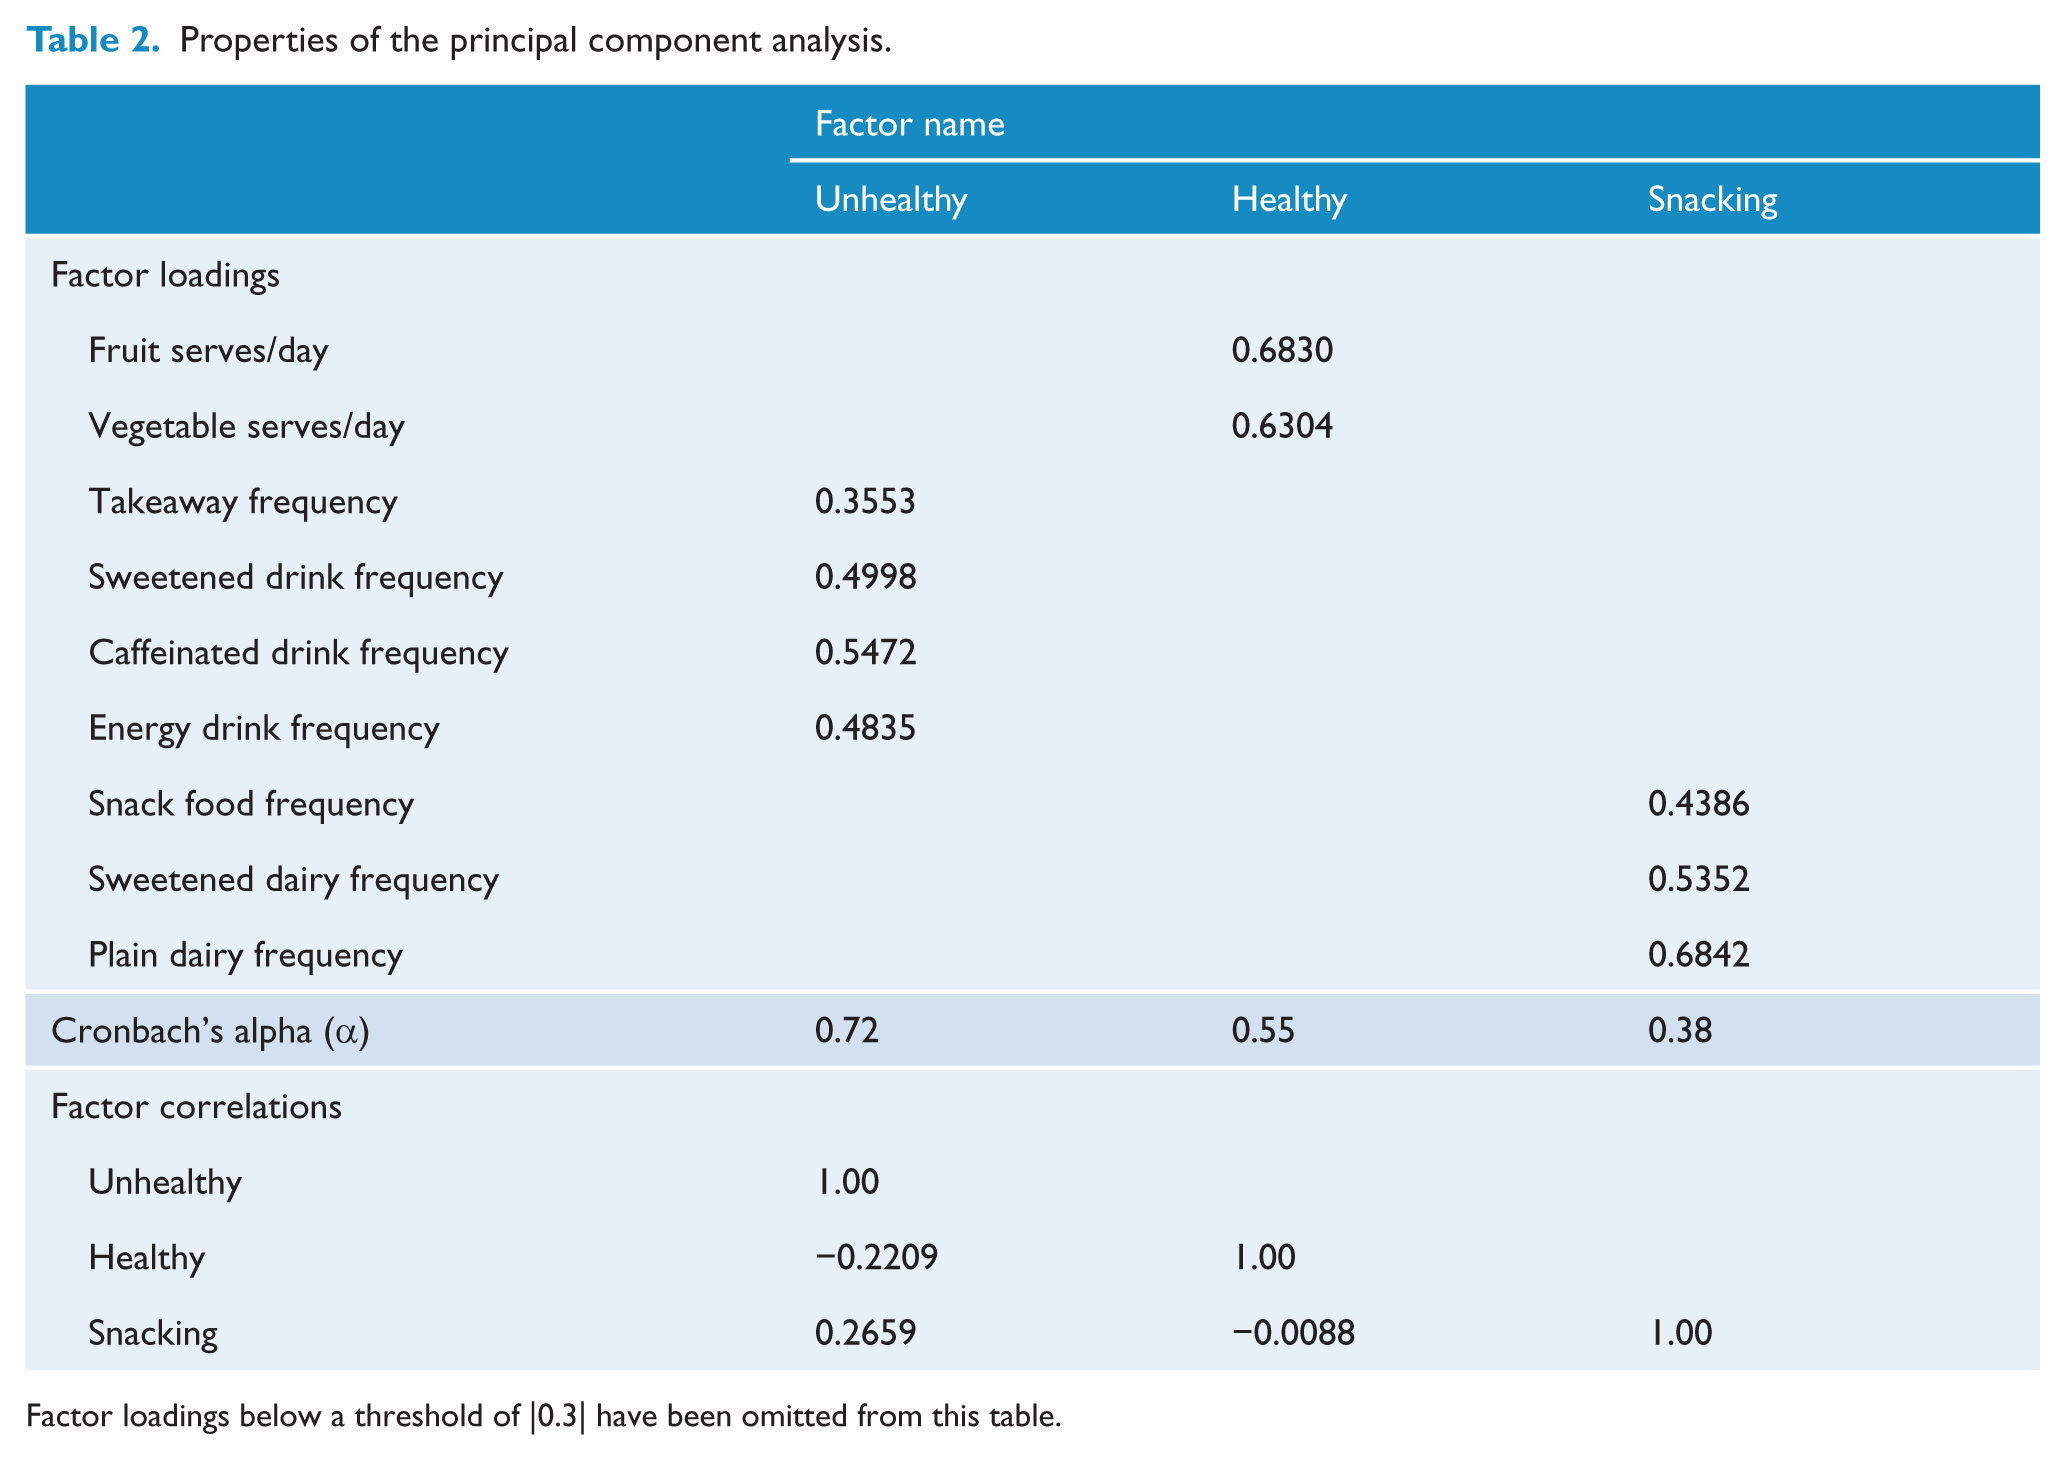
Factor loadings below a threshold of |0.3| have been omitted from this table.
Regression analysis
The unadjusted regression model (Table 3) showed that for male participants, higher scores on the unhealthy diet pattern were associated with higher probability of an SMFQ score of 8 or more. Additionally, every additional day on which male participants attained the recommended guidelines for physical activity was associated with a reduction in the probability of an SMFQ score greater than 8. Among female participants, every additional day on which participants attained the recommended guidelines for screen time was associated with a reduction in the probability of depressive symptomatology. Healthy dietary pattern scores and the snacking dietary pattern scores were not significantly associated with SMFQ in either gender.
Regression model for diet pattern and physical activity/screen time on dichotomous SMFQ.
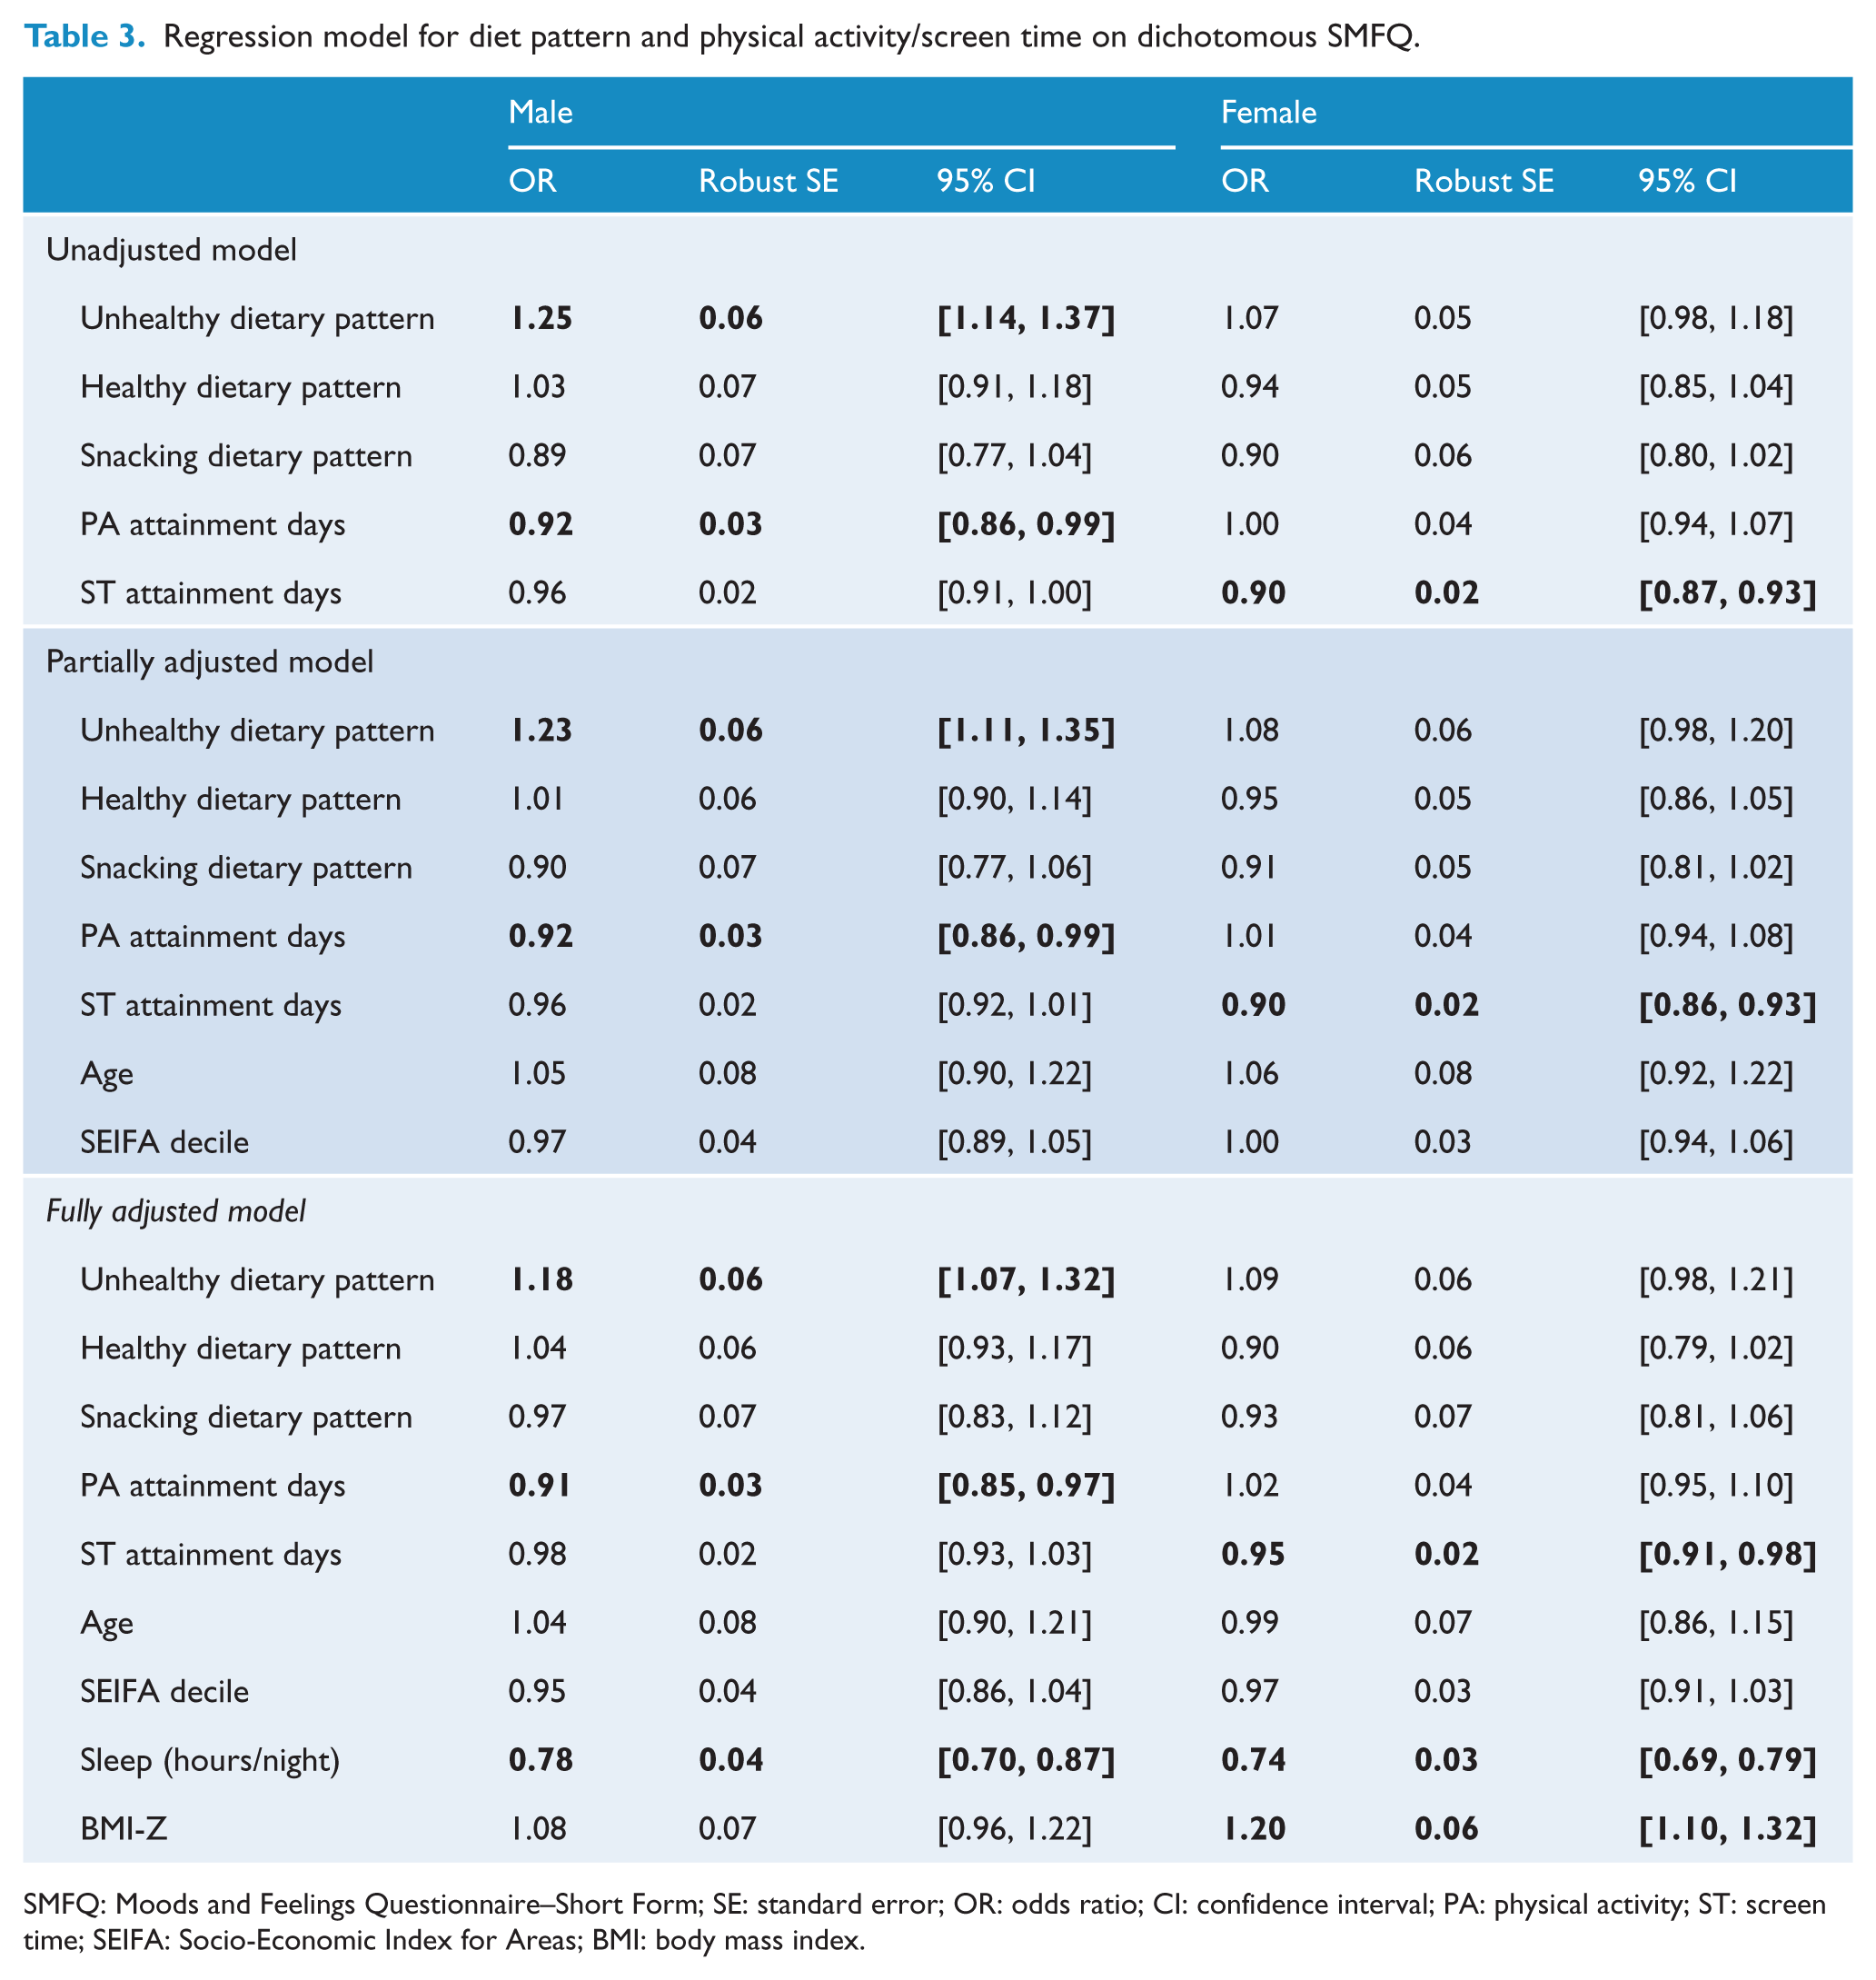
SMFQ: Moods and Feelings Questionnaire–Short Form; SE: standard error; OR: odds ratio; CI: confidence interval; PA: physical activity; ST: screen time; SEIFA: Socio-Economic Index for Areas; BMI: body mass index.
The significant associations from the unadjusted model remained significant after both the partial and full adjustment for the additional modifiable lifestyle-related factors, while healthy and snacking dietary pattern associations remained non-significant in all models. In both the partially and fully adjusted models, age and SEIFA decile were not significantly associated with SMFQ. In the fully adjusted model, however, both male and female participants who reported sleeping more hours on a usual night had a lower likelihood of depressive symptomatology. Increased BMI Z-score was associated with a higher likelihood of depressive symptomatology in female participants only.
ΔR2 analyses
The ΔR2 analyses (Table 4) found that the fully adjusted regression model accounted for 5.2% of the variance in the dichotomised SMFQ score for male participants and 6.0% of the variance for females. Table 4 presents the set of nested regression analyses, which tested the change in explained SMFQ variance when a variable was removed from the fully adjusted model and subsequently re-entered. For each variable, the ‘Remove [variable]’ line shows the amount of variance explained by the model when the specified variable is not considered. The difference in model R2 caused by the removal of that variable from the fully adjusted model is given in the ΔR2 column, along with the significance associated with that change. Only the significant associations from the fully adjusted model in each gender were tested.
Examination of R2 change in depressive symptomatology attributable to dietary patterns, physical activity, screen time, sleep and BMI-Z.
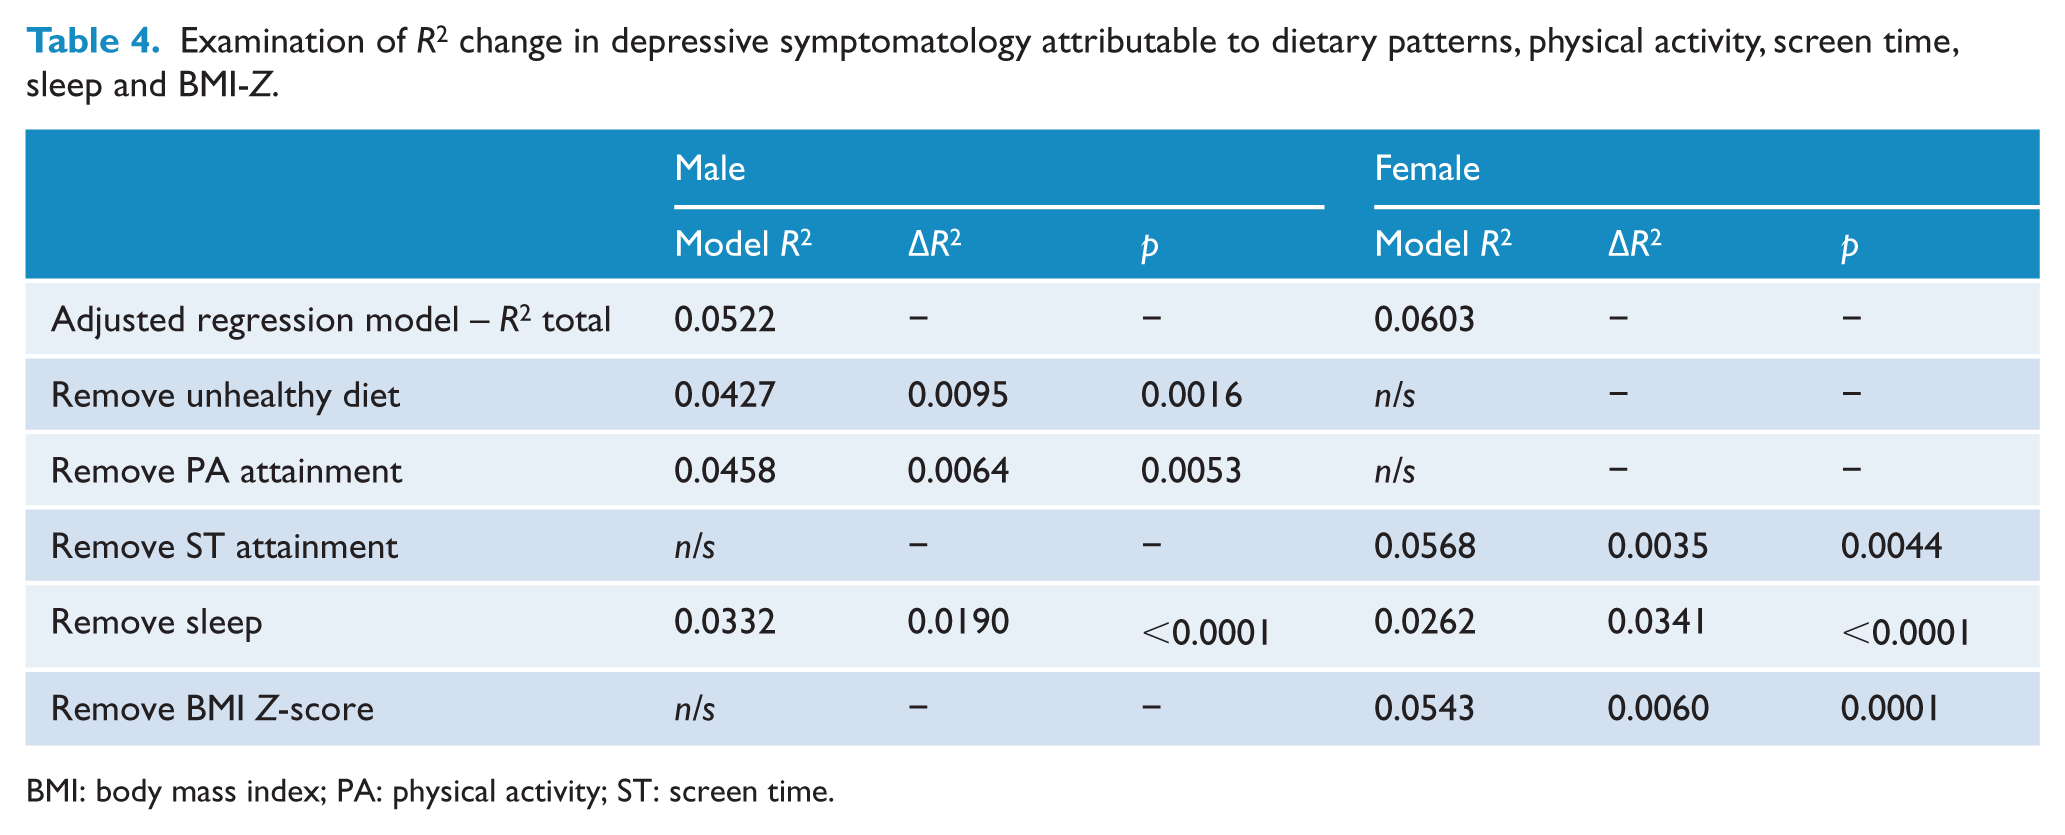
BMI: body mass index; PA: physical activity; ST: screen time.
Unhealthy dietary pattern scores and physical activity guideline attainment in males and ST guideline attainment and BMI Z-score in females all contributed a small but significant amount of explained variance in SMFQ scores in the model (<1.0%). Sleep, however, contributed a much larger share of variance explained in the adjusted model, explaining 1.9% of SMFQ variance in males and 3.4% in females.
Discussion
In this sample of Australian adolescents, multiple behavioural risk factors were associated with an increased probability of depressive symptomatology. Factors associated with increased odds of depressive symptomatology differed by gender. On average, male adolescents with unhealthy diet and low physical activity were more likely to experience depressive symptomatology. For males, a 1 SD increase in unhealthy dietary pattern was associated with an 18% increase in likelihood of depressive symptoms, while every day of physical activity guideline attainment was associated with a 9% decrease. Female adolescents of increased weight status and high levels of ST were also more likely to experience depressive symptoms. For females, every day of ST guideline attainment was associated with a 5% reduction in the probability for depressive symptomatology, while a 1-point increase in BMI Z-score was associated with a 20% increase in the likelihood of depressive symptomatology. Sleep was the only risk behaviour that was associated with depressive symptomatology in both genders, with both males and females who had more sleep less likely to experience depressive symptoms. For males, every additional hour of sleep per night was associated with a 22% reduction in the probability of depressive symptomatology, and in females, every additional hour reduced the odds by 26%.
The positive association among males between unhealthy dietary patterns and depressive symptomatology was consistent with previous findings (Jacka et al., 2010, 2011; Oddy et al., 2009). This appears to be a robust finding as different studies that have produced similar results have used a range of tools, including diet quality scores, frequency of consumption for specific food groups and food frequency questionnaires (O’Neil et al., 2014). The findings from this study add further support to the growing understanding of the role of nutrition in adolescent mental health (O’Neil et al., 2014).
Our finding of no association between healthy dietary patterns and depressive symptomatology is inconsistent with many previous findings. Studies have reported decreased likelihood of depressive symptomatology for adolescents reporting healthy dietary patterns (Jacka et al., 2010, 2011). In this study, only fruit and vegetable intake variables made up the healthy dietary factor score. Other studies with scores comprising more items capturing the intake of healthy foods, such as wholegrains, fish, legumes and so on, have consistently shown inverse relationships between healthy dietary patterns and depression. For example, several studies have reported that higher adherence to a ‘Mediterranean’ diet pattern is protective against depression (Psaltopoulou et al., 2013; Sánchez-Villegas et al., 2009). It may be the case that the lack of significant association between healthy diet and depressive symptoms in this study is attributable to the use of a less sophisticated dietary measurement tool than previous studies.
The association between ST guideline attainment and depressive symptomatology was partially consistent with a previous Australian study (Hoare et al., 2014a), which found that exceeding the guidelines of 2 hours of ST per day increased the odds of depressive symptomatology for both males and females, but found no association between physical activity and depressive symptomatology. These differences may be attributable to the measurement tools used, as physical activity was classified as low, moderate or high based on the previous day’s activity, and ST attainment was estimated based on the preceding weekday and weekend, while this study asked participants to recall each of the last 7 days.
Consistent with our findings, Kremer et al. (2014) observed a significant association between self-reported physical activity and reduced likelihood of depressive symptomatology, yet they found no support for the ST association. That analysis, however, used a single survey item to ask participants to estimate their daily physical activity and ST behaviours in a ‘normal’ week, and also did not stratify the analyses by gender, which may have masked the significance of the ST association in girls, if a true gender difference does exist in this association.
The analysis regarding depressive symptom variance attributable to the significant predictors identified that unhealthy dietary patterns and physical activity guideline attainment in males and ST guideline attainment and BMI Z-score in females were responsible for a small proportion of the variance in SMFQ scores. While the sleep association was significant in both genders, and explained a moderate proportion of model variance (1.90% in males, 3.41% in females), the overall effect remained small. Individual studies have reported significant, but often small effects for many risk factors, including socio-economic and community factors (Stirling et al., 2015), family structure and self-perception (Klasen et al., 2015) and modifiable lifestyle behaviours including drug use, sexual behaviours, religious practices, sleep, weight and many others (Cairns et al., 2014). There appears to be a broad base of small, yet important modifiable risk factors that may expose the adolescent population to increased depressive symptomatology risk. Although the proportion of variance explained is small, given the high prevalence of depression in the population, poor diet, reduced physical activity, increased sedentary behaviour, inadequate sleep and high BMI-Z may translate to a significant burden at the population level.
These data were drawn from a large, population-based sample spanning broad geographical and demographic areas across Victoria. The sample for this study was recruited using an opt-out recruitment process, which was the first of its kind for a population-based study of adolescents in Victoria. Opt-out consent did not appear to place participants at risk of adverse outcomes (Lacy et al., 2012), and no formal complaints were raised by participants during this study. Opt-out consent also greatly ameliorated the poor opt-in response rate observed in the pilot for this study, which was around 10%. Response rate at the school level remained low at 16%. This may have biased the sample at the school level if non-participation was caused by non-random factors (i.e. non-participation due to time/resource constraints); however, reasons for non-participation were not assessed.
In interpreting these results, it should be considered that the measures for physical activity, ST, diet behaviours, depressive symptomatology and all covariates (with the exclusion of direct-measured anthropometry) were self-reported. Self-report can be subject to respondent bias and recall errors (affecting, for example, estimation of portion sizes). In a study with such a large sample as this, however, the use of more direct measures for these behaviours (i.e. accelerometry, food diaries, etc.) would have created prohibitive logistical and cost burden. Data on other possible effect modifiers were not collected in this sample (e.g. body image, social support and anxiety).
These data are cross-sectional and longitudinal data would be needed to infer causal relationships between the health behaviours examined and depressive symptomatology. One risk is potential reverse causality in the diet–depressive symptom relationship (Jacka et al., 2015), although this has been extensively investigated in many of the prospective studies in the adult literature and the data do not support this as an explanation for the relationships observed (e.g. Jacka et al., 2015). A recent systematic review of the sedentary behaviour–depressive symptomatology relationship suggests that current evidence is thus far inadequate for inferring causality (Hoare et al., 2014b).
The evidence points to the potential for prevention (Jacka et al., 2012), and next steps should include randomised controlled trials of behaviour change interventions targeting sedentary and dietary behaviours to alleviate depressive symptomatology among adolescents. These results also suggest that mental health outcomes should be more widely incorporated into the evaluation of large, population-based health promotion activities. This study supports small but important associations between lifestyle behaviours and depressive symptomatology. This is positive news, given that previous interventions in other lifestyle-related disease prevention fields have successfully modified these behaviours in children and adolescents (Waters et al., 2011).
Conclusion
Meeting the physical activity guidelines on fewer days per week and adhering more closely to an unhealthy diet pattern were associated with greater risk of displaying significant depressive symptomatology for males in this study. Females who met the ST guidelines on fewer days and who had higher BMI-Z were also at greater risk, as were any adolescents who reported sleeping fewer hours per night regardless of their gender.
Footnotes
Acknowledgements
Allender, Millar and Strugnell are researchers within a National Health and Medical Research Council (NHMRC) Centre for Research Excellence in Obesity Policy and Food Systems (APP1041020). Felice Jacka has received Grant/Research support from the Brain and Behaviour Research Institute, the NHMRC, Australian Rotary Health, the Geelong Medical Research Foundation, the Ian Potter Foundation, Eli Lilly, the Meat and Livestock Board, Woolworths Limited and The University of Melbourne and has received speakers honoraria from Sanofi-Synthelabo, Janssen Cilag, Servier, Pfizer, Health Ed, Network Nutrition, Angelini Farmaceutica, and Eli Lilly. She is the president of the International Society for Nutritional Psychiatry Research (ISNPR) and the Alliance for the Prevention of Mental Disorders. She is supported by an NHMRC Career Development Fellowship (2) (#1108125). Allender is supported by funding from an Australian NHMRC/Australian National Heart Foundation Career Development Fellowship (APP1045836). Allender is supported by US National Institutes of Health grant titled Systems Science to Guide Whole-of-Community Childhood Obesity Interventions (1R01HL115485-01A1). Jacka is supported by an NHMRC Career Development Fellowship (APP1108125). Millar is supported by an Alfred Deakin Postdoctoral Fellowship. We would like to acknowledge the support from the Victorian Department of Health and the Victorian Department of Education and Early Childhood Development.
Declaration of Conflicting Interests
The author(s) declared no potential conflicts of interest with respect to the research, authorship, and/or publication of this article.
Funding
This work was supported by the Australian National Health and Medical Research Council (NHMRC)/Australian National Heart Foundation (grant number APP1045836), the NHMRC (grant number APP1041020), the US National Institutes of Health (grant number 1R01HL115485-01A1) and the National Heart Foundation (grant number 100259) and Deakin University.