
Abstract
Objective:
We aimed to describe the prevalence and age distribution of personality disorders and their comorbidity with other psychiatric disorders in an age-stratified sample of Australian women aged ⩾25 years.
Methods:
Individual personality disorders (paranoid, schizoid, schizotypal, histrionic, narcissistic, borderline, antisocial, avoidant, dependent, obsessive-compulsive), lifetime mood, anxiety, eating and substance misuse disorders were diagnosed utilising validated semi-structured clinical interviews (Structured Clinical Interview for DSM-IV-TR Axis I Disorders, Research Version, Non-patient Edition and Structured Clinical Interview for DSM-IV Axis II Personality Disorders). The prevalence of personality disorders and Clusters were determined from the study population (n = 768), and standardised to the Australian population using the 2011 Australian Bureau of Statistics census data. Prevalence by age and the association with mood, anxiety, eating and substance misuse disorders was also examined.
Results:
The overall prevalence of personality disorders in women was 21.8% (95% confidence interval [CI]: 18.7, 24.9). Cluster C personality disorders (17.5%, 95% CI: 16.0, 18.9) were more common than Cluster A (5.3%, 95% CI: 3.5, 7.0) and Cluster B personality disorders (3.2%, 95% CI: 1.8, 4.6). Of the individual personality disorders, obsessive-compulsive (10.3%, 95% CI: 8.0, 12.6), avoidant (9.3%, 95% CI: 7.1, 11.5), paranoid (3.9%, 95% CI: 3.1, 4.7) and borderline (2.7%, 95% CI: 1.4, 4.0) were among the most prevalent. The prevalence of other personality disorders was low (⩽1.7%). Being younger (25–34 years) was predictive of having any personality disorder (odds ratio: 2.36, 95% CI: 1.18, 4.74), as was being middle-aged (odds ratio: 2.41, 95% CI: 1.23, 4.72). Among the strongest predictors of having any personality disorder was having a lifetime history of psychiatric disorders (odds ratio: 4.29, 95% CI: 2.90, 6.33). Mood and anxiety disorders were the most common comorbid lifetime psychiatric disorders.
Conclusions:
Approximately one in five women was identified with a personality disorder, emphasising that personality disorders are relatively common in the population. A more thorough understanding of the distribution of personality disorders and psychiatric comorbidity in the general population is crucial to assist allocation of health care resources to individuals living with these disorders.
Introduction
Currently, little is known regarding the prevalence, distribution and associated characteristics of personality disorder (PD) and their comorbidity with other psychiatric disorders in the general Australian population. Clinically-based evidence indicates that PDs are highly prevalent (45.5%) among psychiatric patients (Zimmerman et al., 2005) and are a consistent driver of impairments in social and occupational functioning (Gunderson et al., 2011; Zanarini et al., 2012), and a key risk factor for suicide attempts (Ansell et al., 2015; Zanarini et al., 2008). Despite the high levels of psychiatric comorbidity and associated functional impairment reported among those with PD in clinically-based studies, these comorbidities have remained largely unmeasured in the general Australian population.
European population-based studies have shown the prevalence of PD to range between 4.4% (England, Scotland and Wales) (Coid et al., 2006) and 13.4% (Norway) (Torgersen et al., 2001). The World Health Organization (WHO) Mental Health Surveys from Western European countries suggest that the pooled prevalence for any probable PD cases is approximately 6.1% (Huang et al., 2009). In the United States, the prevalence of PD has been reported to range between 9.0% and 21.5%, being somewhat higher than other countries (Grant et al., 2004, 2008; Lenzenweger et al., 2007; Pulay et al., 2009; Stinson et al., 2008; Trull et al., 2010). Despite methodological heterogeneity, these population-based studies demonstrate that not only are PDs common but they are also associated with overall disability (Grant et al., 2004; Jackson and Burgess, 2002; Trull et al., 2010), disruptions to employment, reduced income, poor social functioning (Coid et al., 2009; Lenzenweger et al., 2007; Sareen et al., 2011; Trull et al., 2010; Yang et al., 2010) and premature mortality (Fok et al., 2012).
It is also well known that sex disparities exist in mental health, namely, depression and anxiety, with approximately one in three Australian women being affected in their lifetime (Williams et al., 2010). There is a suggestion that some individual PDs might be particularly prevalent among women, for example, obsessive-compulsive and avoidant PDs (Grant et al., 2004; Jackson and Burgess, 2000; Torgersen et al., 2001; Trull et al., 2010); however, further research is needed.
To date, the prevalence of PDs among the general Australian population has been informed by the 1997 National Survey of Mental Health and Wellbeing (NSMHW). Jackson and Burgess reported that 6.5% of the Australian population (6.1% in women) screened positive for PD using the International Personality Disorder Examination (IPDE) screening questionnaire (59 items; true/false) (Jackson and Burgess, 2000). This survey also emphasised the significant disability associated with PD, underscored by frequent self-reported utilisation of health care services (Jackson and Burgess, 2002, 2004). The survey was limited by the restricted age range assessed and by the use of a screening questionnaire to identify PD, which was later described as being too brief to adequately detect cases and not validated for this purpose (Jackson and Burgess, 2000).
Good-quality epidemiological data are vital for increasing the knowledge base of the health care sector, and thus guiding public health planning and delivery of services. Of equal importance is information regarding the distribution and presentation of mental ill health across the lifespan (Newton-Howes et al., 2015). Given the paucity of current and robust epidemiological data, we aimed to report the prevalence and age distribution of PD, PD clusters and individual PDs, along with comorbid mood, anxiety, substance and eating disorders, in a representative, age-stratified sample of Australian women aged ⩾25 years.
Methods
Participants
This study examined data collected from women enrolled in the Geelong Osteoporosis Study (GOS), an on-going, population-based cohort study originally established to describe the epidemiology of osteoporosis in Australia. The scope of the study has since expanded to examine the complex interface between a broad range of physical and mental health conditions.
Study participants were originally selected at random from the Commonwealth of Australia Electoral Commission (AEC) rolls for the Barwon Statistical Division (BSD) located in south-eastern Australia, using an age-stratified sampling method. The BSD is representative of the wider Australian population in terms of pertinent socio-demographic profiles (Pasco et al., 2012).
Originally, 1494 women participated in GOS baseline assessments (1994–1997), and an additional sample of 246 was recruited (2006–2008) aged 20–29 years using the same sampling method (Pasco et al., 2012). Further details of the study have been published elsewhere (Pasco et al., 2012; Williams et al., 2010). Of the remaining women who were eligible to participate, 849 returned for the assessment phase conducted from 2011 to 2014. Reasons for non-participation included death (n = 392), migration from the region (n = 94) or inability to be contacted (n = 128). Of the 1126 eligible participants, 277 women declined to participate citing the follow reasons: personal reasons (e.g. interference from family, invasion of privacy, not interested) (n = 124), old age/unable to cope (n = 78), time constraints (n = 36), illness (n = 21), too far to travel (n = 5), failure to keep appointment (n = 4), language barrier (n = 1) and for reasons not provided (n = 8).
Of those 849 women, 768 provided complete the Structured Clinical Interview for DSM-IV-TR Axis I Disorders, Research Version, Non-patient Edition (SCID-I/NP) and Structured Clinical Interview for DSM-IV Axis II Personality Disorders (SCID-II) data and were thus included in the current analyses. Ethics approval was provided by the Barwon Health Human Research Ethics Committee, and Deakin University Human Research and Ethics Committee. All participants provided written informed consent.
Psychiatric assessments
Psychiatric diagnoses were obtained using validated semi-structured clinical interviews (First et al., 1997, 2002). Reliability studies using a combination of joint interview and observer methods have shown the SCID-I (Zanarini et al., 2000) and SCID-II yield fair to good reliability ranges for categorical diagnoses (Maffei et al., 1997; Zanarini et al., 2000). Reliability coefficients (kappa for test–retest design) for the SCID have been shown to demonstrate fair agreement for categorical diagnoses of DSM-IV major depressive disorder (MDD) (κ = 0.61), poor (generalised anxiety disorder; κ = 0.44) through good range for anxiety disorders (κ = 0.59–0.78), good ranges for alcohol and other substance use disorders (κ = 0.76–0.77) and fair for eating disorders (κ = 0.64) (Zanarini et al., 2000). The presence of categorical PDs including avoidant, dependent, obsessive-compulsive, paranoid, schizotypal, schizoid, histrionic, narcissistic, borderline and antisocial was determined using the SCID-II (First et al., 1997). Reliability studies using joint interview and observer methods have shown the SCID-II yields fair–good reliability ranges for categorical diagnoses of the DSM-IV PDs: avoidant (κ = 0.83–0.97), dependent (κ = 0.83–0.86), obsessive-compulsive (κ = 0.83–0.87), paranoid (κ = 0.93), schizoid (κ = 0.91), schizotypal (κ = 0.91), histrionic (κ = 0.92), narcissistic (κ = 0.98) and borderline (κ = 0.91), (κ = 0.78–0.98) (Maffei et al., 1997; Zanarini et al., 2000).
Interviews were conducted by personnel with postgraduate qualifications in psychology, who were trained under the supervision of a psychiatrist using live and videotaped interviews as recommended by First et al. The SCID-I/NP was used to assess the presence of lifetime:
1. Mood disorders, that is, MDD, minor depression, dysthymia, mood disorder due to a general medical condition, substance-induced mood disorder or bipolar disorder (I, II, not otherwise specified [NOS]);
2. Anxiety disorders, that is, panic disorder, agoraphobia, social phobia, specific phobia, obsessive-compulsive disorder, generalised anxiety disorder (current only), anxiety disorders due to a general medical condition, substance-induced anxiety disorder and anxiety disorders NOS;
3. Eating disorders, that is, anorexia/bulimia nervosa, binge eating disorder;
4. Substance use disorders, that is, alcohol and non-alcohol substance use disorders (dependence and abuse).
The SCID-II was used to assess the lifetime presence of
5. PDs, that is, paranoid, schizoid, schizotypal, histrionic, narcissistic, borderline, antisocial, avoidant, dependent and obsessive-compulsive.
The Global Assessment of Functioning Scale (GAF) was used to measure aspects of functional capacities across psychological, social and occupational domains (First et al., 1997).
Socio-demographic information
Pertinent socio-demographic information was ascertained from self-reported questionnaires and included age, country of birth, marital status and completion of secondary education. The Index of Relative Socio-economic Advantage and Disadvantage (IRSAD) was used to determine the relative socio-economic conditions of individuals and households at the area level, as previously published (Brennan et al., 2009; Williams et al., 2011). ABS software was utilised to derive the Socio-Economic Index for Areas (SEIFA) scores, providing a summary index that indicates both relative advantage and disadvantage at the small geographically-defined area level. A lower score on the IRSAD indicated relatively greater disadvantage (Quintile 1), and a higher score indicated relatively greater advantage (Quintile 5).
Other assessments
Participants provided detailed lists and/or containers of current and prior use of medications, which were categorised according to the classification system of MIMS pharmaceutical database). Height and weight were measured to the nearest 0.1 cm and 0.1 kg, respectively. Body mass index (BMI, kg/m2) was derived from these measures, with obesity being defined as having a BMI > 30 kg/m2. Information regarding history of psychiatric hospitalisations was also collected during the interviews.
Statistical analyses
‘Any PD’ was generated by the presence of any one or more categorical PDs; ‘Cluster A’ included any categorical paranoid, schizotypal or schizoid PDs; ‘Cluster B’ any categorical histrionic, narcissistic, borderline or antisocial PDs; ‘Cluster C’ any categorical avoidant, dependent or obsessive-compulsive PDs (American Psychiatric Association, 2013). Age-stratified frequencies for any PD, Clusters and individuals PDs were determined for 10-year age groups (25–34, 35–44, 45–54, 55–64, 65–74, ⩾75 years). Unadjusted odd ratios (ORs) with 95% confidence intervals (95% CIs) for the predictor variables of interest (age groups, socio-economic status, marital status, education, birth country, psychotropic medication use, obesity, psychiatric hospitalisation and lifetime psychiatric disorders) were calculated using logistic regression. Cross-tabulations were used to examine the frequencies (n = ) and percentage (%) of women with any PD for each predictor variable. The dependent variable was presence of ‘any PD’. Differences between those with and without any PD on GAF scores were assessed using Kruskal–Wallis, with median and inter-quartile range (IQR) reported. Values of p < 0.05 were accepted as statistically significant. The overall prevalence estimates (with 95% CI) of any PD, Clusters and individual PDs were determined from the study population and directly standardised to the population at risk for each age group using the Australian Bureau of Statistics 2011 census data (Age by Sex; Cat. No.2001.0; Australian Bureau of Statistics, 2012; Kirkwood and Sterne, 2003). Statistical analyses were performed using Minitab Statistical Software (Version 17; Minitab, State College, PA, USA) and Stata Statistical Software (Release 13; StataCorp LP, College Station, TX, USA).
Results
The frequencies and percentage of women with any PD according to each predictor variable of interest are presented in Table 1. The proportion of women with PD in each age group were as follows: 26.4% (25–34 years), 21.7% (35–44 years), 26.8% (45–54 years), 21.0% (55–64 years), 14.4% (65–74 years) and 13.2% (⩾75 years) (Table 1). It can be seen that the youngest age group (25–34 years) was associated with increased odds of having any PD (p < 0.01), as was the middle age group (45–54 years) (p < 0.01). Other significant predictors of having any PD were psychotropic medication use (current), psychiatric hospitalisation (ever), obesity (ever), being single/never married or separated/divorced (all p < 0.01). The strongest predictor of having any PD was having a lifetime history of psychiatric disorders (all p < 0.01). There was also a difference in GAF scores between those with any PD (70.0; IQR 60.0–80.0) compared to those without (85.0; IQR 80.0–90.0) as measured by the GAF Scale (p < 0.001), suggesting those with any PD had higher functional impairment.
Frequencies (n) and percentage (%) of total sample and women with any personality disorder (PD) for each predictor variable, and logistic regression model for predicting PD presented as odds ratio (OR) with 95% confidence intervals (CIs).
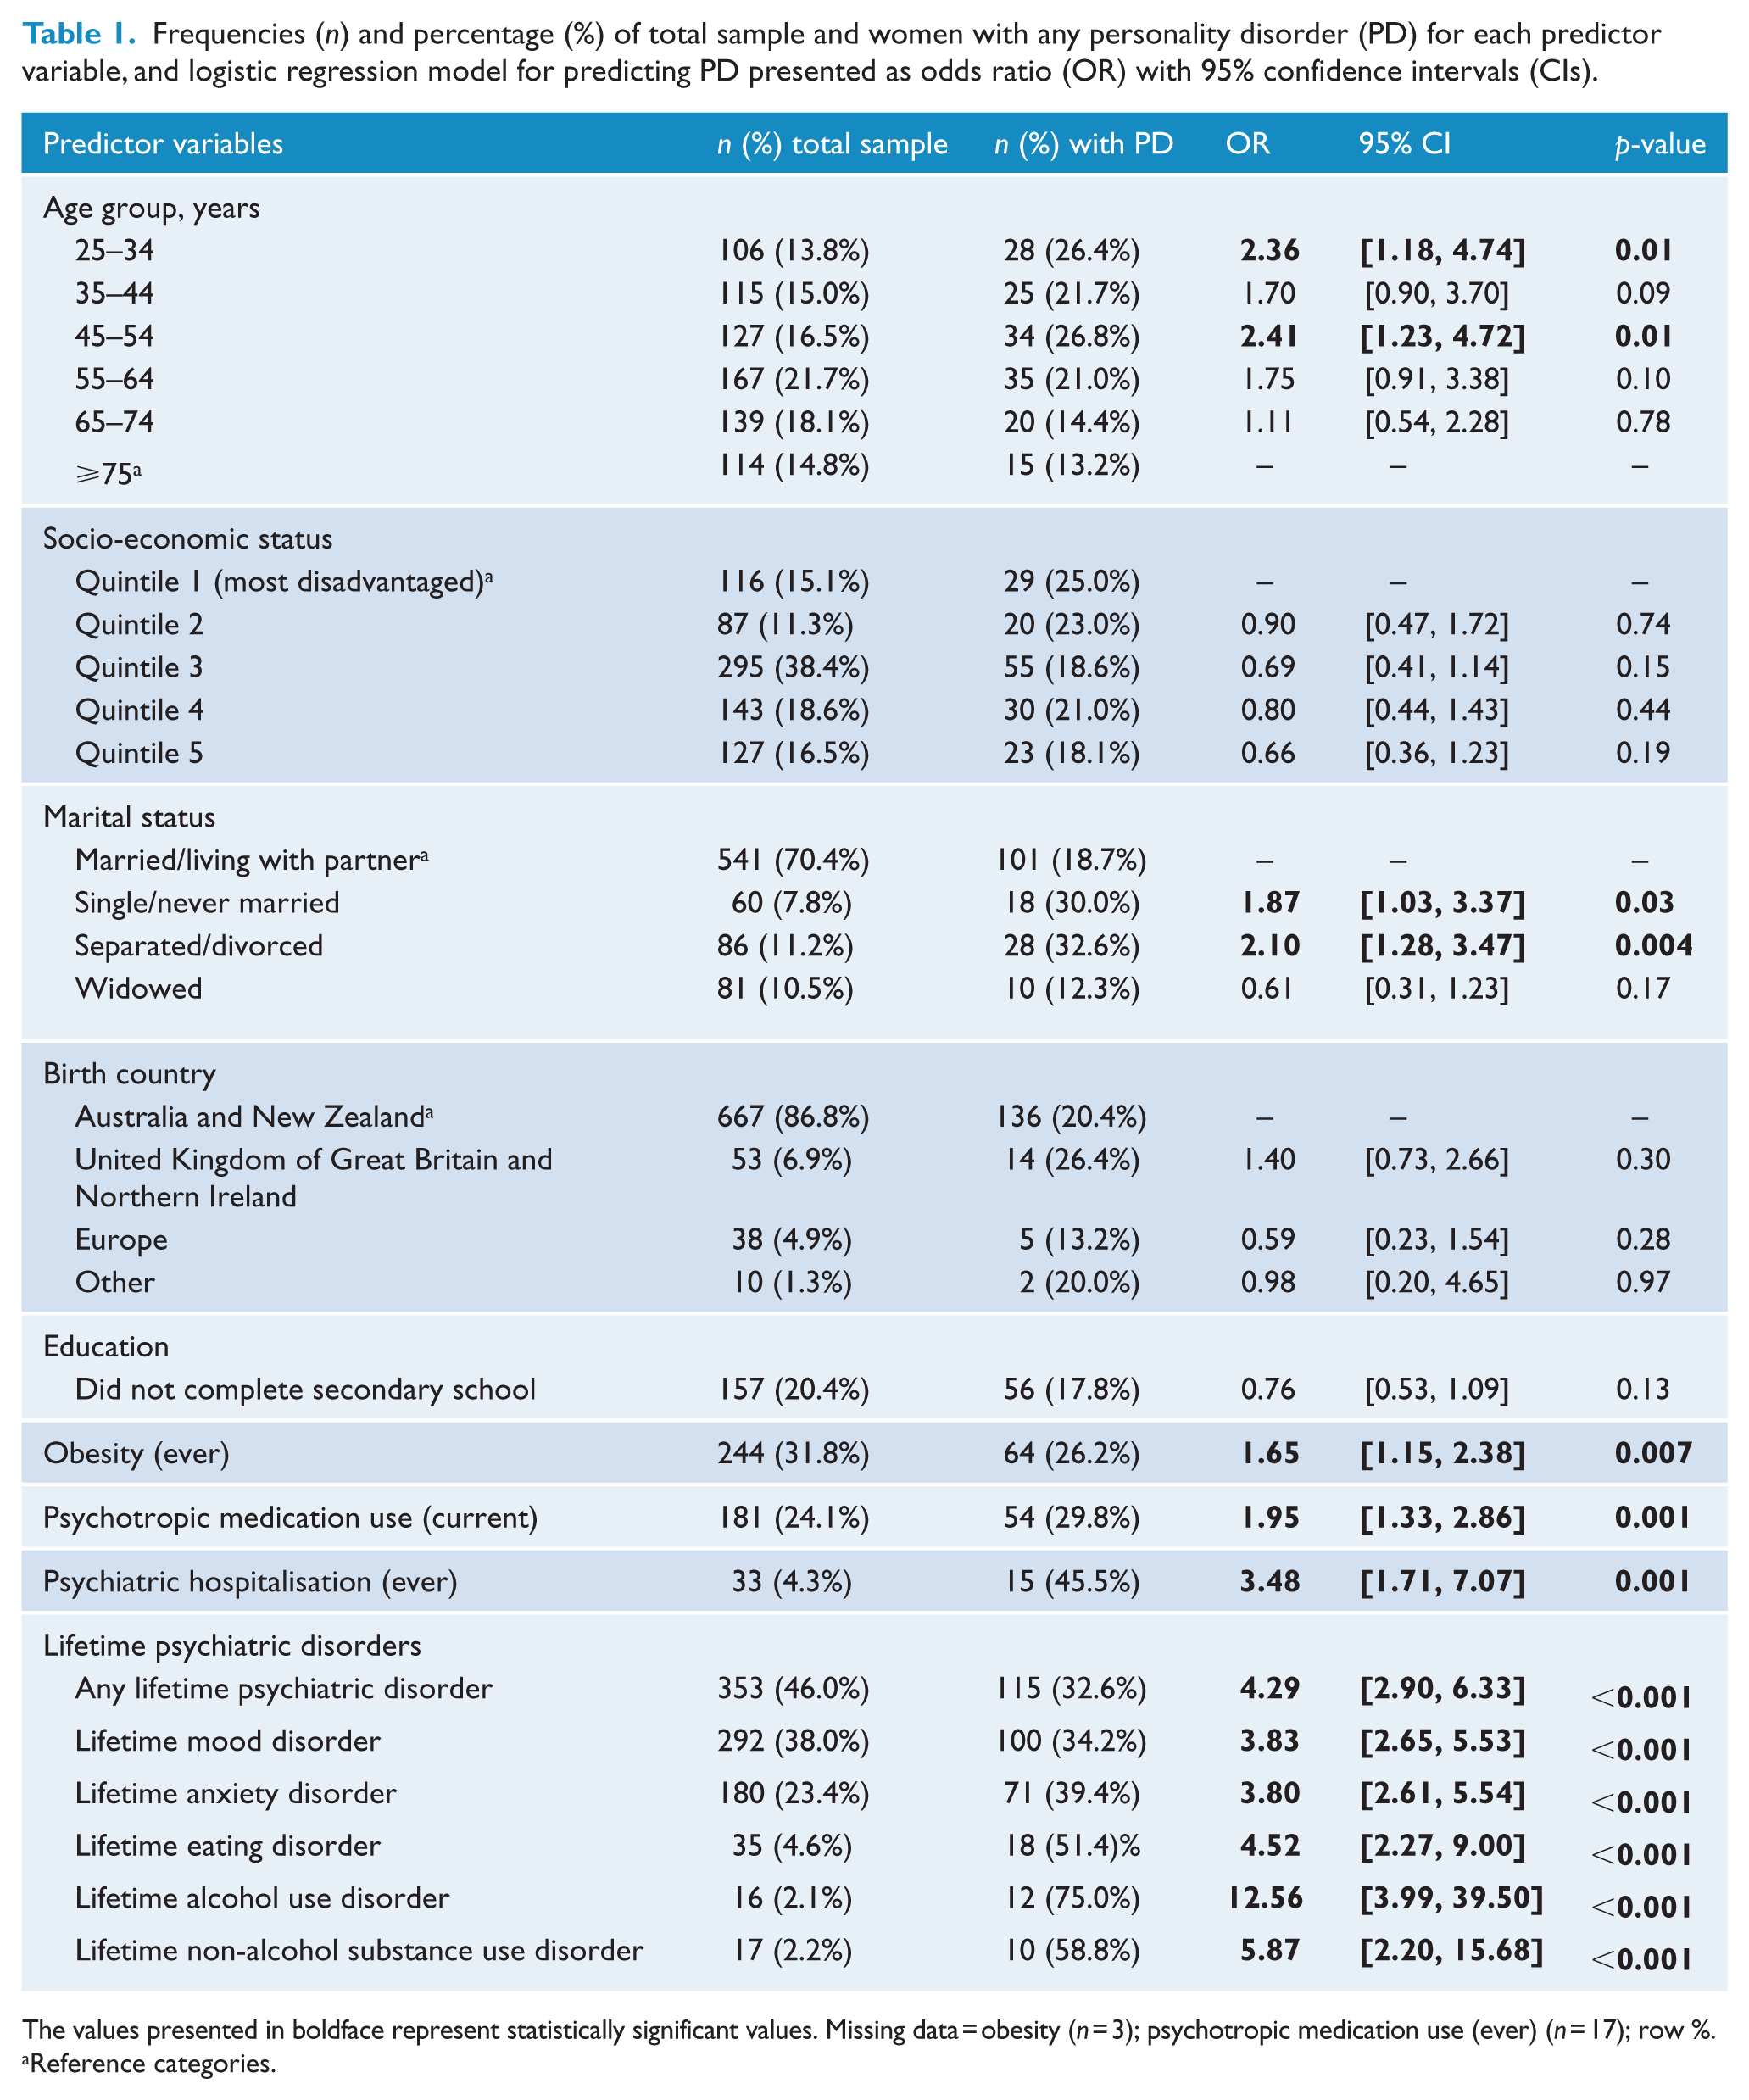
The values presented in boldface represent statistically significant values. Missing data = obesity (n = 3); psychotropic medication use (ever) (n = 17); row %.
Reference categories.
After standardisation, the overall prevalence of any PD in Australian women was 21.8% (95% CI = [18.7, 24.9]) (Figure 1). Cluster C PDs were the most prevalent with 17.5% (95% CI = [16.0, 18.9]), followed by Cluster A with 5.3% (95% CI = [3.5, 7.0]) then Cluster B with 3.2% (95% CI = [1.8, 4.6]). Of the individual PDs, obsessive-compulsive and avoidant PDs were the most common with 10.3% (95% CI = [8.0, 12.6]) and 9.3% (95% CI = [7.1, 11.4]) meeting criteria, respectively, followed by paranoid 3.9% (95% CI = [3.1, 4.7]), borderline 2.7% (95% CI = [1.4, 4.0]), schizotypal 1.7% (95% CI = [0.7, 2.7]), schizoid 1.0% (95% CI = [0.2, 1.7]) and dependent 0.8% (95% CI = [0.16, 1.3]). We detected too few cases of narcissistic (n = 4) and antisocial (n = 1) PDs to calculate standardised prevalence estimates for these individual categories, and there were no cases of histrionic PD.
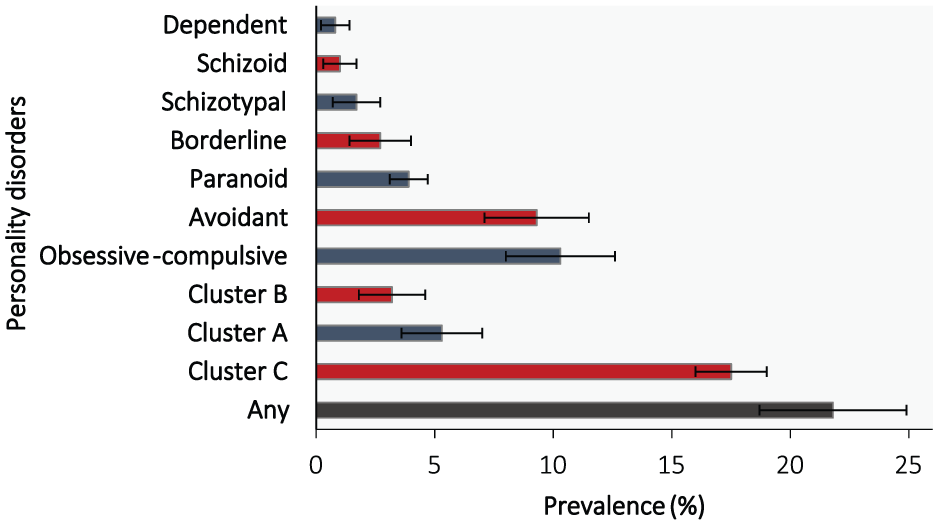
Prevalence of personality disorders standardised to Australian population (2011) (error bars represent 95% CI).
Frequencies of co-occurring PDs according to individual PD categories are presented in Table 2. Furthermore, of those identified with any PD (n = 157), 73.2% (n = 115) reported a lifetime history of psychiatric disorders. Mood disorders were the most prevalent comorbidity (63.7%; n = 100), followed by anxiety disorders (45.2%; n = 71). Other comorbidities reported by those with a PD included eating (11.5%; n = 18), alcohol use (7.6%; n = 12) and non-alcohol substance use (6.4%; n = 10) disorders.
Frequency of co-occurring personality disorders (PDs) according to individual PD categories.
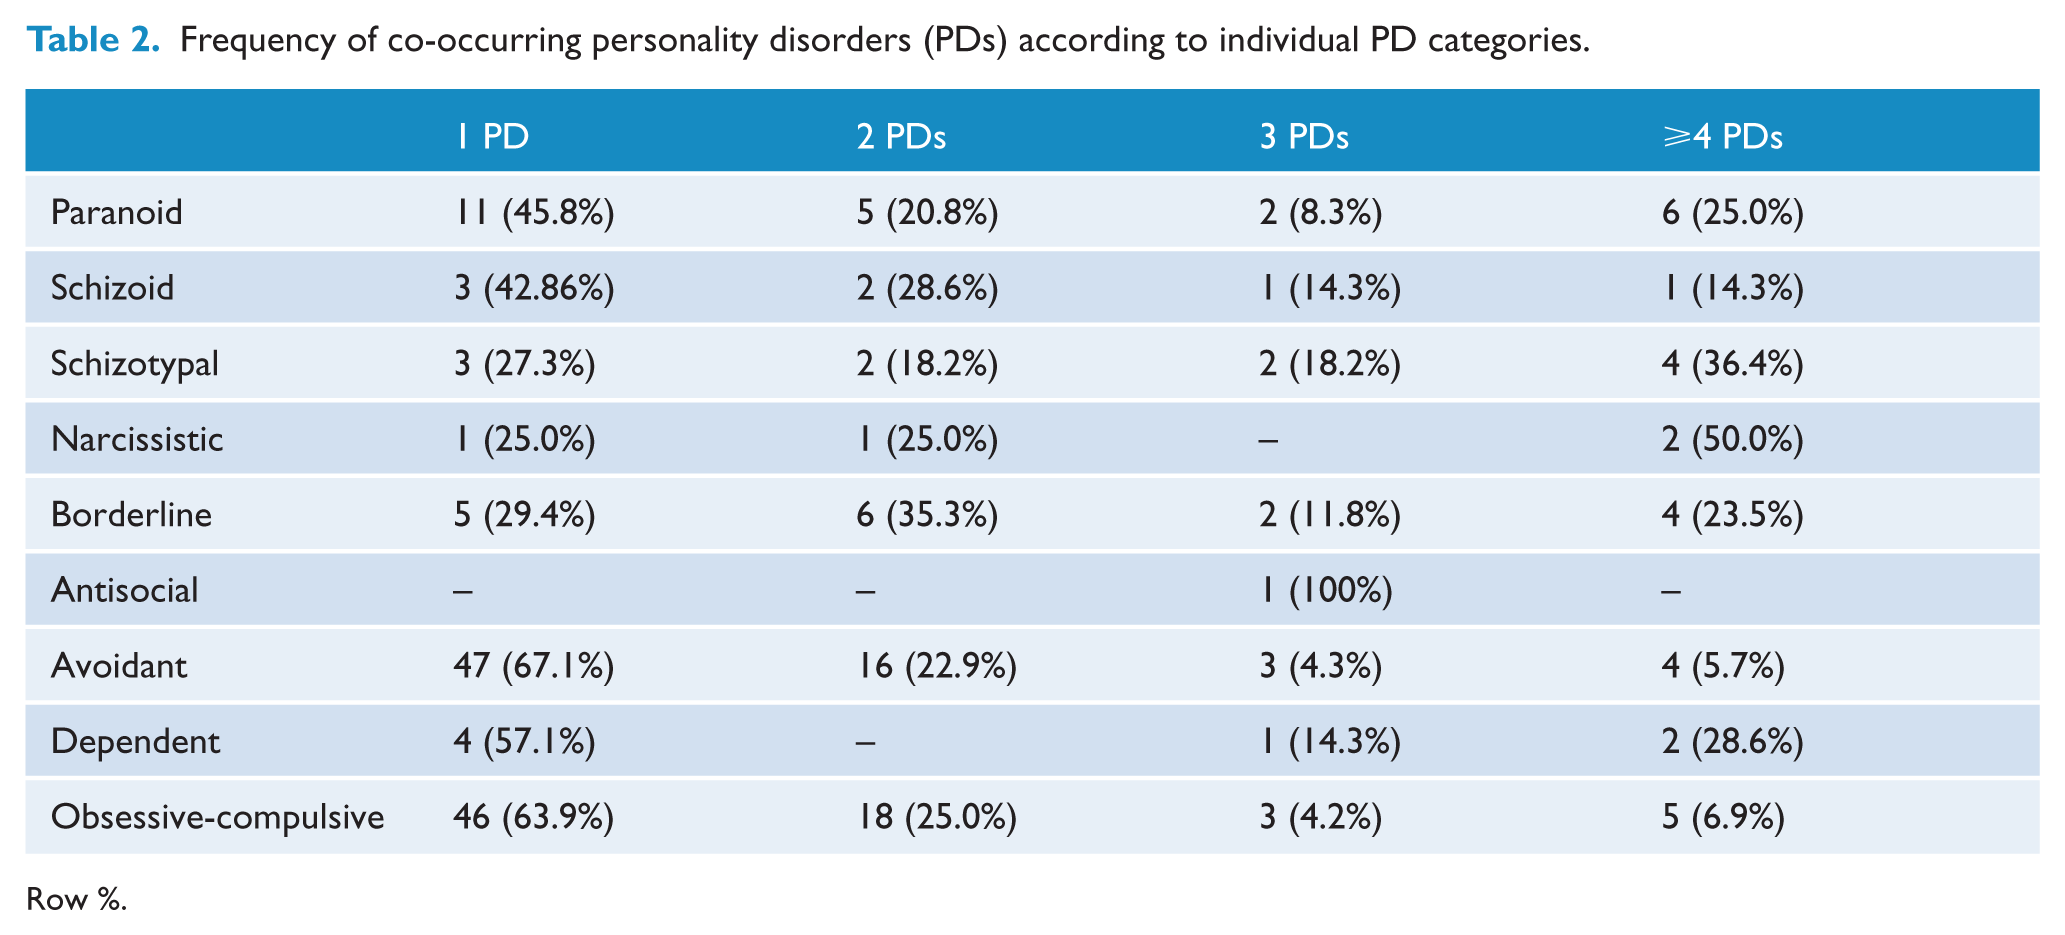
Row %.
Discussion
This study provides information regarding the prevalence, age distribution and comorbidity associated with PDs in a population-based sample of women. The key findings to emerge from these data were (1) approximately one in five women were estimated to have a PD, (2) PDs were most prevalent among the younger and middle-aged groups and (3) mood and anxiety disorders were the most prevalent comorbid lifetime psychiatric disorders among those with PDs as well as other co-occurring PDs. These data highlight that PDs are relatively common among the general population, and that there is a significant burden of associated psychiatric comorbidity.
Data from US population-based studies utilising semi-structured clinical interviews also suggest that the prevalence of PDs ranges between 9.0% and 21.5% (Grant et al., 2004, 2008; Pulay et al., 2009; Stinson et al., 2008; Trull et al., 2010). The National Epidemiologic Survey on Alcohol and Related Conditions (NESARC) (n = 43,093; ⩾18 years) yielded a prevalence of 21.5% (pooled from two cross-sectional Waves) using the Alcohol Use Disorder and Associated Disability Schedule-IV (Grant et al., 2004, 2008; Pulay et al., 2009; Stinson et al., 2008), although this was substantially reduced (9.0%) when more stringent criteria for PD was utilised (Trull et al., 2010). The National Comorbidity Survey–Replicated (NSC-R) screened population-based respondents using the IPDE screener and interviewed a probability sub-sample (n = 214) with a semi-structured clinical interview yielding a prevalence of 9.1% for any PD (Lenzenweger et al., 2007). In a series of semi-structured clinical interviews administered as part of the longitudinal Children in the Community study, the cumulative prevalence of PD had reached 28% in adults by mean age of 33 years (14.6% mean age 14 years, 18.1% 16 years, 22 years 25.7%) (Johnson et al., 2008). In Norway, a household survey of respondents recruited from the National Register Oslo (n = 3,590; 18–65 years) yielded a prevalence of 13.4% for any PD using the Structured Clinical Interview for DSM-III-R Personality Disorders that was administered by experienced health care providers (Torgersen et al., 2001).
Considerably lower prevalence estimates have also been reported. The household survey of United Kingdom (UK) of Great Britain (England, Wales and Scotland) reported a prevalence of 4.4% (3.4% for women only) in a sample of 628 men and women aged 16–65 years, using the same diagnostic tool as was utilised in the current study (Coid et al., 2006). Our prevalence data are also markedly higher than previous studies utilising screening instruments (Huang et al., 2009; Jackson and Burgess, 2000), with the heterogeneity among instruments and interviewers likely to explain some of the variation in prevalence reported. The higher prevalence of less severe forms of PD such as obsessive-compulsive PD and the lower prevalence of more severe forms of PD that were detected in the current study might be another reason for the discrepancies.
Individual PDs
Consistent with the studies from the United States, the United Kingdom and Norway, Cluster C PDs were more prevalent, than Clusters A or B PDs (Coid et al., 2006; Lenzenweger et al., 2007; Torgersen et al., 2001). Specifically, our data are concordant with prior studies that have demonstrated that obsessive-compulsive and avoidant are the most prevalent PDs among women in the general population (Grant et al., 2004; Jackson and Burgess, 2000; Torgersen et al., 2001; Trull et al., 2010). In fact, the overall prevalence of PDs in the current study was largely attributable to cases of obsessive-compulsive PD (10.3%). Clinically-based data also indicate that obsessive-compulsive, avoidant and borderline PDs are among the most common PDs in psychiatric patients receiving treatment (Zimmerman et al., 2005).
Prior studies have reported that the prevalence of obsessive-compulsive PD among women ranges between 1.3% and 7.9% (Coid et al., 2006; Grant et al., 2004; Jackson and Burgess, 2000). Given the nature of obsessive-compulsive PD, continued participation in research studies such as the GOS, might be expected and might account for the overrepresentation of this PD in the current study. Furthermore, obsessive-compulsive PD features have been shown to be more stable over time compared with other PDs and mental state disorders such as MDD (Grilo et al., 2004). Inconsistent associations between obsessive-compulsive PD and disability have been previously reported (Grant et al., 2004), suggesting that both higher and lower functioning individuals with this disorder can meet threshold criteria. Clinically-based data also indicate that while patients with obsessive-compulsive PD show little improvement over time on measures of psychosocial functioning, these patients suffered less impairment compared with other PDs (Skodol et al., 2005).
In contrast, borderline PD is considered a severe form of PD, which was found to be similar (2.7%) to what has been previously reported. A prior examination of PD in an Australian population-based study of younger adults (n = 1520; mean age 24.1 years) indicated the prevalence of borderline PD (assessed using the International Classification of Diseases [ICD-10] version of the Standardised Assessment Personality) was 3.5% (n = 1145; any PD 18.6%), with more young women being identified than young men (Moran et al., 2006).
Avoidant PD was more prevalent in our study than the previously reported range of 0.7–2.76% (Coid et al., 2006; Grant et al., 2004; Jackson and Burgess, 2000). One possible explanation might be associated with the central feature of this disorder being ‘a desire to be accepted, despite hypersensitivities to rejection’ (American Psychiatric Association, 2013). Most of the participants enrolled in the GOS have participated in numerous follow-up appointments, thereby potentially reducing perceived potential dangers or threats. Furthermore, given the high comorbidity and criterion overlap between avoidant PD and anxiety disorders, in particular social phobia, it is possible that some cases of avoidant PD might have been better accounted for by social phobia. On the whole, it remains likely that Cluster C PD features such as a desire to please and perfectionism might drive higher rates of retention in a long-term cohort study. On the other hand, high impulsivity and related Cluster B features might result in low retention in this study, providing a falsely low prevalence. For example, in the current study, fewer individuals with avoidant or obsessive-compulsive PDs had more than one co-occurring PD, indicating that PD comorbidity might be a driver of severity (Tyrer and Johnson, 1996), thus potentially influencing participation. It is also likely that the low prevalence of antisocial PD in the current study is due to sex differences, with other studies reporting the prevalence of antisocial PD being higher among men (Lenzenweger et al., 2006).
Cluster A PDs were the next most prevalent as a group, with paranoid PD being the most common in this Cluster (5.3%). This pattern was similarly reported in the NSC-R (Lenzenweger et al., 2007), Great Britain Household Survey (Coid et al., 2006) and the NESARC (Grant et al., 2004); however, our study reported higher prevalence for each PD Cluster. Still, consistent with these prior studies, the prevalence of the remaining individual PDs in the current study was low (all ⩽1.7%). While Cluster A PDs have been shown to be more prevalent than Cluster B PDs, the latter have received greater attention, and Cluster A PDs remain relatively under-studied in general population settings.
Age distribution
In the present study, a higher proportion of PDs were observed among the younger age group as well as the middle-aged group. Prior studies have also reported that those with PD tend to be younger (Coid et al., 2006; Jackson and Burgess, 2000; Torgersen et al., 2001). Until recently, there have been few studies examining the prevalence of PD across the full adult lifespan. Data from the NESARC reported age-stratified prevalence for PDs among adults aged 55 years and over (women: 16.1% 55–64 years; 11.6% 65–74 years; 9.4% 75–84 years, 8.7% 85+ years) (Reynolds et al., 2015).
The features characteristic of Cluster B PDs, such as symptoms and behaviours associated with impulsivity and affective instability, have been shown to be particularly characteristic among younger adults (Zanarini et al., 2008) and are susceptible to a fluctuating course (Gunderson et al., 2011; Zanarini et al., 2008, 2012), suggesting ‘burn out’ of these behavioural features over time. A number of studies have further highlighted the clinical differences between the presentation of symptoms among younger adults who present with borderline PD including impulsivity, affective instability and increased severity of symptoms being associated with younger age (Yang et al., 2010; Zanarini et al., 2008); in contrast, older adults appear more likely to experience chronic emptiness, and reduced features of impulsivity and affective instability (Morgan et al., 2013). Other clinically-based studies indicate that Cluster C PD features are more enduring (Durbin and Klein, 2006; Ferro et al., 1998; Grilo et al., 2004).
A higher proportion of women aged 45–54 years were also more likely to have any PD in the current study. Developmentally, there are many domains that might be related to personality pathology among women in this age group, including physical health, social relationships and major life experiences (Oltmanns and Balsis, 2011). Finally, increasing age is a known risk factor for poorer physical functioning and physical morbidity. Physical health problems and psychiatric comorbidity are also commonly reported among older adults (El-Gabalawy et al., 2011). It is possible that the higher prevalence of PD observed in the current sample, might be associated with poorer physical health status. Currently, one can only speculate upon the developmental trajectory of PD across lifespan from the current cross-sectional data, with longitudinal analyses needed to investigate age-related patterns as they emerge from adolescence through to middle and older adulthood.
Lifetime comorbidities
Among those with any PD, the lifetime comorbidity with any mental state disorder in the present study was 73.3%, concordant with prior Australian data reporting 40.9–77.8% (Jackson and Burgess, 2002). We identified mood (63.7%) and anxiety disorders (45.2%) as the most common comorbidity disorders, being consistent with previous clinically-based (Zimmerman et al., 2005) and population-based data (Jackson and Burgess, 2000). We also reported comorbid alcohol and other non-alcohol substance use disorders (7.7% and 6.4%, respectively). According to the clinically-based US Collaborative Longitudinal Personality Disorders Study, up to 85% of those with PDs are reported to suffer from mood disorders, particularly recurrent MDD (Gunderson et al., 2008). Conversely, the clinically-based (n = 391 outpatients) Rhode Island Methods to Improve Diagnostic Assessment and Services study (Zimmerman et al., 2005) reported that 31.4% of the patients with mood disorders and other psychiatric conditions had at least one PD.
In the current study, those with PD also reported a markedly higher proportion of comorbid lifetime eating disorders compared with those without PD (11.5% vs 2.8%). In comparison with other psychiatric disorders, the investigation of comorbid eating disorders has received less attention. Interestingly, a study examining consecutive patients receiving treatment for eating disorders (n = 545, ages 18–54 years) found that certain PD features were more common among specific sub-types of eating disorders than others (Godt, 2008). Godt (2008) found that Cluster B PDs were more common (15.1%) among those with bulimia nervosa–purging type, Cluster C PDs more common (28.6%) among those with bulimia nervosa–non-purging-type, whereas the prevalence of Cluster A PDs was relatively low (⩽2.3%) across all sub-types of eating disorders.
Socio-demographic correlates
Consistent with several population-based studies (Coid et al., 2006; Huang et al., 2009; Jackson and Burgess, 2000; Torgersen et al., 2001), being single/never married or separated/divorced was predictive of having any PD. They also tended to be more socially disadvantaged (not significant). Others have reported that those with PD are particularly likely to be living in urban areas (Coid et al., 2006; Torgersen et al., 2001), face unemployment and have lower levels of educational attainment (Coid et al., 2006; Jackson and Burgess, 2000; Torgersen et al., 2001).
Strengths and limitations
A major strength of the current study is the comprehensive psychiatric assessments that were used to identify PDs and psychiatric comorbidities. Additionally, we investigated a random, age-stratified, population-based sample, spanning the full adult age range. We also utilised a robust measure of relative advantage and disadvantage (IRSAD) that extends prior studies that have relied on self-reported information alone to measure socio-economic status. However, it is possible that a response bias may exist, given the higher proportion of PDs observed in quintiles 1 and 2. As such, the current study provides a valuable contribution to the literature given the paucity of good quality epidemiological data derived from the general Australian population.
There are also potentially important limitations to consider when interpreting our data. First, the psychiatric profile of GOS non-respondents may have differed from responders. Also, we cannot exclude the possibility of differential loss to follow-up, in relation to PDs, over the course of the study. The reduced sample for which complete psychiatric data were available may have further introduced bias. Our sample might also differ from the underlying population in terms of patterns of migration and cultural diversity. Given that there is a paucity of prior data collected utilising the same assessment tool, comparisons of our data with other populations in Australia should be made with caution. Furthermore, we cannot rule out that both recall and information bias were introduced when administering the semi-structured clinical interviews, despite strict adherence to protocols. Moreover, precision of the overall prevalence estimates, particularly among less frequent PDs as well as predictor variables with smaller frequencies, must be interpreted with caution. The current study only provided prevalence estimates for categorical diagnoses (i.e. the assessment of specific personality types); it is acknowledged that this does not provide a complete picture regarding the dimensions or levels of PD severity in our study (Tyrer and Johnson, 1996). Therefore, caution should be exercised when interpreting our findings and anticipating the future health care needs of individuals with PD with varying levels of symptom severity. While we provided a comprehensive assessment of psychiatric disorders, psychotic and cognitive disorders were not assessed. Finally, these data are cross-sectional, thereby precluding examination of the longitudinal trajectory of PD.
Future directions and conclusions
First, complementary data are needed regarding the prevalence of PD among Australian men. Second, further investigations are warranted regarding associations between PDs with mental state disorders, particularly eating disorders, where there are few data. There also remains a need for more in-depth investigations into the socio-economic profile of PD among both women and men, in order to further identity sub-groups of the population who might be at risk of PD, and also to understand the needs of those with PD living with social disadvantage. Finally, we suggest that further investigations are required regarding the associated disability among those with PD in the general Australian population, as well as psychiatric and physical comorbidities and associated help-seeking behaviours, in order to address needs for therapeutic intervention (Quirk et al., 2015), which will be explored in separate analyses. In conclusion, these data emphasise that PDs are relatively common among the Australian population, and provide much needed epidemiological data that might inform and guide public health planning and delivery of services.
Footnotes
Acknowledgements
The authors’ acknowledge the research personnel and participants of the Geelong Osteoporosis Study.
Declaration of Conflicting Interests
The author(s) declared no potential conflicts of interest with respect to the research, authorship and/or publication of this article.
Funding
The author(s) disclosed receipt of the following financial support for the research, authorship, and/or publication of this article: The Geelong Osteoporosis Study is funded by the National Health and Medical Research Council (NHMRC of Australia, projects 454356 and 628582) and the Victorian Health Promotion Foundation. S.E.Q. was supported by a NHMRC Public Health and Health Services Research Postgraduate Scholarship (GNT1076347) and is currently supported by a Deakin University Health Research Postdoctoral Fellowship. M.B. has received Grant/Research Support from the National Institute of Health (USA), Simons Foundation, CRC for Mental Health, Stanley Medical Research Institute, Medical Benefits Fund, NHMRC, Beyond Blue, Geelong Medical Research Foundation, Bristol Myers Squibb, Eli Lilly, Glaxo SmithKline, Organon, Novartis, Mayne Pharma, Servier and Astra Zeneca. He has been a paid consultant for Astra Zeneca, Bristol Myers Squibb, Eli Lilly, Glaxo SmithKline, Janssen Cilag, Lundbeck and Pfizer; a paid speaker for Astra Zeneca, Bristol Myers Squibb, Eli Lilly, Glaxo SmithKline, Janssen Cilag, Lundbeck, Organon, Pfizer, Sanofi Synthelabo, Solvay and Wyeth; and is supported by a NHMRC Senior Principal Research Fellowship (GNT1059660). J.A.P. has received grants from the NHMRC, BUPA Foundation, Deakin University, Barwon Health and the Western Alliance Academic Health Science Centre. S.L.B.-O. has received Grant/Research support from The University of Melbourne, Deakin University, an Alfred Deakin Postdoctoral Research Fellowship, has received speaker fees from Amgen (2015) and is currently supported by a NHMRC Career Development Fellowship (GNT1107510). A.M.C. has received research funding from the NHMRC, Australian Research Council (ARC), Colonial Foundation, The University of Melbourne, Melbourne Health and the New South Wales Department of Health. H.J.J. has received funding from NHMRC, ARC, University of Melbourne, Beyond Blue and Australian Rotary Health. C.A.O. was supported by an ARC Senior Research Fellowship (DORA: DP130101459). L.J.W. has received Grant/Research support from Eli Lilly, Pfizer, The University of Melbourne, Deakin University and the NHMRC, and is supported by a NHMRC Career Development Fellowship (GNT1064272).