
Abstract
Background:
Diabetes, obesity and metabolic syndrome are highly prevalent in patients with severe mental illness and can impose a major physical health burden.
Objective:
To determine how anthropometric and metabolic features changed over time in a retrospective cohort of people with Severe Mental Illness living in Cheshire, UK.
Methods:
In all, 1307 individuals on the severe mental illness Register were followed up between 2002 and 2012 in UK general practice. Subjects were identified through a pseudanonymised search of general practice registers.
Results:
Baseline body mass index was 28.6 kg/m2 increasing to 31.0 at 10-year follow-up (r2 = 0.84; p = 0.0002). There was a significant increase in fasting blood glucose from 5.72 to 6.79 mmol/L (r2 = 0.48; p = 0.026). Correspondingly, there was a strong positive univariate relation between increase in body mass index and fasting blood glucose (r2 = 0.54; p < 0.0001) taking into account all measurements. Fasting blood glucose also increased slightly with age (p = 0.028). With increasing use of statins, total cholesterol fell from 4.5 to 3.9 mmol/L (r2 = 0.88; p = 0.0001), as did low-density lipoprotein cholesterol from 3.43 to 2.35 mmol/L (r2 = 0.94; p = 0.0001). In multivariate models, adjusting for age, gender, smoking and blood pressure, each unit increase in body mass index (odds ratio = 1.07 [1.01, 1.13]; p = 0.031) and triglycerides (odds ratio = 1.28 (1.06, 1.55); p = 0.009) was independently associated with an increased risk of having type 2 diabetes.
Conclusion:
Increasing body mass index relates to increasing rates of dysglycaemia over time. Measures to encourage weight reduction should be key strategies to reduce dysglycaemia rates in severe mental illness. Prescribing statins may have been effective in improving the lipid profile in this group.
Introduction
The main aim of the treatment of schizophrenia and other severe mental illnesses (SMIs) is to control psychotic symptoms and to enable patients to function as normally as possible. However, metabolic abnormalities are commonly associated with treatment and include (1) weight gain (Allison et al., 1999a, 2009; Berken et al., 1984; Kivimäki et al., 2009), (2) impaired glycaemia (Cassidy et al., 1999; Correll et al., 2008; Holt et al., 2010), (3) development of type 2 diabetes (Cassidy et al., 1999; Cohen and Huinink, 2007; De Hert et al., 2009, 2011b), (4) reduced high-density lipoprotein (HDL) cholesterol (Bressington et al., 2013; Mitchell and Hardy, 2013), (5) raised low-density lipoprotein (LDL) cholesterol (Daumit et al., 2008) and (6) raised triglyceride levels (Osborn et al., 2007). The subsequent diabetes, obesity, cardiovascular disease and metabolic syndrome that often develop are highly prevalent in individuals with SMI and can impose a major physical health burden and shortened life expectancy (Crump et al., 2013; De Hert et al., 2009, 2011a; Gardner-Sood et al., 2015).
There is a global epidemic of obesity and type 2 diabetes due to ageing populations, sedentary lifestyles and energy-dense diets. As the background population prevalence of obesity and type 2 diabetes has increased dramatically over the past couple of decades, this increase has similarly been observed in individuals with SMI (Gardner-Sood et al., 2015; Holt and Peveler, 2009; Mitchell et al., 2013). Although schizophrenia is the most studied, the association with obesity, diabetes and related complications has been identified with other mental health disorders (Allison et al., 2009; Brown et al., 2009; Cassidy et al., 1999; De Hert et al., 2011a, 2011b; Holt et al., 2010). This increased prevalence is in part linked to the additional risk factor of obesogenic psychotropic medication used in the treatment of these disorders (Berken et al., 1984; Cohen and Huinink, 2007; Correll et al., 2008).
Previous work in relation to cardiometabolic outcomes has focused largely on schizophrenia and schizoaffective disorder. Our aim was to assess a larger group including individuals with bipolar affective disorder and unipolar depression as described by Osborn et al. (2007) and in a recent seminal paper (Osborn et al., 2015). The sample for follow-up was nearly fully comprehensive across three clinical commissioning group (CCG) areas in Central and Eastern Cheshire, UK, with only three practices not included here.
In the United Kingdom, resources are increasingly being directed towards disease prevention, especially in primary care, and so a greater understanding of the health profile of SMI register individuals is important given that life expectancy is up to 17 years less in the background population in individuals with SMI (Brown, 1997). The aim of the study was to describe how in one area of the United Kingdom, general practice (GP), SMI registers were used to determine how anthropometric and metabolic features changed over time in a cohort of individuals with SMI.
Methods
In this primary care–based study, 1307 individuals on the SMI register (89.1% of the total 1511) were followed up between 2002 and 2012 inclusively. SMI was defined as schizophrenia, schizoaffective disorder, bipolar disorder or severe depression.
All patients were registered with GP practices in Central and Eastern Cheshire, UK. Data search was performed with the permission of Egton Medical Information Systems clinical database (EMISWeb®; EMIS Group, Leeds, UK), the provider of the GP operating system in this area. All individuals included in the initial search were on the SMI Register, defined based on READ codes (Davé and Peterson, 2009). Records were anonymised at the time they were obtained and contained demographic information, medical history (diagnoses), test results and additional health-related data, such as smoking status and drug treatments. The study was performed with the approval of the local Ethics Committee (East Cheshire NHS Trust, UK).
The physical health screen included height and weight measurement, with calculation of body mass index (BMI) (weight [kg]/height2 [m]), along with blood tests for fasting blood glucose (FBG) or random glucose (proceeding to 75 g oral glucose tolerance test if necessary) and lipid profile (total cholesterol, HDL-cholesterol, LDL-cholesterol and triglycerides). Blood pressure (BP) was determined using a validated semi-automatic monitor (Omron HEM-705CP; Omron Healthcare, Kyoto, Japan). Blood glucose and lipid profiles were determined using automated clinical chemistry analysers (Ortho Clinical Diagnostics/Beckman Coulter, High Wycombe, Bucks, UK). All GP practices in Central and Eastern Cheshire use the same laboratory service which utilises linked analysers based in two hospital sites in Crewe and Macclesfield, UK. Data were collected routinely by trained healthcare staff.
The Townsend index of multiple deprivation was examined. Devised by Townsend in 1988 (Townsend, 1987), the index is applied to a postcode area based upon four different variables: (1) percentage of economically active over 16-year-olds, who are unemployed; (2) non-car ownership as a percentage; (3) non-home ownership as a percentage; and (4) household overcrowding. All four variables were standardised using a Z-score and then summed to obtain a single value. Positive values of the Townsend index are associated with geographic areas with high deprivation.
Prescription of agents to modulate BP and lipid levels
This was performed at GP practice level for target BP according to locally agreed guidance of 130/80 mmHg and for target cholesterol and LDL-cholesterol levels of 5.0 and 3.0 mmol/L, respectively.
Statistics
Statistical analyses were performed using Stata version 13.0 (StataCorp, College Station, TX, USA). The data are expressed as arithmetic means and 95% confidence intervals (CIs) for normally distributed data or geometric means (95% CI) for skewed distributions.
Linear and logistic regression analyses were performed using Stata statistical software (Release 13; StataCorp). Random-effects regression models were used to test for associations between FBG levels and respective risk factors. The data are expressed as arithmetic means for phenotype measurements made between 2002 and 2012.
Results
Population characteristics
The major SMI diagnosis group was schizophrenia, schizoaffective disorder or delusional disorder (48.2%), followed by bipolar affective disorder (13.1%) and unipolar depression (38.7%), including psychotic depression (Tables 1 and 2). Women were older on average by 7.3 years. There was no difference in baseline BMI by gender (men: 28.1, 95% CI = [27.6, 28.5]; women: 28.5, 95% CI = [28.0, 29.0]; p = 0.22) or baseline FBG (5.55 mmol/L in men and 5.39 mmol/L in women; p = 0.276). Women were less likely to smoke (50.4% vs 56.7%; p = 0.002). Overall, 53.5% of those studied were current smokers at baseline (Table 1). More than 98.2% of the patients were of White European ethnicity. There was a significant difference in mean Townsend index score between men and women (−0.101 men vs −0.447 women; p = 0.026).
Characteristics of the study population at baseline.
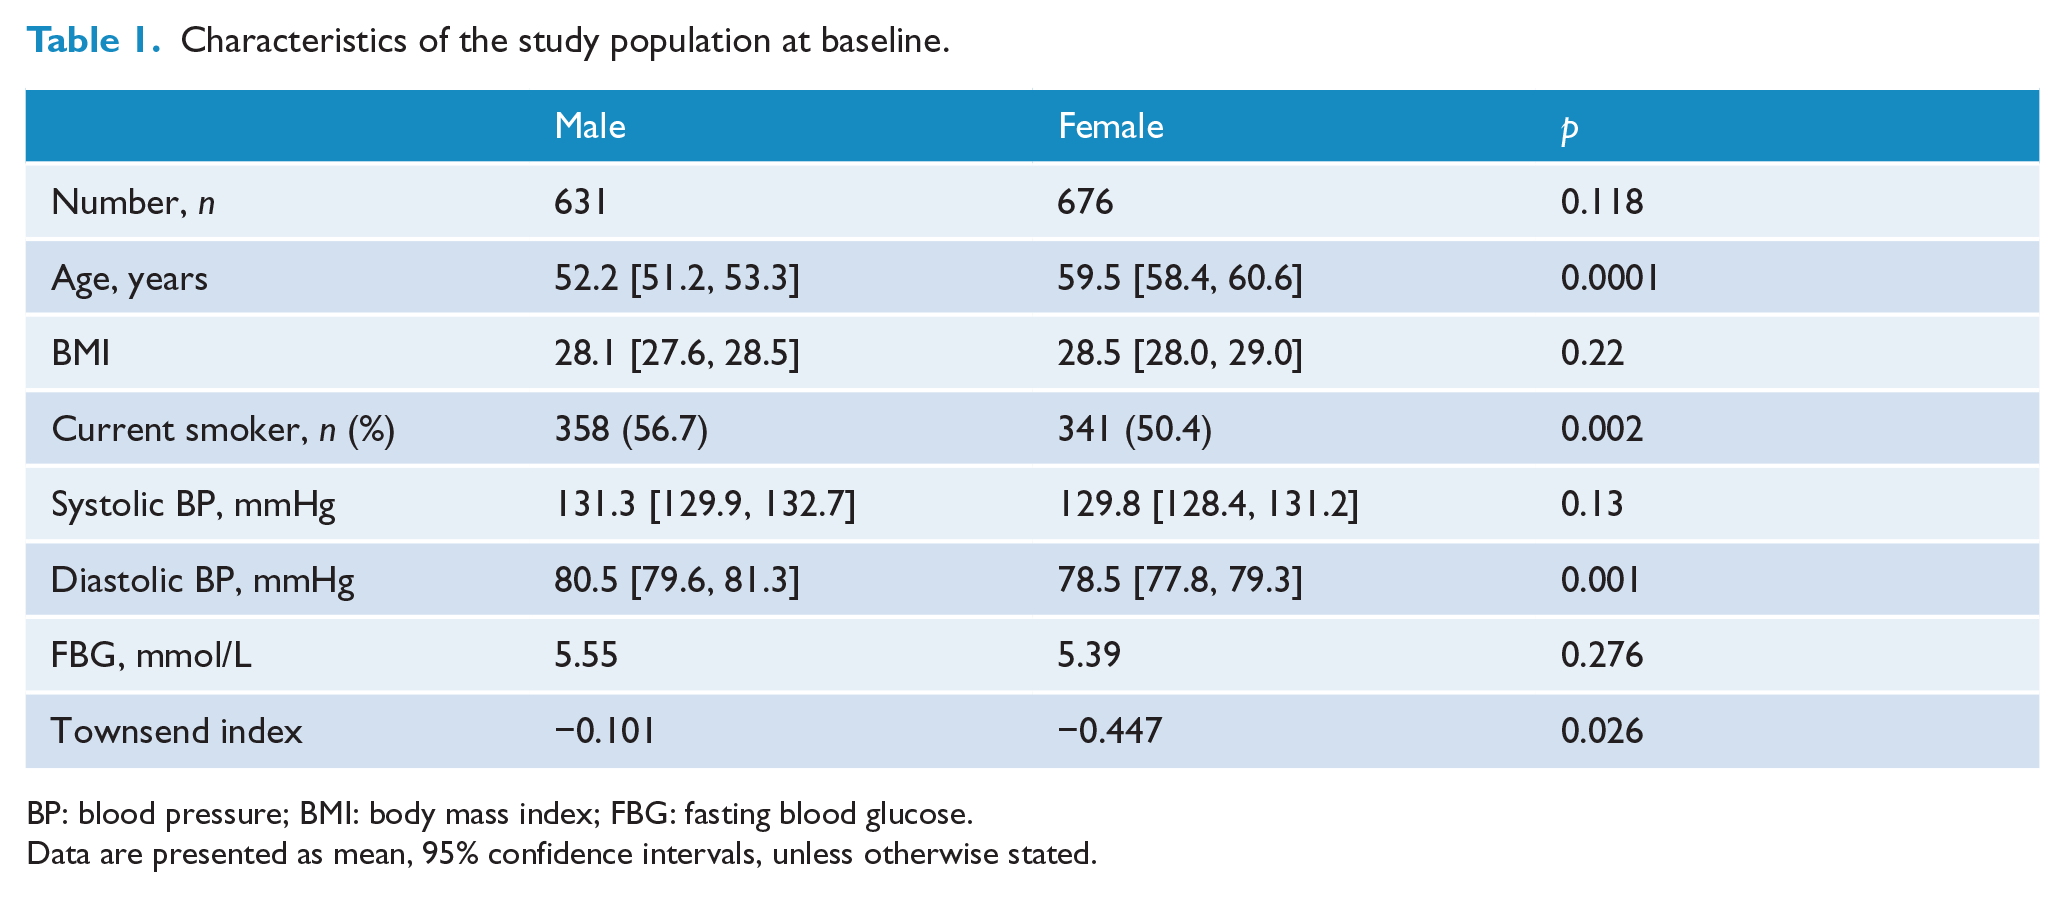
BP: blood pressure; BMI: body mass index; FBG: fasting blood glucose.
Data are presented as mean, 95% confidence intervals, unless otherwise stated.
Characteristics of the study population at conclusion.
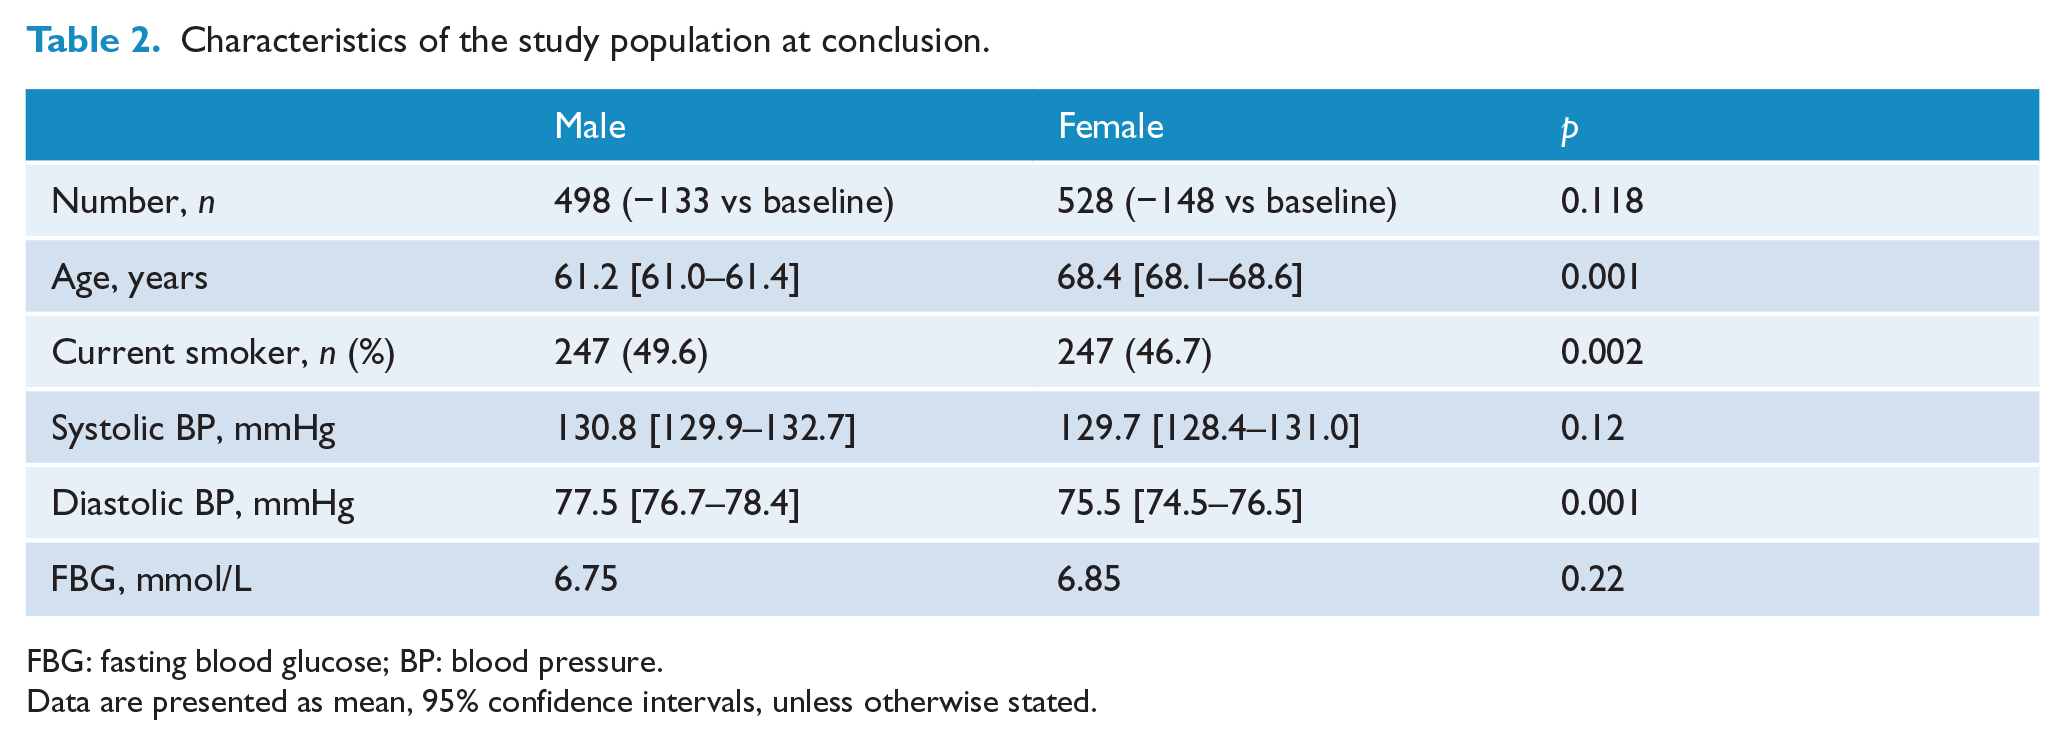
FBG: fasting blood glucose; BP: blood pressure.
Data are presented as mean, 95% confidence intervals, unless otherwise stated.
In 2002, 38.2% (n = 499) of the cohort were prescribed anti-psychotic medication; of these, 67.9% (n = 339) were prescribed an atypical anti-psychotic; 29.1% (n = 145), a typical anti-psychotic; and the remainder, anti-psychotic polypharmacy (3.0%; n = 15). Anti-depressant prescription occurred in 30.6% (n = 430) of the cohort; of these, 53.7% (n = 231) were prescribed a selective serotonin re-uptake inhibitor (SSRI); 20.5% (n = 88), a serotonin and noradrenaline inhibitor (SNRI); and 16.5% (n = 71), a tricyclic antidepressant.
BMI
Over time, there was a significant increase in BMI (Figure 1(a)). Baseline BMI was 28.6 kg/m2, increasing to 31.0 at 10-year follow-up (r2 = 0.84; p = 0.0002). This increase remained significant after adjusting for gender and Townsend index (normalised β = 2.4; p = 0.043).
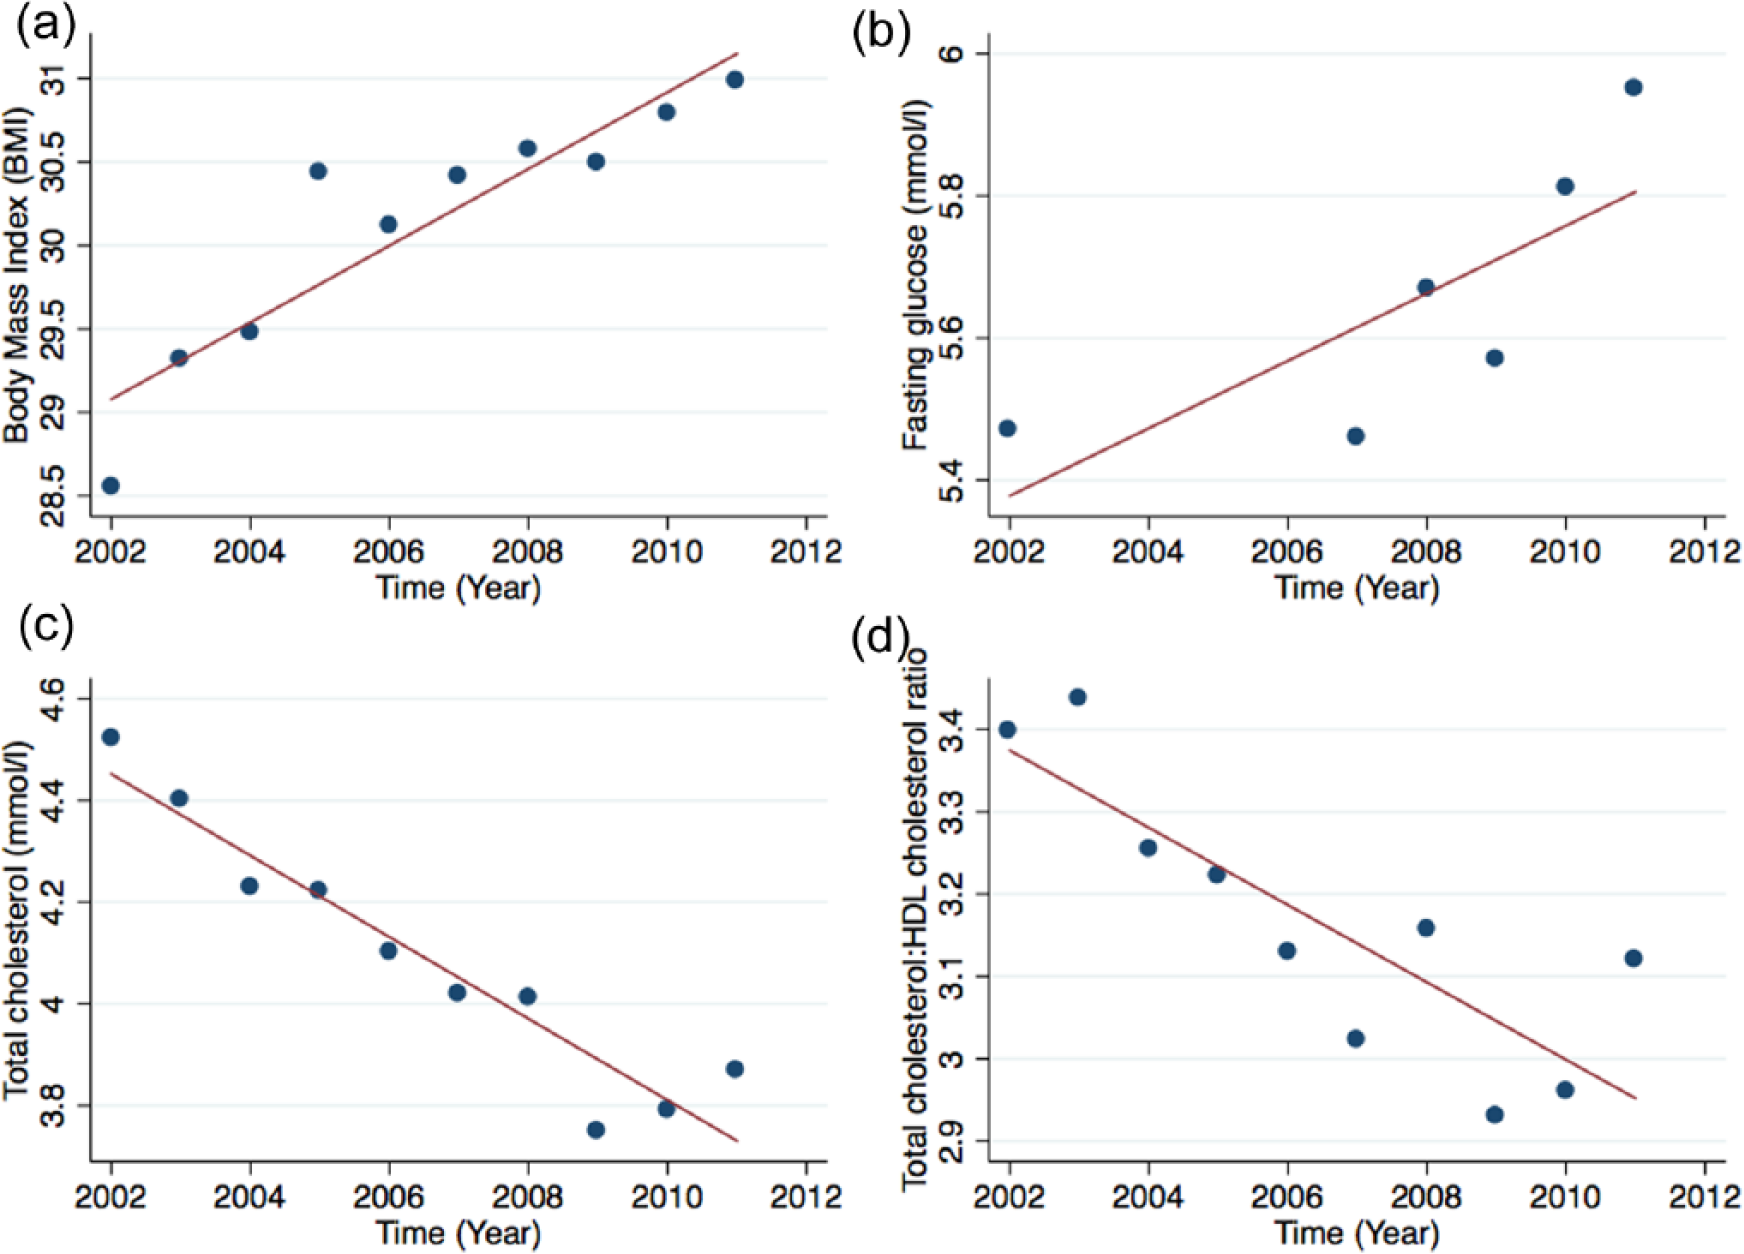
Secular trends in cardiometabolic risk factors for (a) body mass index (BMI; kg/m2), (b) fasting blood glucose (FBG; mmol/L), (c) total cholesterol (mmol/L) and (d) total cholesterol: high-density lipoprotein (HDL) ratio between 2002 and 2012 in patients with severe enduring mental illnesses. Trends in mean BMI (r2 = 0.84; p = 0.0002), FBG levels (r2 = 0.48; p = 0.026), total cholesterol (r2 = 0.94; p < 0.0001) and total cholesterol:HDL ratio (r2 = 0.70; p = 0.003) between 2002 and 2012.
Metabolic results
Over the follow-up period for which most FBG levels were available, there was a significant increase in FBG from 5.7 to 6.8 mmol/L (r2 = 0.48; p = 0.026) (Figure 1(b)). However, this increase did not remain significant after adjusting for gender and Townsend Index (normalised β = 6.16; p = 0.110). There was a strong positive univariate relation between increase in BMI and FBG taking into account all measurements (r2 = 0.54; p < 0.0001) (Figure 2). FBG increased slightly by age (p = 0.028). There was no relation between FBG and the Townsend index.
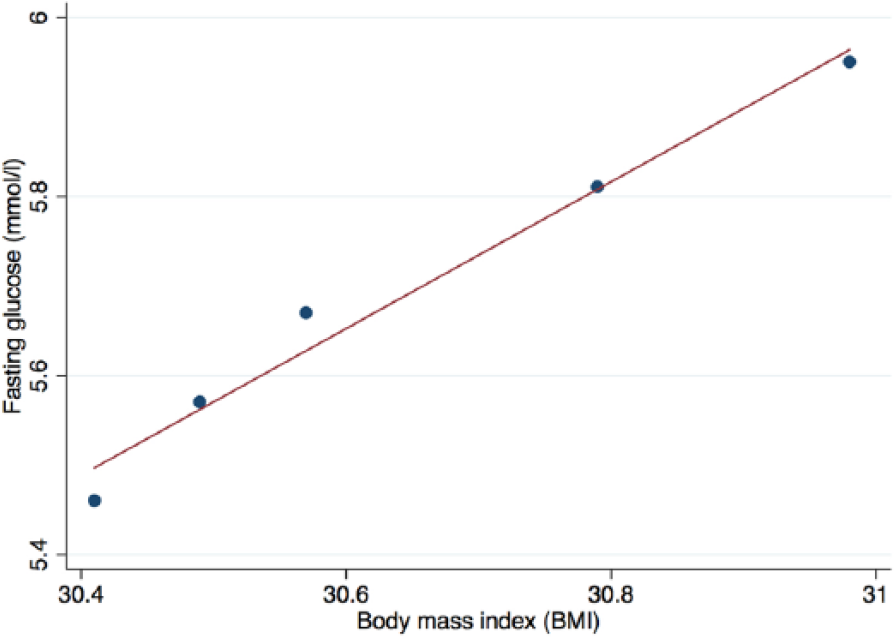
Relation between mean body mass index (BMI) and mean fasting blood glucose.
Mean total cholesterol fell from 4.5 to 3.9 mmol/L (r2 = 0.88; p < 0.0001 (Figure 1(c)). Correspondingly, the proportion of patients with total cholesterol >4 mmol/L fell from 81% to 51%. Mean LDL-cholesterol fell from 3.43 to 2.35 mmol/L (r2 = 0.94; p < 0.0001) during follow-up. Correspondingly, the proportion of patients with LDL-cholesterol >4 mmol/L fell from 81% to 58%. Both reductions remained significant after adjusting for gender and Townsend index (normalised β = −10.67 [p < 0.001] and β = −9.27 [p < 0.001], respectively).
Total cholesterol:HDL cholesterol ratio fell during the follow-up period (r2 = 0.70; p = 0.003; Figure 1(d)). During the period, mean HDL-cholesterol fell from 1.34 to 1.24 mmol/L (r2 = 0.43; p = 0.04). There was no significant change in serum triglyceride levels over time (baseline = 2.08 and 10-year follow-up = 2.37 mmol/L).
BP
At baseline, systolic BP was >140 mmHg in 22.4% of those examined, and diastolic BP was >80 mmHg in 36.5%. Systolic BP did not change significantly over the follow-up period (130 mmHg), but there was a significant fall in diastolic BP from 79.2 to 76.5 mmHg (r2 = 0.88; p = 0.001) (Figure 3). Correspondingly, the proportion with diastolic BP >80 mmHg fell to 29.5%. This fall in diastolic BP did not remain significant after adjusting for gender and Townsend index (normalised β = −1.96; p = 0.061).
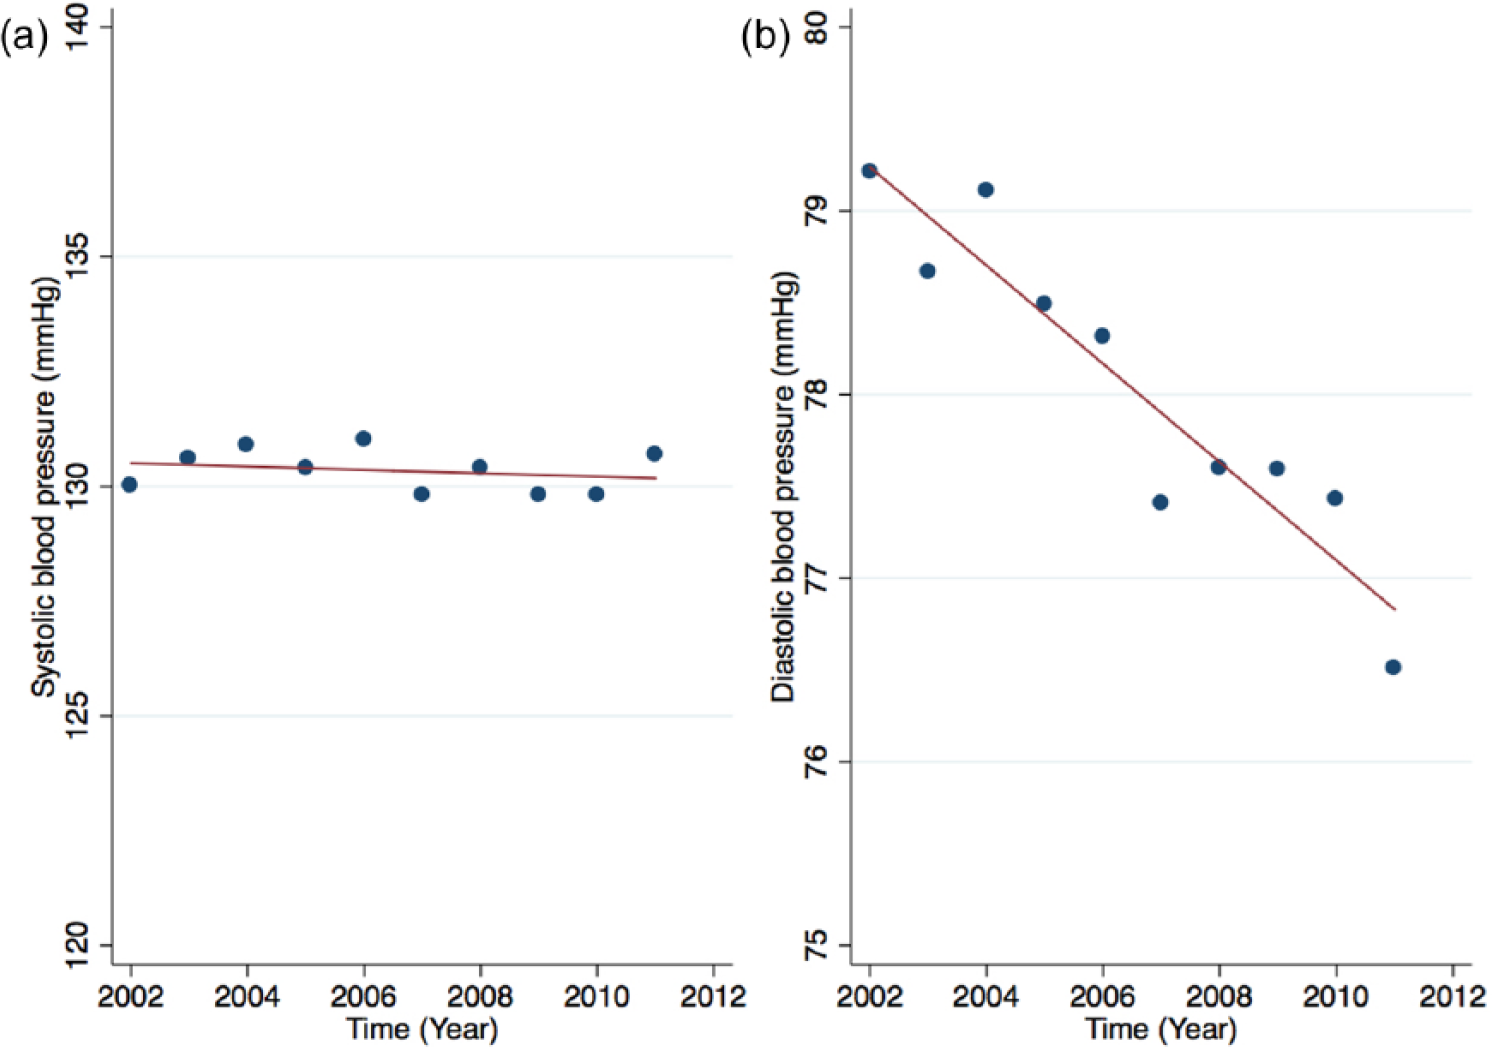
Variation in (a) mean systolic and (b) diastolic blood pressures between 2002 and 2012.
Prescribing anti-hypertensive and lipid-lowering agents
By the end of follow-up, 195 (14.9%) patients had been started de novo on one or more anti-hypertensive agent(s) and 256 (19.6%) patients had been started de novo on lipid-lowering treatment.
Univariate modelling
In univariate logistic regressions, each unit increase in BMI (per kg/m2) was associated with an 8% (3–14%) increased odds of having type 2 diabetes (Table 3). Similar findings were seen with triglyceride levels where each unit increase in mmol/L of serum triglyceride was associated with a 30% (9–56%) increased likelihood of type 2 diabetes. No associations were seen with age, gender, BP, smoking or total cholesterol concentrations.
Univariate logistic regression for odds ratio (OR) of known diabetes.
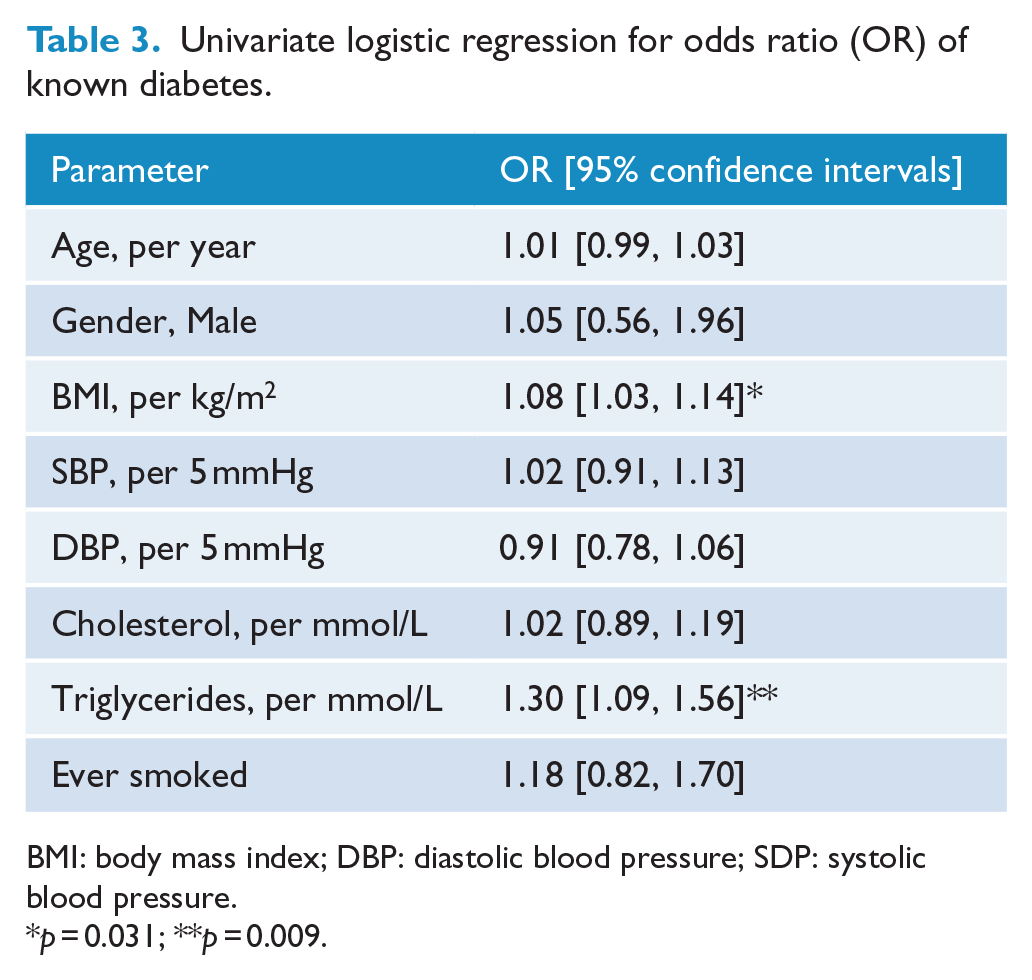
BMI: body mass index; DBP: diastolic blood pressure; SDP: systolic blood pressure.
p = 0.031; **p = 0.009.
Multivariate modelling
Type 2 diabetes as the outcome variable
In a multivariate model, adjusting for age, gender, smoking and BP, each unit increase in BMI and triglycerides was independently associated with an increased risk of having type 2 diabetes independent of age, fasting cholesterol and systolic BP (BMI: OR = 1.07, 95% CI = [1.01, 1.13], p = 0.031; and triglycerides: OR = 1.28, 95% CI = [1.06, 1.55], p = 0.009).
Glucose as the outcome variable
A random-effects regression model revealed a direct independent relation between FBG levels and BMI (β = 0.26; p = 0.001) independent of age (β = 0.07; p = 0.001), sex (β = 0.14; p = 0.131), systolic BP (β = −0.05; p = 0.703), fasting cholesterol (β = −0.02; p = 0.187) and triglycerides (β = 0.21; p = 0.008).
Discussion
Our study demonstrates an independent relation between increasing BMI and blood glucose levels over a 10-year period in individuals with SMI. The increase in blood glucose seen over a 10-year period is significantly higher than that reported in the systematic analysis of global trends in glycaemia reported by Danaei et al. (2011), who described a rise in FBG of between 0.07 and 0.09 mmol/L per decade. Our findings should inform the debate about the positive effect of intervention programmes, particularly lifestyle-focused weight reduction programmes on glycaemia and the incidence of type 2 diabetes in individuals with SMI, with potential benefits in terms of reduction of cardiovascular risk and cardiovascular mortality (Daumit et al., 2008; De Hert et al., 2009; Mitchell et al., 2013; Osborn et al., 2007). While the definition of SMI includes a number of long-term health conditions, all of these are known to predispose to a shortened life expectancy and greater cardiovascular morbidity. Although the average age of patients at baseline was 52 years male and 59 years female, many individuals underwent initial screening in their 30s and 40s.
We acknowledge the assertion that existing studies as described by Danaei et al. (2011) report that BMI and blood glucose levels increase over time in the general population and the absence of a control group here. Nevertheless, the significant changes over a 10-year time period in BMI and glycaemia in a group already at very significantly elevated cardiovascular disease (CVD) risk are of clinical relevance in terms of highlighting the importance of lifestyle intervention in people with SMI.
There was a net reduction in diastolic BP with reduction in total cholesterol and LDL-cholesterol during our study period. Prescribing anti-hypertensive agents and lipid-lowering agents significantly increased over the follow-up period. The latter is in keeping with agreed guidance (Majeed, 2014).
The independent relation over time between increasing BMI and increasing FBG demonstrates a significant interaction between body weight and glycaemia in individuals with SMI. The shortage of safe, effective, prescribable weight-reducing pharmaceutical agents may be a significant factor in the differential outcomes reported for BMI as compared with BP, total and LDL-cholesterol. There are also many barriers to the management of obesity, including lack of motivation on the patient’s part (Mercer and Tessier, 2001) and practice-level factors, such as GPs or practice nurses perceiving a lack of training in obesity management. These may all have contributed to the increasing BMI reported in our cohort over time.
There is much debate about how to model cardiovascular risk in individuals with SMI whose risk of myocardial infarction or stroke is as high as for type 2 diabetes (Crump et al., 2013; Osborn, 2014) as there is some evidence to suggest that traditional risk algorithms, such as the Framingham Risk Score (National Heart, Lung and Blood Institute, 2014), may under-predict the risk in individuals with SMI (McLean et al., 2014). Thanks to the work of Osborn et al. (2015), a validated risk prediction model for SMI, the PRIMROSE model, can now be applied in individuals with this group of conditions.
The prevalence of hypertension in our study was surprisingly low given the high rates of cardiovascular events and death in this group (De Hert et al., 2009, 2011b). The relatively low prevalence of hypertension is likely related to the alpha-1 receptor blocking properties (and therefore BP-lowering effect) of many neuroleptics used currently in the treatment of SMI. The high rates of dysglycaemia found highlight the importance of regular screening for metabolic risk in patients with SMI.
Many experts now advocate annual monitoring for a range of cardiometabolic parameters in SMI patients (American Diabetes Association et al., 2004; Barnett et al., 2007; De Hert et al., 2009; Morrato et al., 2009). This may also include annual monitoring of serum prolactin (Maguire, 2002), renal and liver function, and bone indices, together with an initial check of creatine kinase (with further monitoring if initially raised) in view of the potential for drug-related changes in these important markers of metabolic function.
The potential contribution of anti-psychotic medications to diabetes, obesity and metabolic syndrome cannot be ignored (De Hert et al., 2009; Newcomer, 2005; Smith et al., 2008). The evidence highlights the need for regular metabolic screening in individuals with schizophrenia throughout the chronic course of the illness (National Institute for Health and Care Excellence [NICE], 2014).
The strengths of this study lie in the follow-up of >1000 individuals with SMI residing in the community in the United Kingdom for a 10-year period and the ability to estimate from these data the rate of screening, as well as the proportions of patients screened who had dyslipidaemia and dysglycaemia.
Our study has some limitations: (1) the collated data are from routine practice, and thus, some data are missing, coding imperfections might have occurred, and some measures such as height and weight are not standardised; (2) in these analyses, there is also the absence of precise data on change in neuroleptic dose or drug and the precise timing effects of the introduction of lipid-lowering, anti-hypertensive and anti-diabetic agents, leading to the possibility of unmeasured confounding. The relatively low figure for neuroleptic prescribing that we quote (38.2%) is based on GP pseudonymised data. This is likely to be lower than expected because secondary care prescribing of neuroleptics would not normally show in the primary care prescribing record; (3) the study lacks comparison data from a non-SMI sample; (4) family history, food behaviour and lifestyle factors, including food intake and exercise, are not recorded with sufficient accuracy in the GP summary record to be used for analysis and is a further limitation of our study; (5) finally, we did not have FBG results available for the entire follow-up period, hence the shortened period of follow-up regarding FBG levels.
Continued monitoring, timely introduction of treatment and maintenance of optimal physical health should be adopted as part of a long-term management strategy to improve global outcomes in schizophrenia and other severe long-term mental illnesses. Furthermore, lifestyle intervention has the potential to improve glycaemic profile through weight reduction (Daumit et al., 2013).
On the basis of the results from this and other studies, clinicians should focus on preventing initial weight gain (Allison et al., 1999b) because subsequent long-term weight loss is difficult to achieve, through either behavioural or pharmacological intervention (Marder et al., 2004). Moreover, all patients receiving neuroleptics should undergo routine monitoring of weight and metabolic parameters.
Health education plus quality control, timely integration of information technology (IT) systems and improvement initiatives can potentially make a significant difference to health outcomes (McCreadie et al., 2005). Further evaluation of their impact on long-term cardiometabolic outcomes in patients with schizophrenia and other forms of SMI is required.
Footnotes
Acknowledgements
The authors are grateful to EMIS® (EMIS Group, Leeds, UK) for access to the clinical database. The authors alone are responsible for the content and writing of the paper.
Declaration of Conflicting Interests
The author(s) declared no potential conflicts of interest with respect to the research, authorship and/or publication of this article.
Funding
The author(s) disclosed receipt of the following financial support for the research, authorship, and/or publication of this article: Simon Anderson is an Academic Clinical Lecturer in Cardiology and is funded by the National Institute of Health Research, UK.