
Abstract
Childhood overweight or obesity (hereafter referred to as childhood overweight) currently affects approximately one in four Australian children [1]. The increase in the prevalence of overweight has been accompanied by endeavours to document the burden of obesity on a child's health and well-being. While the physical effects of childhood overweight have been widely documented [2–4], less is known about the psychosocial burden of excess weight in children, and what is known is largely confined to isolated aspects of psychosocial functioning such as low self-esteem, depression or body dissatisfaction. Moreover, not all of these findings concur.
Self-esteem
Some studies have shown overweight children to have lower levels of self-esteem in comparison with healthy weight children [5–10], while other studies have not [11–13]. Differences in age distribution of the samples or methods of measuring self-esteem may have contributed to this discrepancy. The self-esteem of adolescents appears to be more vulnerable to overweight compared to that in young children [10], [14]. Studies that have differentiated between various aspects of self-esteem have concluded that overweight principally affects the domains of self-esteem related to physical appearance and athletic competence [12], [15–17].
Depression
An association between depression and overweight has been noted in samples of overweight children seeking treatment for obesity [18–20] and in population-based studies of children and adolescents [21], [22]. Longitudinal studies suggest that depression in childhood and adolescence may precede the development of overweight more often than the reverse [23], [24].
Social functioning
Williams et al. found lower social functioning on the social subscale of the Paediatric Quality of Life Inventory in overweight Australian primary school children (9–12 years) relative to their healthy weight peers [25]. Studies have also reported a greater prevalence of both global social (in)competence and specific externalizing behaviours (such as aggression) among overweight children [18], [20], [26]. Overweight boys have been found to be at risk of being verbally teased and being victims of physical aggression by peers and overweight girls at risk of relational victimization (i.e. being purposefully excluded from social activities or threatened with withdrawal of one's friendship) [27], [28]. Additionally, overweight adolescents are more likely than their healthy weight peers to be both the victims and perpetrators of bullying [29].
Body dissatisfaction
Body dissatisfaction, the negative evaluation of one's body or body parts [30], is commonly measured using body figure rating scales, as the discrepancy between an individual's perceived body size and the figure they nominate as their ideal body size. While body dissatisfaction is prevalent in healthy weight groups (especially adolescent girls), it has been found to be more widespread in overweight populations [31–33], as are the cognitive and behavioural symptoms of eating disorders, for example increased weight and shape concern and binge eating [34–36].
Present study
While these observations are valuable, none document the relationship between adiposity and a broad range of psychosocial factors measured concurrently and few have examined continuous relationships between increasing body mass index (BMI) z-score and psychosocial factors or how the psychosocial variables relate to each other. It is unclear whether particular psychosocial problems tend to coexist in overweight children, and whether the nature of such combinations varies with degree of adiposity or whether increasing adiposity is associated with an increasing number of psychosocial problems.
There is a need to investigate the full extent of the psychosocial burden of overweight in young children, so that appropriate strategies can be incorporated into interventions and at-risk children can be targeted for prevention programmes.
Thus, the aims of the present study were to (i) investigate the relationship between children's degree of adiposity and a broad range of psychosocial variables including depression, self-esteem, body dissatisfaction, peer relations, quality of life, eating disorder symptoms, and behavioural and emotional problems; and (ii) compare patterns of clustering of psychosocial measures between healthy weight and overweight/obese children.
Method
Design
The Childhood Growth and Development (GAD) Study is a prospective, enriched cohort study of healthy weight, overweight and obese Western Australian children aged 6–13 years. The design of the GAD Study has been described in detail elsewhere [37].
These analyses considered data for 262 children aged 8–13 years (mean age = 10.3, SD = 1.4) from 207 families: 158 children were classified as healthy weight and 104 as overweight, including 27 as obese. Of the overweight, 19 sought treatment for their overweight and 85 had not.
Measures
Anthropometry
All children were weighed in light clothing and without shoes with regularly calibrated Tanita Digital Medical Scales (Tanita, Chicago, USA), and measured with a regularly calibrated portable Harpenden stadiometer (Holtain Ltd., Crymych, UK), using the stretch technique (to the nearest millimetre). All measures were assessed in duplicate with the mean score recorded. BMI (weight/height2) was calculated for each child. Age- and gender-specific BMI z-scores were calculated using the Centre for Disease Control 2000 reference data [38].
Child Eating Disorder Examination
The Child Eating Disorder Examination (ChEDE) [39] was used to assess eating disorder psychopathology. This structured interview is a modified version of the Eating Disorder Examination (EDE) for adults [40], which has been validated for use with children [39], and has been used previously with both overweight and healthy weight children [34], [35]. The ChEDE has four subscales: Restraint, Eating Concern, Shape Concern, and Weight Concern. Subscale scores are calculated by averaging scores on the relevant items, and can range from 0 (no concern) to 6 (extreme concern).
Children's Depression Inventory
The Children's Depression Inventory (CDI) [41] was used to assess depressive symptomatology. The CDI is the most commonly used instrument for assessing depressive symptoms in children aged 7–17 years [21], [42]. The short-form CDI contains 10 items, which assess negative mood, anhedonia, ineffectiveness, and negative self-esteem. The CDI shows adequate internal consistency, test–retest reliability, and construct, convergent, and predictive validity [41], [42].
Self-Perception Profile for Children
The Self-Perception Profile for Children (SPPC) [43] was used to evaluate self-esteem and self-concept. It assesses six domains of self-esteem (scholastic competence, social acceptance, athletic competence, physical appearance, behavioural conduct and global self-worth). Each of these subscales contains six items, and subscale scores are calculated by averaging the appropriate item ratings. The SPPC demonstrates acceptable internal consistency and test–retest reliability [43], [44].
Child Psychosocial Quality of Life
The Paediatric Quality of Life Inventory (PedsQL) [45] is designed to measure health-related quality of life in children and adolescents aged 2–18 years (5–18 self-report; 2–18 parent proxy report). It measures physical, emotional, social and school functioning from which three summary scores are obtained (total, physical and psychosocial health). The PedsQL consists of 23 items scored using a 5-point Likert scale. Normative data indicate adequate reliability and validity for the self-report and parent-proxy report among a sample of 1677 healthy, acutely ill, and chronically ill children [46].
Children's Body Image Scale
The Children's Body Image Scale (CBIS) [33] was used to measure body dissatisfaction. This gender-appropriate figure rating scale consists of seven composite photos with corresponding BMIs, ranging from 14.0 kg m−2 to 29.0 kg m−2 for boys, and 13.0 kg m−2 to 28.5 kg m−2 for girls (3rd–97th BMI percentiles for 10-year-old children). Children are asked to select the figures that best represent their current and ideal body sizes, with the perceived–ideal discrepancy providing a measure of body dissatisfaction. The CBIS has been validated on an Australian sample of 7–12-year-old boys and girls [33].
Child Behaviour Checklist
The Child Behaviour Checklist (CBCL) [47] is a 118-item self-report questionnaire completed by parents rating the emotional and behavioural problems of children aged 6–18 years. The problems are scored on a 3-point scale ranging from not true to very or often true. Scores are summed to give eight syndrome scores: withdrawn, somatic, anxious/depressed, delinquent (rule breaking), social, thought, attention, and aggressive. There are also three broad band scores: internalizing, externalizing and total problems. Raw scores were converted into T scores that can then be used to classify children as being in the normal, borderline, or clinical range for each subscale. The CBCL is one of the most widely used measures in child psychology with the reliability and validity having been well established [47].
Bullying Questionnaire for Children
The Bullying Questionnaire for Children (BQ) was developed from the 38-item Friendly Schools, Friendly Families Intervention Project Bullying Questionnaire, developed by Cross et al. [48]. The BQ asked children how often they had been bullied by another group of students in the last term and how often they had taken part in bullying another student, either on their own or with a group of students, in the last term. The BQ also included questions about the types of bullying behaviours (e.g. being called mean and hurtful names).
Statistical analysis
Mean and standard deviation of scores on each psychosocial measure and the number and proportion with a suboptimal score were calculated by weight status.
To assess the relationship between BMI z-score and psychosocial functioning, the continuous BMI z-score was regressed on each psychosocial variable in a series of multilevel models adjusted for family level clustering (because families could contribute more than one child), gender, and age group (8–10 years or 11–13 years). The distributions of measures of psychosocial functioning in treatment-seeking and non-treatment-seeking overweight children were compared both before and after adjusting for child BMI z-score.
Children were assigned a score of 1 for a suboptimal score on each of the CDI total score, CBCL externalizing problems, CBCL internalizing problems, global SPPC and on global PedsQL. These scores were summed to provide the number of psychosocial problems. The correlation between this number and BMI z-score was measured with Pearson product moment correlation and its distribution examined by weight status.
The relationship between the psychosocial measures was measured with Pearson product moment correlations and principal components analyses.
Prior to conducting a principal components analysis with varimax orthogonal rotation to identify the clustering of measures of psychosocial functioning separately for the healthy weight and for the overweight/obese groups, each of the 19 variables were examined for normality of distribution and the presence of outliers. Analysis was commenced by inputting a matrix of Pearson product moment correlations retaining all factors with eigenvalues >1.
All statistical analyses were performed using SPSS version 12.0 (SPSS, Chicago, IL, USA).
Results
Descriptive statistics
Table 1 presents the means and standard deviation and the number and proportion of suboptimal scores for each of the psychosocial measures by weight status. The proportions of the overweight and the obese groups with suboptimal scores almost always exceeded those in the healthy weight group.
Psychosocial scores according to weight status
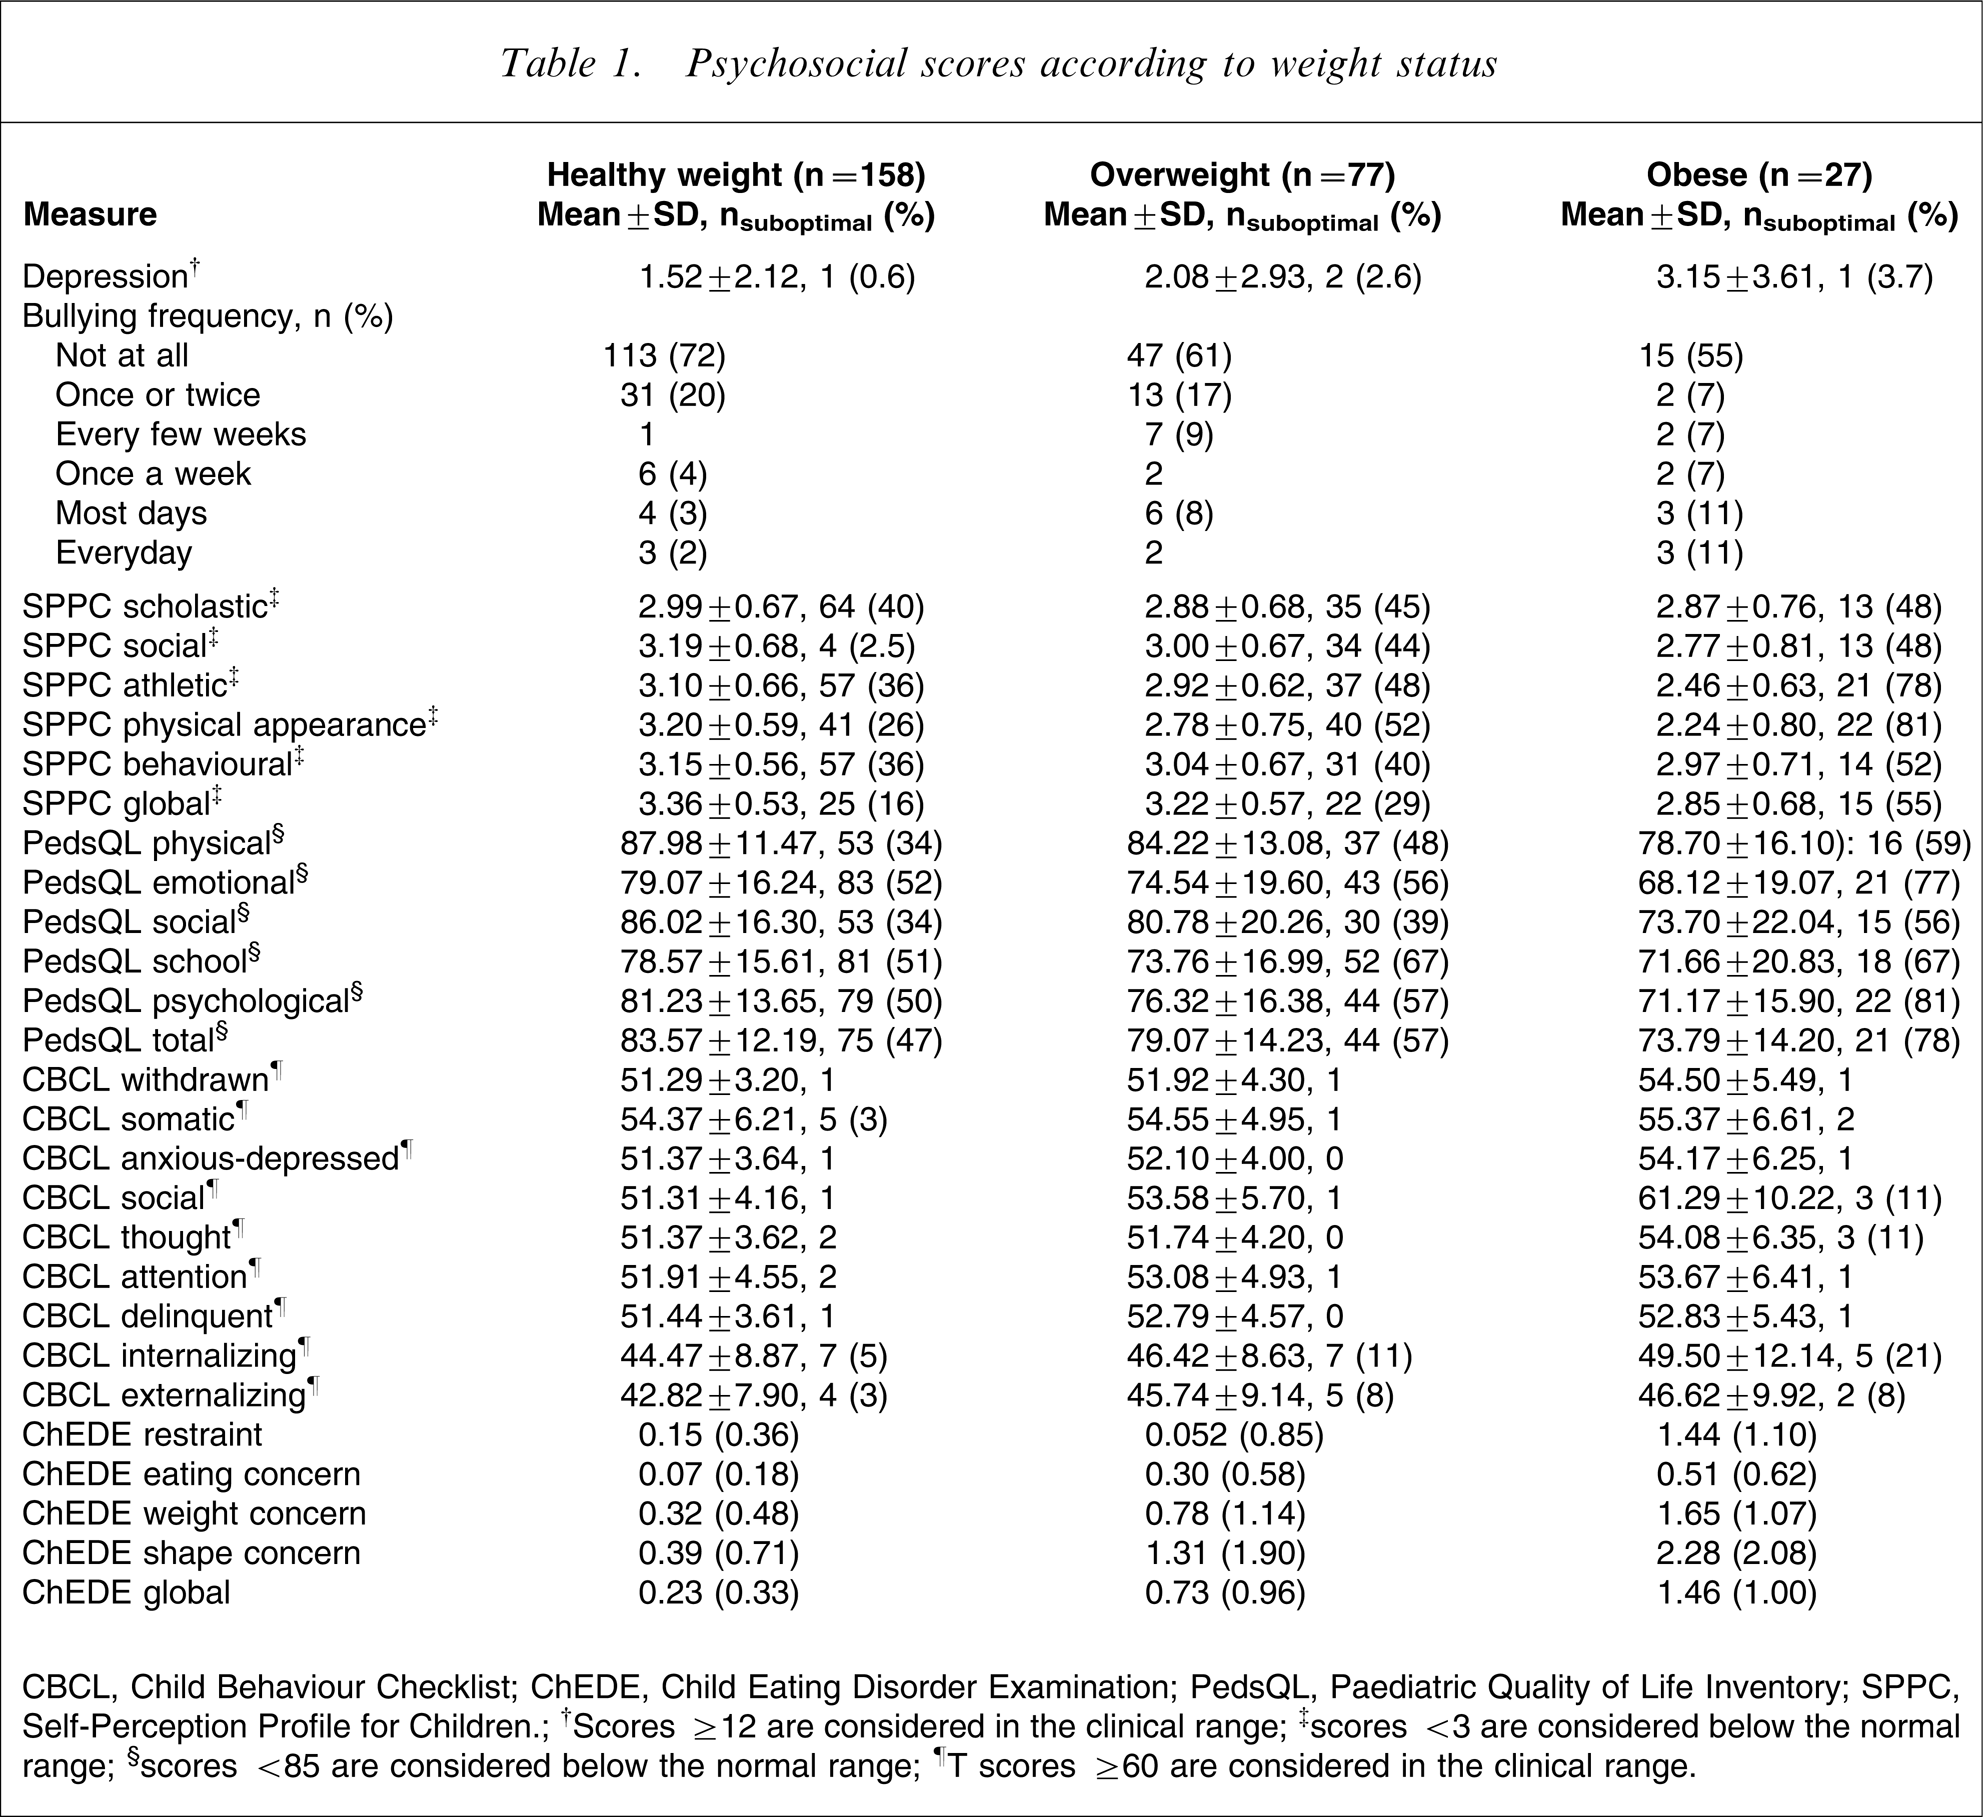
CBCL, Child Behaviour Checklist; ChEDE, Child Eating Disorder Examination; PedsQL, Paediatric Quality of Life Inventory; SPPC, Self-Perception Profile for Children.; †Scores ≥12 are considered in the clinical range; ‡scores <3 are considered below the normal range; §scores <85 are considered below the normal range; ¶T scores ≥60 are considered in the clinical range.
Measures of psychosocial functioning and children's BMI
Main effects
Table 2 reports the multivariate coefficients and 95% confidence intervals for each of the composite measures of psychosocial functioning. Higher BMI z-scores were associated with statistically significant increases in depression, body dissatisfaction, frequency of eating disorder symptoms, internalizing and externalizing problems on the CBCL and frequency of being bullied, and with decreasing self-esteem and decreasing levels of health-related quality of life.
Main effects of child BMI z-scores on psychosocial measures
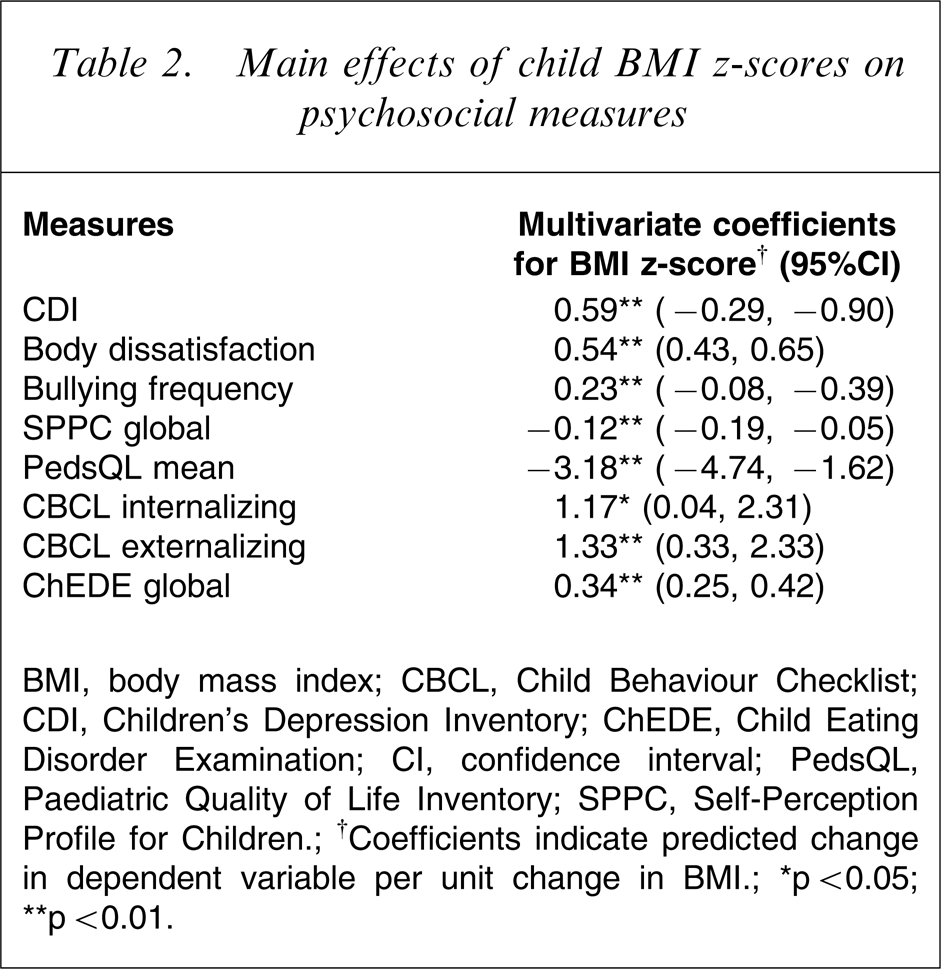
BMI, body mass index; CBCL, Child Behaviour Checklist; CDI, Children's Depression Inventory; ChEDE, Child Eating Disorder Examination; CI, confidence interval; PedsQL, Paediatric Quality of Life Inventory; SPPC, Self-Perception Profile for Children.; †Coefficients indicate predicted change in dependent variable per unit change in BMI.; ∗p < 0.05; ∗∗p < 0.01.
Age and gender interactions
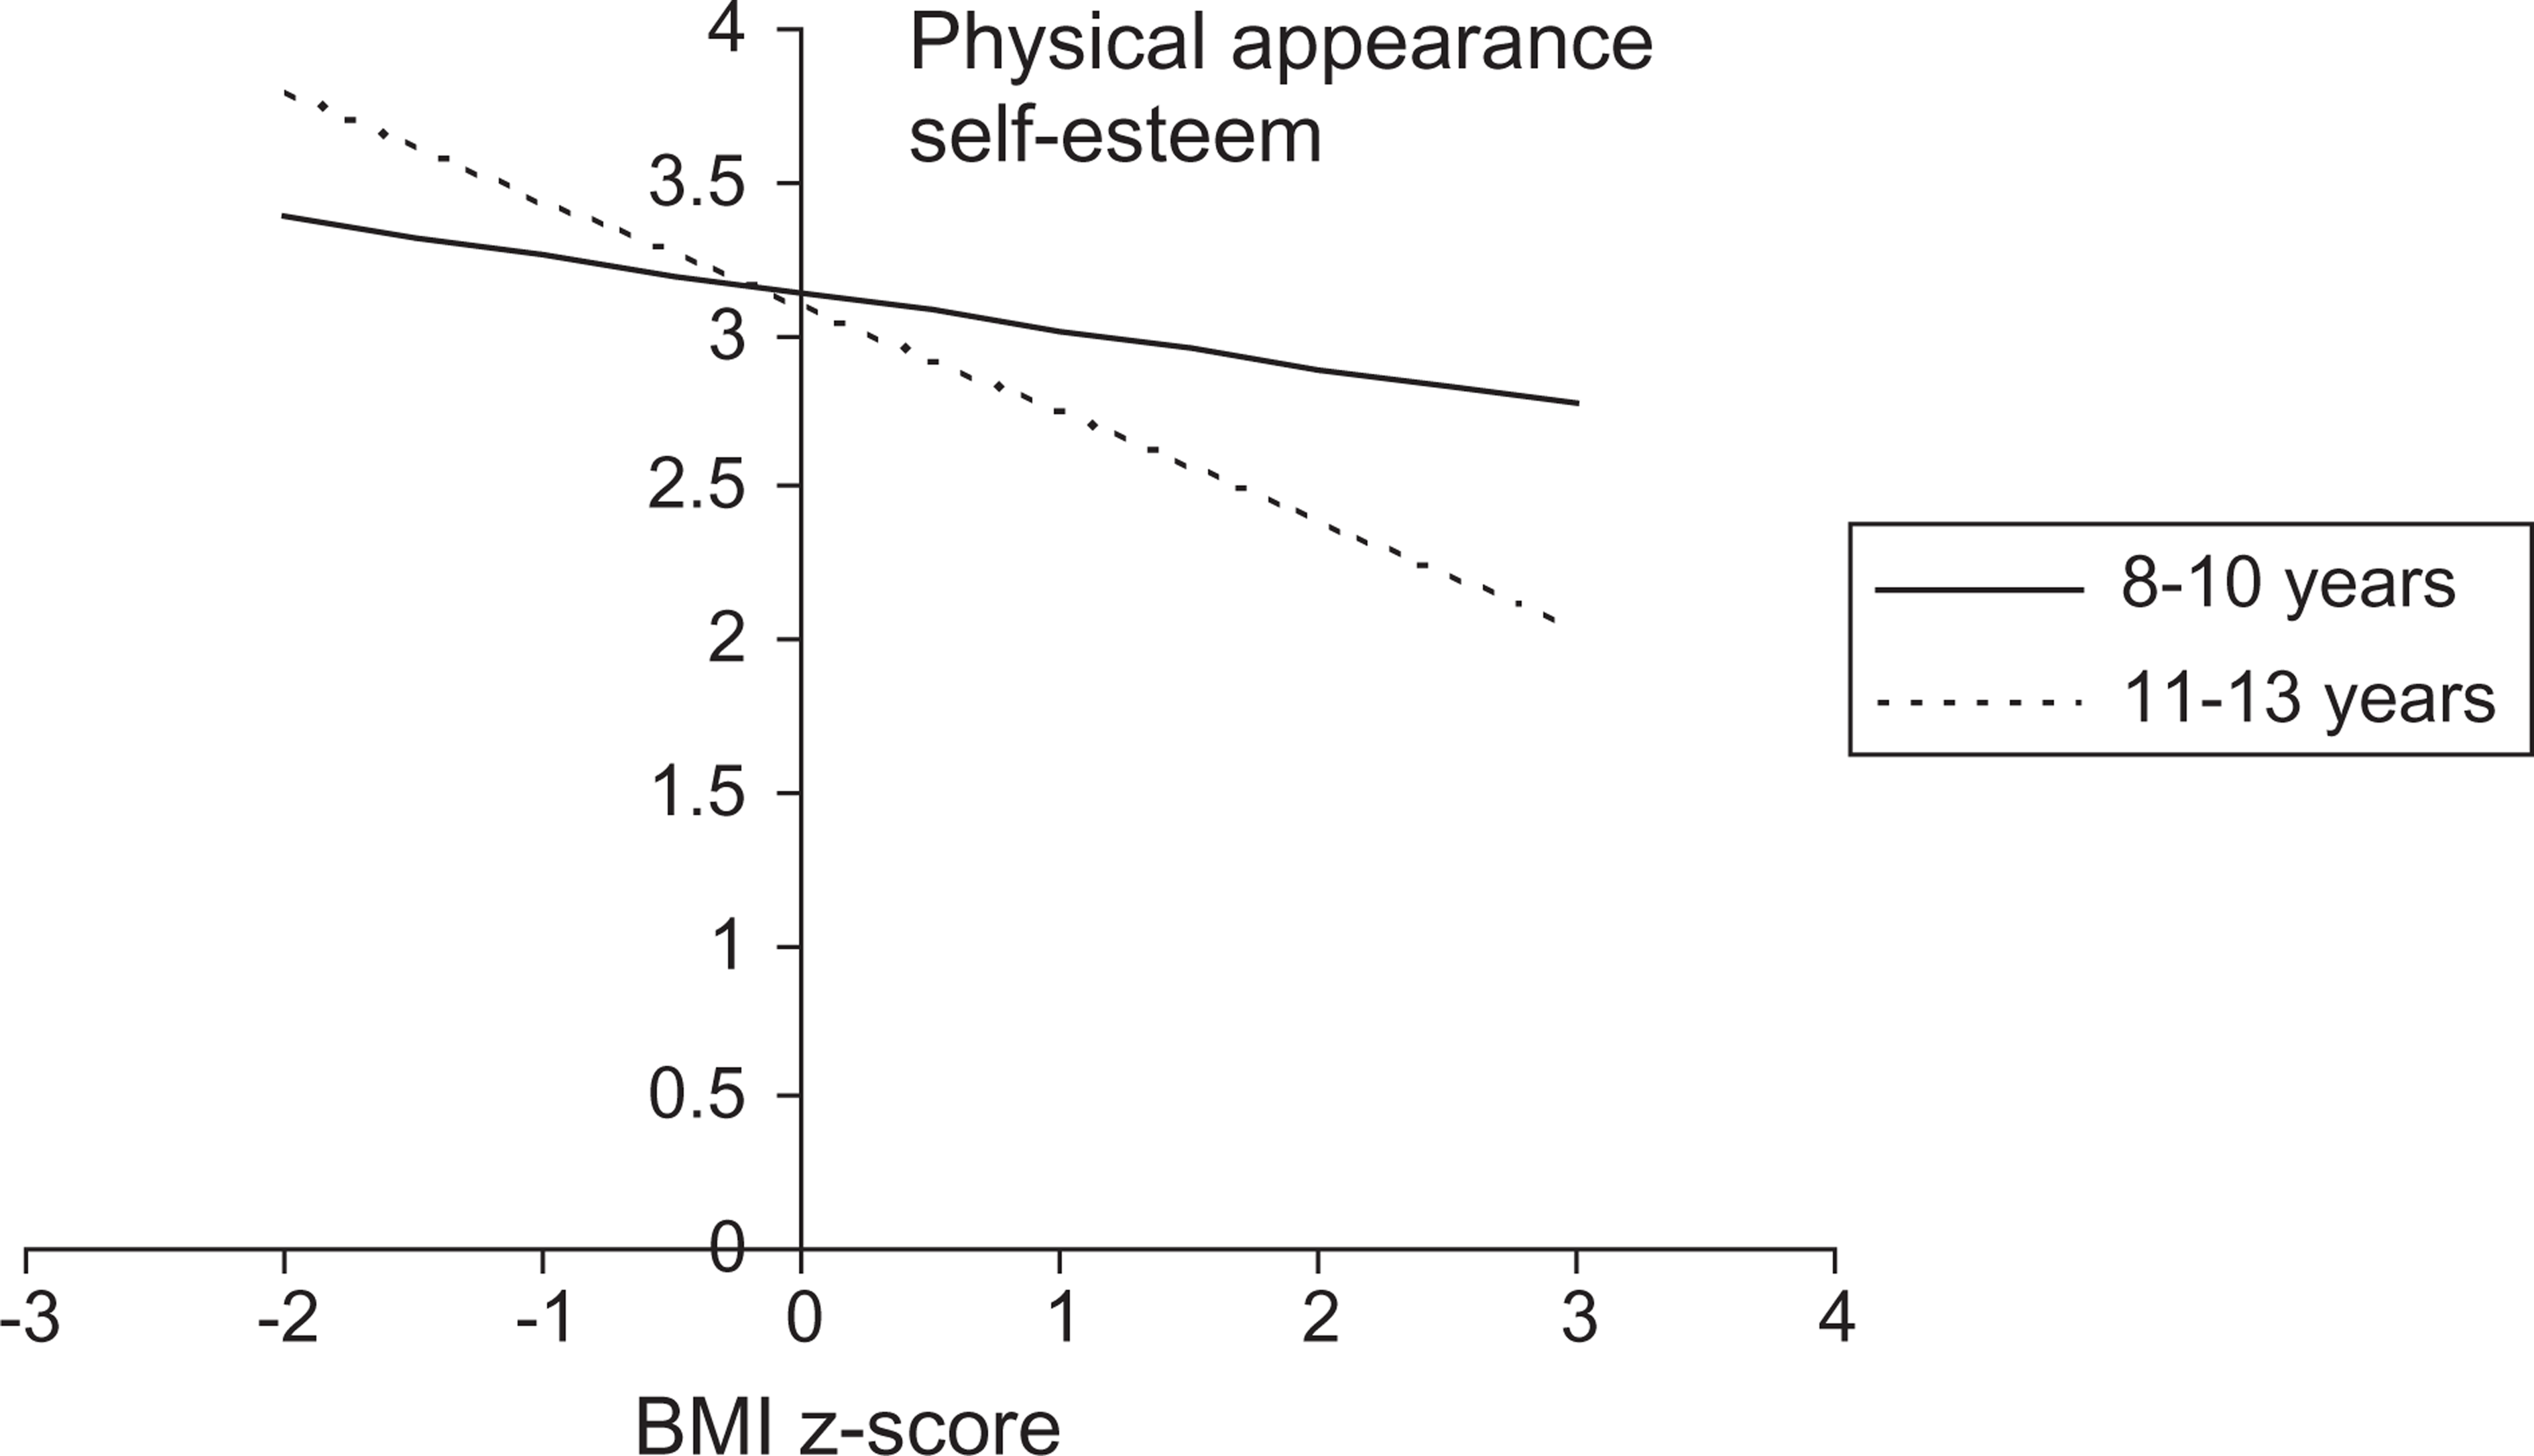
There were no significant main or interaction effects of age group or gender with the measures of body dissatisfaction, bullying, quality of life, CBCL, or the ChEDE. There was, however, a significant interaction between BMI z-score and gender on the measure of depression (p < 0.05), with girls having a significantly greater increase in depression than boys as BMI z-score increased (Figure 1). There was also a significant interaction between BMI z-score and age (p = 0.01), with older children (11–13 years) having significantly lower self-esteem concerning physical appearance than younger children (8–10 years) as BMI z-score increased (Figure 2).
Regression model showing the significant interaction between body mass index (BMI) z-score and gender on the measure of depression. Regression model showing the significant interaction between body mass index (BMI) z-score and age on the measure of physical appearance self-esteem.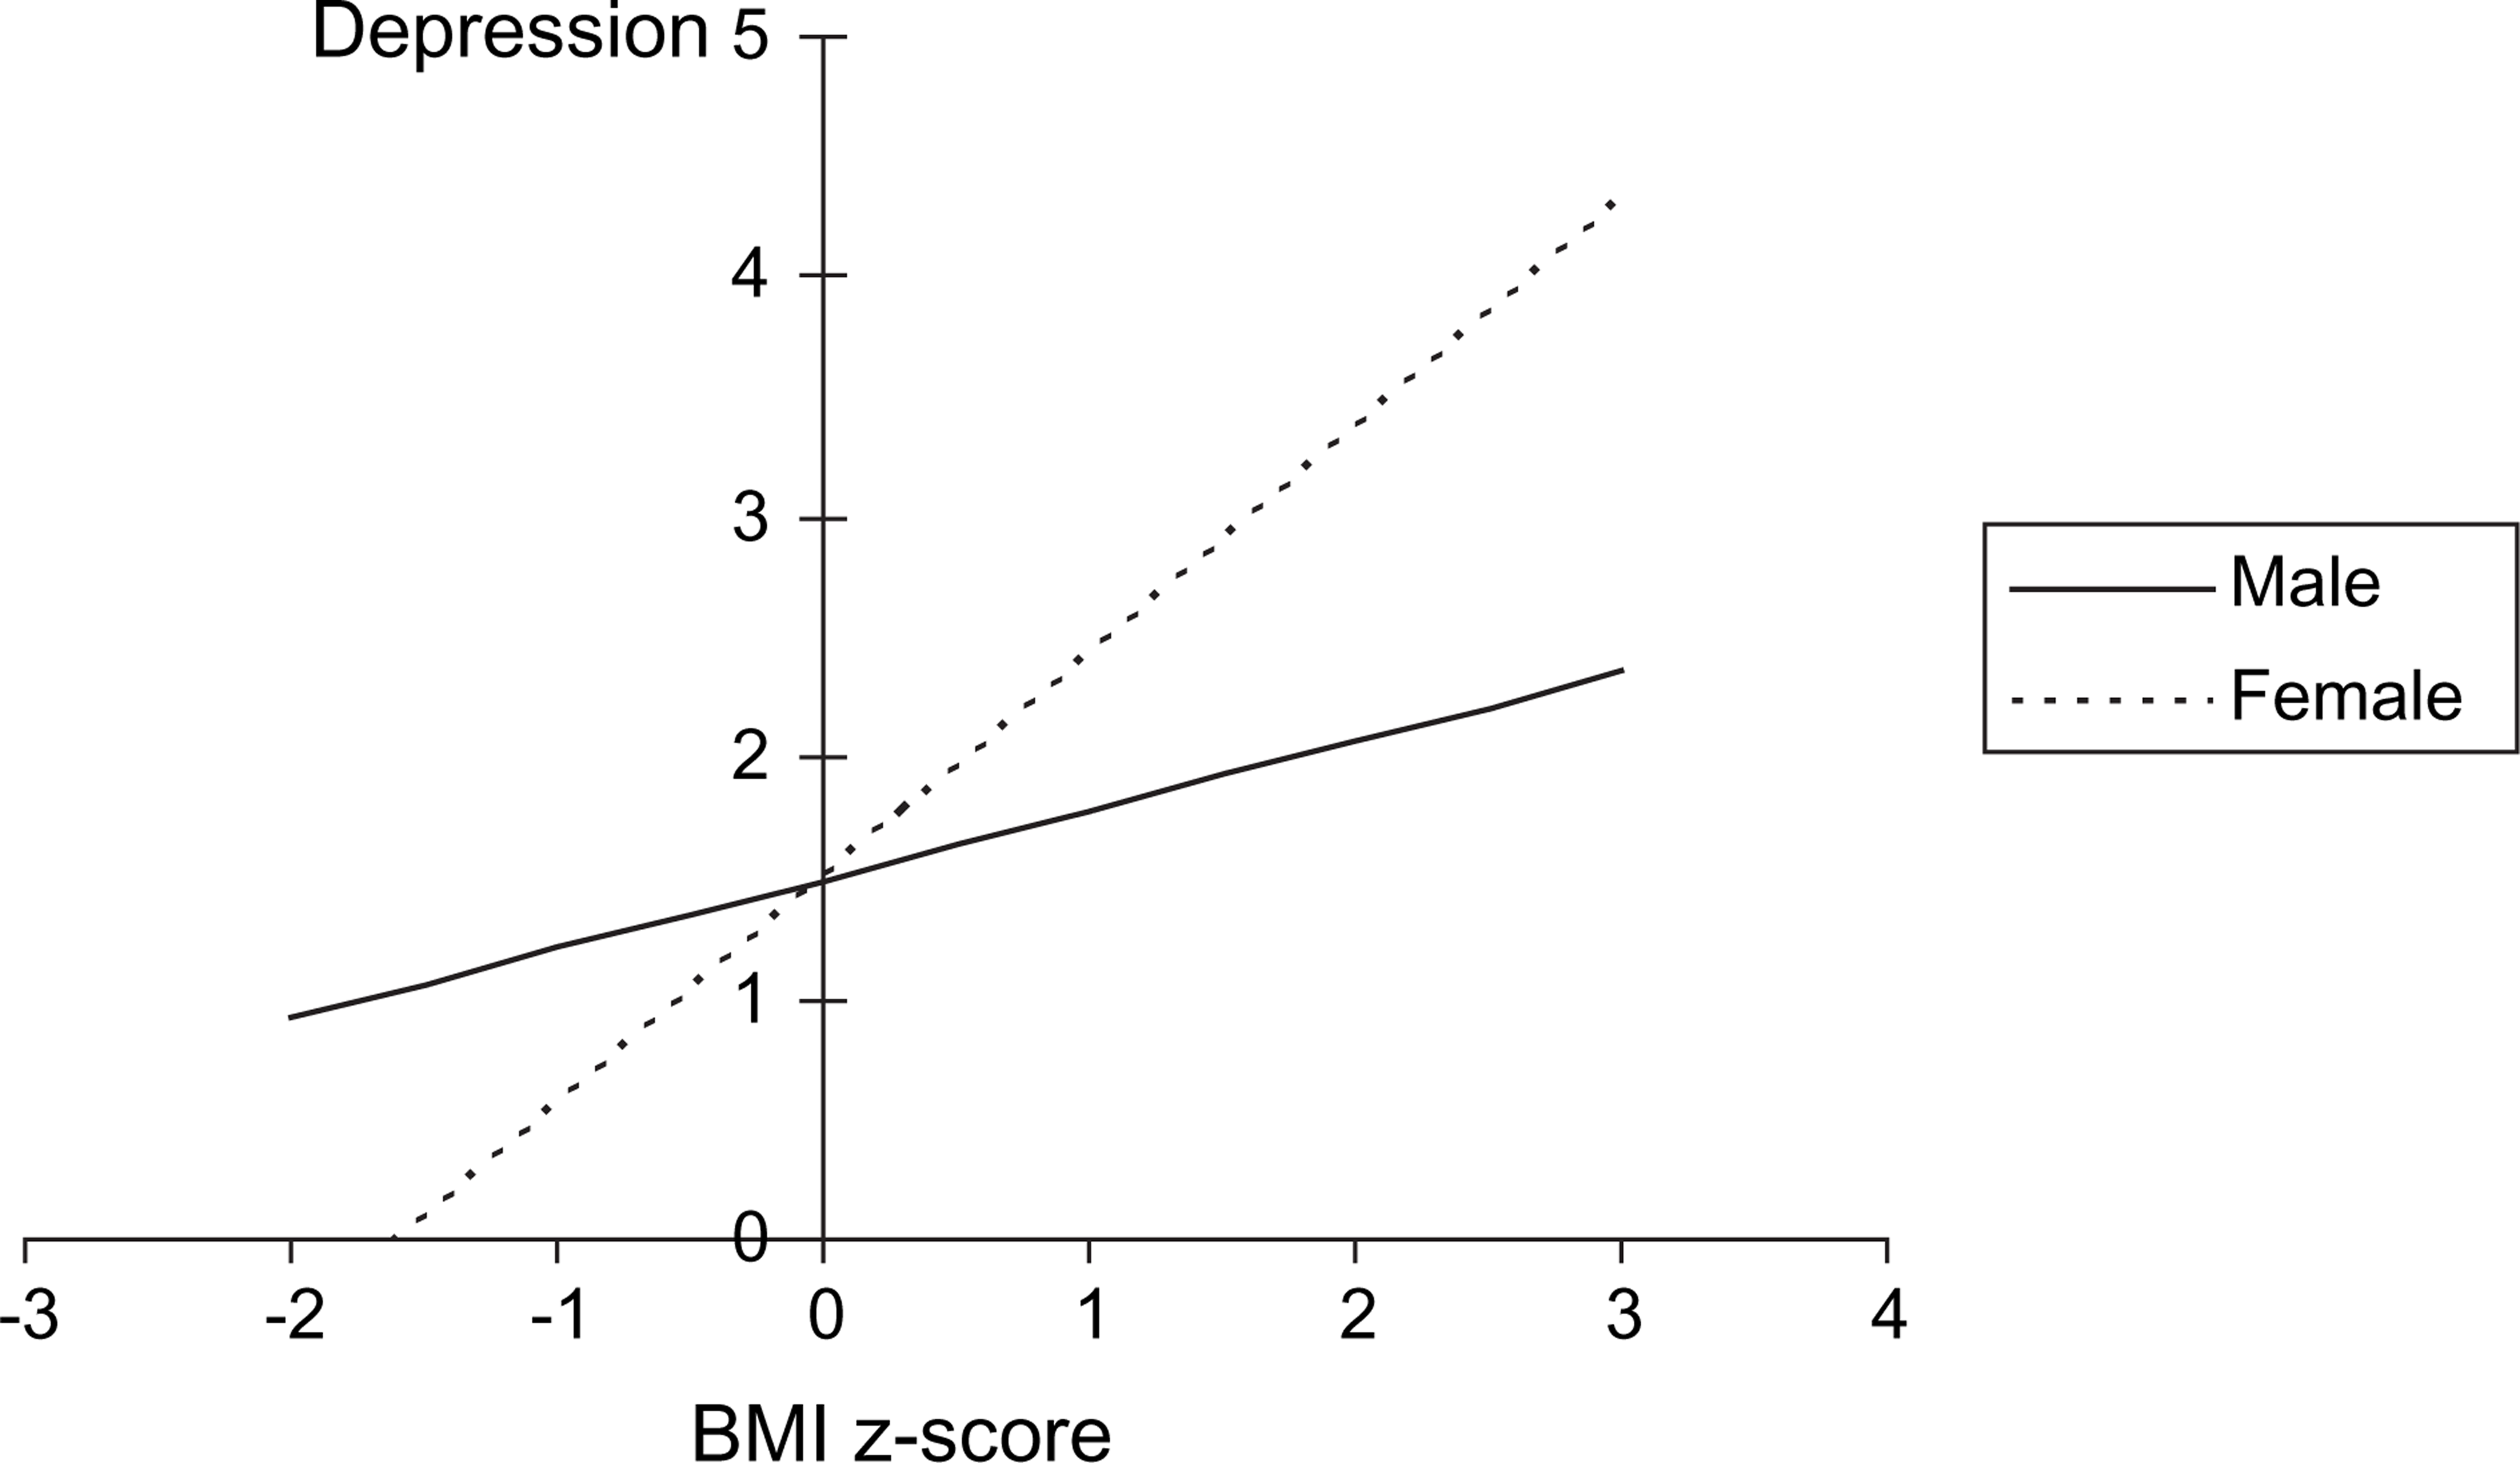
Treatment-seeking versus non-treatment-seeking children
For overweight/obese children there were significant differences between the non-treatment-seeking and the treatment-seeking on the athletic competence subscale of the SPPC (t = − 2.08, p < 0.05) and the social syndrome of the CBCL (t = 2.34, p < 0.05). The treatment-seeking sample reported lower levels of self-worth on the athletic competence subscale of the SPPC and a higher number of problems on the social syndrome of the CBCL. But these differences were not significant after controlling for child BMI z-score.
Number of psychosocial problems and BMI z-score
The number of psychosocial problems is shown by child BMI weight status in Table 3. There was a significant positive correlation between number of psychosocial problems and child BMI z-score (r = 0.31, p < 0.01).
Psychosocial problems and BMI
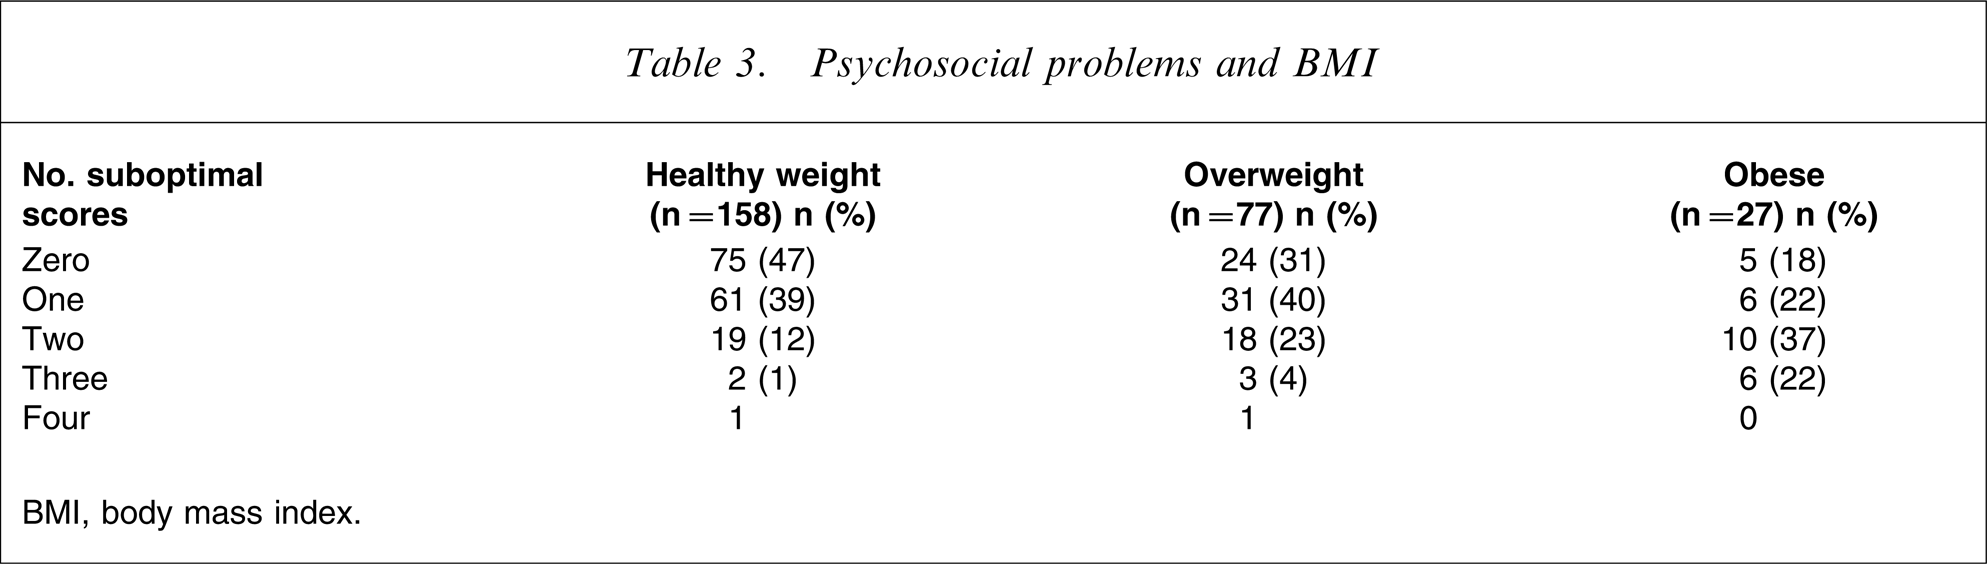
BMI, body mass index.
Measures of psychosocial functioning
There were significant correlations between all the measures of psychological functioning (r = 0.30–0.70, all p < 0.01): for example (i) higher levels of depression were associated with higher levels of weight and shape concern (r = 0.31 and r = 0.40 respectively, all p < 0.01), lower levels of global self-esteem (r = − 0.58, p < 0.01) and lower levels of quality of life (r = − 0.70, p < 0.01); and (ii) being bullied was associated with higher levels of depression (r = 0.43, p < 0.01), higher prevalence of disordered eating (r = 0.25, p < 0.05), lower levels of self-esteem (r = − 0.22, p < 0.05) and poorer quality of life (r = − 0.41, p < 0.01).
Clustering of psychosocial measures
The following 19 factors had eigenvalues >1 and were entered into the analysis: CDI total score, the SPPC subscales (scholastic competence, social acceptance, athletic competence, physical appearance, behavioural conduct and global self-worth), the PedsQL subscales (physical, emotional, social and school), frequency of bullying, body dissatisfaction, the internalizing and externalizing subscale of the CBCL, and the EDE subscales (restraint, eating concern, weight concern, and shape concern). For the overweight/obese group a Keiser–Meyer–Olkin statistic of 0.78 indicated reasonable factorability and five factors with an eigenvalue >1 explained 72% of the common factor variance. Estimates of communality ranged from 0.48 to 0.84. Factor 1 consisted of the physical appearance and global subscales of the SPPC, body dissatisfaction, and the restraint, eating concern, weight concern and shape concern subscales of the ChEDE. Factor 2 consisted of the scholastic competence and behavioural conduct subscales of the SPPC, and the emotional, school, and physical subscales of the PedsQL, and the total CDI score. Factor 3 included the social acceptance subscale of the SPPC, the social subscale of the PedsQL, bullying and the total CDI score. Factor 4 consisted of the internalizing and externalizing subscales of the CBCL. The athletic competence subscale of the SPPC loaded on a fifth factor.
For the healthy weight group six factors with an eigenvalue >1 accounted for 68% of the common factor variance in the data. A Keiser–Meyer–Olkin statistic of 0.76 indicated reasonable factorability. Estimates of communality ranged from 0.50 to 0.81. Factor 1 consisted of the physical, emotional and school subscales of the PedsQL. This corresponds to Factor 2 in the overweight/obese group, although in the overweight/obese group this factor also includes the scholastic competence and behavioural conduct subscales of the SPPC. Factor 2 consists of the social acceptance subscale of the SPPC, the social subscale of the PedsQL, bullying and the CDI total score. This corresponds to Factor 3 in the overweight/obese, but for the healthy weight group CDI total score loads exclusively on Factor 2. Factor 3 consists of the global, scholastic competence, behavioural conduct and physical appearance subscales of the SPPC. Factor 4 consisted of body dissatisfaction and the restraint, weight concern and shape concern subscales of the ChEDE. This is the equivalent of Factor 1 in the overweight/obese group, with the exception of the global and physical appearance subscales of the SPPC. Both the internalizing and externalizing subscales of the CBCL loaded on Factor 5, which corresponds to Factor 4 in the overweight/obese group. The athletic competence subscale of the SPPC and the eating concern subscale of the ChEDE load on a sixth factor.
Discussion
The present study examined the relationship between adiposity, as measured by BMI z-score, and a broad range of domains of children's psychosocial functioning (including depression, self-esteem, body dissatisfaction, peer relations, quality of life, behaviour problems and eating disorder symptoms). Increasing BMI z-score was significantly associated with higher levels of depression, increased body dissatisfaction, poor quality of life, lower self-esteem, greater eating disorder symptomatology, poor peer relationships and behavioural problems.
On the measure of depression there was a significant interaction between BMI z-score and gender, with girls having a significantly stronger increase in depression than boys as BMI z-score increased. This suggests that girls may be particularly vulnerable to depressive symptoms with increasing adiposity. This is consistent with the findings of Erickson et al., who found a significant, albeit weak, relationship between depressive symptoms and BMI among a population sample of girls but not boys (mean age = 8.4 years) [21]. While it has been previously suggested that gender differences in depressive symptoms do not emerge until puberty [49], [50], these data suggest that such gender differences may emerge earlier in childhood, at least in overweight and obese children.
Previous studies have not consistently found an association between obesity and lower levels of self-esteem in children [14], and these discrepancies have often been attributed to variations in the age of the sample being investigated. In the present study significant associations were found between increasing BMI z-score and decreasing global self-worth, physical appearance, social acceptance, athletic competence and behavioural conduct self-esteem. The negative association with physical appearance self-esteem was significantly stronger in older children (11–13 years) than younger children (8–10 years), confirming the suggestion that physical appearance self-esteem of adolescents is more vulnerable to overweight than in younger children [9], [14], [51].
The inclusion of both a treatment-seeking and a non-treatment-seeking sample of overweight children allowed us to compare these two groups on the psychosocial measures. Observed differences between the treatment- and non-treatment-seeking overweight children could be attributed to the higher BMI z-scores of the treatment seeking group. These findings are consistent of those of Braet et al., who found more psychopathology in treatment-seeking obese children in a study that did not control for BMI z-score in their analyses [6]. While poor psychosocial functioning has been consistently found in clinical samples of obese children [18], [19], [26], the present study suggests that psychosocial distress is prevalent in both clinical and non-clinical samples of all overweight children.
The inclusion of a range of measures of psychosocial functioning allowed us to examine the relationships between these measures. Significant correlations were found between all the measures of psychosocial functioning, and it was also found that as BMI increases children are likely to experience an increasing number of psychosocial problems. The findings demonstrate that overweight children report both higher levels psychosocial distress, and a greater number of psychosocial problems.
The factor analyses performed separately on the overweight group and the healthy weight group, found two subtle differences between the groups. First, for the overweight group depression was associated with both social competence and lower quality of life, while in the healthy weight group depression was exclusively associated with social problems such as bullying. This suggests that for some overweight children depression is related to the impact of their weight on health-related quality of life as well as social problems, whereas in the healthy weight group depression was more likely to be directly associated with peer problems. Second, in the overweight group, but not in the healthy weight group, global self-worth clustered with body image and eating disorder symptoms. This suggests that for children in the overweight group, their sense of self-worth is closely linked with issues regarding weight, shape and body image. The tendency to evaluate self-worth in terms of weight and shape is characteristic of individuals with eating disorders [52], and this may explain the increased number of eating disorder symptoms in the overweight sample.
An important conclusion from the present study is that even in young primary school-aged children the psychosocial burden of excess weight is significant and broad-reaching. Moreover, psychologically affected overweight children are likely to experience multiple clinically significant psychosocial problems.
Finding out more about the relationship between adiposity and psychosocial distress may help to identify those children in need of psychological treatment and may also help to highlight the types of psychological treatments that should form a critical part of the treatment and/or prevention of overweight and obesity in children.
Footnotes
Acknowledgements
This research is funded by Healthway, HBF, and the Raine Medical Foundation. We would like to acknowledge the schools, children and parents that have given their valuable time to participate in the study. We would also like to acknowledge the contributions of our colleagues Katie Watts, Felicity Watt, Debbie Blumberg, Alisha Thompson, Lana Bell and Karina Allen.