
Abstract
Objective:
Previous studies reported decreased N-acetyl aspartate and increased Glx (the sum of glutamate plus glutamine) in bipolar disorder. Since these studies included patients at different stages of illness, it is unknown whether these changes have a causal role or a consequence of multiple episodes and treatments. The studies in early-stage bipolar disorder patients have the potential to provide answers to these issues. Therefore, we evaluated N-acetyl aspartate and Glx levels in hippocampi of first-episode bipolar disorder patients and health subjects at baseline and at 12 months, and examined the impact of episode recurrence on these measures.
Method:
We used single-voxel proton magnetic resonance spectroscopy to compare the hippocampal neurometabolites (N-acetyl aspartate and Glx) levels between 41 patients with bipolar disorder following recovery from their first-manic episode and 27 matched healthy subjects at recruitment and 12 months later. We also compared N-acetyl aspartate and Glx levels between patients who had a recurrence of a mood episode and those who did not.
Results:
There was no main effect of either group (diagnosis) or time for hippocampal N-acetyl aspartate and Glx levels in bipolar disorder patients and healthy subjects. We also did not find any group-by-time interaction for the levels of these metabolites. There were also no differences in N-acetyl aspartate and Glx between patients who experienced a recurrence of a mood episode and those who did not over 12-month follow-up.
Conclusion:
Our data suggest that N-acetyl aspartate and Glx levels are not altered in early stage bipolar disorder. Further, these data suggest that episode recurrence in early stages does not have a significant impact on the levels of these metabolites. These may suggest that there may be an early window for intervention to potentially arrest neuroprogression of the disease.
Introduction
Bipolar disorder (BD) is a chronic recurrent illness associated with considerable mortality and morbidity. Patients with BD die 9 years earlier on average, have two-fold higher all-cause mortality and eight- to 15-fold greater suicide risk compared with the rest of the population (Crump et al., 2013). BD is one of the leading causes of disability in young adults (Catalá-López et al., 2013), and it is associated with higher direct medical costs compared to the general population (Stender et al., 2002).
The natural history of illness progression of BD involves relapses, increasing subclinical symptoms and comorbidity with other psychiatric disorders and medical conditions (Kapczinski et al., 2009). Mood episodes themselves are predictors of recurrence of BD (Kessing et al., 2004) and the duration of the inter-episode recovery tends to be shortened as the illness progresses (Kessing et al., 1998). With accumulating illness episodes, increasing illness severity translates into a higher cognitive and functional impairment (Magalhães et al., 2012; Rosa et al., 2009). Furthermore, a higher number of episodes is associated with poor treatment response to both pharmacological (Berk et al., 2011a; Swann et al., 1999) and psychosocial interventions (Scott et al., 2006). Recent literature further suggests that having more mood episodes is also associated with neuroanatomical changes, including ventricular enlargement (Strakowski et al., 2002) and progressive loss of gray matter (GM) (Ekman et al., 2010).
The hippocampus as part of the limbic-thalamic-cortical system is crucial to emotional regulation. It is also involved in cognitive functioning, in particular, memory tasks (Frey et al., 2007). Reviews of neuroimaging studies in BD suggest volume reductions in the hippocampus (Frey et al., 2007). In a large meta-analysis, Hallahan et al. (2011), found a reduction in hippocampal volume in BD patients, though this seemed to be reversed by lithium therapy. Another study showed no significant difference either in left or right mean hippocampal volumes between euthymic BD patients and healthy controls, but reported that obese bipolar patients had lower left hippocampal volume than non-obese subjects (Vianna-Sulzbach et al., 2013). In aggregate, these data suggest alterations in hippocampal volume, and therefore, it is likely that hippocampus plays a role in the pathophysiology of BD.
Magnetic resonance spectroscopy (1H-MRS) studies have shown abnormalities in neurochemical markers in the limbic-thalamic-cortical circuit of subjects with BD. Specifically, even though there are a few negative studies (Colla et al., 2009), N-acetyl aspartate (NAA), a marker of neuron-myelin coupling (Nordengen et al., 2013), is reduced in the hippocampus of euthymic (Scherk et al., 2008), manic (Atmaca et al., 2006) and depressed patients with BD (Atmaca and Yildirim, 2012; Zhong et al., 2014). A study has suggested episode-related differences between mania and depression, depending on the region analyzed (Xu et al., 2013). In addition, increased glutamate + glutamine (‘Glx’) levels in multiple brain areas is perhaps the most consistent neurochemical finding in patients with BD, as indicated by the findings from two recent meta-analyses (Chitty et al., 2013; Gigante et al., 2012). Thus, there is evidence to support that Glx is elevated and NAA is decreased in BD.
However, most of 1H-MRS studies included in the above meta-analyses have been carried out in samples of patients with BD in advanced stages of the illness, with the bias introduced by the numerous confounding factors such as duration of illness, number of mood episodes and long-term use of medications. Hence, prospective cohort studies of early stage BD patients are critical to better understand the relationship between neurochemical markers and pathophysiology of BD, as well as the impact of illness progression on brain metabolites. Here, we replicated and expanded our previous cross-sectional research (Gigante et al., 2014) by examining in vivo neuronal metabolites in the hippocampus of patients with BD following their first-manic episode and again within 1-year of follow-up. The objective of our study was to determine whether the neurochemical abnormalities most consistently described in BD – increased Glx and decreased NAA – are present at the time of first diagnosis of BD, and whether they progress during the first year of treatment. A secondary aim was to evaluate the potential influence of recurrences on the absolute concentrations of NAA and Glx. We hypothesized that patients would show altered brain chemistry compared to a healthy comparison group, and that the progression of the illness (e.g. presence of new episode over one 1-year follow-up) will result in a greater alteration in brain metabolites.
Methods
Subjects
Patients and healthy subjects in this study were participants of the Systematic Treatment Optimization Program for Early Mania (STOP-EM), which has been described in detail in previous publications (Torres et al., 2010). The study protocol was approved by the University of British Columbia ethics committee. Written informed consent was obtained from all patients and healthy subjects before any study procedures took place, in accordance with the Declaration of Helsinki.
Patients meeting criteria for Bipolar I Disorder according to the Diagnostic and Statistical Manual of Mental Disorders, Fourth Edition (DSM-IV) were recruited from Vancouver Hospital Health Sciences Centre and affiliated sites, as well as by community and hospital referrals from physicians and psychiatrists. The inclusion criteria required patients to be aged between 14 and 35 years, and within 3 months of their first-manic or mixed episode, with or without psychosis, and with or without co-morbid conditions. All patients received treatment, according to clinical practice guidelines (Yatham et al., 2013). Patients were excluded if they had a history of major medical illness underlying their manic symptoms and if they could not provide informed consent.
Healthy subjects matched for age and gender were also recruited for comparison purposes. They were assessed with a standardized interview, and were enrolled if they had no personal history of psychiatric illness or major medical illness and no family history of psychiatric illness in their first-degree relatives.
Demographic and clinical variables
The baseline assessment included a clinical interview by an academic research psychiatrist and a structured clinical interview using the Mini International Neuropsychiatric Interview (MINI), both of which were used to confirm the diagnosis of BD. Sociodemographic and clinical variables were also collected using a standardized protocol. The following clinical rating scales were used: Positive and Negative Syndrome Scale (PANSS), Brief Psychiatric Rating Scale (BPRS), Young Mania Rating Scale (YMRS) and Hamilton Depression Rating Scale (HAM-D). The functioning was assessed using the Global Assessment of Functioning Scale (GAF).
MRI protocol and hippocampal volume extraction
T1-weighted MR images were acquired at enrolment and at 12 months follow-up with a Philips Achieva 3.0 Tesla scanner (Best, the Netherlands), using a three-dimensional axial inversion recovery-weighted spoiled gradient recalled sequence with the following parameters: FOV = 25.6 cm, matrix = 256 × 256, isotropic voxels (1 × 1 × 1 mm3), autoshim, repetition time (TR)/echo time (TE = autoset shortest, T/R head coil, flip angle = 8 degrees, SENSE = 0, and 1 mm thick contiguous 180 slices of the whole brain. Hippocampal volumes were estimated using Freesurfer v5.1 subcortical segmentation. The proportions of hippocampal and non-hippocampal GM and WM in the 1H-MRS voxel, were quantified using the FSL v4.1.9 FAST tool (FMRIB Software Library, www.fmrib.ox.ac.uk/fsl/)(Smith et al. 2004).
Acquisition and processing of signals of 1H-MRS
1H-MRS scans were acquired at enrollment and at 12 months with the Philips 3.0 T scanner in addition to T2-weighted coronal, sagittal and axial MR images for anatomical parameters. A point resolved spectroscopy (PRESS) sequence (TR = 2000 ms, TE = 35 ms) was used to acquire data from 30 mm × 15 mm × 15 mm voxels encompassing the hippocampus, one scan for each side of the brain. We have acquired T2 sagittal, coronal and axial scans to accurately localize the hippocampus. Then using the sagittal image, we angled the voxel parallel to the hippocampus (approximately the angle of the anterior horn of the temporal lobe). We then used the coronal and axial views to adjust the position of the voxel to include as much of the hippocampus as possible while avoiding skull/petrous and large water collections such as the 4th ventricle. The same procedure was used for placing voxel at baseline and at 1 year (Figure 1a). Further, to assess the reproducibility of the voxel placement between baseline and Y1, we computed correlations for the volume of the voxel occupied by hippocampal tissue, and compared the volume of the hippocampal grey matter and white matter within the voxel at baseline vs Y1, separately for patients and controls. In the patients group, the correlations between baseline and 1 year were: left (r = 0.910; p < 0.001), and right (r = 0.903; p < 0.001). Within the healthy subjects group, the correlations between both end-points were: left (r = 0.812; p < 0.001), and right (r = 0.949; p < 0.001). No differences were found between grey matter (p = 0.857) and white matter (p = 0.169) volumes within the hippocampal voxel on both end points (supplementary table). Projection-based second-order shimming was performed, and a single chemical shift selective pulse and crusher gradient were used to suppress the water signal 160 ms prior to the PRESS localization sequence. 128 water-suppressed and 16 water-unsuppressed signals were obtained, the latter to allow for eddy current correction and metabolite quantitation referenced to the water peak area.
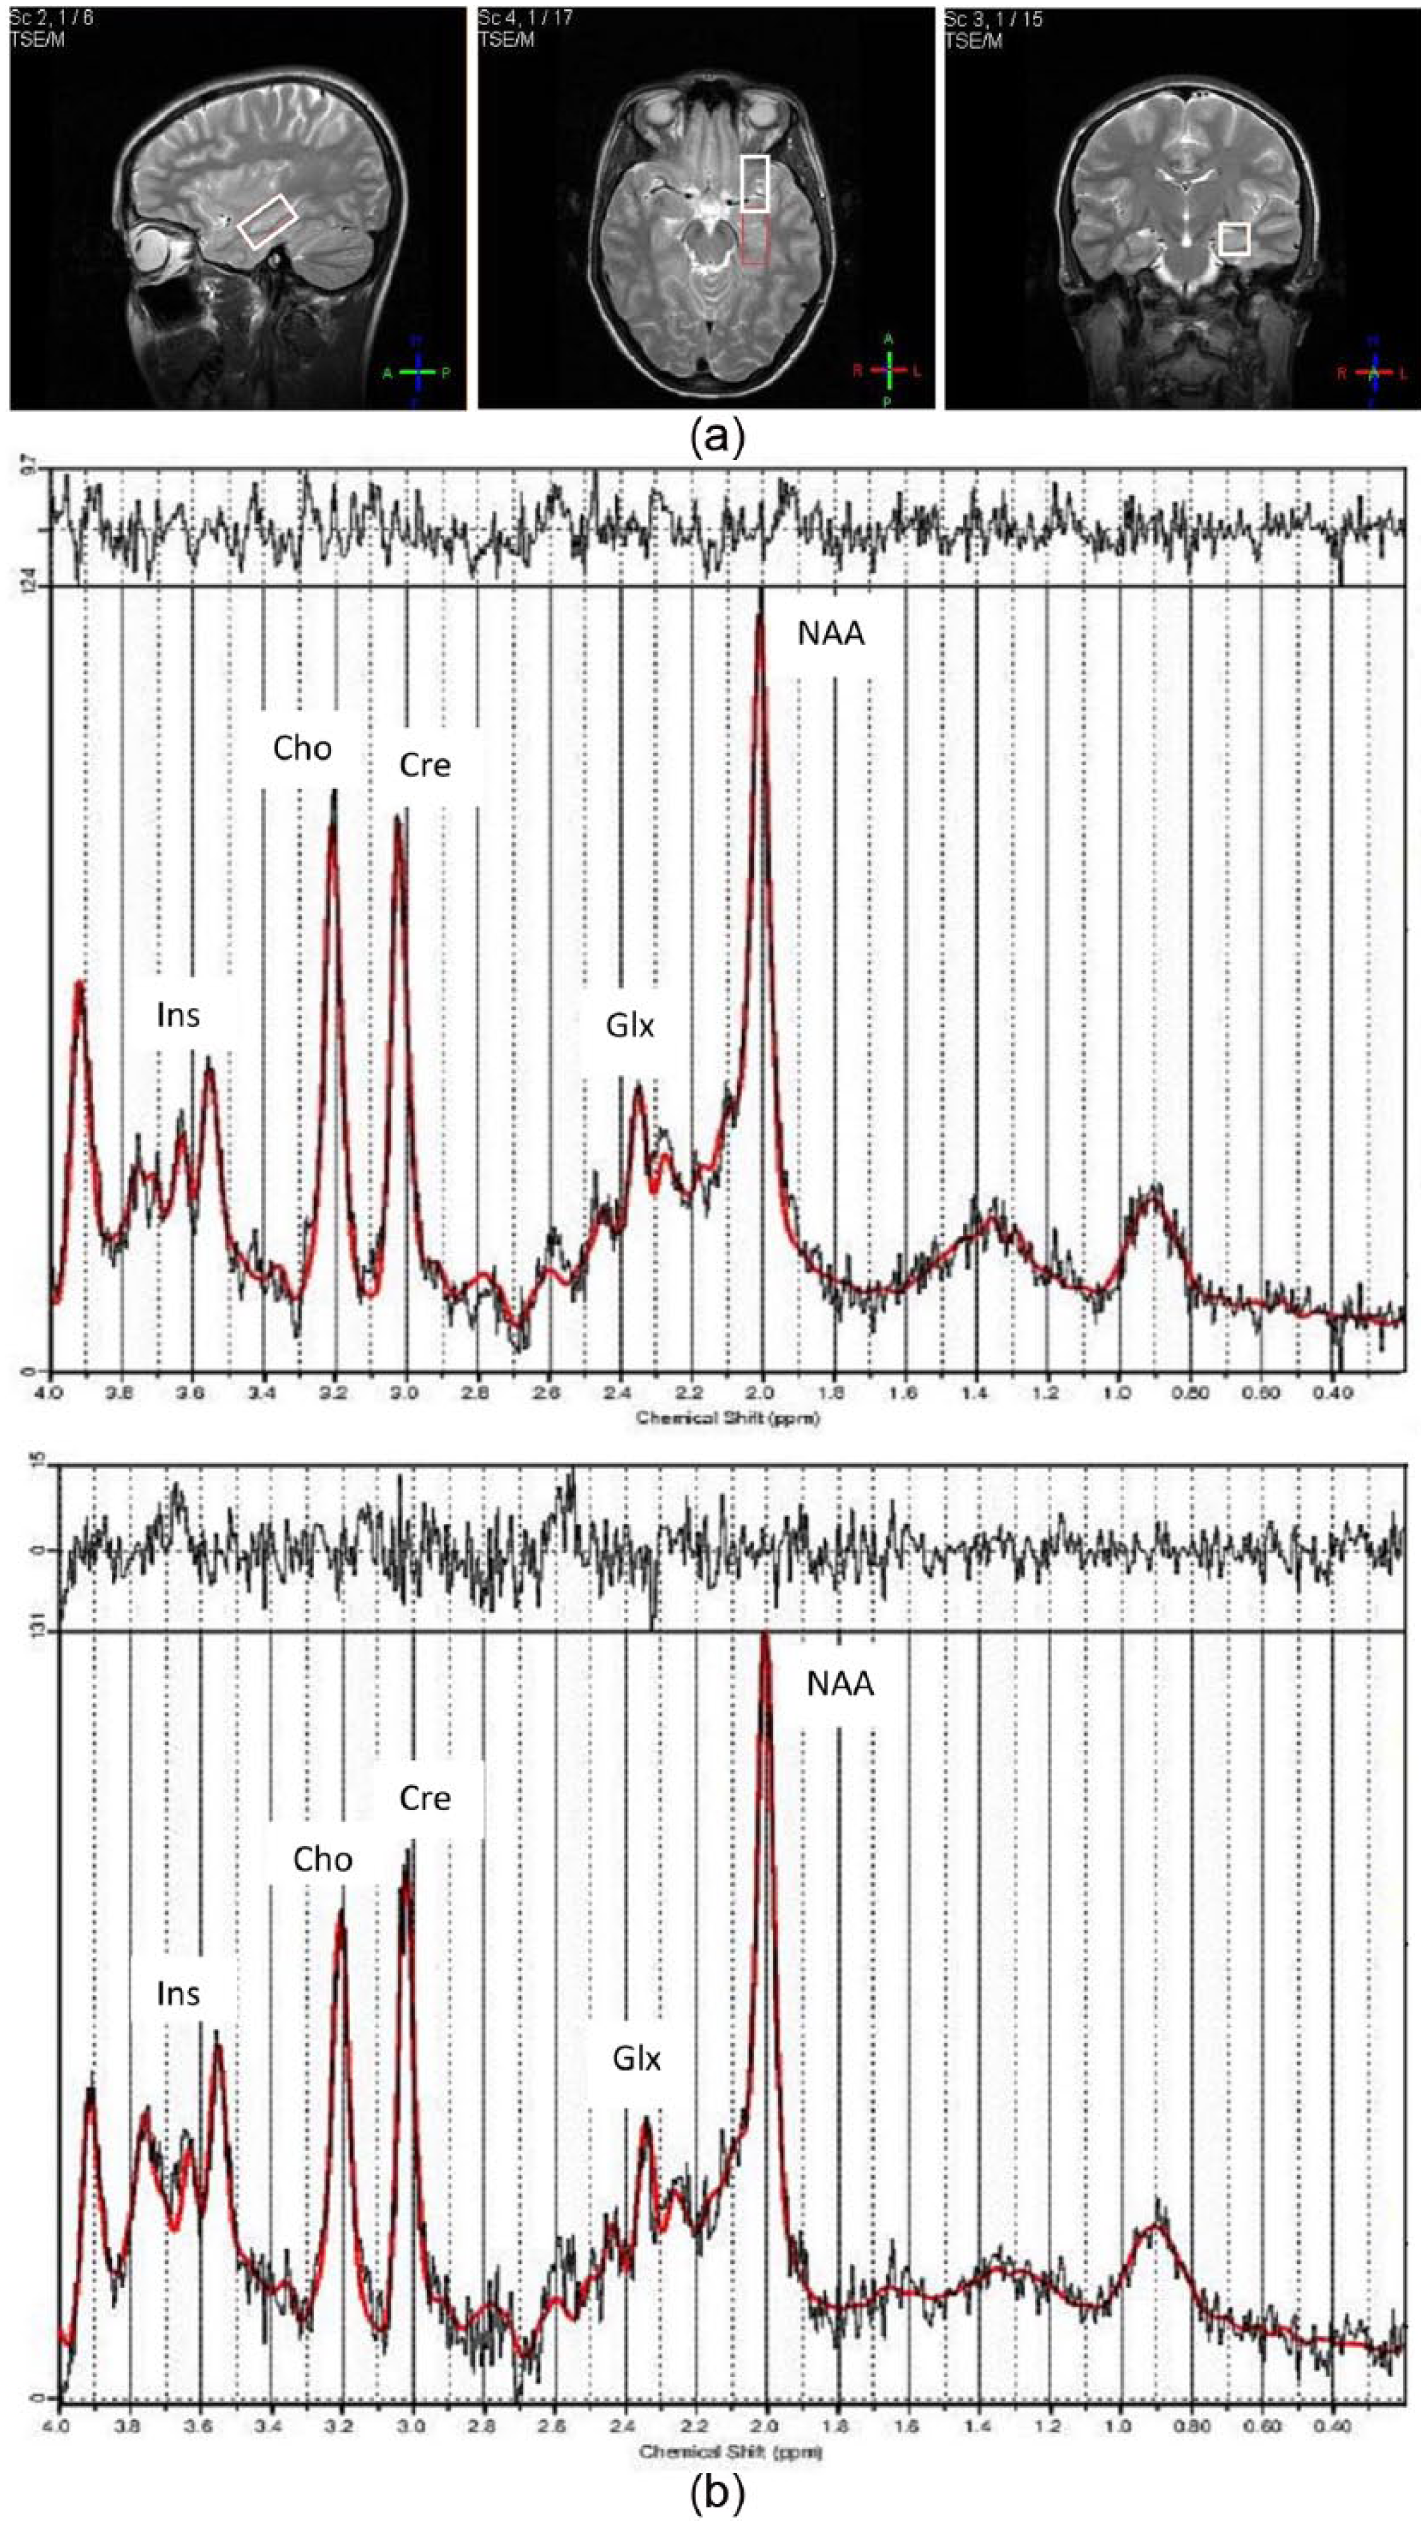
(a) Hippocampal 1H-MRS voxel T2-weighted sagittal, axial and coronal MR images and (b) sample 1H-MRS spectra from a BD patient and a healthy subject.
1H-MRS data were extracted using LCModel v. 6.0 (Provencher, 1993). Figure 1(b) presents a sample of the hippocampal 1H-MRS spectra in a patient and a healthy subject. Relative Glx and NAA concentrations, normalized to the unsuppressed water spectrum, were converted to absolute concentrations by multiplying by the tissue-weighted (GM, WM and CSF) water concentrations in the 1H-MRS voxel and correction factors to account for water and metabolite signal decay during the TE. Values for water and Glx T1 and T2 relaxation times were taken from the literature (Srinivasan et al., 2006). In each spectrum, metabolites with standard deviations (Cramer-Rao lower bounds) greater than 25% were excluded from the analysis. We also excluded subjects whose 1H-MRS spectra were not adequate (presence of artifacts and lipid contamination) based on the simultaneous visual inspection of two authors (L.S. and D.B.). A third author (E.L.M.) was consulted when there was disagreement at the initial evaluation. The levels of NAA and Glx were quantified in patients and healthy subjects at baseline and after 1 year of follow-up. Relevant data about the quality control method is included in the supplementary section (supplementary table). The final NAA and/or Glx concentrations consisted of the average of the concentration of these metabolites from right and left hippocampi. If only one side had a valid concentration value, that value was considered the final metabolite concentration for that particular subject.
Statistical analyses
Statistical analyses were performed using the SPSS for Windows 19.0 (SPSS Inc. Chicago, IL). Sociodemographic variables were examined using t-Tests and Chi- Square as appropriate. Pearson correlation was used to evaluate potential associations between clinical variables and biomarkers. General Linear Model (GLM) for repeated measures was used to investigate the longitudinal differences on brain metabolites over the 1-year follow-up period. Effects of diagnosis (BD vs healthy subjects), time and group-by-time interactions were analyzed. As a secondary analysis, patients were divided into two groups based on the occurrence of any new mood episode within 1 year of follow-up: recurrence (REC) and no recurrence (NREC). The GLM for repeated measures was also used to investigate the potential longitudinal influence on brain metabolites between REC and NREC.
Results
Participants
Forty-one patients and 27 matched healthy subjects had baseline and 1-year 1H-MRS data. Their mean ages were 22.75 ± 4.07 and 22.85 ± 4.92; (p = 0.931), respectively. Twenty (48.78%) patients and 15 (55.55%) healthy subjects were women (p = 0.627). The groups did not differ in terms of education (p = 0.231) and ethnicity (p = 0.377). At baseline, 07 patients had YMRS>7, and 16 patients had MDRS > 7; at one-year visit, 02 patients had YMRS>7, and 6 had MDRS > 7. Other characteristics of the whole sample at baseline and 1-year-follow-up are listed in Table 1.
Demographic and clinical variables for patients and healthy subjects at baseline and at 1-year.
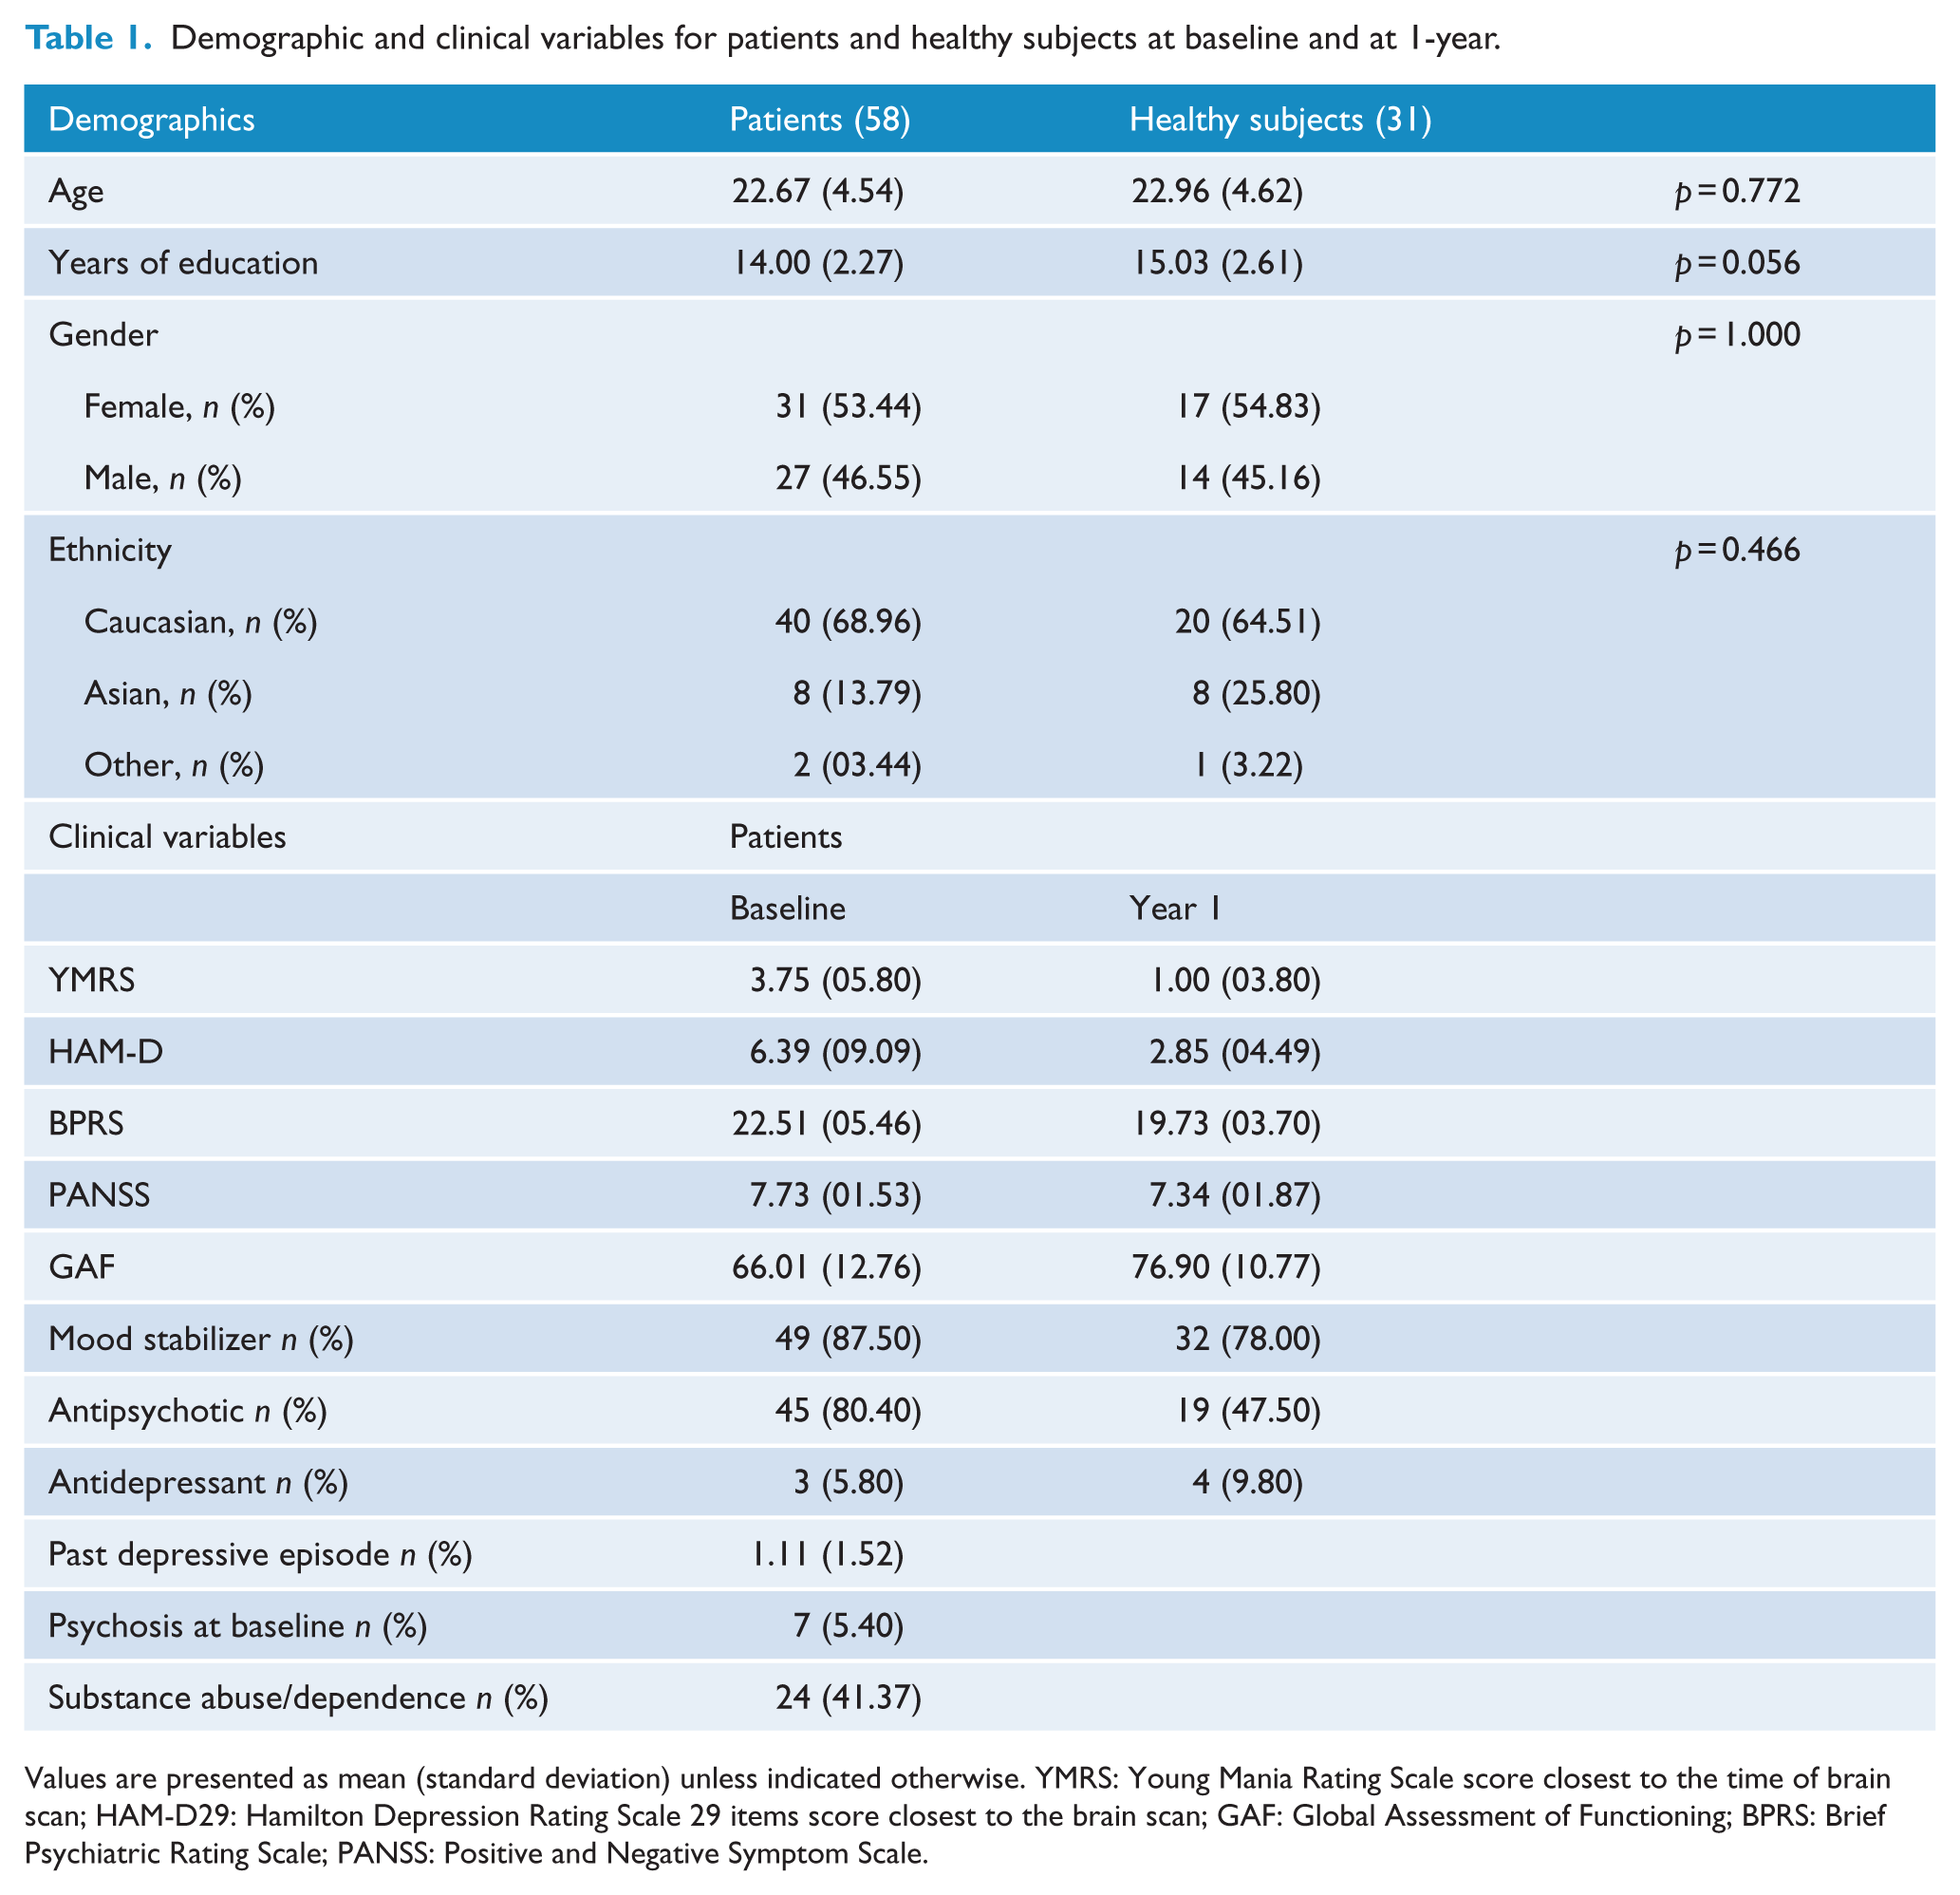
Values are presented as mean (standard deviation) unless indicated otherwise. YMRS: Young Mania Rating Scale score closest to the time of brain scan; HAM-D29: Hamilton Depression Rating Scale 29 items score closest to the brain scan; GAF: Global Assessment of Functioning; BPRS: Brief Psychiatric Rating Scale; PANSS: Positive and Negative Symptom Scale.
Seventeen patients and four healthy subjects had their follow-up MRS excluded due to spectra artifacts, and were excluded from the analyses. They were euthymics at baseline – YMRS: 3.31 (4.37); HAMD29: 3.37 (6.52) – mean (SD). Moreover, their mood scores resulted similar to the included subjects at baseline (YMRS (t(55) = 0.356; p = 0.723, and HAMD (t(55) = 1.480; p = 0.145). 02 excluded patients had both clinical data and MRS, but were excluded due to artifacts on their spectra Using the standard deviation greater than 25% criteria for the metabolite levels, we excluded data from one side of the hippocampus of one patient at one year and one healthy subject at baseline for NAA. For Glx, at baseline, we excluded data from 2 patients and 3 healthy subjects, and at one year we excluded data from 7 patients and 2 healthy subjects.
Hippocampal metabolites measures between patients and healthy subjects
Table 2 presents the mean absolute concentrations of the hippocampal metabolites in the sample. The General Linear Model (GLM) revealed no significant main effect of either group (F(65,2) = 0.291; p = 0.749) or time (F(65,2) = 0.665; p = 0.518), and no significant group-by-time interaction (F(65,2) = 1.304; p = 0.278) on NAA and Glx hippocampal concentrations. As secondary analysis, we analyzed NAA and Glx in separate models, and both results indicated no group-by-time interaction (F(66,1) = 0.182; p = 0.671, and F(66,1) = 2.178; p = 0.145 respectively). At baseline, hippocampal levels were similar between left and right hippocampus for patients NAA (p = 0.563) and Glx (p = 0.165) and healthy subjects NAA (p = 0.265) and Glx (p = 0.762). and the same results were found at one-year visit in patients NAA (p = 0.563) and Glx (p = 0.165) and healthy subjects NAA (p = 0.265) and Glx (p = 0.762).
Patients and healthy subjects Brain Metabolites at baseline and at 1-year.
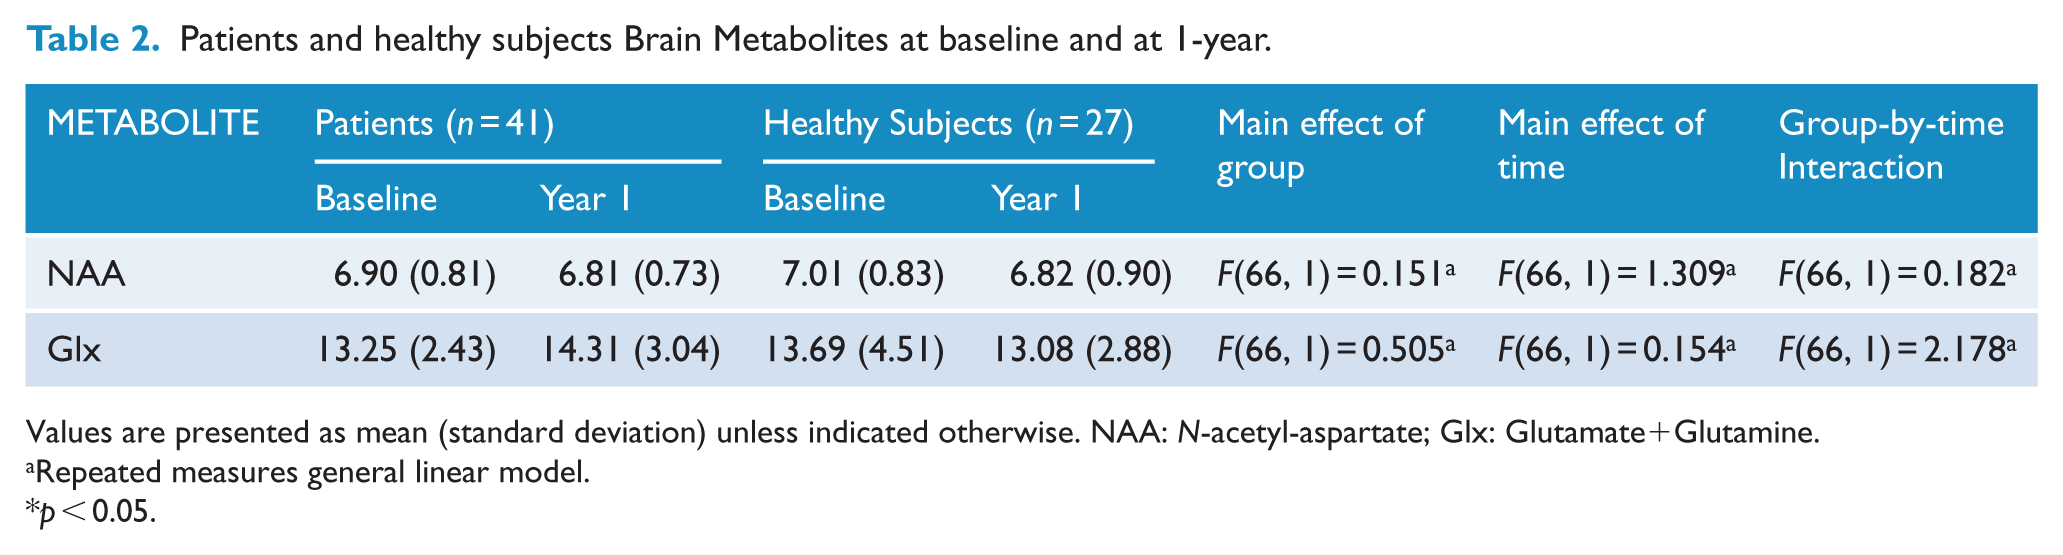
Values are presented as mean (standard deviation) unless indicated otherwise. NAA: N-acetyl-aspartate; Glx: Glutamate+Glutamine.
Repeated measures general linear model.
p < 0.05.
Brain metabolites measures between REC and NREC
At 1-year-follow-up period, 21 (51.21%) were classified as REC and 20 patients (48.78%) were classified as NREC. 20 patients experienced relapses over the follow-up period, including: 10 patients with one depressive episode; 3 patients with one manic episode; 4 patients with one manic and one depressive episode; one patient with one manic and two depressive episodes; one patient with two manic and one depressive episode; and one patient with two manic and two depressive episodes. Ten patients had a hypo/manic episode and 17 patients had a depressive episode. REC and NREC groups had similar years of education (p = 0.423), gender (p = 0.758) and ethnicity (p = 0.097). REC group was older than the NREC group (p = 0.033). On clinical variables, REC group had more depressive symptoms at baseline (p = 0.020) and at 1-year-follow-up (p = 0.047) compared to the NREC group. Analyzing medications, both groups had similar pattern of prescription in terms of lithium (p = 0.320), valproate (p = 0.527) and a trend toward more use of antipsychotics (p = 0.056), combination of mood stabilizer and antipsychotics (p = 0.054) and antidepressants (p = 0.091) in the REC group at 1-year visit.
As to the NAA and Glx in REC and NREC groups, we did not find group-by-time interactions within 1-year-follow-up study, F(36, 2) = 0.025; p = 0.976. Furthermore, the GLM for repeated measure could not find interaction between the follow-up period and: use of Lithium, F(35, 2) = 1.610; p = 0.214; use of Valproate, F(35, 2) = 2.905; p = 0.068, use of antipsychotics, F(35,2) = 0.306; p = 0.738, and use of a combination of a mood stabilizer plus an antipsychotic, F(35, 2) = 0.146; p = 0.865.
Even though both groups improved on their psychosocial functioning within 1 year, REC group had significantly lower GAF scores compared to the NREC group at baseline (p = 0.045) and 1-year-follow-up visit (p = 0.014) (Figure 2).
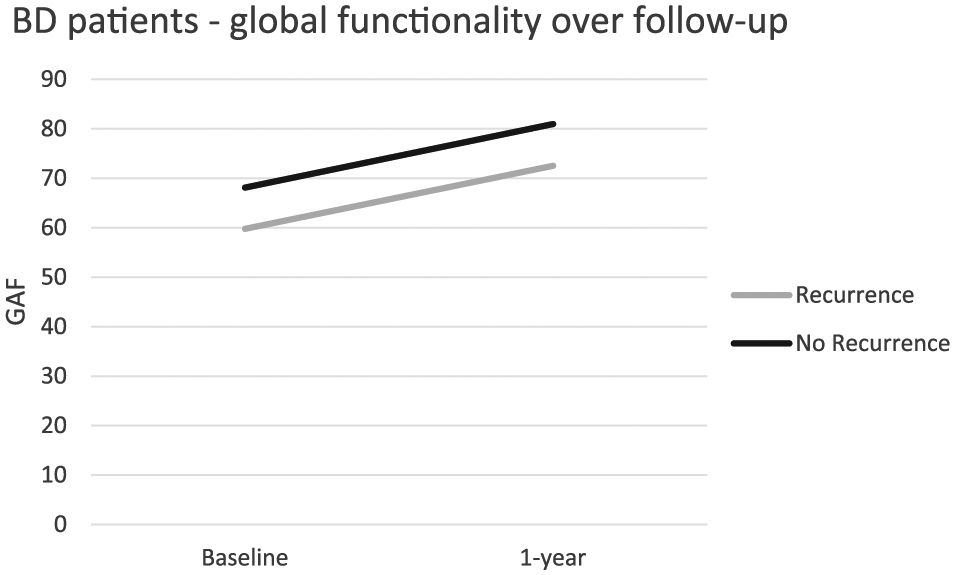
Global assessment of functioning over 1 year of follow-up period between patients who had a recurrence of BD and patients who remained euthymic.
Discussion
Here, we expanded the results from our previous cross-sectional study (Gigante et al., 2014) by longitudinally examining hippocampal neurochemistry (e.g. Glx and NAA) in patients with BD recruited within 3 months after recovery from their first-manic episode and healthy subjects. Our main findings were that Glx and NAA levels were no different between BD patients and matched health subjects at baseline, and that the levels did not change differentially during the 1-year follow-up period in BD patients compared with controls. Further, Glx and NAA levels were no different between the REC and the NREC BD groups. These results lend support to the report by Gigante (Gigante et al., 2014) showing that there are no abnormalities in Glx and NAA levels in the hippocampus of patients with BD in the early stage of the illness.
The observation that hippocampal Glx and NAA levels did not differ between patients and healthy controls is interesting in light of positive results from other studies (Atmaca et al., 2006; Blasi et al., 2004). Atmaca et al. (2006) showed that first-episode patients with BD had a significant bilateral reduction of NAA/creatine plus phosphocreatine (Cr) and of NAA/choline-containing compounds (Cho) in the hippocampus compared to the control group. Additionally, this study found an association between severity of manic symptoms and NAA levels. Similarly, Blasi et al. (2004) found that first-episode patients with psychotic symptoms exhibit lower NAA/Cr levels than healthy subjects in the hippocampus. These studies evaluated patients during acute mood episode, which might have contributed to alterations in brain metabolites concentrations. Our study included mostly euthymic patients on both end-points. Furthermore, as demonstrated in previous studies, it is plausible that changes in brain metabolites may occur alongside with the progression of the illness (Bertolino et al., 2003; Dager et al., 2004; Deicken et al., 2003). Therefore, early in the illness, even though brain chemistry might change during mood episodes, it normalizes as patients improve. Our results report brain metabolites’ absolute concentration. Thus, another possible explanation for the discrepancy between our results and other studies could be that the majority of previous studies reported metabolite concentrations as ratios to creatine plus phosphocreatine (Cr) or choline-containing compounds (Cho), both of which may be affected by the pathology and could amplify the differences in the reported ratios.
If Glx and NAA levels are unaltered in early stages of BD, this lends support to the neuroprogression hypothesis of BD, as levels of these metabolites are altered in unselected BD patients which likely included patients in later stages of the illness. Recent literature suggests that having more mood episodes is associated with neuroanatomical changes, which includes ventricular enlargement (Strakowski et al., 2002) and progressive loss of GM thickness (Ekman et al., 2010). The Allostatic Load (AL) in BD was proposed as the cumulative effect of the physiologic machinery required for forcing adaptation facing stress, viewed here as mood episodes (Kapczinski et al., 2008), suggesting that mood episodes are neurotoxic. Neurotrophins and inflammatory cytokines are of great interest in BD and widely studied. Proinflammatory cytokines are increased in manic and depressive episodes. In particular, interleukin (IL)-6 is positively correlated with manic and depressive scores on rating scales (Brietzke et al., 2009). Tumore necrosis factor (TNF)-α is thought to have a key role in BD, and serum levels increase during mood episodes. It has been suggested that this cytokine regulates apoptotic cascades (Brietzke and Kapczinski, 2008). IL-6, IL-10 and TNF-α levels are increased in early stages of BD in comparison to healthy subjects. Late stages BD patients show increased levels of TNF-α and reduced levels of IL-6 (Kauer-Sant’Anna et al., 2009). Brain-Derived Neurotrophic Factor (BDNF) levels were negatively correlated with manic symptoms severity (Cunha et al., 2006). BDNF levels were found to decrease with the progression of BD and were negatively correlated with length of illness (Kauer-Sant’Anna et al., 2009). Moreover, it has been suggested that the process of energy generation in patients with BD is impaired, eventually leading to oxidative stress (Brown et al., 2014). Antioxidant enzymes’ (superoxide dismutase) activities are increased during mood episodes (Brown et al., 2014). The activity of glutathione reductase is increased in late stages of BD (Brown et al., 2014). These changes in oxidative parameters may contribute to a progressive failure of compensatory mechanisms with illness progression (Berk et al., 2011b). From the cellular-functioning perspective, the illness progression can be conceived as the failure of the resilience mechanisms. BD patients exhibit impaired endoplasmic reticulum response to stress, and such impairment seems to be more pronounced in patients in the late stages of the illness (Pfaffenseller et al., 2014). Moreover, early apoptosis was detected in the peripheral blood mononuclear cells of BD patients (Fries et al., 2014).
Therefore, mood episodes are toxic and have a progressive and cumulative impact on the severity of BD. Consistent evidence shows that the course of BD is associated with modifications in response to treatment. Not only the duration of BD but also, and more importantly, the number of episodes is associated with progressive lack of efficacy with pharmacological and surprisingly psychotherapy treatment (Berk et al., 2011a; Scott et al., 2006; Swann et al., 1999). In line with this, our findings suggest that patients early in the illness and receiving optimal treatment are relatively preserved from the neurobiological perspective. Thus, our study findings provide a compelling rationale for early intervention to arrest disease progression in BD. We also found a significant improvement in global functioning in the whole sample over the 1-year period, as indicated by an increase of overall GAF score from baseline to endpoint. In addition, NREC patients are more likely to present functional recovery than REC group. Evidence that such functional impairment may be a consequence of the severity of the illness (e.g. number of episodes) is supported by several studies on first-manic episode of BD (Rosa et al., 2012; Tohen et al., 2003). Additionally, López-Jaramillo et al. (2010) showed that BD patients who had just one manic episode experience favorable cognitive functioning while those individuals with three more mania have long-term cognitive deficits. Comparing neurocognitive performance between patients with low and high functioning, Martínez-Arán et al. (2007) showed that those patients with low functioning were significantly more impaired on memory tasks, inhibitory control and working memory. Furthermore, it has recently been shown that a strong linear association exists between functioning and clinical stages of BD, which suggests a progressive functional decline from the early to advanced stages of disorder (Rosa et al., 2014).
This study has some limitations. First, we assessed only Glx and NAA levels in the hippocampus, which precludes us from drawing conclusions about other metabolites in different areas of the brain. Second, although all patients were on treatment according to internationally recognized clinical guidelines, which provided good clinical response in our sample, some medications (e.g. olanzapine, quetiapine and lithium) might influence brain metabolites levels (Adler et al., 2013; DelBello et al., 2006). However, when these medications were introduced as covariates to the analyses in this study, the results remained the same.
In conclusion, we did not find differences in Glx and NAA levels in the hippocampus either at baseline or at 1-year-follow-up between healthy controls and patients with BD when they are recovered from the first-manic episode. These findings may be explained by the fact that our patients were in the early stage of the illness and might not be affected by variables of the progression of the disorder (e.g. mood episodes, duration of illness, medications). Finally, our results highlight the importance of early interventions in order to arrest disease progression in BD.
Footnotes
Declaration of Conflicting Interests
The author(s) declared the following potential conflicts of interest with respect to the research, authorship, and/or publication of this article: Dr. Bond has received speaking fees or sat on advisory boards for: the Canadian Network for Mood and Anxiety Treatments (CANMAT), the Canadian Psychiatric Association, Pfizer, Sunovion, BMS, Otsuka, Astra-Zeneca, and Janssen-Ortho; and has received research support from: the Canadian Institutes of Health Research (CIHR), the UBC Institute of Mental Health/Coast Capital Depression Research Fund, and Pfizer. Dr. Lam: Ad Hoc Speaker Honoraria: Astra-Zeneca, Canadian Psychiatric Association, Canadian Network for Mood and Anxiety Treatments, Lundbeck, Lundbeck Institute, Otsuka, Servier. Ad Hoc Consulting/Advisory Boards: Bristol Myers Squibb, Canadian Network for Mood and Anxiety Treatments, Eli Lilly, Lundbeck, Mochida, Pfizer, Takeda. Research Funds (through UBC): Bristol Myers Squibb, Canadian Institutes of Health Research, Canadian Network for Mood and Anxiety Treatments, Coast Capital Savings, Lundbeck, Pfizer, St. Jude Medical, University Health Network, Vancouver Coastal Health Research Institute. Patents/Copyrights: Lam Employment Absence and Productivity Scale (LEAPS). Book Royalties: Cambridge University Press, Informa Press, Oxford University Press. Stock/Stock Options: None. Gifts/Travel (unrelated to speaker expenses): None. Dr. Yatham has been a member of advisory board and/or received research grants, and/or been a speaker for Astra-Zeneca, Janssen, Lilly, GSK, Bristol Myers Squibb, Novartis, Servier, Sunovion, and Pfizer; and has received research grants from CIHR. Dr. Torres has received funding from CIHR and has consulted with Lundbeck Canada. Drs. Silveira and Muralidharan as well as Joana Bucker and Jan M Kozicky report no disclaimers. Dr. Adriane R Rosa has served as speaker for Eli Lilly. Dr. Kapczinski has received research support from or served as a consultant or speaker for Astra-Zeneca, CNPq, CAPES, Eli Lilly, Janssen, Janssen-Cilag, NARSAD, Stanley Medical Research Institute, and Servier; has been a member of the board of speakers for Astra-Zeneca, Eli Lilly, Janssen and Servier; and has served as a consultant for Servier. Dr. MacMillan has served as a consultant for F. Hoffmann-La Roche Ltd.
Funding
The author(s) disclosed receipt of the following financial support for the research, authorship, and/or publication of this article: The data for this study were extracted from the STOP-EM Program which was supported by an unrestricted grant to Dr. Lakshmi N. Yatham from Astra-Zeneca. Dr. Rosa is grateful for the support provided by the L’Oréal Brasil, Academia Brasileira de Ciências, and Comissão Nacional da UNESCO, ‘For Women in Science’ and CNPq, programa ciência sem fronteiras, modalidade jovem talento. The funding sources had no further role in study design; in the collection, analysis and interpretation of data; in the writing of the report; and in the decision to submit the paper for publication.