
Abstract
Objective:
The aim of this study was to identify the prevalence of parent-reported autism spectrum disorder diagnosis in Australia, and examine the developmental profile of children with autism spectrum disorder compared to their peers.
Design/Setting:
Secondary analyses were undertaken on data from the Longitudinal Study of Australian Children.
Participants:
Children were recruited at kindergarten (K cohort) and birth (B cohort), and subsequently completed two-yearly ‘waves’ of assessments.
Main Outcomes:
Autism spectrum disorder diagnostic status was ascertained at Wave 4 along with age of diagnosis by parent report. Standardised tools were used to assess children’s quality of life, behaviour, receptive vocabulary and non-verbal intelligence.
Results:
Prevalence of autism spectrum disorder was 2.5% (95% confidence interval = [2.0, 3.0]) in the B cohort compared to 1.5% (95% confidence interval = [1.2, 2.0]) in the K cohort. In both cohorts, children with autism spectrum disorder had poorer mean quality of life, emotional-behavioural functioning and receptive vocabulary compared with non-autism spectrum disorder peers, and a higher proportion of children with autism spectrum disorder had problems in these areas. However, between 6% and 9% of children with moderate to severe autism spectrum disorder and 12–20% with mild autism spectrum disorder were not reported to have problems with social interaction.
Conclusion:
The prevalence of a parent-reported diagnosis of autism spectrum disorder before age 7 in Australia was higher in the B cohort. Data from future Longitudinal Study of Australian Children waves will clarify whether autism spectrum disorder has been diagnosed earlier in the B cohort or if there is a continued increase in prevalence. Future waves will also provide crucial information about the types and severity of problems experienced during the primary and secondary school years which will assist service planning.
Keywords
Introduction
Autism Spectrum Disorder (ASD) is a neurodevelopmental disorder characterised by deficits in social communication and restricted or repetitive interests and behaviours which are present in more than one setting, begin in childhood and persist over time (American Psychiatric Association [APA], 2013). Diagnosis is based on observed and reported behaviours. Wide variation in diagnostic practice has been reported in relation to the type and number of professionals involved in diagnostic assessment and the measures used (Skellern et al., 2005). Children with severe ASD are usually diagnosed in the preschool years (Wiggins et al., 2006). However, the severity and expression of autism characteristics vary between individuals with ASD, which influences timing of diagnosis (Barbaro and Dissanayake, 2009). In addition to the defining characteristics, many children with ASD also experience poorer quality of life (QoL), emotional and other behavioural difficulties, such as conduct problems and hyperactivity (Iizuka et al., 2010; Kuhlthau et al., 2010; Russell et al., 2013; Van Heijst and Geurts, 2015; Vivanti et al., 2013) and limitations in specific cognitive and language abilities or have intellectual disability (Charman et al., 2011; Happé et al., 2006; Tager-Flusberg et al., 2005).
Until the early 1990s, autism was believed to affect between 2–7/10,000 children (Elsabbagh et al., 2012). Studies since then have reported varying but generally higher prevalence. In Australia, prevalence estimates between 2008 and 2014 have ranged from 5–10/1000 (Atladottir et al., 2014; Barbaro and Dissanayake, 2010; Williams et al., 2008). In the United States, the Centres for Disease Control and Prevention (CDC) has reported a prevalence of 1.5% in 8-year-olds from school surveillance and 2% from parent report of children aged 6–17 years (Centers for Disease Control and Prevention, 2014). The highest reported population prevalence internationally is 2.6% of 7- to 12-year-olds from South Korea (Kim et al., 2011). Variation in reported prevalence within and between regions exists, even for studies reporting data from the same country and using the same methods as reported in a systematic review (Elsabbagh et al., 2012) and recent reports of prevalence from the United States (CDC, 2014). Factors thought to be contributing to variation include the age of included children diagnostic criteria used and recruitment methods (Baxter et al., 2014; Wazana et al., 2007). Studies have tried to disentangle factors that may be contributing to the increase in reported prevalence. A recent study from Sweden compared the prevalence of ASD phenotype in twins to children who were on a national register for ASD. This study found that ASD traits did not increase over time, but the number of children with a formal diagnosis of ASD did, thus concluding that administrative changes (e.g. funding available for a diagnosis of ASD) were likely responsible for the increase in prevalence (Lundstrom et al., 2015). Other studies, including a recent publication from the United States (Van Naarden Braun et al., 2015), have explored ASD with and without intellectual disability and the possibility of diagnostic substitution between intellectual disability and ASD. Some studies have found the prevalence of ASD in adults to be similar to that in children when previously undiagnosed adults were investigated for autism characteristics (Brugha et al., 2011). However, whether there has been an increase in prevalence due to administrative and diagnostic changes rather than a true increase in ASD characteristics over recent years is still debated.
A large nationally representative study of growth and development, the Longitudinal Study of Australian Children (LSAC), commenced in 2004 following two cohorts (~N = 5000 in each) of children at two yearly intervals, called waves. Cohort B was recruited at birth (0–1 years) in 2004–2005 and Cohort K at preschool (4–5 years), born in 1999–2000 (Gray & Sanson, 2005); (Soloff, Lawrence & Johnstone, 2005). In the fourth wave of data collection (in 2010–2011), when the children were 6–7 years and 10–11 years old, respectively, parents were asked if their child had been diagnosed with an ASD and if so, the age and severity of diagnosis. Children’s QoL, behavioural strengths and difficulties, receptive vocabulary abilities and cognitive development were also measured.
Using the LSAC data we aimed to estimate the prevalence of parent-reported diagnosis of ASD and its relationship to demographic and socio-economic status (SES) variables in Australia, as well as age of diagnosis. We also examined to what extent children with ASD experience associated difficulties compared to same-aged peers without ASD in the two cohorts.
Methods
Study design
LSAC was designed to be representative of Australian children within cohort, comparative to the regional distribution of children in the Australian population. Children were recruited in 2004 using a two-stage cluster sampling design (Gray and Sanson, 2005; Soloff, et al., 2005). In stage 1, postcodes were sampled (except for the most remote) following stratification by state of residence and urban versus rural status. In stage 2, children were sampled from the Australian Medicare database, in which the majority (>98%) of Australian children are enrolled. A total of 64% of the B cohort (n = 5107) and 59% of the K cohort (n = 4983) were recruited into the study. LSAC has been shown to be largely representative of the Australian population although it is slightly under-representative of single parent and non-English speaking families, as well as families living in rental properties. Retention at Wave 4 was 83% (n = 4239) and 84% (n = 4161) for the B and K cohorts respectively. For comparisons of children at the age of 6–7 years, Wave 4 data were used for the B cohort and Wave 2 for the K cohort.
Measures
ASD status was assessed during parent interview, where the primary caregiver was asked: ‘Does your child have any of these ongoing conditions?’ from which parents could select ‘Autism, Aspergers, or other ASD’ from the list provided. If parents responded ‘yes’ to any of these, the child was classified as having an ASD. Parents were also asked the child’s age at diagnosis and to rate his/her severity as mild/moderate/severe. No assessments were performed to validate the diagnosis.
QoL was assessed using the 23-item Pediatric Quality of Life Inventory (PedsQL 4.0 - Parent Report Form) (Varni et al., 2003). The PedsQL 4.0 has demonstrated validity and reliability as a measure of health-related QoL for the paediatric population (Varni et al., 2003). It comprises 23 items which measure health across four domains: physical, emotional, social and school functioning. Parents or the child is asked to rate how much of a problem each item has been during the past 1 month. A 5-point scale is used to rate responses where a rating of 0 means the item is never a problem, and a rating of 4 means the item is almost always a problem. Examples of items are as follows: ‘It is hard for me to take a bath or shower by myself’ (physical functioning), ‘I have trouble sleeping’ (emotional functioning), ‘Other kids do not want to be my friend’ (social functioning), and ‘I have trouble keeping up with my schoolwork’ (school functioning). Items are reverse scored and linearly translated to a 100-point scale so that higher scores represent better health-related QoL. Huang et al. (2009) found that parent proxy report on the PedsQL 4.0 discriminated between children with special health-care needs and with moderate and major chronic conditions, as compared to healthy children. McCarthy et al. (2005) also reported that parent proxy report on the PedsQL 4.0 was sensitive to differences in cognitive function and health–related QoL for children hospitalised with different types and severities of traumatic brain injury.
A recent critical review of QoL tools used in studies of children with ASD found that the PedsQL was the most frequently used tool and the only tool in which reliability and validity were established for ASD. Significant correlations were reported between the PedsQL and measures of ASD symptoms and functional impairments, most frequently the psychosocial health summary score or social functioning subtest of that score. However, discriminative validity is not yet available and the studies have also included young people that are older than the LSAC cohort (Ikeda et al., 2014).
In addition to analysing PedsQL 4.0 scores obtained by parent proxy report, we also dichotomised two items from the social subscale (difficulty getting along with other kids; other kids not wanting to be friends) in order to report children ‘often’ or ‘almost always’ experiencing difficulties in these domains versus those ‘never’, ‘almost never’ or ‘sometimes’ experiencing difficulties.
Behaviour was assessed using the Strengths and Difficulties Questionnaire (SDQ), a well-validated 25-item parent- and teacher-reported measure (Goodman, 1997) that produces five subscale scores (range: 0–10), and a total difficulties score (range: 0–40). The subscales include emotional symptoms (e.g. ‘many worries or often seems worried’), conduct problems (e.g. ‘often fights with other children’), hyperactivity (e.g. ‘constantly fidgeting or squirming’), peer relationship problems (e.g. rather solitary, tends to play alone) and prosocial behaviour (‘shares readily with other children’). Higher scores indicate more difficulties, except for the prosocial subscale (Goodman, 1997). For the parent- and teacher-reported peer problems and prosocial behaviour subscales, we used well-established cut-points (Goodman, 1997) to define children as scoring in the ‘clinical’ versus ‘non-clinical’ range. The performance of children with ASD on the SDQ has been reported in a number of studies (e.g. Iizuka et al., 2010; Russell et al., 2013). These studies have found that children with ASD have more difficulties than controls and children with other co-morbidities in the areas of peer problems and prosocial behaviour.
Receptive vocabulary was assessed with the short-version of the Peabody Picture Vocabulary Test Third Edition (PPVT-III) (Dunn and Dunn, 1997). The short-version of the PPVT-III is an Australian adapted version where the number of vocabulary items in the tool was reduced and the administration procedure was changed (Growing up in Australia: The Longitudinal Study of Australian Children, 2005). The tool’s reliability has been reported to be 0.76. Using internal cut-points, we created two dichotomous variables to indicate: (1) children performing <16th percentile versus the remainder of the sample and (2) children performing <2nd percentile versus the remainder of the sample.
Non-verbal cognition was assessed using the 35-item matrix reasoning subtest from the Wechsler Intelligence Scale for Children IV (WISC IV) (Wechsler, 2003). Studies have shown that this subtest is highly correlated with the Perceptual Reasoning Index and Full Scale IQ generated from the WISC IV (Wechsler, 2003). Raw scores were converted to scaled scores (mean: 10; standard deviation: 3). We created a dichotomous variable to indicate children performing below average on this measure (⩽7) versus those with at least average performance (⩾8).
Demographic information was collected from the primary caregiver as shown in Table 1. Neighbourhood socio-economic disadvantage was measured using the Socio-Economic Indexes for Areas Disadvantage Index (SEIFA) corresponding to the family’s postcode of residence (ABS, 2013). SEIFA scores summarise the socio-economic advantage and disadvantage of areas using information from the Census of Population and Housing including income, educational attainment and unemployment (ABS, 2013). The index has a mean of 1000 and a standard deviation of 100, with higher scores indicating greater advantage. Geographic remoteness (dichotomised to very remote/remote or non-remote) was classified using the Accessibility/Remoteness Index of Australia (Department of Health and Aged Care, 2001).
Sample characteristics for children with and without ASD at 6–7 years. a
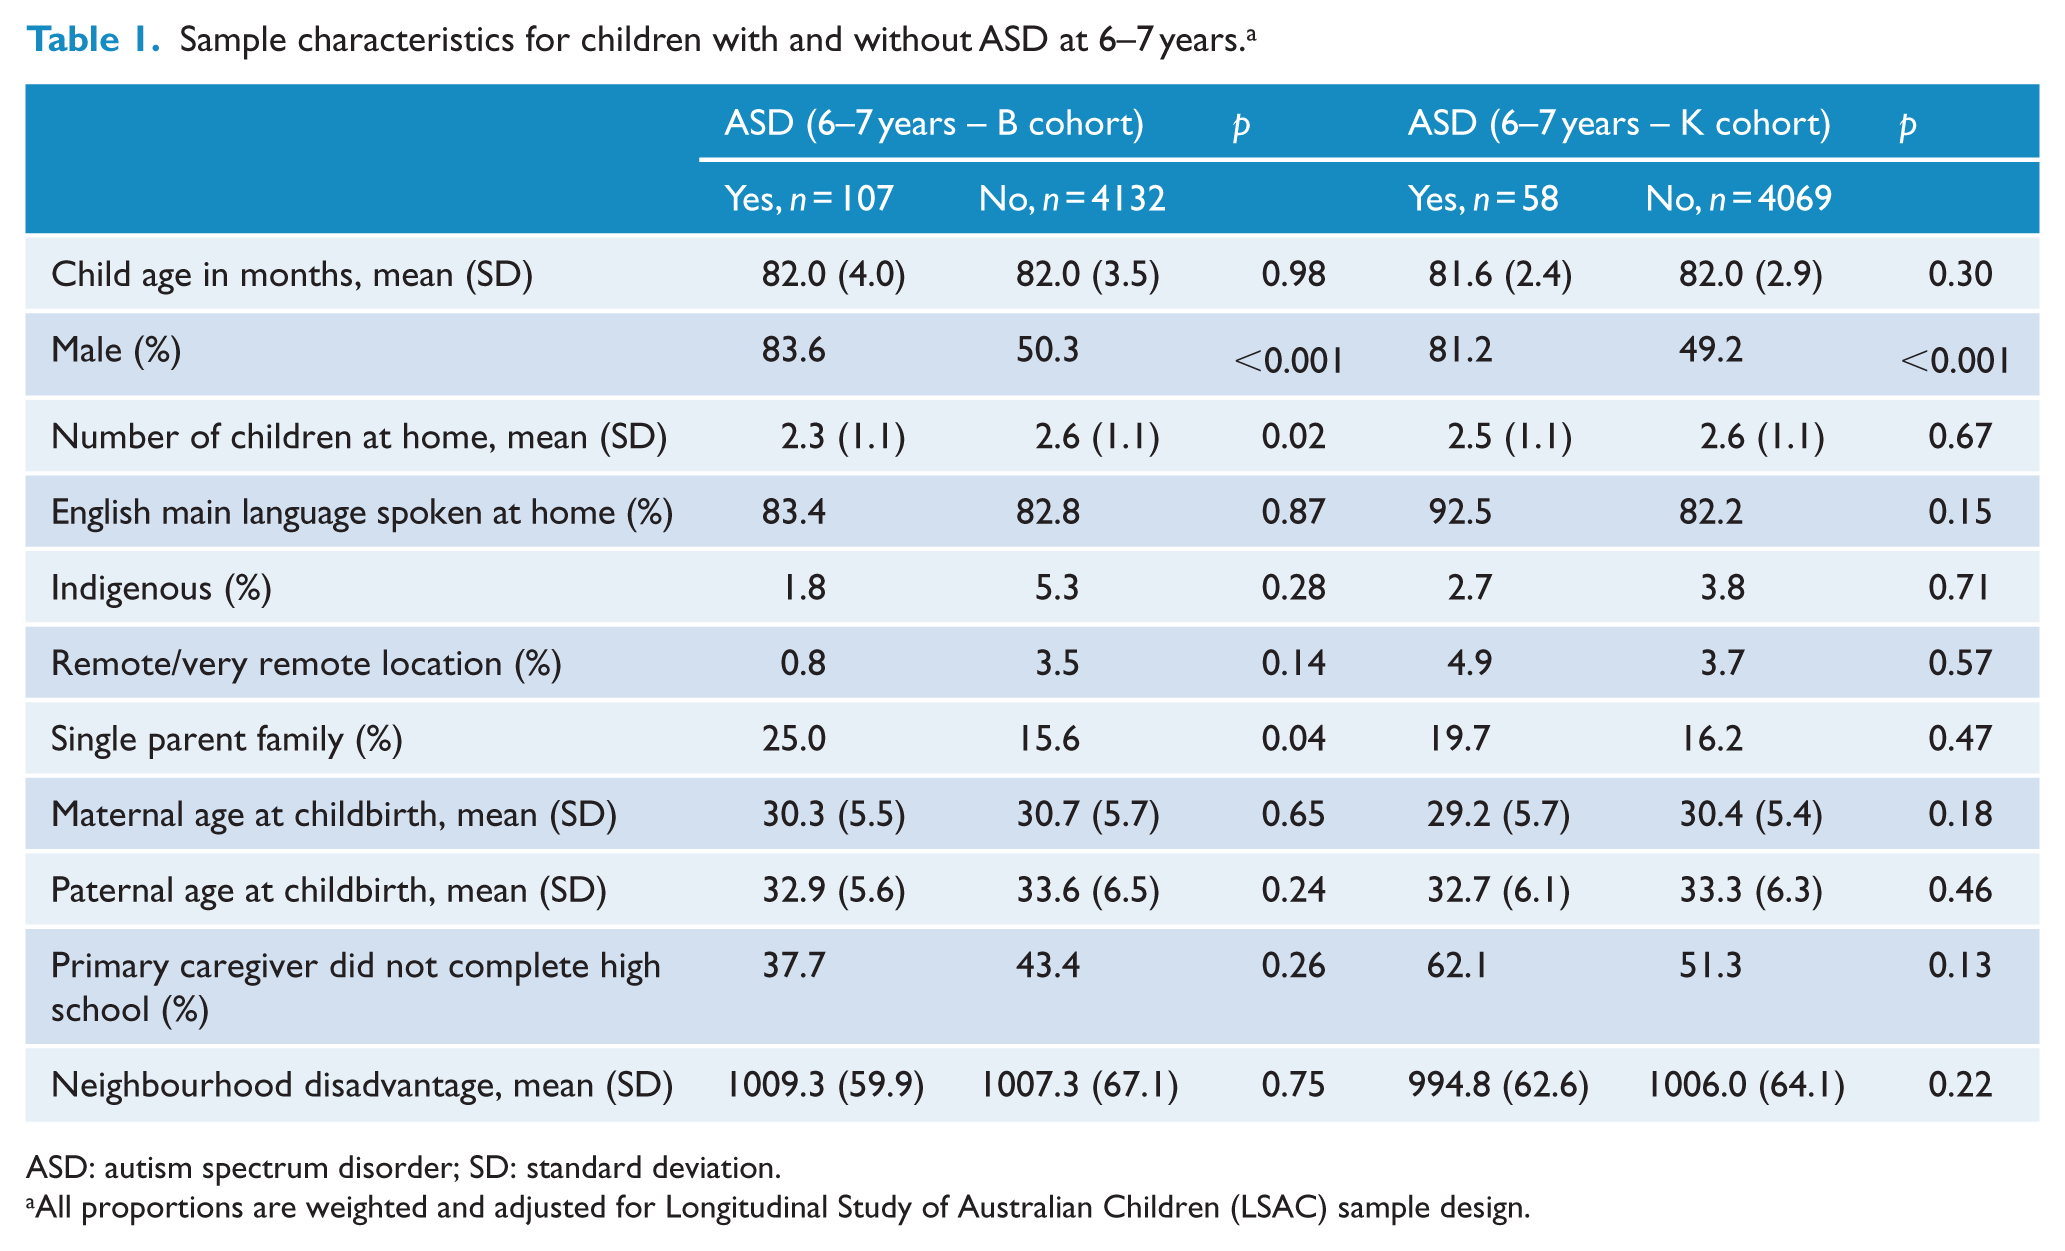
ASD: autism spectrum disorder; SD: standard deviation.
All proportions are weighted and adjusted for Longitudinal Study of Australian Children (LSAC) sample design.
One or more social problems were identified by creating a composite category for children who scored in the problematic range for any social questions for the PedsQL and for either the parent- or teacher-reported SDQ, as defined above.
Procedure
At each LSAC wave, trained interviewers administered a face-to-face interview with the primary caregiver in the family home, supplemented by direct assessments of children and administration of parent and teacher surveys. The LSAC study is approved by the Australian Institute of Family Studies Ethics Committee, and parents provide written informed consent. Permission was granted to use the LSAC data for addressing the current study aims.
Analyses
Summary statistics were used to describe parent-reported ASD prevalence and characteristics for each cohort. A series of unadjusted linear regression analyses were conducted to examine the association between ASD status and QoL, cognitive functioning, behaviour, and receptive vocabulary for children at the age of 6–7 years in both the B and the K cohorts, separately (see Tables 2 and 3). Analyses were then re-run in adjusted linear regression models using a priori confounders (listed in Table 1). Given the similarity between unadjusted and adjusted findings, we report the adjusted findings.
Adjusted differences in functioning between children ASD and non-ASD controls at 6–7 years restricted to those diagnosed before the age of 7 (B cohort).
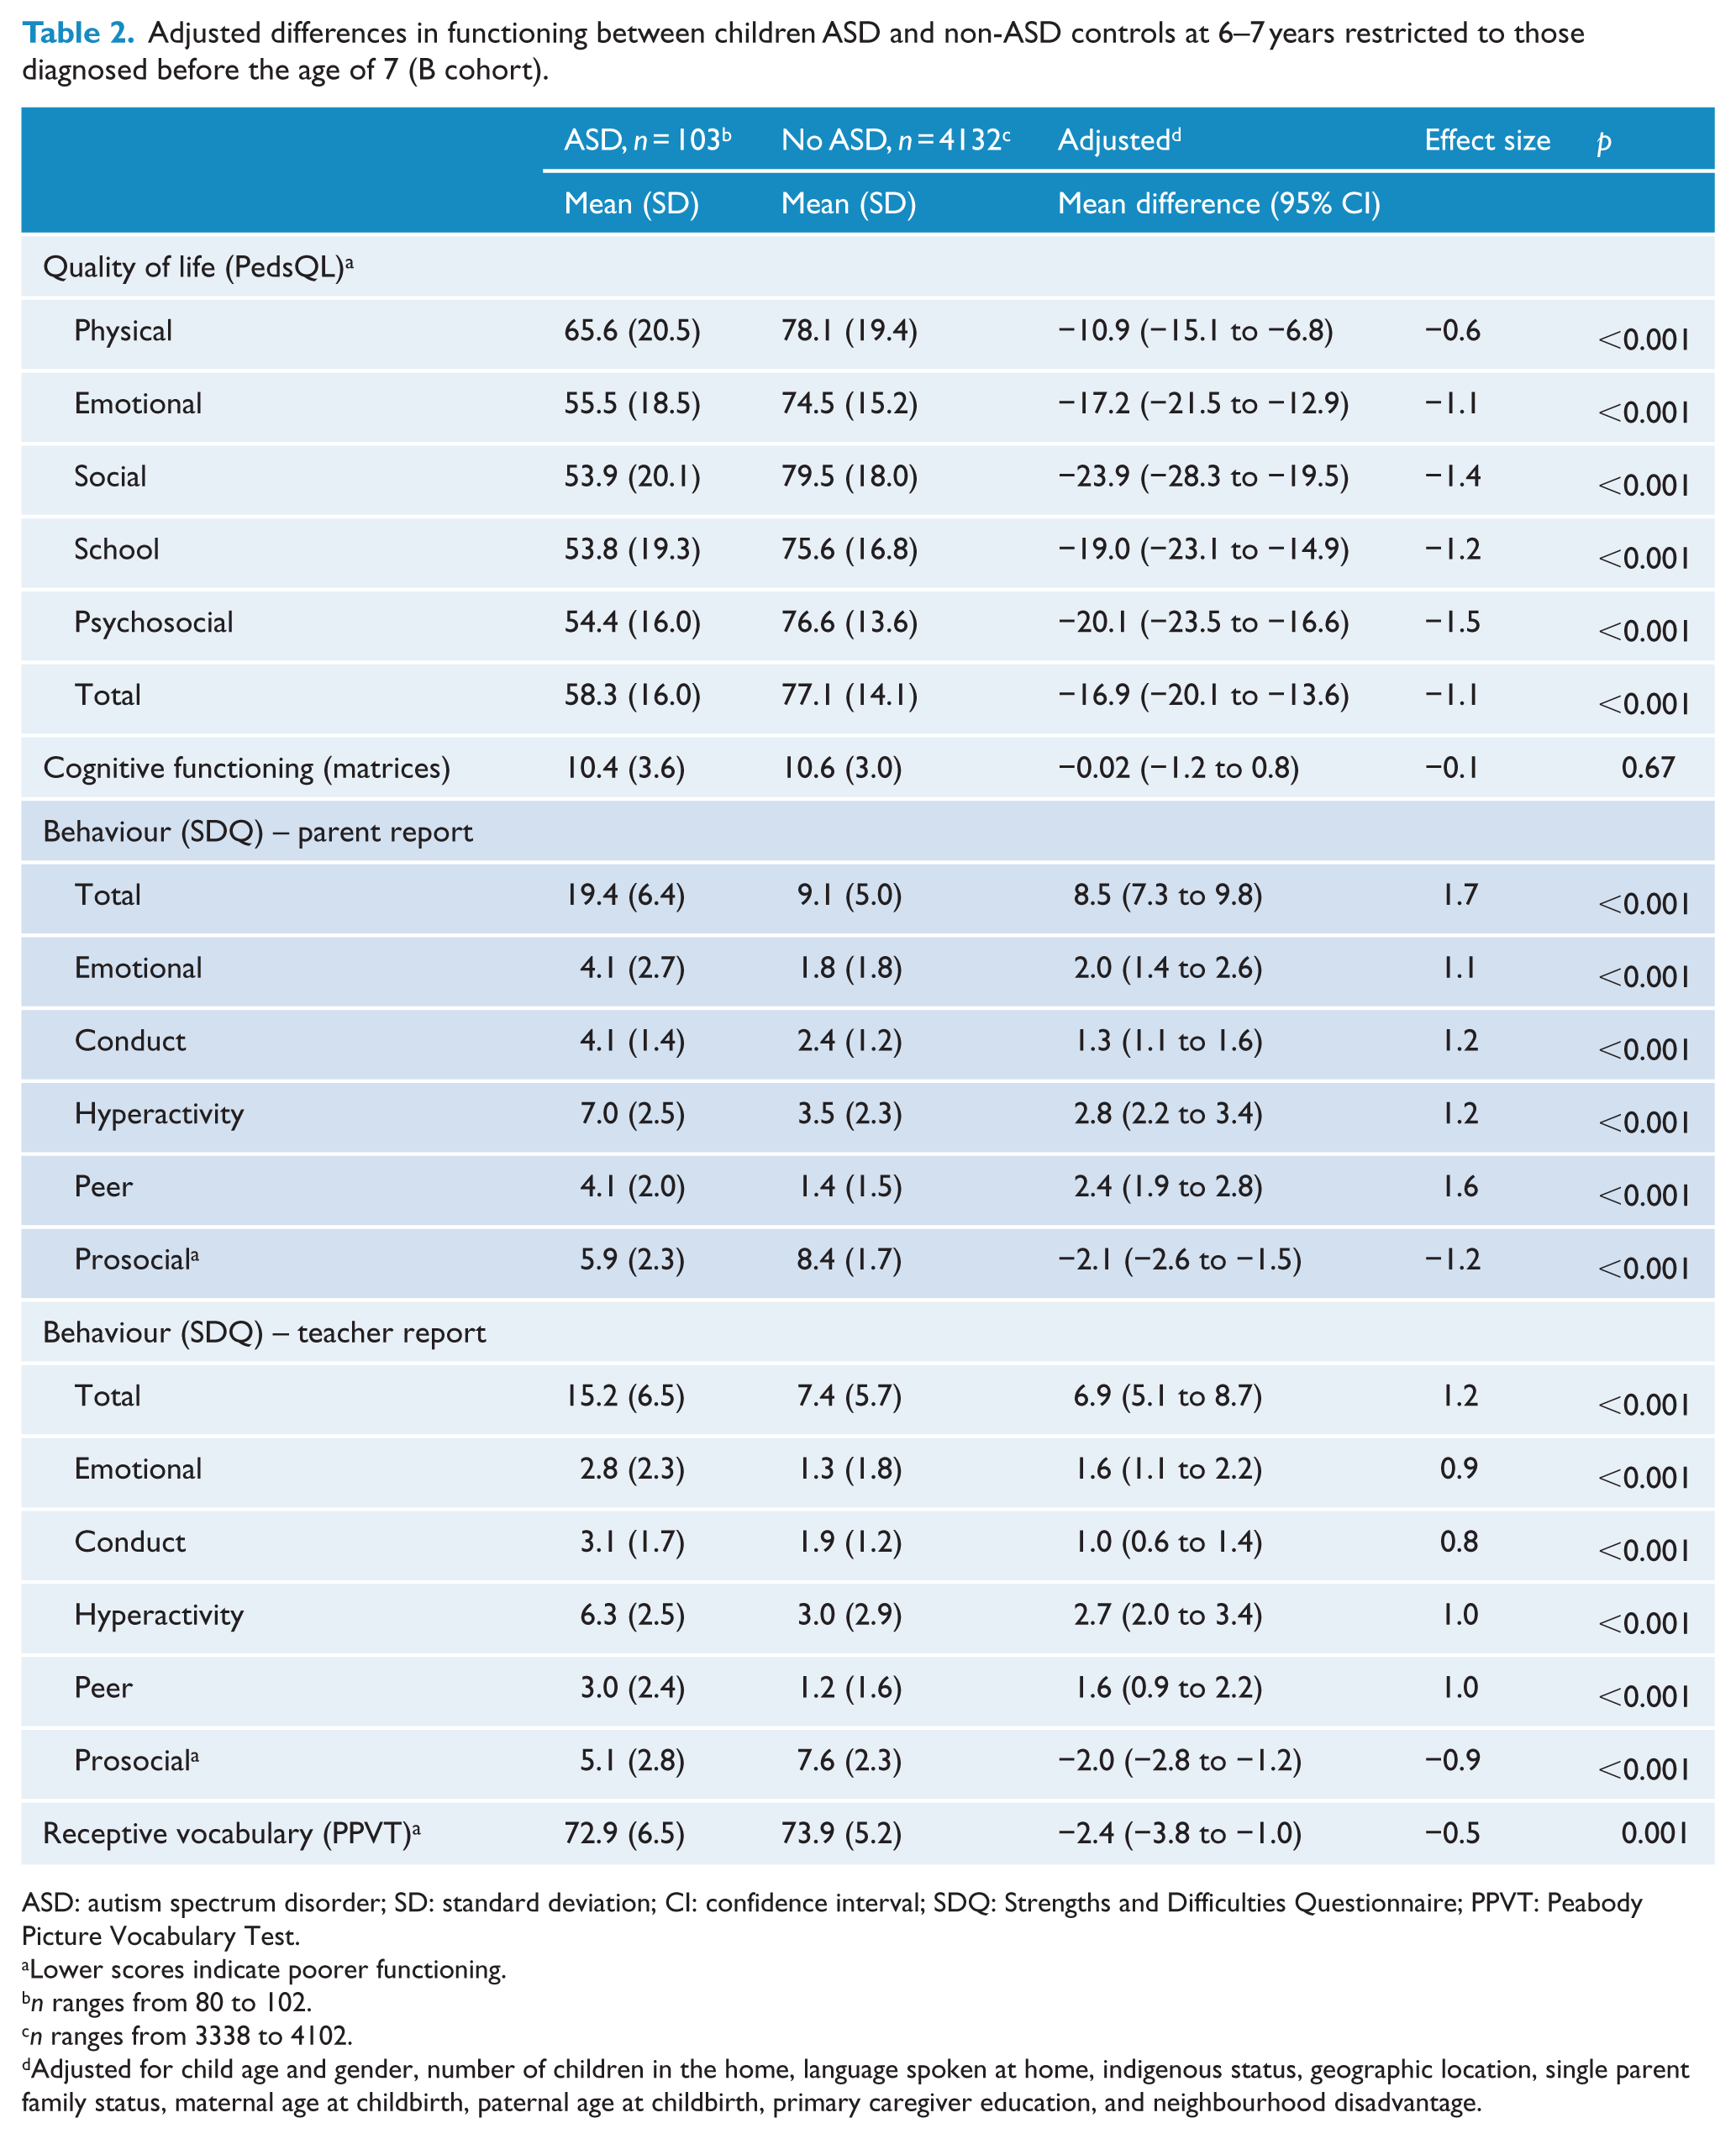
ASD: autism spectrum disorder; SD: standard deviation; CI: confidence interval; SDQ: Strengths and Difficulties Questionnaire; PPVT: Peabody Picture Vocabulary Test.
Lower scores indicate poorer functioning.
n ranges from 80 to 102.
n ranges from 3338 to 4102.
Adjusted for child age and gender, number of children in the home, language spoken at home, indigenous status, geographic location, single parent family status, maternal age at childbirth, paternal age at childbirth, primary caregiver education, and neighbourhood disadvantage.
Adjusted differences in functioning between children ASD and non-ASD controls at 6–7 years restricted to those diagnosed before the age of 7 (K cohort).

ASD: autism spectrum disorder; SD: standard deviation; CI: confidence interval; SDQ: Strengths and Difficulties Questionnaire; PPVT: Peabody Picture Vocabulary Test.
Lower scores indicate poorer functioning.
n ranges from 42 to 56.
n ranges from 3179 to 3882.
Adjusted for child age and gender, number of children in the home, language spoken at home, indigenous status, geographic location, single parent family status, maternal age at childbirth, paternal age at childbirth, primary caregiver education, and neighbourhood disadvantage.
We also report the percentage (and 95% confidence intervals [CIs]) of children in each cohort with moderate/severe ASD, mild ASD and without ASD falling in the clinical or below average range for each of our social measures and our composite measure of any social problems along with clinical levels of cognitive and receptive vocabulary functioning (as defined above) (see Table 4).
Percentage of 6- to 7-year-old children in the clinical/below average range on outcome measures across B and K cohorts, restricted to those diagnosed before the age of 7.
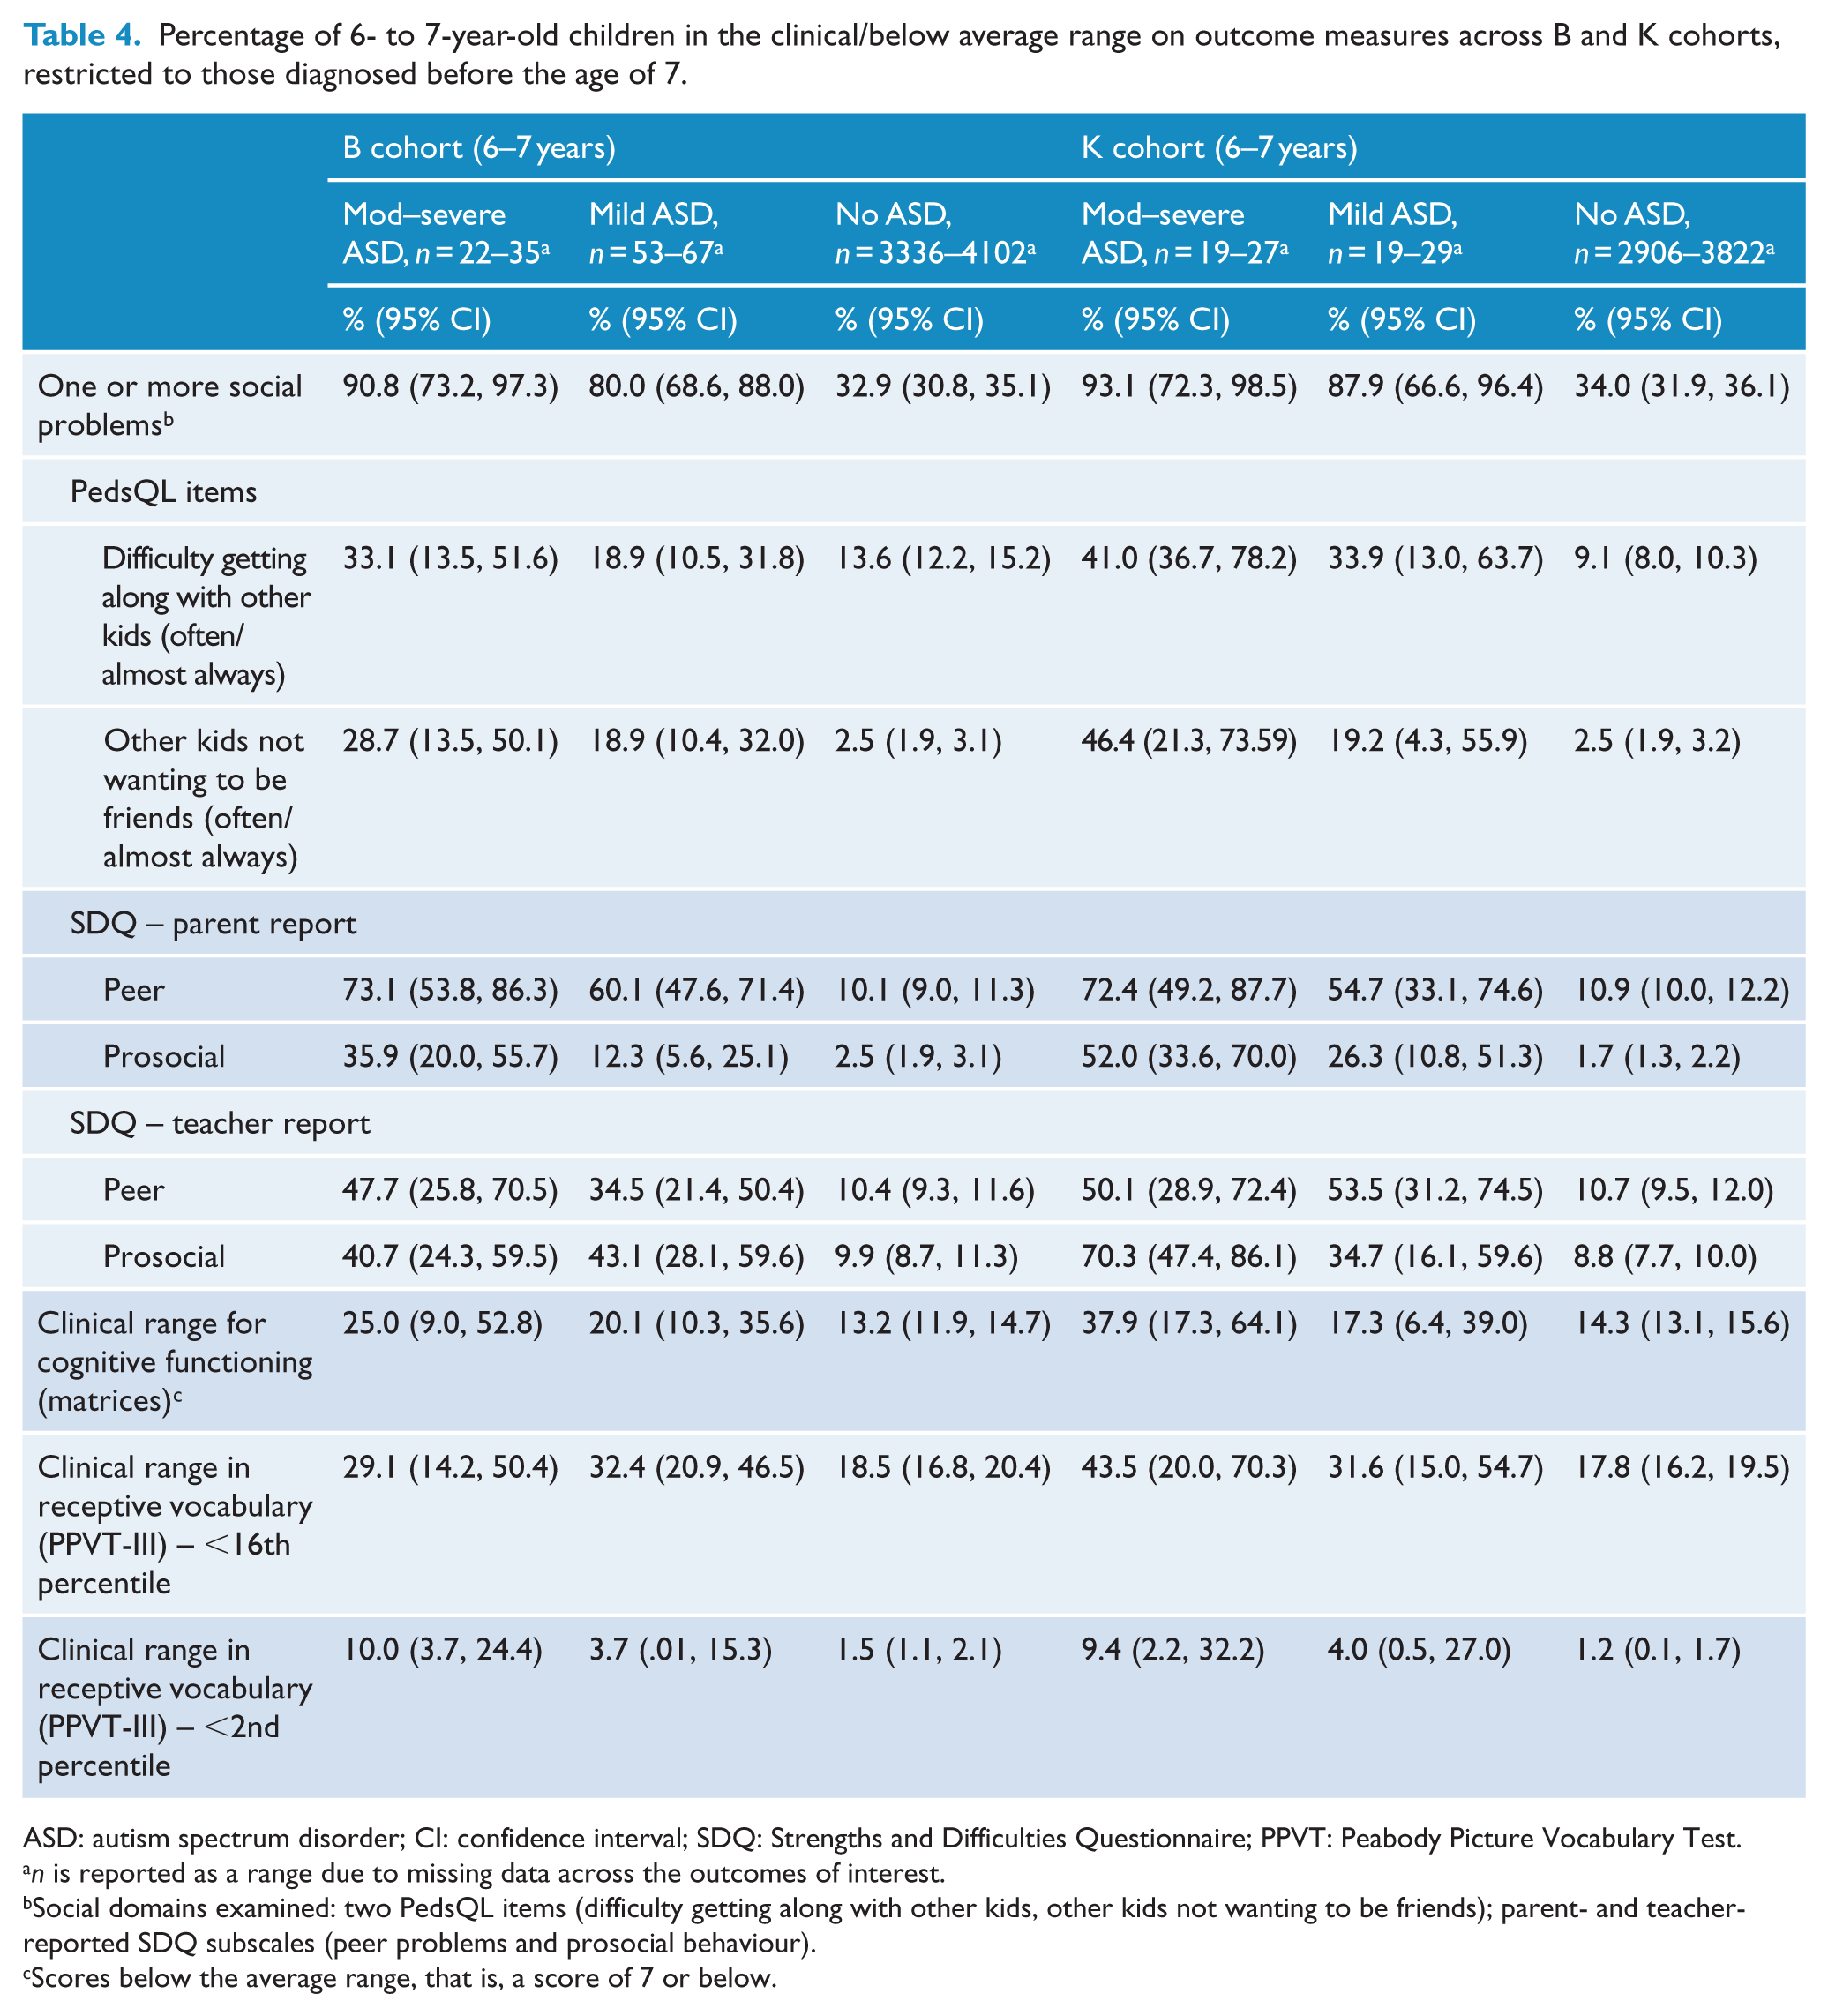
ASD: autism spectrum disorder; CI: confidence interval; SDQ: Strengths and Difficulties Questionnaire; PPVT: Peabody Picture Vocabulary Test.
n is reported as a range due to missing data across the outcomes of interest.
Social domains examined: two PedsQL items (difficulty getting along with other kids, other kids not wanting to be friends); parent- and teacher-reported SDQ subscales (peer problems and prosocial behaviour).
Scores below the average range, that is, a score of 7 or below.
All analyses used survey methods to weight the analyses to account for the unequal probability of participant selection into the sample, non-response and sample attrition, and the multi-stage, clustered sampling design (Soloff et al., 2006). Analyses were conducted in Stata version 13.0.
Results
Prevalence and age of diagnosis
Prevalence of children reported with ASD aged less than 7 years was higher in the B (2.5%; 95% CI = [2.0, 3.0]; n = 103) compared to the K cohort (1.5%; 95% CI = [1.2, 2.0]; n = 58). The frequency by age of diagnosis for each cohort is shown in Figure 1.
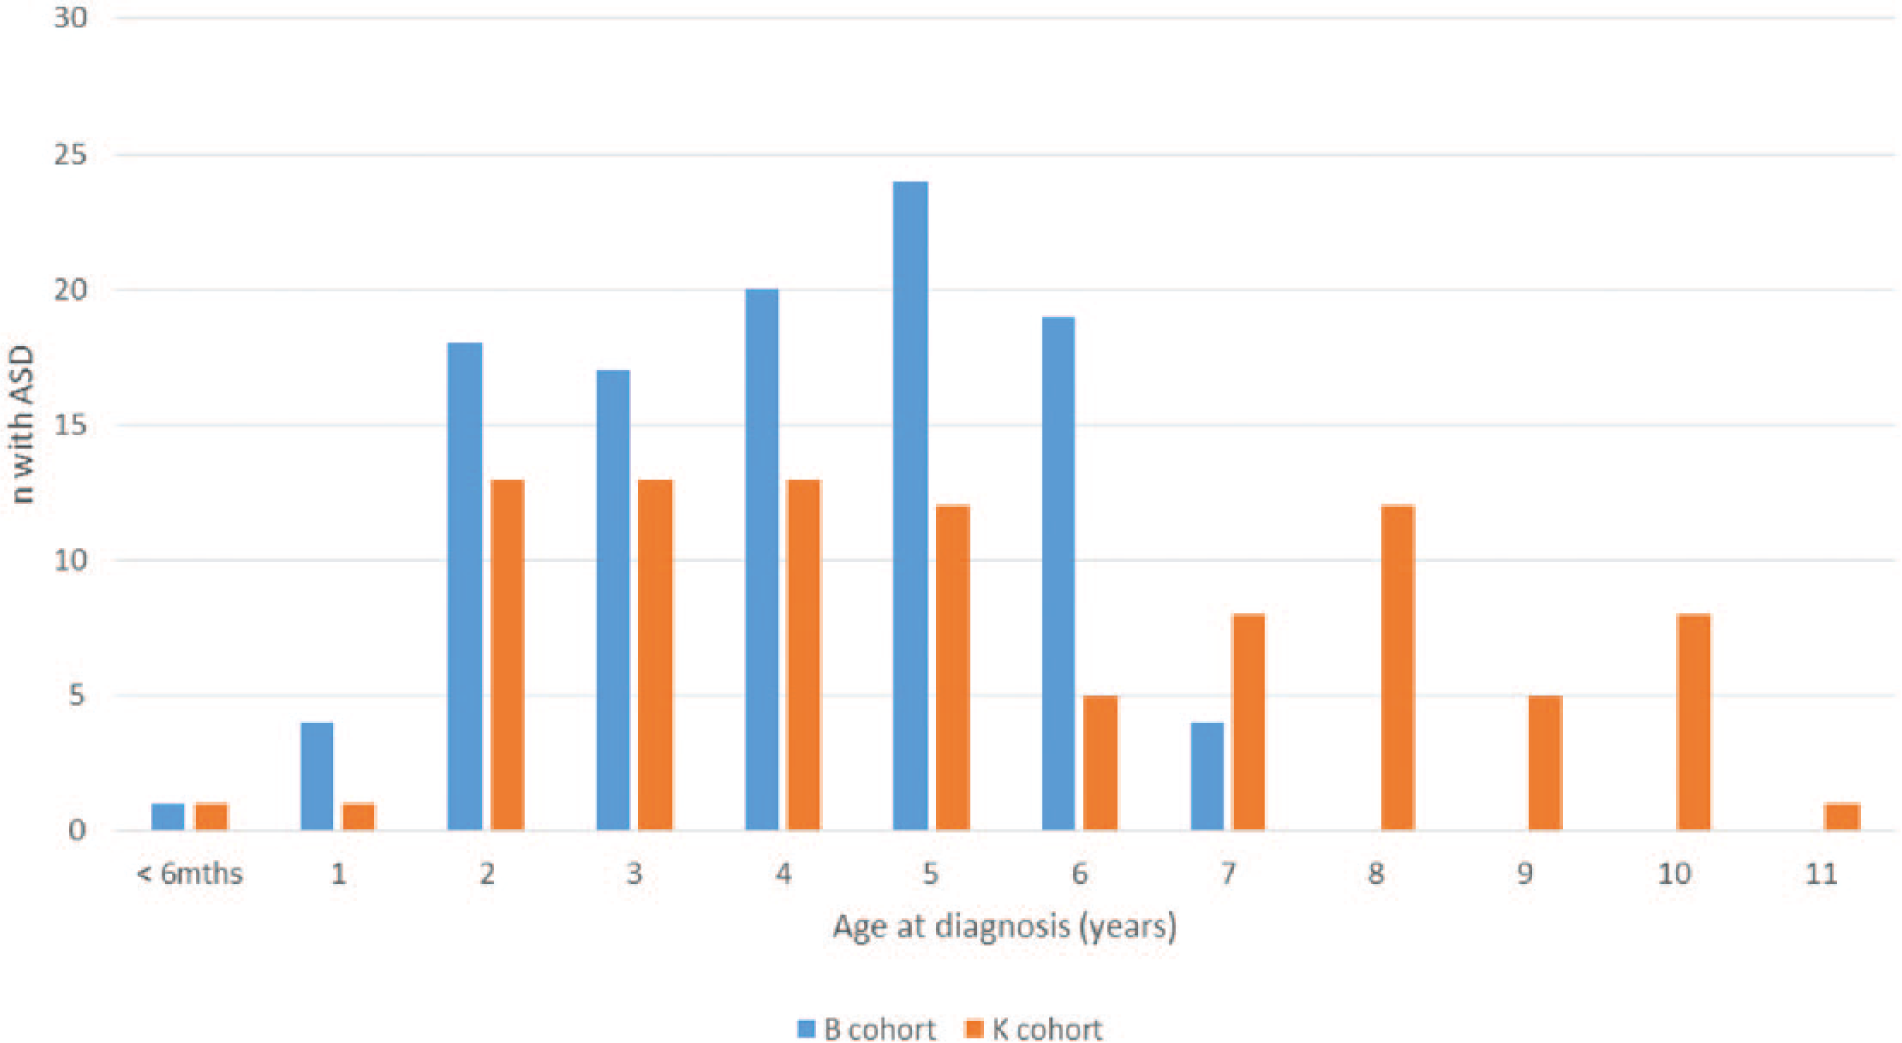
Age in years of ASD diagnosis for children in K and B cohorts.
Sample characteristics
Most children diagnosed with ASD before 7 years were rated as having mild ASD (B: 64%, K: 50%), and the majority of children diagnosed with ASD were male (B: 84%, K: 81%). In the B cohort, more children with ASD lived in single parent families and were more likely live in families with fewer children in the home; however, no other demographic differences were identified between children with and without ASD in either cohort (Table 1). In particular, there were no differences in maternal or paternal age between groups and SES was similar.
Developmental profile
Mean differences
In both cohorts, children with ASD had significantly poorer QoL than children without ASD across all QoL domains, including the composite scores (B cohort: Table 2; K cohort: Table 3). They were also rated by both parents and teachers as having more emotional and behavioural problems than their non-ASD peers in all domains of the SDQ. Children with ASD also had lower receptive vocabulary scores on the PPVT-III, although the effect sizes were much smaller than for QoL and emotional-behavioural domains. For the B cohort, there were no significant differences between children with and without ASD on non-verbal cognitive functioning, but in the K cohort children with ASD performed lower compared to their peers.
Differences in proportions
The proportion of children who scored in the clinical range for social interaction, behaviour, receptive vocabulary or cognitive function is shown in Table 4. Most but not all children with moderate/severe (91–93%) or mild ASD (80–88%) had one or more social problems. Over 30% of children who did not have ASD were also reported to have one or more social problems. For most individual developmental variables, there was a non-statistically significant trend for a higher proportion of children with moderate to severe ASD to have problems compared to those reported to have mild ASD in both cohorts. A statistically higher proportion of those reported to have mild ASD had problems for the PedsQL questions of interest and SDQ peer and prosocial domains than those not reported to have ASD, except for the B cohort for the PedsQL question about difficulty getting along with other kids. However, not all children with ASD had problems for all variables and a minority of children who were not diagnosed with ASD were reported to have problems (see Table 4).
Discussion
Prevalence of a parent-reported diagnosis of ASD prior to age 7 years was higher in the B cohort (birth years 2004–2005) compared to the K cohort (born in 1999–2000). Children reported by parents to have been diagnosed with an ASD experienced more problems than their peers with socio-emotional behaviours, receptive vocabulary and non-verbal reasoning. However, between 6% and 20% of children reported to have been diagnosed with ASD were also reported to have no difficulty getting along with their peers or with prosocial behaviours at age 6–7 years.
The ASD prevalence of over 2% for the B cohort is higher than in previous Australian studies (Barbaro and Dissanayake, 2010; Williams et al., 2008) as well as many studies from other countries (Elsabbagh et al., 2012) but is in keeping with parent-report studies from the United States (Blumberg et al., 2013) and studies that involved case finding using screening in South Korea (Kim et al., 2011). Prevalence estimates based on parent report in the United States have historically been highly concordant with the CDC and other prevalence data (Blumberg et al., 2013). Whether this is true in Australia is not yet known.
In Australia, a new programme called the Helping Children with Autism Package (HCWA) was introduced in 2008 (Department of Families Housing Community Services and Indigenous Affairs, 2013). This package provides children who are diagnosed with ASD and assessed as eligible prior to turning 6 years of age, with up to AU$12,000 for approved early intervention services to be used before the child turns 7 years. Children in the B cohort were under 6 when the HCWA funding became available, but children in the K cohort were older and therefore not eligible for the early intervention funding, creating a difference in funded services for children diagnosed with autism between the two cohorts. The availability of the early intervention component of the HCWA package for the B but not K cohort is of interest. It is not yet clear whether the difference in prevalence before age 7 represents a shift to a younger age of diagnosis, or whether there will be ongoing diagnosis of ASD after the age of 6 in the B cohort.
Recently published HCWA data do indicate that diagnosis is common just prior to 6 years (Bent et al., 2015). Published HCWA data and data from the LSAC do not provide information about whether there have been changes in diagnostic practice that could account for the difference in prevalence between cohorts. However, at the time of this study, access to federal early intervention funding was limited to specific diagnoses, including ASD, leaving children with similar functional impairments and no eligible diagnosis with less early intervention funding. It is therefore possible that thresholds for ASD diagnosis have changed as clinicians struggle to facilitate access to early intervention for those who need it, which is possible when diagnostic practice is varied (Skellern et al., 2005) and diagnoses are behaviourally based.
There are consistencies between this and other ASD study findings, including the predominance of males (CDC, 2014), lower QoL reported by parents of children with ASD (Kuhlthau et al., 2010; Van Heijst and Geurts, 2015) and also greater difficulties in socio-emotional and behavioural domains as measured by the SDQ (Iizuka et al., 2010; Russell et al., 2013). However, our findings in relation to family characteristics are not consistent with other studies. There was no effect of family socio-economic advantage on the prevalence of ASD in either cohort which is different, for example, in the United States, where higher family SES is commonly found to be associated with higher levels of ASD (Durkin et al., 2010), and Sweden, where lower rates of ASD are found in higher SES communities (Rai et al., 2012). This may reflect the availability of diagnostic services in the different countries, rather than real differences in prevalence. Parental age was also not a significant factor in the LSAC cohorts as parents of children with ASD were of similar age to parents of children without ASD. In contrast, several previous studies (Durkin et al., 2010; Grether et al., 2009; Hultman et al., 2011) found that older parents tend to be at higher risk to have a child with ASD than younger parents.
Interestingly, a lower than expected proportion of children with ASD scored in the clinical range for problems with receptive vocabulary and non-verbal cognitive functioning (Bartak et al., 1975; Charman et al., 2011; Condouris et al., 2003; Kjelgaard and Tager-Flusberg, 2001). This could reflect the tools used, as neither the matrix reasoning subtest from the WISC IV or the short-version of the PPVT-III provide comprehensive assessment of communication or intelligence. For example, the PPVT-III is a measure of receptive vocabulary only and it does not assess a range of receptive language abilities such as following directions or understanding concepts. Children with a non-verbal IQ in the average range (which made up between 70–75% and 83–86% of children in the B and K cohorts, respectively) are more likely to score within the average range on a tool such as the PPVT-III (Pellicano, 2012). Other language tools may tap into the more nuanced aspects of language difficulties that are typical of children with ASD, for example, understanding inference and figurative language. The PPVT-III does not assess expressive language or the use of language (pragmatics) and therefore does not capture the full spectrum of language difficulties that may be present in children with ASD (Tager-Flusberg et al., 2005). Furthermore, our study is population-based and as a result, may have identified children with milder phenotypes compared to clinical samples that are more frequently included in studies reporting on language or IQ in ASD.
Most notably, while the presence of deficits in social communication reported by both parents and teachers of children with ASD is not surprising, the proportion of children with moderate to severe ASD (10% B cohort, 6% K cohort) and with mild ASD (20% B cohort, 12% K cohort) who were scored as not having problems for any items relating to social interaction by parents and teachers was unexpected. These findings are in keeping with those from a larger, similar study in the United Kingdom of children at age 7, which identified difficulties reported by parents and teachers with peer relationships and prosocial behaviour, and also other scales of the SDQ, as greater for children with ASD than typically developing peers (Russell et al., 2013). The UK study also found that not all children with parent-reported ASD were reported to have difficulties in these two domains. In order to meet the Diagnostic and Statistical Manual of Mental Disorders Version IV (DSM-IV) or 5 (DSM-5) criteria for an ASD, children are required to have symptoms that cause impairment in social interaction (APA, 2000, 2013). The fact that some children with ASD were reported as performing similarly on social communication as their non-ASD peers raises questions about either the accuracy of the reported diagnoses or whether the SDQ and PedsQL tap the types of social communication difficulties seen in children with ASD. It is also possible that the behaviours of these children previously diagnosed with ASD had changed sufficiently, so that they no longer met criteria for a diagnosis, however, parents were asked to report ‘ongoing conditions’. A detailed review of individual trajectories of children with ASD to explore these possibilities was outside the scope of this study.
On the other hand, 10% of children at the age of 6–7 years without a parent-reported ASD diagnosis were reported by teachers and parents to have clinical levels of difficulties with their peers and nearly 10% were reported by teachers to have clinical levels of difficulty with prosocial behaviour, according to the SDQ. This suggests that ‘whole of classroom’ initiatives along with a dimensional, rather than diagnostic, approach to peer relationships and prosocial behaviours may be beneficial in preventing or minimising adverse outcomes. Much is known from work with ASD about social skills training that could be adapted for a broader audience (Reichow et al., 2012).
A strength of this study was the use of data from two Australian nationally representative cohorts of children. A limitation was reliance on recall of ASD diagnosis, with longer recall required for parents in the K cohort. Other limitations include reliance on partial assessments and parent and/or teacher report, and the use of tools that suit a large population-based cohort but are not designed for children with ASD. Furthermore, given the relatively small number of children in the ASD group, state-based differences in diagnoses and impairments were unable to be examined.
Conclusion
Future LSAC waves will clarify whether ASD has been diagnosed earlier in the B cohort or if there will be a continued increase in diagnosis. Future waves will also provide crucial information about the types and severity of problems experienced during the later primary and secondary school years by children with an ASD. This information will assist service planning for this developmentally vulnerable group of children.
Footnotes
Acknowledgements
This article uses confidential unit record files from the LSAC survey. The LSAC was initiated and funded by the Commonwealth Department of Families, Housing, Community Services, and Indigenous Affairs and was managed by the Australian Institute of Family Studies. The findings and views reported in this article are those of the authors and should not be attributed to either the Commonwealth Department of Families, Housing, Community Services, and Indigenous Affairs, or the Australian Institute of Family Studies. We thank all the families participating in the LSAC study.
Declaration of interest
The authors report no conflicts of interest. The authors alone are responsible for the content and writing of the paper.
Funding
We wish to thank the APEX Australia Foundation and The William Collie Trust, University of Melbourne, for their support of authors Professor Williams, Dr Randall and Ms Brignell.