
Abstract
Objective:
Depression has been shown to be a risk factor for Alzheimer’s disease (AD), and in older adults may provide a marker for the beginning of the prodromal phase of AD. The purpose of this systematic review is to examine the relationship between amyloid-β (Aβ), a key biomarker of AD, and depression in older adults.
Method:
The literature search was limited to studies conducted from 2006 to 2014 that were published in English in peer-reviewed journals. Studies were selected if they included a group of older adults who either met established criteria for Major Depressive Disorder or Dysthymia; or were assessed for depressive symptoms on a standardised measure. Studies were also required to include an outcome variable that was a direct measure of Aβ levels in either blood or cerebrospinal fluid (CSF) samples, or via neuroimaging techniques such as positron emission tomography (PET).
Results:
Nineteen studies were identified, 15 of which found significant differences in Aβ levels between depressed and non-depressed older adults. However, studies were limited by their cross-sectional design, reliance on blood-based measures of Aβ, and potential sample bias.
Conclusions:
Future investigations should consider prospective longitudinal design using neuroimaging and CSF measures of Aβ.
Converging clinical evidence suggests that in otherwise healthy older adults an increase in depressive symptoms can be an early or preclinical indicator of dementia (Byers and Yaffe, 2011). The most common type of dementia, Alzheimer’s disease (AD), accounts for 70% of cases worldwide (World Health Organisation, 2012). Evidence for a relationship between depression and AD comes from observations that a clinical diagnosis of depression in both early and late life increases the risk for AD diagnosis in healthy older adults (Da Silva et al., 2013; Vilalta-Franch et al., 2013) and in individuals who meet criteria for mild cognitive impairment (MCI) (Richard et al., 2013). Authoritative reviews also conclude that an increased number, longer duration and higher frequency of depressive episodes across the lifespan further increase the risk of developing AD (Byers and Yaffe, 2011; Piccinni et al., 2013). However, these reviews also emphasise that associations between depressive symptoms and clinically diagnosed AD are not evident in all studies (Luppa et al., 2013; Neubauer et al., 2013; Wilson et al., 2010). Thus, factors such as methodology, context, or the presence of subgroups of people with depression and additional risk factors for AD (e.g. apolipoprotein ε4 [APOE ε4] carriage) (Corder et al., 1993) may influence the extent to which depressive symptoms can predict clinical AD (Byers and Yaffe, 2011).
Several factors that complicate determination of the extent to which depressive symptoms are related to early AD have been identified. First there is overlap between the symptoms of depression and those that occur in early dementia. For example, 20–30% of patients with AD show lowered mood and decreased motivation (Tsuno and Homma, 2009). Second, subtle cognitive impairment, particularly in memory, is characteristic of both early AD (Albert et al., 2011; Sperling et al., 2011) and depression in older adults (Byers and Yaffe, 2011; Tsuno and Homma, 2009; Wells, 1979). Third, the insidious nature of AD means that symptoms develop very slowly (Dubois and Albert, 2004; Petersen et al., 2001). Therefore, prospective studies of older adults with depressive symptoms must be conducted over long intervals (e.g. decades) and include multiple clinical outcomes against which to determine any predictive validity of depression for AD. Finally, increased depressive symptoms in healthy older adults may not be a direct reflection of AD pathology but rather a consequence of individuals realising their cognitive function is failing (Byers and Yaffe, 2011). Considered together these data suggest that while depressive symptoms do increase the risk for AD, the nature and direction of the relationship between the two conditions remains unclear, as is the extent to which depressive symptoms predict incipient AD.
With a biological marker of AD, studies can now examine the extent to which depressive symptoms are associated with AD pathology over much shorter periods and with greater diagnostic specificity for dementia than previously achievable from studies dependent on clinical diagnosis of dementia. Advances in biomarker and neuroimaging techniques now make it possible to detect accumulation of amyloid-β (Aβ) in living non-demented older adults (Sperling et al., 2011). Prospective studies of older adults with increased cerebral Aβ show decline in episodic memory up to 20 years before clinical diagnosis of AD (Doraiswamy et al., 2012; Lim et al., 2013b, 2013c, 2014a, 2014b; Small et al., 2012; Villemagne et al., 2011). Study of the extent to which changes in mood occur in individuals with increased cerebral Aβ could inform models of the relationship between depressive symptomatology and AD.
To date several studies have measured levels of Aβ in older adults with clinically classified depression, and have observed changes in Aβ levels both in vivo (Cirrito et al., 2011; Sun et al., 2008, 2011) and post mortem (Rapp et al., 2006, 2011). However, these studies have quantified Aβ levels differently, using blood, cerebrospinal fluid (CSF) and Aβ neuroimaging biomarkers. Furthermore, depressive symptoms have been defined using categorical (e.g. DSM-IV criteria for major depression), continuous (e.g. score on a standardised measure such as the Geriatric Depression Scale [GDS]) or qualitative methods (e.g. clinical interview) (Byers and Yaffe, 2011). Finally, most studies measured relationships between depressive symptoms and Aβ on a single occasion (i.e. cross-sectional design). Consequently, development of a model of the extent to which Aβ biomarkers are associated with depressive symptoms, or clinical depression, has not been possible from considering the result of each study in isolation. Given the variation in methodology, a systematic review of outcomes across studies is warranted to improve understanding of relationships between depressive symptoms and Aβ and provide a foundation for studying such relationships.
The aim of this review was therefore to systematically examine relationships between depressive symptoms, or clinical depression, and Aβ in non-demented older adults.
Method
Study selection criteria
Type of study
This review focused on research investigating the relationship between Aβ and depression in older adults. Only peer-reviewed studies published in English since 2006 were considered. Included studies were of either cross-sectional or longitudinal design.
Participants
Studies were selected if the sample included a group of older adults aged 60 years or more and: (a) a group who met established criteria (Diagnostic and Statistical Manual of Mental Disorders [DSM] or International Classification of Diseases 10th Revision [ICD-10]) for Major Depressive Disorder or dysthymia; or (b) a standardised measure of depressive symptoms was used to assess participants’ level of depression. Studies primarily focused on participants with Bipolar Disorders or disorders other than unipolar depression were excluded. Studies that did not directly assess participants’ depressive symptoms or diagnosis were also excluded.
Outcome measures
Studies were included if Aβ was measured using blood, CSF samples or positron emission tomography (PET) neuroimaging techniques. Studies of depression that measured indirect markers of Aβ, such as autoantibodies, or did not measure Aβ levels were excluded. In addition, studies that focused primarily on the risk of developing AD without assessing Aβ levels were excluded.
Search methods for identification of studies
Electronic database searches
Three electronic databases were subjected to systematic searches on 15 May 2014 using the search terms described below:
Configured for EBSCOhost (PsycINFO, PsycExtra, PsycArticles, MEDLINE):
Depress* (SU) OR Affect* (SU) OR Mood (SU) 2. Amyloid* (SU) OR A-beta (SU) OR Aβ* (SU) OR Beta-amyloid (SU) OR PiB (SU) OR 18F (SU) OR CSF (SU) OR Cerebrospinal (SU) 3. Alzheimer* (SU) OR MCI (SU) 4. Cognit* (TX) OR Memory (TX) OR “Executive Function” (TX) OR Attention (TX) OR “Processing Speed” (TX) OR Visuospatial (TX) OR Language (TX)
Configured for Scopus:
Depress* (KEY) OR Affect* (KEY) OR Mood (KEY) 2. Amyloid* (KEY) OR A-beta (KEY) OR Aβ* (KEY) OR Beta-amyloid (KEY) OR PiB (KEY) OR 18F (KEY) OR CSF (KEY) OR Cerebrospinal (KEY) 3. Alzheimer* (KEY) OR MCI (KEY) 4. Cognit* (ALL) OR Memory (ALL) OR “Executive Function” (ALL) OR Attention (ALL) OR “Processing Speed” (ALL) OR Visuospatial (ALL) OR Language (ALL)
Configured for Proquest:
Depress* (SU) OR Affect* (SU) OR Mood (SU) 2. Amyloid* (SU) OR A-beta (SU) OR Aβ* (SU) OR Beta-amyloid (SU) OR PiB (SU) OR 18F (SU) OR CSF (SU) OR Cerebrospinal (SU) 3. Alzheimer* (SU) OR MCI (SU) 4. Cognit* (ALL) OR Memory (ALL) OR “Executive Function” (ALL) OR Attention (ALL) OR “Processing Speed” (ALL) OR Visuospatial (ALL) OR Language (ALL)
Search strategy
The following process was used to search all three databases and to screen articles for relevance against the search criteria:
Subject terms for Depression, Aβ amyloid, AD, and Cognition were entered simultaneously, connected by the AND Boolean phrase
Non-English language and non-peer-reviewed articles (e.g. review, comment or opinion articles) were manually removed
Duplicates were removed
Titles and abstracts were screened for meeting inclusion and exclusion criteria
Remaining articles were then screened in full text
At this stage 15 articles were identified as meeting full inclusion criteria (Figure 1).
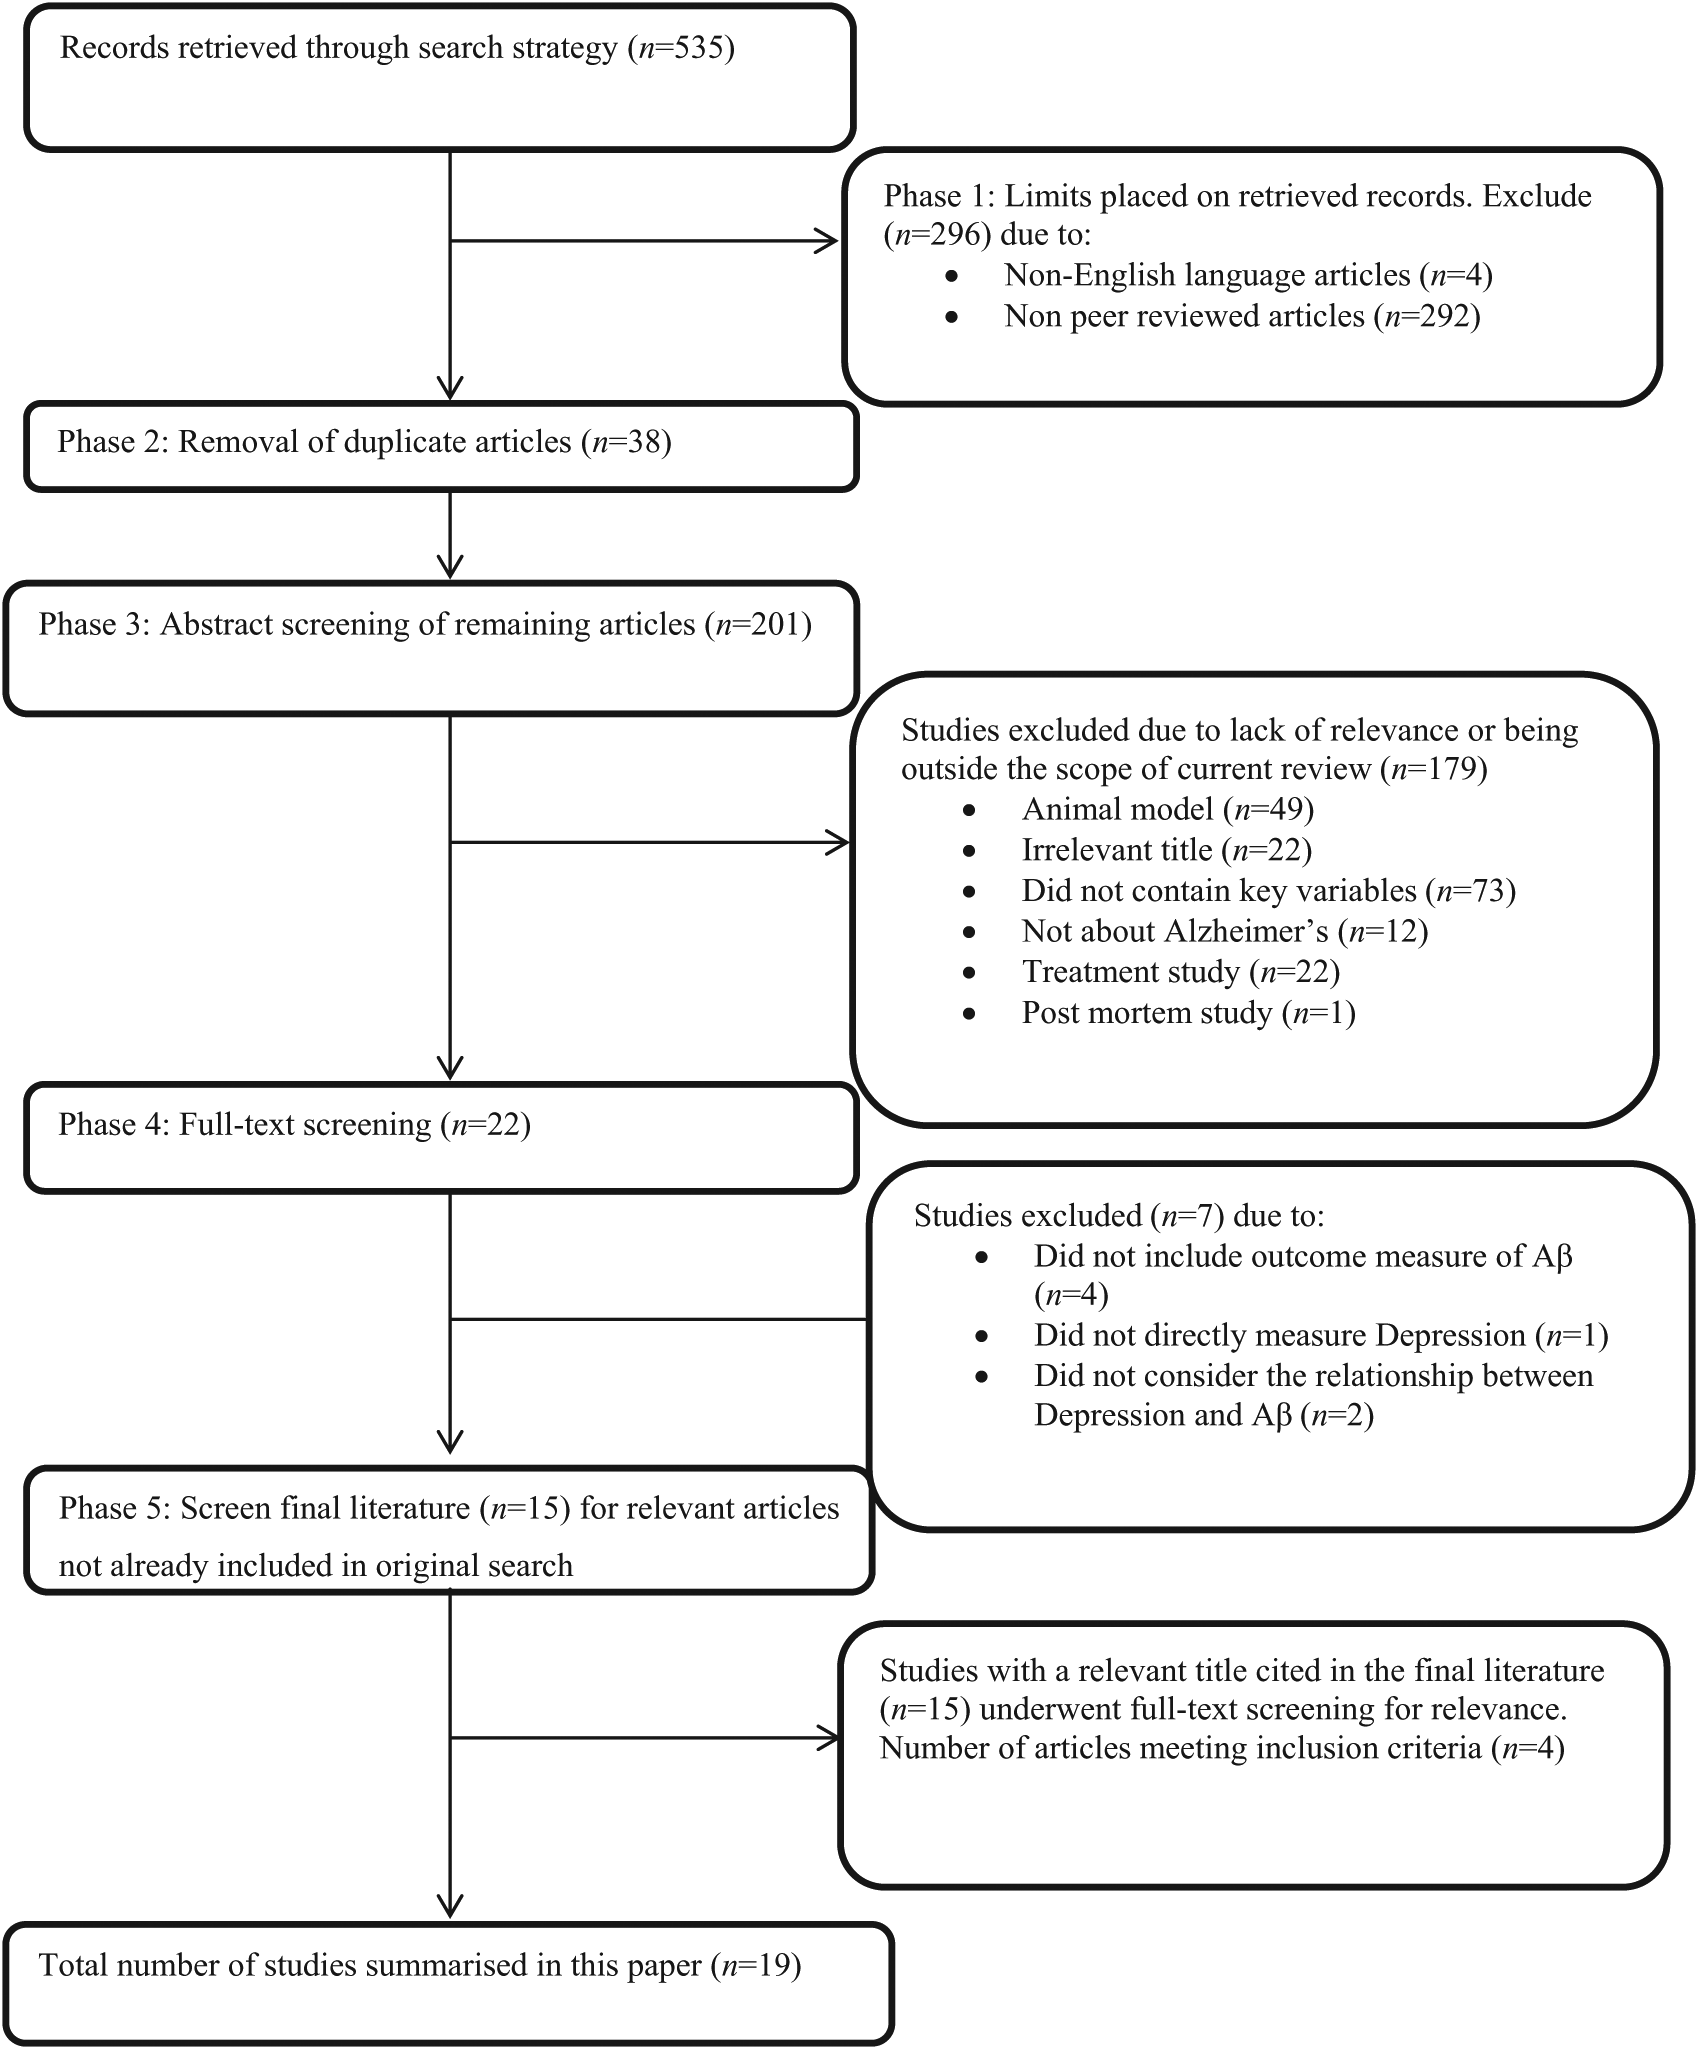
Flowchart of search procedure and number of studies included and excluded from the analysis at each stage.
Additional searches
Studies meeting full inclusion criteria were subjected to reference list screening for key study citations. Studies not found by the current search strategy with a relevant title were manually retrieved and subjected to abstract and then full-text screening for relevance. Ten potentially relevant articles were screened, with four meeting inclusion criteria. The inclusion and exclusion process is illustrated in Figure 1.
Calculation of effect sizes
Only one of the 19 retained articles reported a measure of effect size (Cohen’s d) for relevant outcomes. To enable better comparison across studies, the magnitude of difference between sample means for relevant outcomes from each study were expressed using Cohen’s d (Cohen, 1988), a measure of effect that expresses the difference between means as a function of the pooled standard deviation of both groups. Six studies reported means and standard deviations and a further eight studies reported p-values and sample sizes and these were used to calculate Cohen’s d. Three studies did not provide sufficient information for calculation of Cohen’s d. For all studies the direction of differences were standardised to express outcome measures in the depressed group relative to controls.
Results
Nineteen studies satisfied the review inclusion/exclusion criteria. Design and sample characteristics for each study are summarised in Table 1. The outcome measures and relevant study results are summarised in Table 2.
Summary of study design and sample characteristics of included articles.
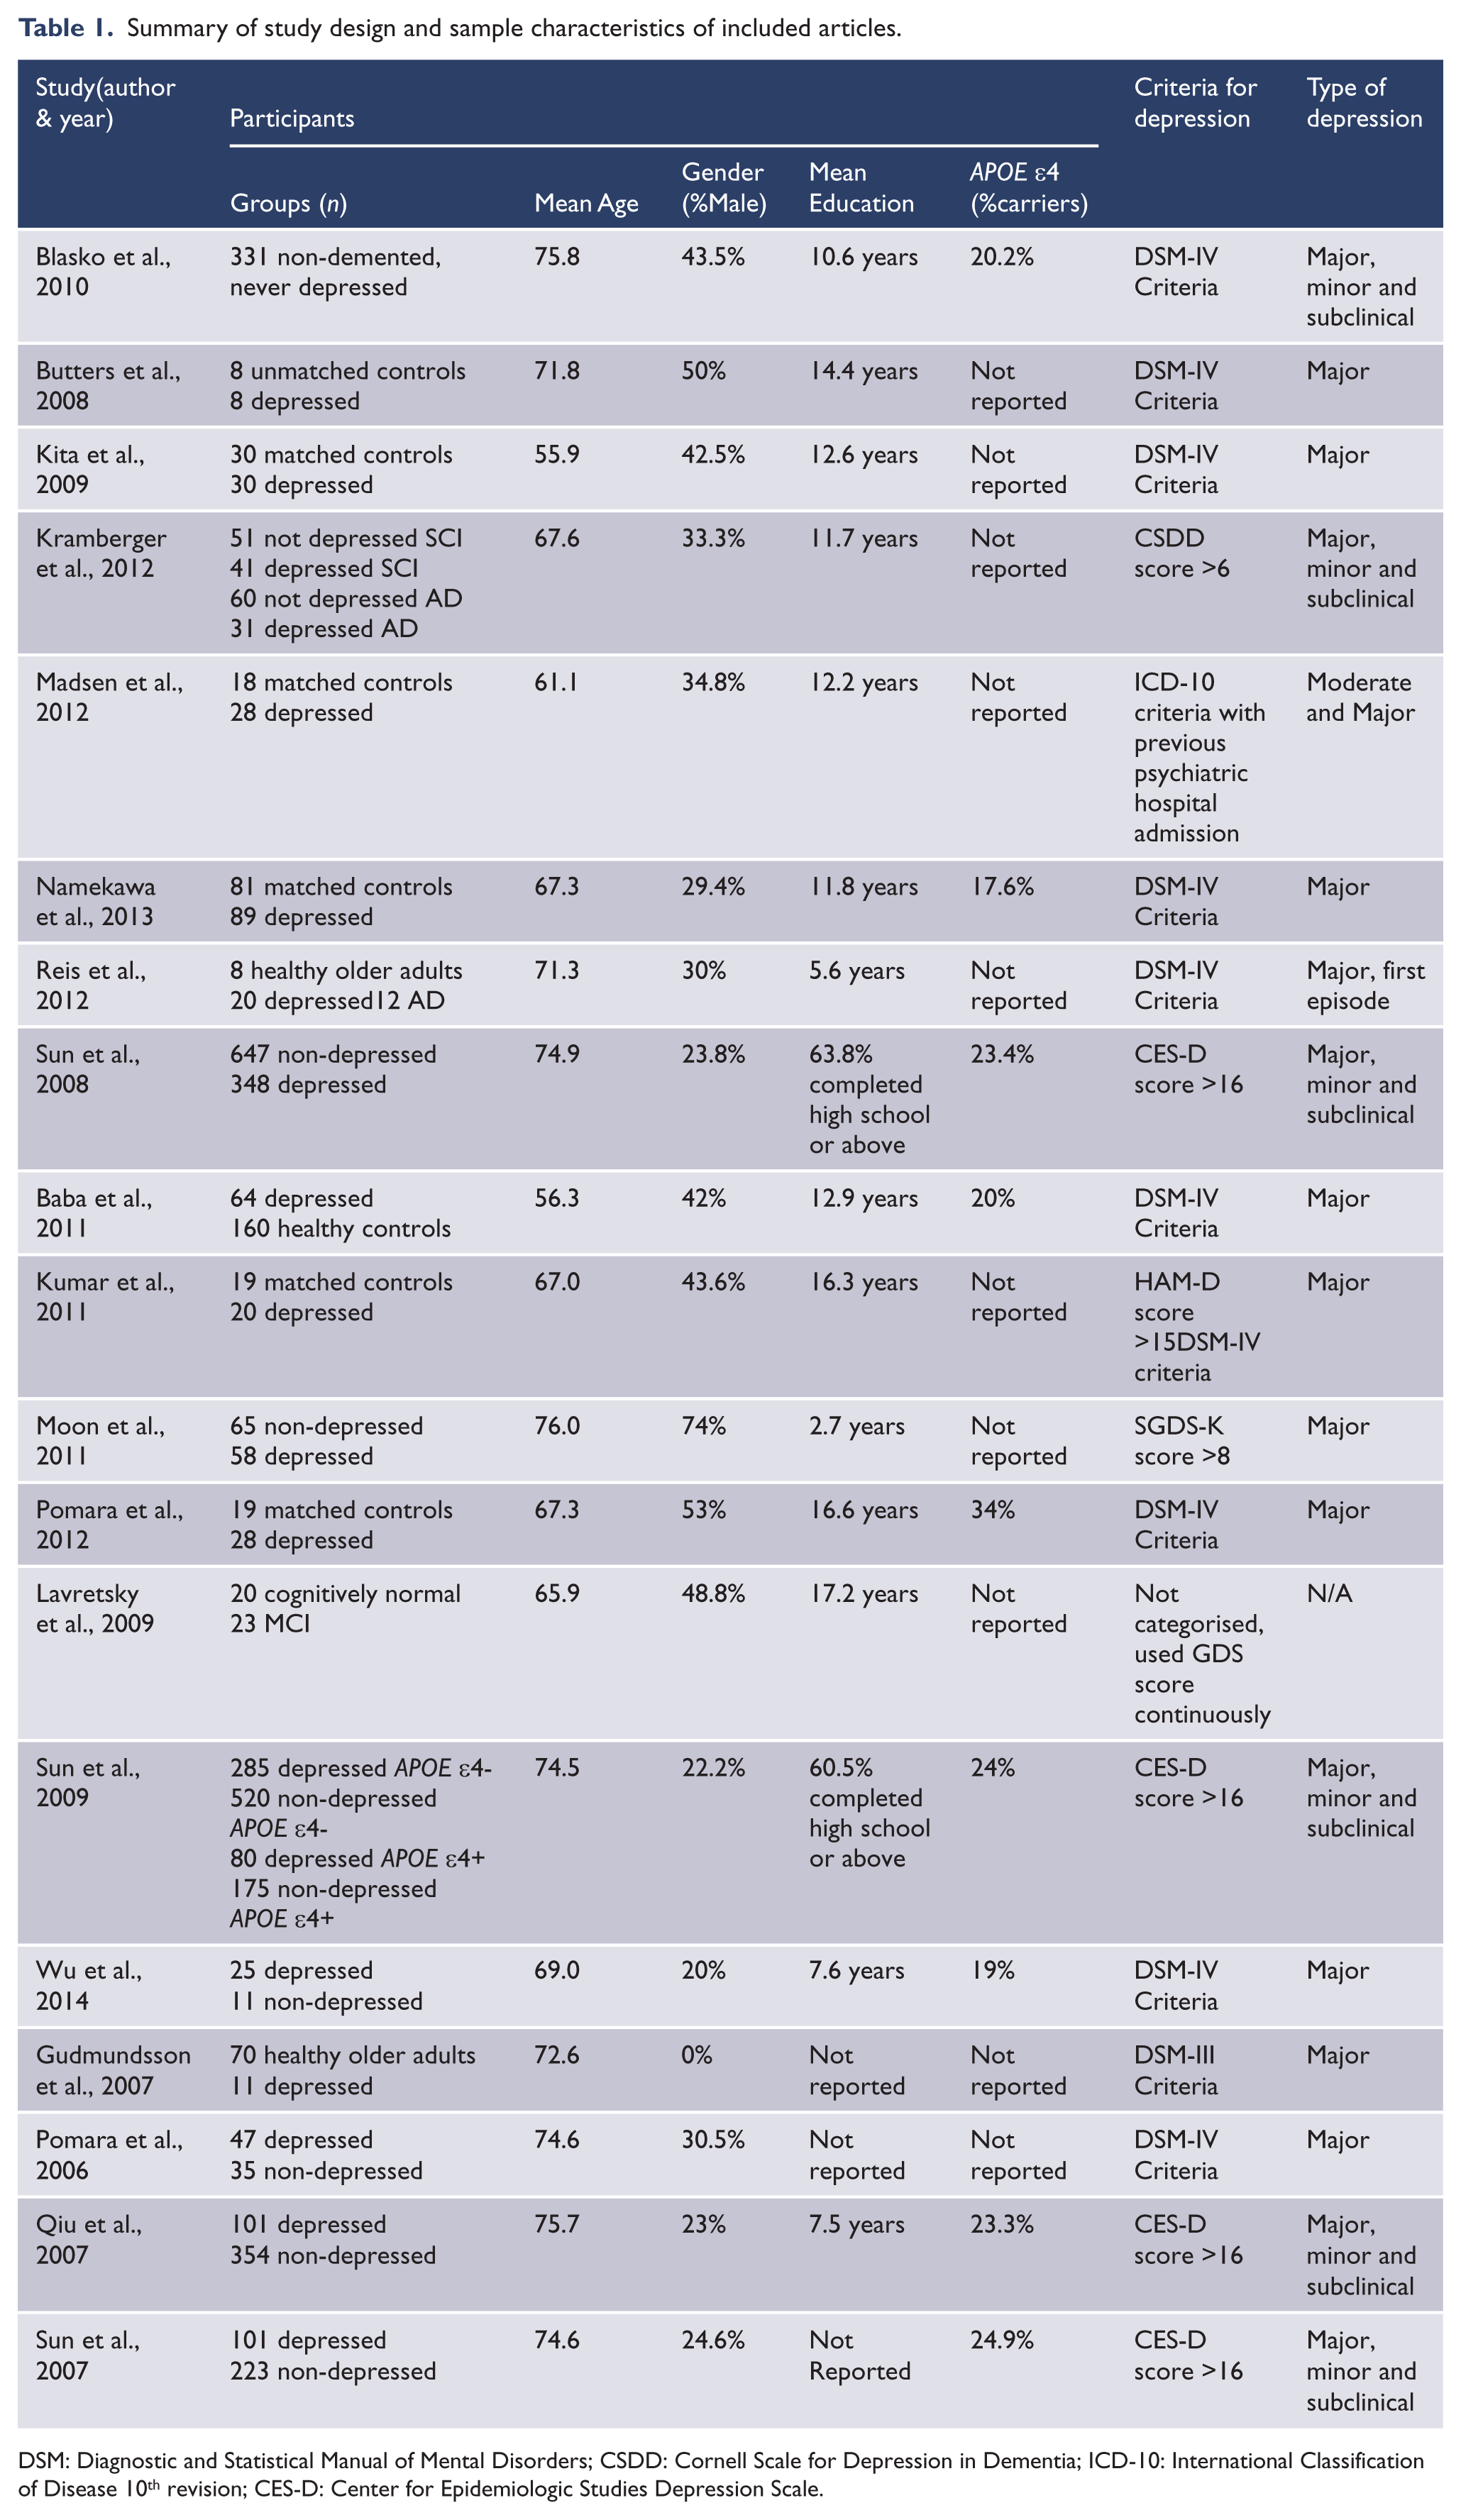
DSM: Diagnostic and Statistical Manual of Mental Disorders; CSDD: Cornell Scale for Depression in Dementia; ICD-10: International Classification of Disease 10th revision; CES-D: Center for Epidemiologic Studies Depression Scale.
Summary of outcome measures, covariates, analytic methods and relevant findings.
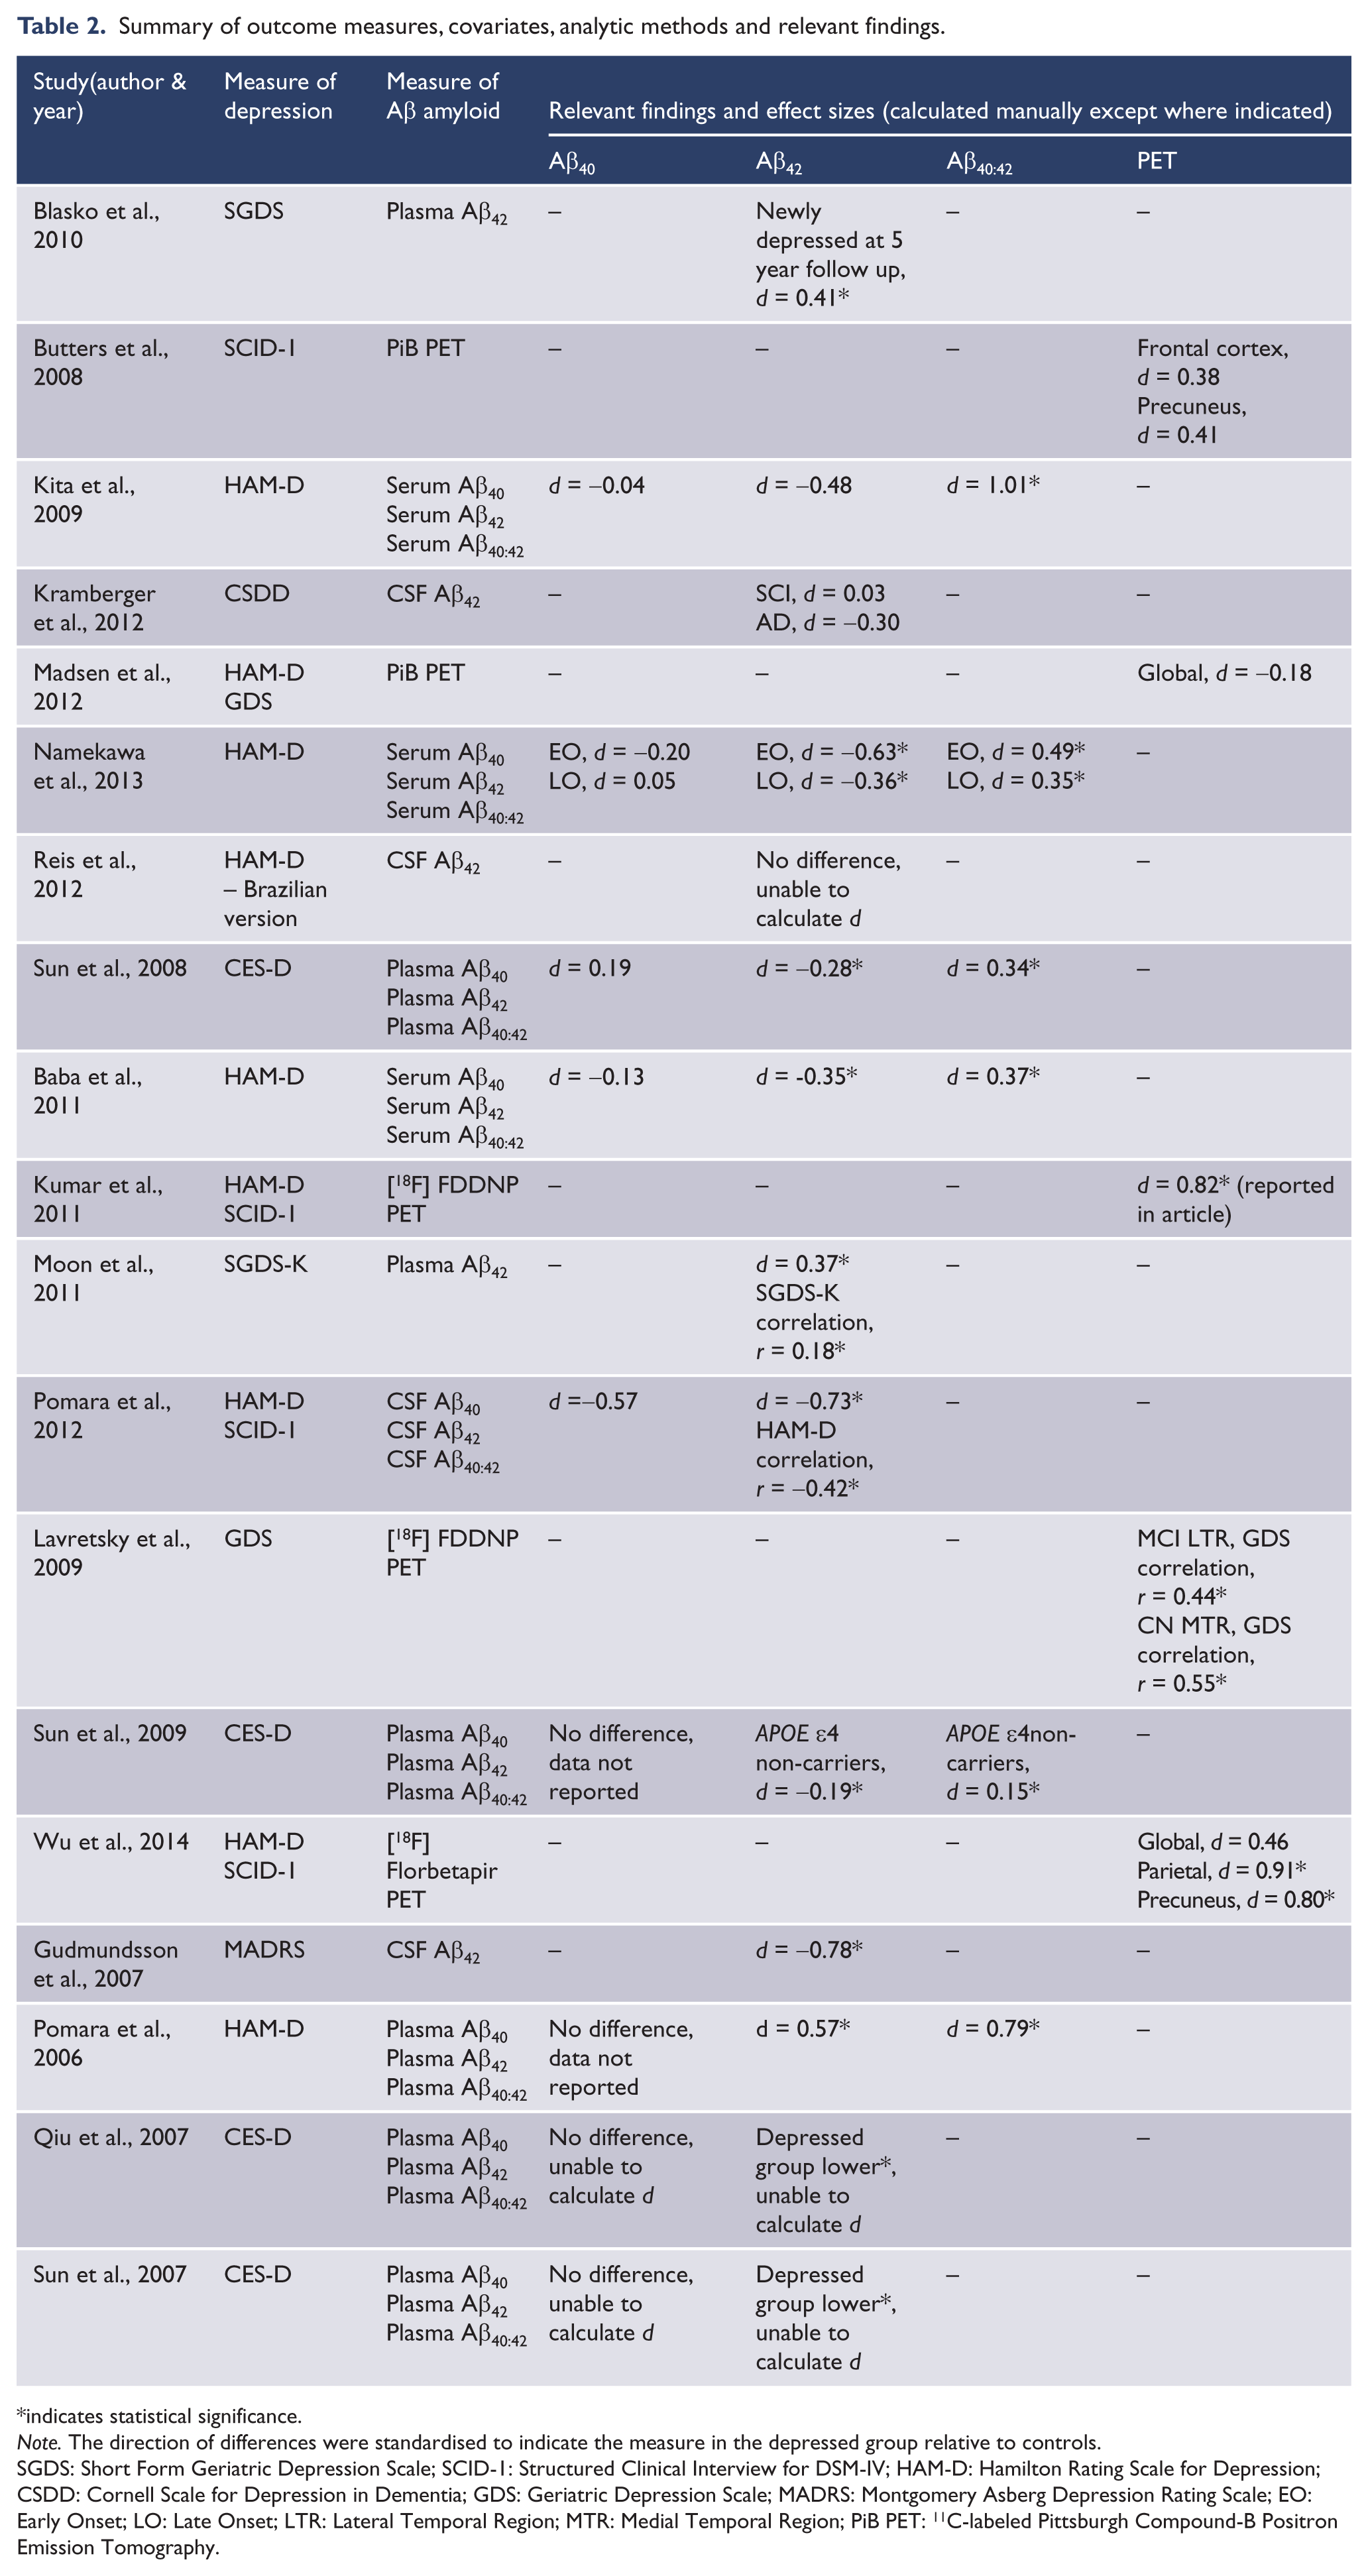
indicates statistical significance.
Note. The direction of differences were standardised to indicate the measure in the depressed group relative to controls.
SGDS: Short Form Geriatric Depression Scale; SCID-1: Structured Clinical Interview for DSM-IV; HAM-D: Hamilton Rating Scale for Depression; CSDD: Cornell Scale for Depression in Dementia; GDS: Geriatric Depression Scale; MADRS: Montgomery Asberg Depression Rating Scale; EO: Early Onset; LO: Late Onset; LTR: Lateral Temporal Region; MTR: Medial Temporal Region; PiB PET: 11C-labeled Pittsburgh Compound-B Positron Emission Tomography.
Study characteristics
Sample sizes studied ranged from n = 16 (Butters et al., 2008) to n = 1060 (Sun et al., 2008), with around half of the studies having a sample size less than n = 50 (Butters et al., 2008; Kumar et al., 2011; Lavretsky et al., 2009; Madsen et al., 2012; Pomara et al., 2012; Reis et al., 2012; Wu et al., 2014). Five studies used healthy control groups matched on key demographic characteristics to the depressed group, while three studies used unmatched healthy older controls. In all control groups, individuals with clinically classified depression were excluded, as were those with history of psychiatric disease. Nine studies created a comparison group from their original sample using individuals who did not meet their defined criteria for depression. Two studies did not include comparison or control groups; one because they did not classify depression and the second because it used a prospective design.
Included studies also varied widely in their consideration of key risk factors for AD and the potential for these factors to bias study results. Half of the studies included samples that contained 40–60% more females than males. Average years of educational attainment ranged from 2.7 to 17.2 years. More than half (n = 10) of the studies did not assess or report the proportion of APOE ε4 carriers in their sample. Variation across study samples on these factors may confound outcomes causing inconsistency across study results.
Definition of depression
The majority of studies used established diagnostic criteria from either the DSM-III (n = 1), the DSM-IV (n = 10) or the ICD-10 (n = 1) to define depression. Four of these 12 studies used current inpatient admission for Major Depressive Disorder in conjunction with diagnostic criteria to define their depressed group. Eighteen studies utilised a standardised measure of depressive symptoms (e.g. the GDS or the Hamilton Depression Scale (HAM-D)) to assess severity of depressive symptoms, with six studies using an established cut score to define their depressive group rather than diagnostic criteria. Only one study (Lavretsky et al., 2009) used a standardised measure of depressive symptoms as a continuous variable without any categorisation.
Measurement of Aβ amyloid
Five studies measured Aβ amyloid using PET neuroimaging; two using PiB, two using the [18F] FDDNP compound, and one using the [18F] Florbetapir compound. CSF Aβ42 was measured by four studies with one study also measuring CSF Aβ40 or the ratio of CSF Aβ40:42. All other studies used blood-based measures of Aβ, seven using plasma and three using serum. Only two of these 10 studies did not include measures of Aβ40 or the ratio of Aβ40:42.
Measurement of cognition
The majority of studies used the Mini Mental State Exam (MMSE) to either screen for cognitive impairments or to compare global cognitive function between groups. Only one study found a statistically significant difference between group mean scores of moderate magnitude (Cohen’s d = -0.31) and that was only for individuals who did not carry an APOE ε4 allele (Sun et al., 2009). Six studies included neuropsychological assessments other than the MMSE to assess cognitive functioning; however, the specific tests used and cognitive domains assessed varied widely between studies. Generally, measures included verbal or visual memory, and language, visuospatial and executive functioning. Comparisons of cognitive function between groups yielded inconsistent results. Two studies found depressed individuals performed significantly worse than non-depressed individuals on measures of memory, executive and visuospatial function. In contrast, two other studies found no significant differences between depressed and non-depressed individuals across a range of cognitive domains. In addition, one study found depressed individuals performed worse than non-depressed individuals on verbal memory, but only within a group who did not carry the APOE ε4allele. This difference was not apparent in a group of APOE ε4 carriers. One study reported a significant association between cognitive performance and the interaction of depressive symptoms and plasma Aβ40:42 ratio; however, this association has not been examined in any of the other studies.
Findings
Nine of the 19 studies used a measure of Aβ40 as a primary outcome measure, all of which failed to find a significant difference in Aβ40 levels between depressed and non-depressed individuals despite finding significant effects with other Aβ amyloid measures. In addition, Aβ40 was not correlated with scores on the HAM-D or with age of onset of depression in two of these studies (Kita et al., 2009; Namekawa et al., 2013).
Fourteen studies used a measure of Aβ42 as a primary outcome. Eleven of these reported statistically significant differences in Aβ42 levels between depressed and non-depressed individuals, and three did not. Ten of the 11 studies that observed a significant difference consistently observed lower Aβ42 levels in depressed individuals relative to non-depressed individuals with the magnitudes of group differences ranging from moderate to large (d = -0.19 to -0.73). Interestingly, one study (Moon et al., 2011) observed moderately higher (d = 0.37) Aβ42 levels in depressed individuals relative to controls. However, as the samples of all studies were not representative of the broader population, this inconsistency in the direction of the group difference between Aβ42 levels may be due to specific biases in a particular sample. Importantly, only one study identified a significant difference between groups when considering individuals without cardiovascular disease and not taking antidepressant medication (Sun et al., 2008). Another study identified a significant difference between groups only after exclusion of individuals who did not carry an APOE ε4 allele (Sun et al., 2009).
Six studies also included a measure of Aβ40:42 ratio as a primary outcome. All six studies indicated that depressed individuals had higher Aβ40:42 ratios than non-depressed individuals (mean d = 0.53), with the magnitude of differences reported by studies ranging from small to large (d = 0.15 to 1.13). Of note, one study only observed this difference in individuals who did not carry an APOE ε4 allele and another study only when considering individuals without cardiovascular disease and not taking antidepressant medication (similar to the differences in Aβ42 level discussed above). However, these effects were identified consistently in both late and early onset depression. Moreover, a significant moderate negative correlation (r = -0.20) was also identified between Aβ40:42 ratio and age of onset of depression by one study (Namekawa et al., 2013).
Five studies used PET neuroimaging as a primary outcome measure, with three observing statistically significant relationships between neuroimaging results and depression status. One study found a large difference (d = 0.82) in FDDNP binding between depressed and non-depressed individuals, with depressed individuals having higher FDDNP binding indicating higher levels of global Aβ amyloid (Kumar et al., 2011). However, another study found moderate to large differences in amyloid binding between groups in the parietal and precuneus regions, but failed to find a significant difference globally (Wu et al., 2014). One study divided their depressed sample into MCI and cognitively normal groups and considered the correlation between FDDNP regional binding and scores on the GDS (Lavretsky et al., 2009). Within the MCI group they observed a moderate positive correlation between GDS scores and FDDNP binding in the lateral temporal region (r = 0.44), while in the cognitively normal group they observed a moderate positive correlation in the medial temporal region (r = 0.55). Interestingly, the two studies that failed to find any relationship between Aβ level and depression used the PiB compound, rather than and 18F compound, to measure amyloid. Therefore variations in results may be due to differences in the two compounds. Further study is required to establish whether differences in Aβ deposition in the brain between depressed and non-depressed individuals can reliably be detected using neuroimaging techniques.
Discussion
This review aimed to improve understanding of relationships between depressive symptoms and AD by reviewing the literature that has explored associations between depressive symptoms, or clinical depression, and levels of Aβ in non-demented older adults. After identifying 535 studies only 19 met inclusion criteria for the current review. Studies were mainly excluded due to non-peer review, non-inclusion of key variables, or animal model or treatment studies (see Figure 1). Results of studies included suggested that individuals with depression tended to have lower Aβ42 levels and higher Aβ40:42 ratios in their blood and CSF when compared with individuals without depression. Furthermore, Aβ40 levels were generally equivalent between those with and without depression. While individuals with depression may also show higher amyloid binding on PET, reports of this were less consistent. This pattern of decreased Aβ42 levels and increased Aβ40:42 ratio in blood and CSF, as well as increased amyloid binding on PET, observed in individuals with depression concords with the pattern of Aβ changes typically observed in patients with AD (Alves et al., 2012; Prvulovic and Hampel, 2011). This suggests the differences observed in individuals with depression may be indicative of the beginning of the pathological cascade of AD and that depression may indeed be an early symptom of AD.
One important caveat is that these results have been observed most consistently using blood-based (plasma or serum) measures of Aβ even though the clinical utility of these measures has yet to be established (Humpel, 2011; Thambisetty and Lovestone, 2010). The ability to detect a difference in Aβ levels between individuals with and without depression using CSF or neuroimaging measures has been less consistent, although when detected, differences observed are consistent with those reported in studies using blood measures of Aβ. This is particularly relevant given CSF and neuroimaging markers have been shown to have good validity and utility in detecting changes in Aβ indicative of early AD (Prvulovic and Hampel, 2011; Visser et al., 2009). One factor that may be driving this inconsistency in detecting differences in Aβ between measurement methods is sample size. Neuroimaging studies have all used relatively small samples (n = 16–47), as have studies using CSF markers (n = 40–183), while studies using blood-based markers have had considerably larger samples (n = 120–1060). Studies using blood markers of Aβ therefore have greater statistical power, resulting in greater ability to detect subtle differences that may occur very early in the AD pathological process. Also of note, 10 of the 19 included studied used blood measures of Aβ, while only five used neuroimaging and four used CSF. Given the higher number of studies, there is greater opportunity to detect and establish a difference in blood-based measures across studies. Differences in sample sizes and the proportion of studies using blood measures of Aβ may be driven by the invasiveness and cost associated with neuroimaging and CSF analysis. Despite the limitations of blood-based measures of Aβ, detection of significant effects in a consistent direction for the majority of studies suggests study findings may be valid. Moreover, as the direction of difference was consistent with patterns observed in AD, this suggests this pattern may be potentially indicative of prodromal AD. Further investigation with neuroimaging and CSF in larger samples is still required to validate this pattern of change in Aβ levels for individuals with depression.
The relationship between depression and Aβ, and the contribution of this relationship to the development of AD, is likely to be complex and underpinned by multiple factors. In addition to increased Aβ deposition, several other biological mechanisms have been proposed to link depression to AD including increased glucocorticoids, vascular disease, alterations in nerve growth factors, hippocampal atrophy, and pro-inflammatory changes (Byers and Yaffe, 2011). Moreover, as such mechanisms may interact to increase an individual’s susceptibility to the development of AD (Byers and Yaffe, 2011), studies with larger samples are required to allow for sophisticated analytical techniques capable of considering variance that may be contributing to group differences other than that resulting from depression. Importantly, none of the 19 included studies were representative of the broader population and many failed to consider the potential influence of factors such as gender, education, premorbid intelligence, APOE ε4 carriage, or other potential mechanisms that might be involved such as glucocorticoid levels or vascular disease.
One important limitation to conclusions drawn from the majority of studies included in this review is that they were of cross-sectional design, whereas AD is a progressive disease. The current model that informs our understanding of AD describes a pathological cascade where biological changes occur over time from within normal ranges to maximally abnormal (Jack et al., 2010). Therefore measurement of relationships between depression and Aβ at a single time point may not effectively capture the role of depression in the development or presentation of AD. This is particularly the case in the early or preclinical stages of AD where changes are only beginning to occur, potentially differing from normal ranges only marginally. Restricting assessments to a single time point also prevents ascertainment of whether participants progress to clinical and cognitive symptoms of AD, or the role depression might play in the emergence of these signs. Furthermore, it is unclear whether Aβ levels in depressed individuals continue to change in line with the pathological trajectory of AD, remain stable over time, or even return to normal ranges.
Consideration of the trajectory of cognitive function over time would also be useful in elucidating the contribution of depression to the AD pathological process, and in particular its relationship to Aβ changes. The hallmark of AD is progressive cognitive decline (Albert, 2011), and current criteria for identification of prodromal AD is decline in performance on objective cognitive measures in addition to a biomarker of AD, such as Aβ levels (Albert et al., 2011; Sperling et al., 2011). As such, it is important to consider the role of cognition in the relationship between depression and Aβ, particularly in non-demented older adults, to confirm the syndrome observed is AD in its prodromal phases. While all studies included at least a cognitive screening measure, these measures are unlikely to be sensitive to the subtle changes that occur in older adults in the prodromal phases of AD. Consistent with investigations into cognitive impairment in prodromal AD (Harrington et al., 2013; Hedden et al., 2013; Mathis et al., 2013; Sperling et al., 2013), differences in cognitive function between groups were not consistently detected even with a more comprehensive neuropsychological assessment (Blasko et al., 2010; Kumar et al., 2011; Madsen et al., 2012; Pomara et al., 2012; Sun et al., 2008). Longitudinal assessment of cognitive function is necessary to detect early changes in function as a result of AD pathology (Albert et al., 2007; Doraiswamy et al., 2012; Lim et al., 2013a, 2013c; Small et al., 2012; Stomrud et al., 2010). In addition, it may be useful in differentiating cognitive impairment secondary to depressive symptoms from true AD. If a specific cognitive profile differentiates those with depression in the prodromal stages of AD, and have changes in Aβ, from individuals with depression who will recover, differential diagnosis would be greatly improved.
Future directions
Given the wide variability in sample sizes and characteristics, and the lack of representativeness to the broader population of all study samples included in this review, results of these studies must be interpreted with caution. Although consistent results were reported by many studies, indicating individuals with depression show patterns of Aβ levels consistent with those shown by AD patients, further investigation is required to characterise the nature and magnitude of the relationship between depression and Aβ, particularly longitudinally. Future investigations should control for the effects of sample characteristics on study outcomes. More importantly, future studies should consider using neuroimaging and CSF techniques to assess Aβ levels, as these have been established to have good utility and validity. In addition, future studies should report the statistics and characteristics, such as effect sizes, to allow for inclusion in meta-analysis.
Longitudinal assessment would allow differentiation of effects of the interaction between depression and Aβ from other factors and help in identifying individuals with depression who go on to develop AD and those who do not. The Australian Imaging Biomarkers and Lifestyle (AIBL) Flagship Study of Ageing is one of several large cohort studies currently running around the world, with the aim of improving early identification of AD and consists of participants assessed at 18-month intervals over 4.5 years (Ellis et al., 2009). Investigation of the relationship between Aβ and depression in such a cohort would allow for consideration of how depression and Aβ accumulation develop in parallel and interact over time, and importantly how this interaction then affects cognitive function and subsequent progression to AD dementia.
Footnotes
Funding
This research received no specific grant from any funding agency in the public, commercial or not-for-profit sectors.
Declaration of interest
The authors report no conflicts of interest. The authors alone are responsible for the content and writing of the paper.