
Abstract
Objectives:
There are wide global variations in electroconvulsive therapy (ECT) use patterns. This audit reviewed patient-level ECT use patterns over 10 years at a single New Zealand clinic, including factors associated with clinical response and patterns of repeated administration.
Methods:
Retrospective audit of all 2003–2012 ECT and clinical file data.
Results:
A total of 199 patients received ECT, which was used to treat mostly affective disorders in a predominantly female, older population, generally with a single course of treatment. There were different demographics and patterns of ECT use between patients being treated for affective and psychotic disorders. Overall treatment response was high, with over 90% of patients having a full or partial response. Treatment response was not associated with diagnosis, gender, or medication use, but showed a trend in significance for greater response in elderly patients.
Conclusions:
ECT use patterns in Otago New Zealand are similar to those reported in Australia, USA, and UK, although yearly use rate in Otago is lower. Because of their different demographic and ECT treatment patterns, future studies should report data for patients with affective and psychotic disorders separately.
Introduction
Global patterns of ECT use show wide variations in, for example, rates of administration, patient demographics, and types of disorders treated with ECT (Leiknes et al., 2012). For example, its use is predominantly in older females with affective disorders in Australia, USA, and UK, and younger males with schizophrenia in Asia (Leiknes et al., 2012). The majority of published data on this topic have reported population-level data, which complicates assessment of factors associated with therapeutic outcome, retreatment, etc. Fewer than 20% of these publications were of ECT use patterns using individual patient data (Leiknes et al., 2012). Of these, the majority reported older data (>20 years old), which could reflect outmoded clinical practice, and/or were reported treatment patterns over relatively brief durations (<2 years). In New Zealand, the Ministry of Health publishes annual reports on population-level ECT use (NZ Ministry of Health, 2011); however, there have been no patient-level data analysed or reported. In addition, almost all publications report pooled data for patients with psychotic and affective disorders, although it is likely that characteristics of the two groups are different.
The objective of this audit was to review patient-level patterns of ECT use over 10 years at a single clinic, and to examine factors associated with clinical response and patterns of repeated administration.
Materials and methods
The protocol for this audit was approved by the Lower South Ethics Committee (LRS/12/EXP/005). Patient-level data for ECT treatment were available from July 2003 to December 2012 for the Southern District Health Board (SDHB). SDHB has a single ECT treatment clinic for the provinces of Otago (population 194,000, 13.8% >65 years) and Southland (91,000, 13.9% >65 years; Statistics New Zealand, 2006). Data on demographics (age at first ECT during 2003–12, gender, ethnicity), clinical features (main diagnosis, subsequently clustered into affective vs. psychotic disorder, drug treatment, whether treatment was voluntary or involuntary, inpatient vs. outpatient treatment)m and ECT treatment (number of treatments and courses, unilateral vs. bilateral (bitemporal) treatment, acute vs. maintenance, voluntary vs. compulsory) were obtained from electronic and paper clinical records. Response to treatment was based on clinical impression from patients’ files and was categorized as none, partial, or complete response. ECT treatment was coded as bilateral if administered this way one or more times during a course.
Data were analysed using descriptive measures (proportions, means, and standard deviations. Normality of distribution of variables (e.g. age) was assessed using the Shapiro–Wilk test. Correlation of categorical variables was assessed using Pearson’s R. Testing for subgroup analyses included chi-squared test, analysis of variance (for normally distributed continuous variables), and Kruskal–Wallace testing (for non-normally distributed data). Linear regression models were utilized for univariate and multivariate analysis of continuous variables. Ordinal logistic regression models were utilized for univariate and multivariate analysis of the primary outcome for clinical response, using Stata 12.0.
Results
Clinical and demographic data
Between 2003 and 2012, 199 patients received one or more courses of ECT treatment. The most common diagnoses associated with use of ECT were the affective disorders (major depressive disorder 74.8% and bipolar disorder 14%; 88.8% combined), and psychotic disorders (schizoaffective disorder, catatonia, and schizophrenia 11.2% combined). The majority of treatments were performed in hospital inpatients (87.8%), and as voluntary treatment (78.1%). Treatment under the Mental Health Act was higher for patients with psychotic disorders (18/32) than with affective disorders (19/137; Pearson chi-squared 27.25, p<0.0001).
The age distribution of all patients at first ECT treatment is shown in Figure 1. Age was not normally distributed (p<0.001), with approximately one-third of patients aged 80 years or more. The mean age was 64.8±18.0 years (range 21–91). Patients being treated for affective disorders were significantly older (67.2±17.8) than psychotic disorders (51.2±13.1, p<0.001; Figure 1). For all patients, females outnumbered males 2:1 (67.3 vs. 32.7%). The female:male ratio was greater for patients treated for affective disorders (3:1) than for those with psychotic disorders (1:1). Almost all patients were European (96.7%).
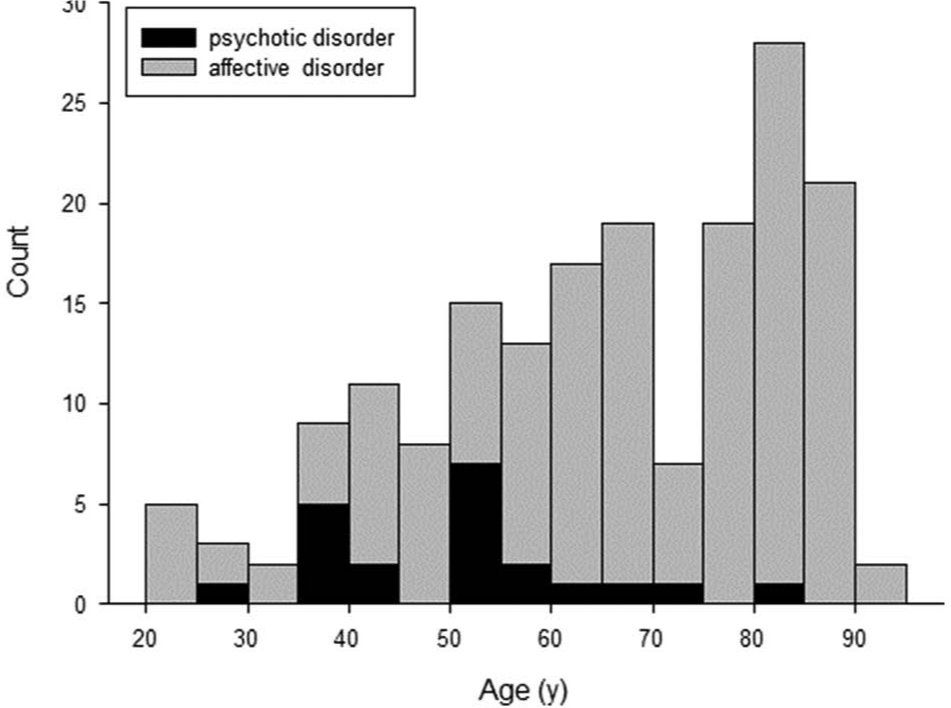
Age distribution of patients at first ECT treatment between 2003–2012. Black bars, patients with psychotic disorders; grey bars, patients with affective disorders.
ECT utilization
Brief-pulse ECT was always administered modified, using a Thymatron System IV machine (Somatics, Lake Bluff, IL, USA). It was most often used as acute treatment (73.9%), with a minority of patients receiving maintenance treatment (26.1%). Maintenance ECT was used for similar proportions of patients treated for affective disorders (28%) as psychotic disorders (20%). The majority of ECT courses (67.6%) included one or more bilateral ECT treatments. Medications used during ECT included antidepressants (85.5%), antipsychotics (69.3%), anxiolytics/hypnotics (55.9%), and mood stabilizers (30.1%).
Number of ECT courses received and inter-treatment intervals
The number of ECT treatments/year and number of patients treated/year are shown in Figure 2. There were a total of 3371 ECT treatments and 501 ECT courses administered during 2003–2012. The mean number of patients receiving ECT each year was 34.3 (range 28–47). The mean yearly rate for ECT treatment was 1.20 patients treated/year/10,000 population (34.3 patients treated/year/285,000 residents). While there was little change in the relationship between year and number of ECT treatments (R2 0.105, p=0.361; Figure 2, left), there was a modest positive relationship between year and number of patients treated (R2 0.553, p=0.014, right). The majority of patients treated and treatments administered were for affective disorders.
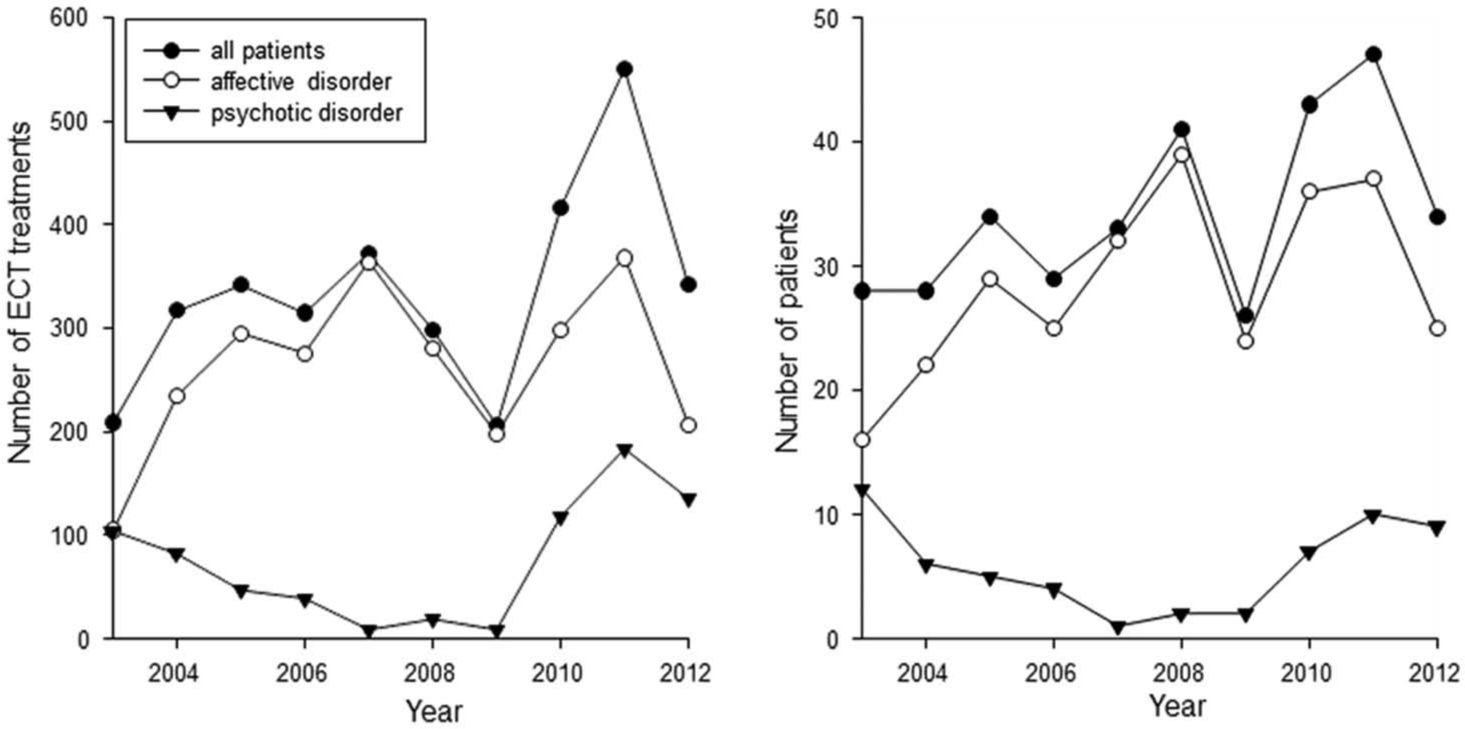
Number of courses of ECT treatments/year (left) and number of patients treated/year (right) for all patients, patients with affective disorders, and patients with psychotic disorders.
The distribution of number of ECT courses for each individual is shown in Figure 3. The majority of patients (126/199, 63.3%) had a single course of ECT; 85.9% of all patients had three or fewer courses of ECT. A greater proportion of patients treated for psychotic disorders had only one course of ECT (33/41) compared with patients with affective disorders (93/158; Pearson’s chi-squared 6.56, p=0.01). Only three individuals (three females with major depressive disorder aged 79, 84, and 88 years) had more than 10 courses of ECT.
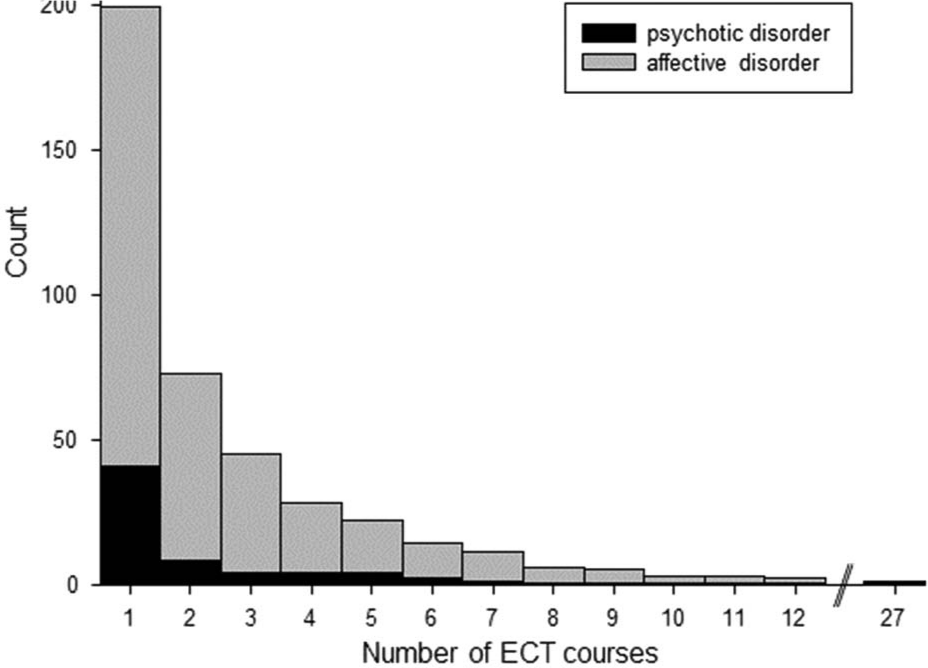
Distribution of number of ECT courses for each individual. Black bars, patients with psychotic disorders; grey bars, patients with affective disorders.
Overall, the duration between the first and subsequent ECT courses became progressively shorter over time (R2 0.867, p=0.001). While the duration between subsequent ECT courses had a clear trend of progressively shorter intervals over time for patients treated for affective disorders (R2 0.765, p=0.004; Figure 4, left), there was no trend noted for those treated for psychotic disorders (R2 0.007, p=0.874; right).
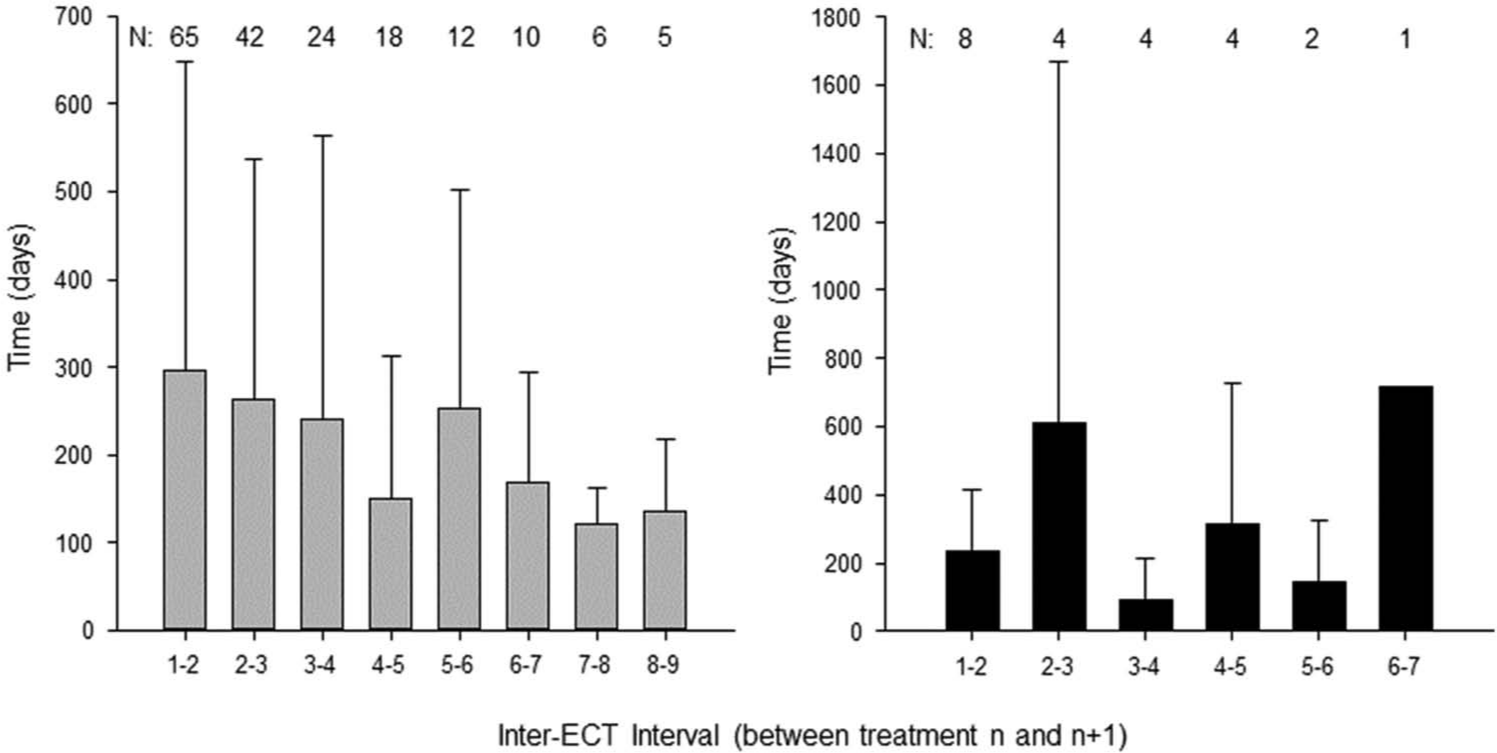
Time between ECT courses for patients with affective disorders (left) and patients with psychotic disorders (right).
Treatment response
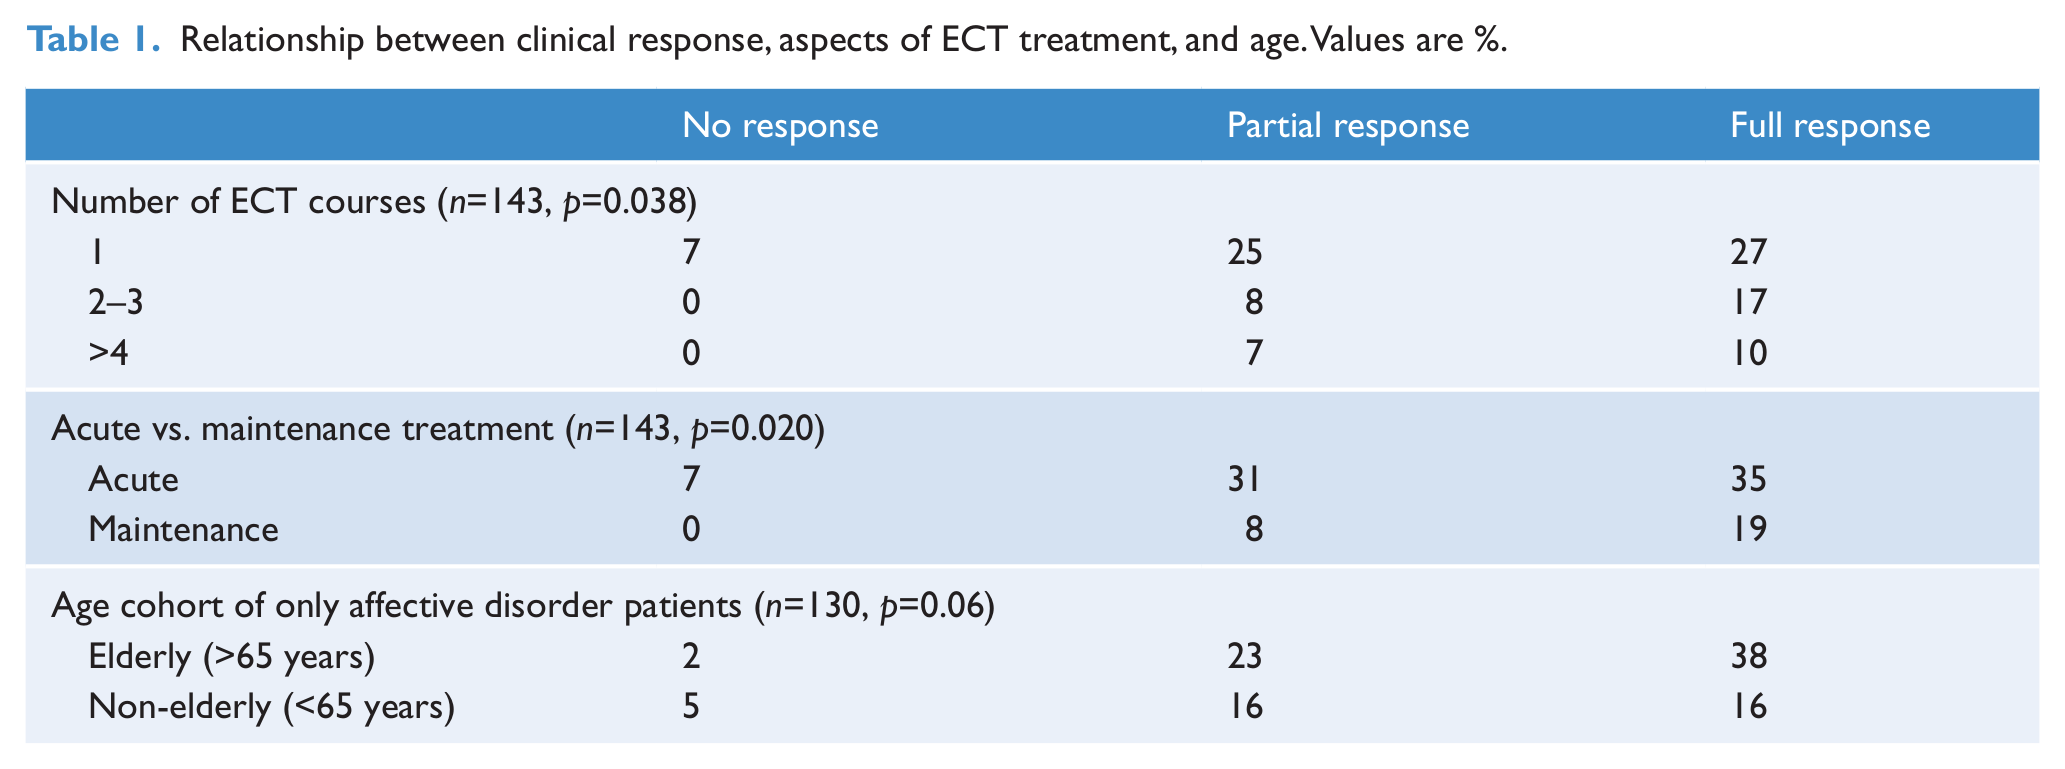
Treatment response data were available for only 143 patients. It was reported as complete in 53.8%, partial in 39.2%, with non-response in 7%. Patients who had a full or partial response to ECT had a higher number of ECT courses (2.4±2.0 and 2.0±1.8, respectively) than patients who had no response (1.0±0.0, F=3.648, p=0.04). Positive clinical response was positively associated with higher rates of maintenance treatment (Table 1, middle; Pearson’s chi-squared 7.84, Pearson’s R 0.233, p=0.02) and with higher numbers of ECT courses (Table 1, upper; Pearson’s chi-squared 10.09, Pearson’s R 0.193, p=0.04). Treatment response was not significantly associated with diagnosis (p=0.64), gender (p=0.41), or medication use (p=0.31–0.82 for different medication classes). Treatment response in the elderly (>65 years) showed a trend in significance for greater improvement compared with non-elderly subjects (Pearson’s chi-squared 5.26, p=0.07). Treatment response in the elderly with affective disorders showed a similar trend compared with non-elderly (Table 1, lower; Pearson’s chi-squared 5.70, p=0.06). It was not possible to analyse treatment response in elderly patients with psychotic disorders as only one patient was >65 years.
Relationship between clinical response, aspects of ECT treatment, and age. Values are %.
Discussion
This audit of 10 years of patient-level ECT treatment data in a single centre has identified a number of expected as well as novel findings. Overall, ECT was used to treat mostly affective disorders in a predominantly female, older, Caucasian population, generally with a single course of treatment. However, the population being treated was not homogenous, with different demographics and patterns of ECT use for patients being treated for affective disorders compared with those treated for psychotic disorders. Overall, treatment response was high, with over 90% of patients having a full or partial response to ECT treatment.
Our findings are similar to those reported from Australian, US, and UK centres (Leiknes et al., 2012). The characteristics of patients receiving ECT were similar, with the majority of patients treated for affective disorders, and who were predominantly inpatient, female, European, and older. The proportion of Maori patients treated with ECT (0.7%) is lower than population numbers (7.9%; Statistics New Zealand, 2006). Low rates of ECT use in Maori have been highlighted previously (NZ Ministry of Health, 2011).
The proportion of patients receiving ECT under the Mental Health Act (21.9%) is consistent with an earlier report from Scotland (Fergusson et al., 2004); however, this rate does vary internationally (Leiknes et al., 2012). A higher proportion of patients with psychotic disorders (56%) were treated under the Mental Health Act compared with patients with affective disorders (14%), which are very similar to rates reported in a recent Australian state-wide audit (60 and 17%, respectively; Plakiotis et al., 2012). There are few data on rates of use of maintenance ECT (Leiknes et al., 2012). Our finding of 26.1% of patients receiving maintenance ECT is not dissimilar from that reported from Australia, India, and Norway (14–25%; Agarwal et al., 1992; Chanpattana, 2007; Schweder et al., 2011) and may be due to the high proportion of elderly patients being treated. The paucity of data regarding use of maintenance ECT has been highlighted (Petrides et al., 2011).
Although there was a trend for numbers of patients receiving ECT to increase over 10 years, the number of treatment courses each year did not. The mean yearly rate for ECT treatment was 1.20 patients treated/year/10,000 population. Internationally, this is in the lower third of reported yearly treated person rates (Leiknes et al., 2012). Globally there is a 46-fold range in this rate (0.11–5.10; Leiknes et al., 2012) which could be due to many factors, including service availability, local treatment practices, and/or population demographics. However, our rate was lower than those published from US, UK, and Australian centres (Leiknes et al., 2012), which appear to treat similar patient populations and have comparable clinical ECT practice.
With few exceptions (Eranti et al., 2011; Plakiotis et al., 2012), almost all published reports on patterns of ECT use have presented combined population-level data from patients being treated for affective disorders and psychotic disorders (Leiknes et al., 2012). The two patient groups differ in terms of demographics and treatment use patterns. Compared with patients with psychotic disorders, the affective disorder treatment population was older (mean difference 16 years) and predominantly female. Repeat ECT courses were significantly less common in patients treated for psychotic disorders than affective disorders, and duration between repeat courses differed between the two populations. There were also some similarities, as rates of treatment response and use of ECT as maintenance treatment were similar for both populations. However, the identified differences suggest that it may be important to present separate data from both patients groups in future analyses of ECT use patterns.
Response to ECT was substantial, with full or partial response in 93% of patients, and this has been consistently reported by other studies (Leiknes et al., 2012). Response to ECT was similar in patients with affective and psychotic disorders. The finding that patients who responded to ECT had more courses of ECT than those who did not respond presumably reflects no further use of ECT in non-responders, rather than overtreatment of responders. The association of positive clinical response with use of maintenance ECT and greater numbers of ECT courses may also reflect selection of an ECT-responsive group of patients. We observed a trend in significance for greater clinical response in elderly compared with non-elderly patients (post-hoc calculation of statistical power showed this to be modest, 0.51). Our findings would support earlier reports of ECT being more effective for treatment of older depressed patients compared with non-elderly depressed (Dombrovski et al., 2005; Nordenskjöld et al., 2012; O’Connor et al., 2001), although this has not been reported consistently (Damm et al., 2010; Eranti et al., 2011).
Uniquely, because we were able to track individual patient ECT use over 10 years, we have identified patterns around repeat use over a decade. The majority of patients received one or two courses during a 10-year period; fewer than 15% of all patients had four or more courses. Patients with affective disorders had a higher proportion of repeated treatments than did those with psychotic disorders, and also showed a progressively shorter time to retreatment. The duration between successive ECT courses decreased over time in patients treated for affective disorders, but not in patients receiving ECT for psychotic disorders (Figure 4). Multiple repeat courses of ECT were used in a small group of much older patients with severe recurrent affective disorders, who presumably had not responded to or could not tolerate oral medication for their mood disorder, and for whom repeat ECT treatment was the only alternative available. Although we found that the proportion of patients requiring a second course of ECT treatment and time to retreatment (41%, 10 months) were not dissimilar to those of a recent meta-analysis on depressive relapse post-ECT (51% of depressed patients relapsing within 12 months of completing a course of ECT (Jelovac et al., 2013), this pattern appears to change for subsequent treatments: progressively fewer patients relapse and the time to retreatment shortens. Further long-term studies with individual patient data are needed to clarify patterns of ECT retreatment over time.
A number of potential shortcomings in this analysis must be acknowledged. Ideally, data collection should have been prospective rather than retrospective. Data on treatment outcome was based on clinical impression rather than on rating scales. Detailed information to identify other relevant factors that might influence ECT use (e.g. demonstrated resistance to oral medication) was not consistently available in patients’ medical notes. Because of the relatively small numbers of patients with psychotic disorders treated with ECT, this analysis would be relatively underpowered to show small differences between the affective and psychotic disorder populations.
In conclusion, this retrospective audit of patient-level ECT data over 10 years at a single centre has highlighted the importance of separately analysing ECT use data from patients with psychotic and affective disorders, because of their different demographic and ECT treatment patterns. New Zealand ECT use patterns are not dissimilar from those published from Australian, US, and UK centres, although the yearly ECT use rate is lower than those reported from these countries. The strongly positive treatment outcomes for both affective and psychotic disorders underscore the importance of ECT as a treatment option in contemporary psychiatric practice.
Footnotes
Acknowledgements
We appreciate the assistance of Southern District Health Board and Ward 6C staff in data collection, especially Phyllis Clarkson and Deborah Johnson.
Funding
This research received no specific grant from any funding agency in the public, commercial, or not-for-profit sectors.
Declaration of interest
The authors report no conflicts of interest. The authors alone are responsible for the content and writing of the paper.