
Abstract
Objective:
Binocular rivalry refers to a situation where contradictory information is presented simultaneously to the same location of each eye. This leads to the alternation of images every few seconds. The rate of alternation between images has been shown to be slower in euthymic participants with bipolar disorder than in healthy controls. The alternation rate is not uniformly slowed in bipolar disorder patients and may be influenced by clinical variables. The present study examined whether bipolar disorder patients have slower alternation rates, examined the influence of depression and explored the role of clinical variables and cognitive functions on alternation rate.
Method:
Ninety-six patients with bipolar disorder and 24 control participants took part in the study. Current mood status and binocular rivalry performance were analysed with nonparametric tests. A slow and a normal alternation group were created by median split. We subsequently explored the distribution of several clinical variables across these groups. Further, we investigated associations between alternation rate and various cognitive functions, such as visual processing, memory, attention and general motor speed.
Results:
The median alternation rate was significantly slower for participants with bipolar disorder type I (0.39 Hz) and for participants with bipolar spectrum disorder (0.43 Hz) than for control participants (0.47 Hz). Depression had no effect on alternation rate. There were no differences between participants with bipolar disorder type I and type II and in regard to medication regime and predominance of one rivalry image. There were also no differences in regard to the clinical variables and no significant associations between alternation rate and the cognitive functions explored.
Conclusion:
We replicated a slowing in alternation rate in some bipolar disorder participants. The alternation rate was not affected by depressed mood or any of the other factors explored, which supports views of binocular rivalry rates as a trait marker in bipolar disorder.
Introduction
In binocular rivalry tasks, one image is presented to one location of the right eye’s retina, while a different image is presented to the same location on the left eye’s retina. If images are sufficiently different, they are not merged by the visual system or perceived as superimposed; instead, the contradictory information leads to automatic alternations of the two images presented. Alternation rates vary between individuals, but are stable within an individual (Miller et al., 2010). Patients with bipolar disorder (BD) consistently show a different performance than control participants in this task (Miller et al., 2003; Nagamine et al., 2009; Pettigrew and Miller, 1998). In general, euthymic BD patients have been shown to have slower alternation rates; that is, they stay longer with the current image than healthy control participants (Miller et al., 2003; Nagamine et al., 2009; Pettigrew and Miller, 1998). Accordingly, slow binocular rivalry rate has been considered as a trait marker in BD (Miller et al., 2003; Pettigrew and Miller, 1998) and a recent twin study supported this view by showing a sizable genetic contribution to the variation of binocular rivalry rates (Miller et al., 2010). Other studies used ambiguous, multistable figures, such as the Necker cube, and, more recently, ambiguous structure-from-motion stimuli. These stimuli may be based on the same mechanism as binocular rivalry (Leopold and Logothetis, 1999), but this viewpoint has been criticised (Meng and Tong, 2004). Studies using these types of stimuli also show a slowed alternation rate in BD participants (Hunt and Guilford, 1932; Krug et al., 2008). Only Hoffman et al. (2001) reported contradictory results. They investigated alternation rates with the Necker cube in patients with a current episode of the manic spectrum and found them to be faster than the rates observed in control participants. Participants with a diagnosis of major depression were found, as a group, to have normal alternation rates, with depressive state on the limited available data not obviously related to alternation rate in either this group or in BD (Miller et al., 2003). It remains possible, therefore, that not only manic mood but also depressive mood may have an effect on the alternation rate observed in BD participants.
Although BD participants as a group have a slower alternation rate, there is considerable overlap with alternation rates of control participants. It seems that only a subgroup of those with BD are slower than control participants and thus responsible for the group differences reported; another group seems to fall within normal alternation rates (Krug et al., 2008; Nagamine et al., 2009). It is possible that these differences are associated with characteristics of the BD patient. For example, Nagamine et al. (2009) showed that only patients with BD type I (BD-I) were slow to alternate binocular rivalry images, but not patients diagnosed with BD type II (BD-II).
Binocular rivalry is thought to involve both early visual processing in the primary visual cortex or the lateral geniculate nucleus (Blake, 1989) as a result of interocular competition, and a late stage of processing as a result of competition between pattern representations (Leopold and Logothetis, 1996; reviewed in Blake and Logothetis, 2002). Accordingly, any slowing of alternations may be related to a general visual processing deficit or a deficit in perception. Attention may also influence alternation rate, as binocular rivalry has been shown to be affected by attentional processes (Zhang et al., 2012). Further, general motor slowing or memory dysfunction may also contribute to a slowing in binocular rivalry alternation rates. Problems with visual functions and motor speed have been observed in BD participants (Antila et al., 2010; Chen et al., 2006; Clark and Goodwin, 2004; Salazar-Fraile et al., 2009; Serper, 1993). In addition, numerous studies of BD have reported deficits in the area of memory and attention (Bora et al., 2009). It is therefore conceivable that functioning in one or more of these cognitive areas is associated with binocular rivalry rates in BD participants. This potential relationship has not yet been investigated systematically. To further test whether binocular rivalry rate is, as suggested, a trait marker for BD, the independence of alternation rates from cognitive functioning should be assessed.
The present study has four objectives. We plan to (i) replicate the finding of slower binocular rivalry rates in patients with BD than in healthy controls; (ii) explore the impact of depressive state on binocular rivalry rates; (iii) explore differences in clinical features between BD with and without a slow alternation rate; and (iv) investigate potential associations between alternation rate and tasks assessing a broad variety of cognitive functions.
Materials and methods
Participants
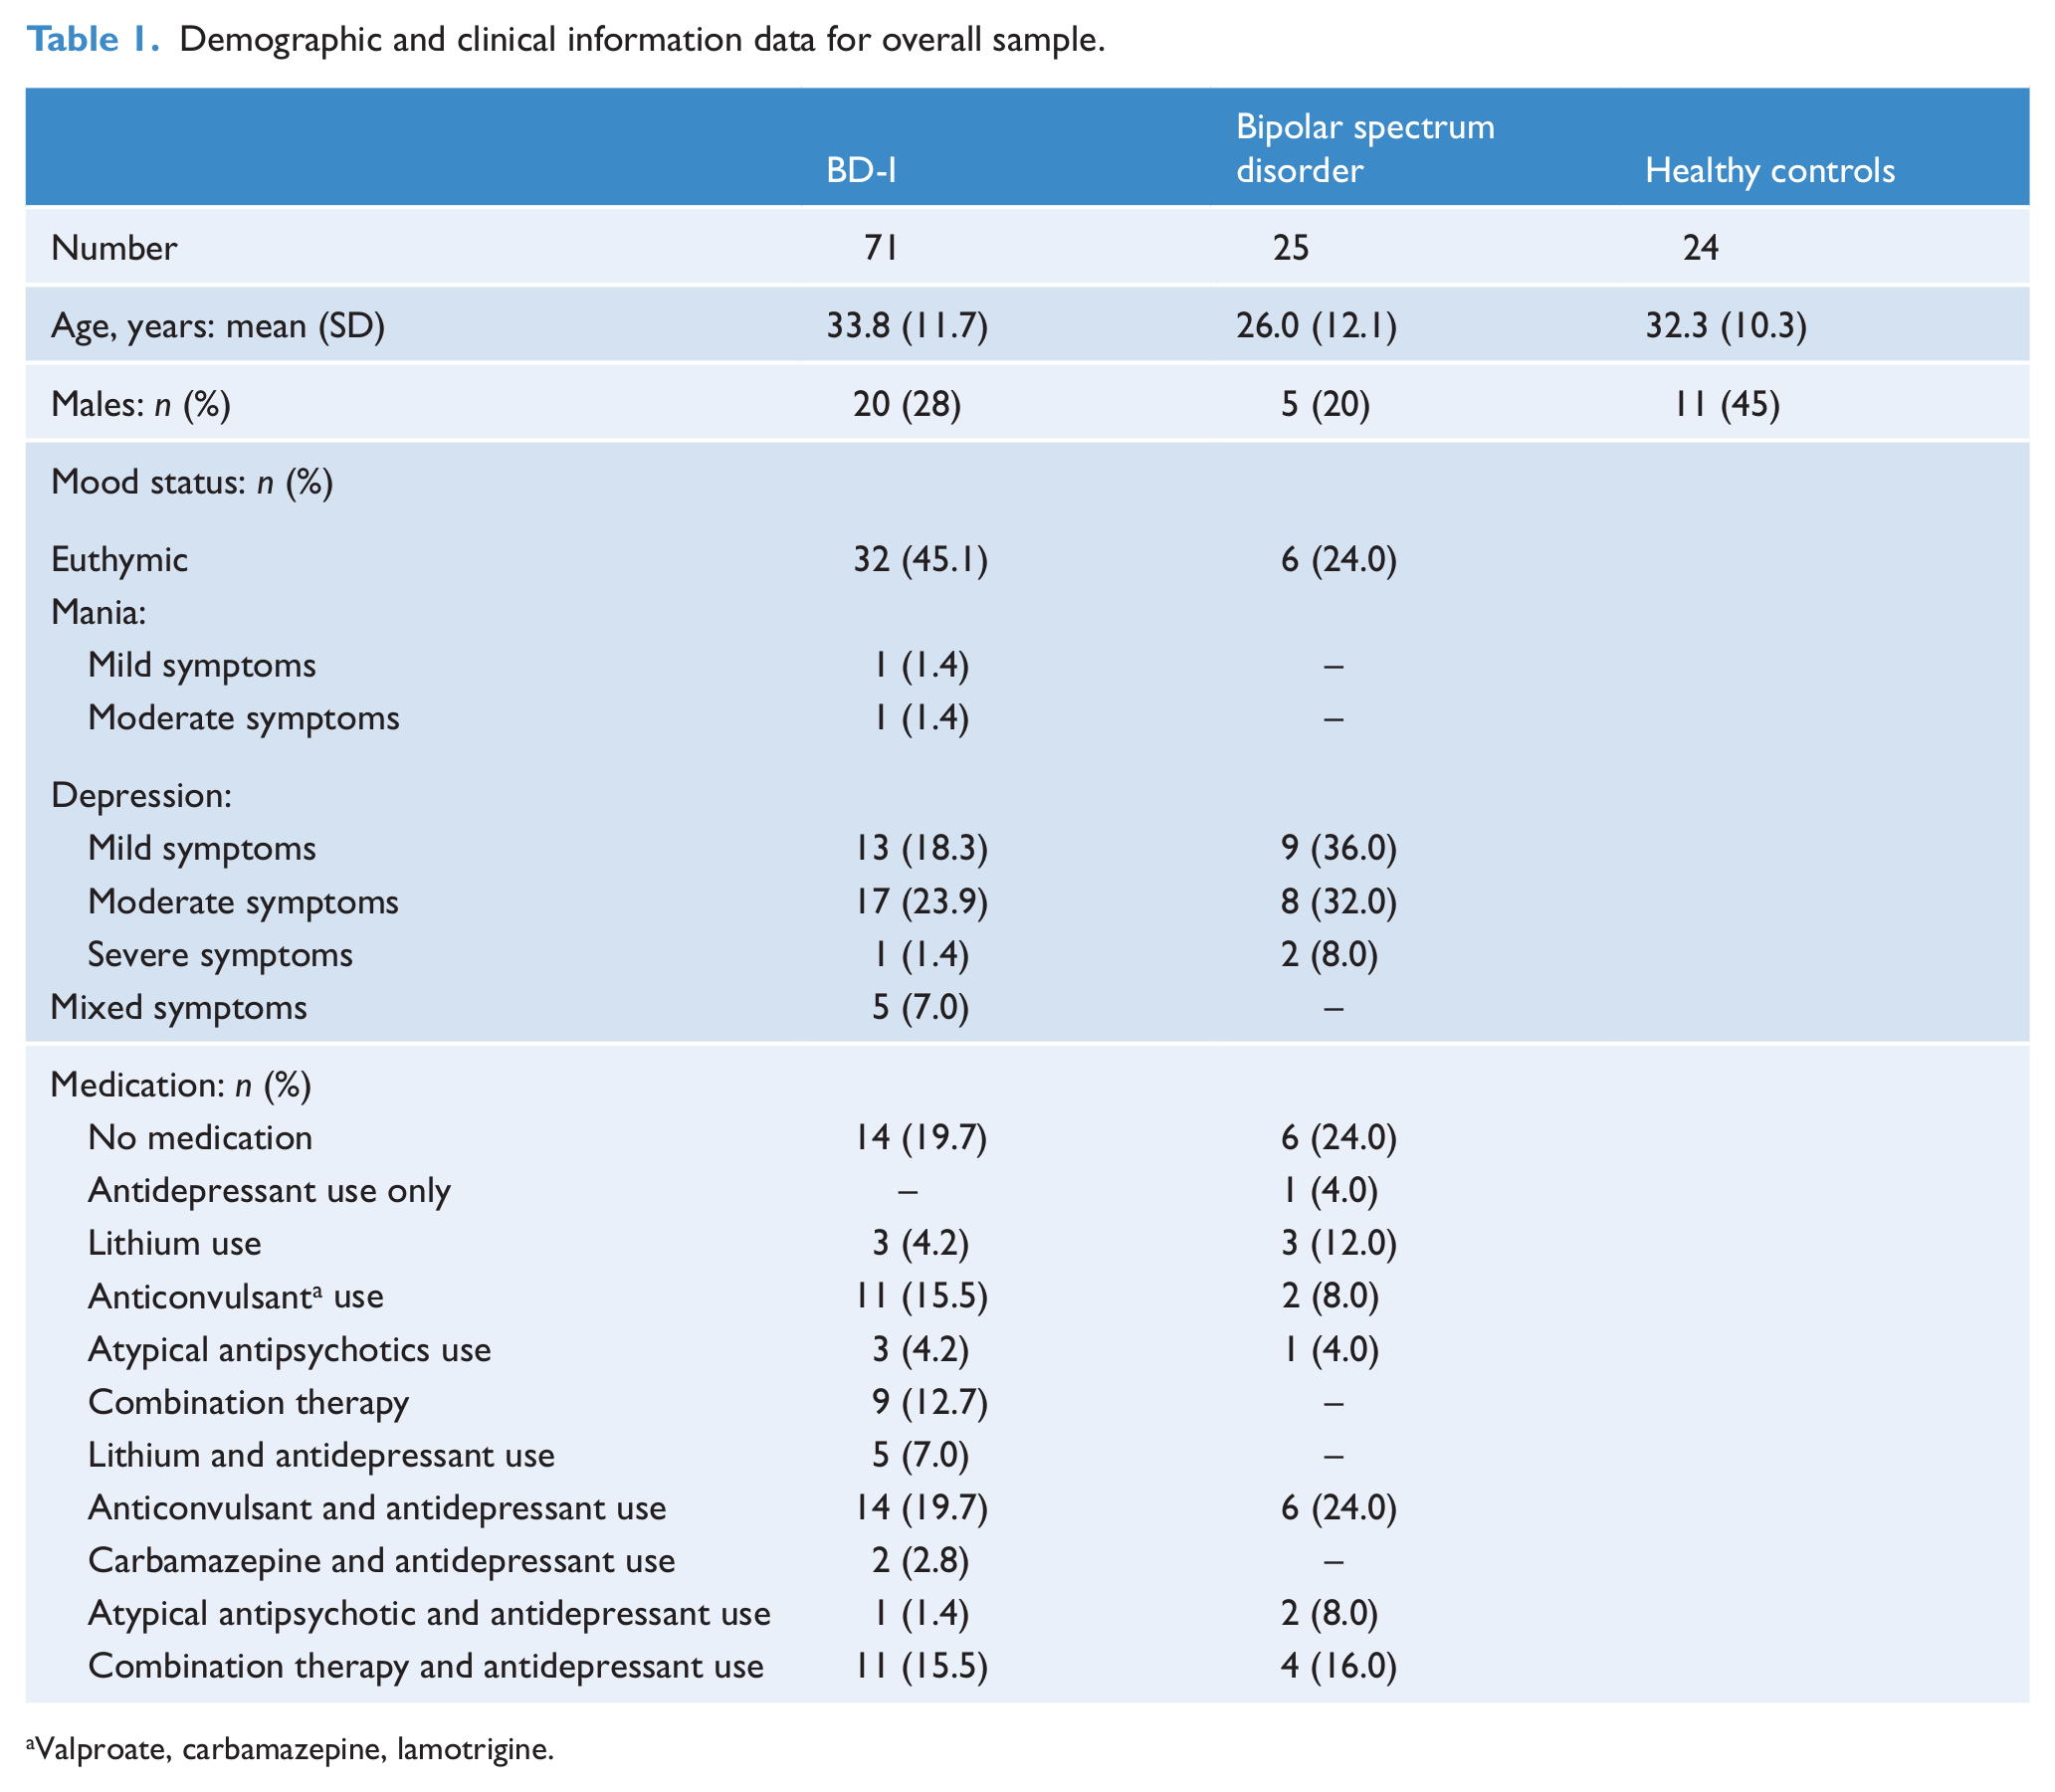
Participants were combined from two studies: (i) a study investigating neuropsychological function in BD with 24 control participants (11 males, mean age 32.3 ± 10.3) without a history of lifetime mood disorder and 41 participants with BD, and (ii) 55 participants with BD from the Psychotherapy for Bipolar Disorder study. In total, 96 adults with BD participated in the binocular rivalry task. Seventy-one of these were diagnosed with BD-I (20 males, mean age 33.8 ± 11.7), 22 had BD-II, and three were diagnosed with BD-not otherwise specified. We combined these last two participant groups into one group we refer to as bipolar spectrum (five males, mean age 26.0 ± 12.1). Both studies received ethical approval from the Upper South Canterbury (New Zealand) Ethics Committee. Patients were recruited by advertising in the community, within mental health outpatient clinics, through residential mental health services and mental illness support organisations. Exclusion criteria for this binocular rivalry study were a visual acuity of less than 20/50 (measured on a Snellen chart; equivalent to 6/15) and visual dysfunctions such as lazy eyes. Furthermore, data from three participants were removed due to technical problems. The demographic data are displayed in Table 1.
Demographic and clinical information data for overall sample.
Valproate, carbamazepine, lamotrigine.
For all patients the bipolar subtype was based upon Diagnostic and Statistical Manual of Mental Disorders, Fourth Edition (DSM-IV) criteria. Mood status was assessed with different measures in the two samples. In the neuropsychological study sample, a simple 4-point rating scale ranging from no to severe symptoms was used to rate both manic and depressive symptom states. In the sample from the Psychotherapy for Bipolar Disorder study, the Young Mania Rating Scale (YMRS; Young et al., 1978) and the Montgomery Asberg Depression Rating Scale (MADRS; Montgomery and Asberg, 1979) were used. Total scores varied from 0 to 45 on the MADRS and from 0 to 19 on the YMRS. To assess the effect of mood on alternation rate, participants were categorised into euthymic patients and patients with mild, moderate and severe symptoms. For the MADRS we followed the suggestions of Snaith et al. (1986) for classification (see Table 1). For the YMRS we used categories based on the descriptions of McElroy et al. (2010). Table 2 shows the definition of categories used in this study. Of the 71 BD-I patients, the mood ratings for one person were missing. The mood status of the remaining participants is displayed in Table 1, as are the types of medication taken. Of the 20 BD-I participants with combination therapy (11 of whom also used antidepressants), five received lithium, 16 sodium valproate, one carbamazepine, 17 benzodiazepine, five atypical antipsychotics, one typical antipsychotics, one psychostimulants and three sleep medication. Of the four bipolar spectrum disorder patients with combination therapy and antidepressant use, one received lithium, three sodium valproate, four anxiolytics, three atypical antipsychotics and three sleep medication. Overall, 18 participants (16 with BD and two control participants) reported having had a serious head injury in the past. Only seven of these injuries were associated with a loss of consciousness: five lost consciousness for less than 10 minutes and two for 30 and 45 minutes, respectively.
Categorisation of mood status.
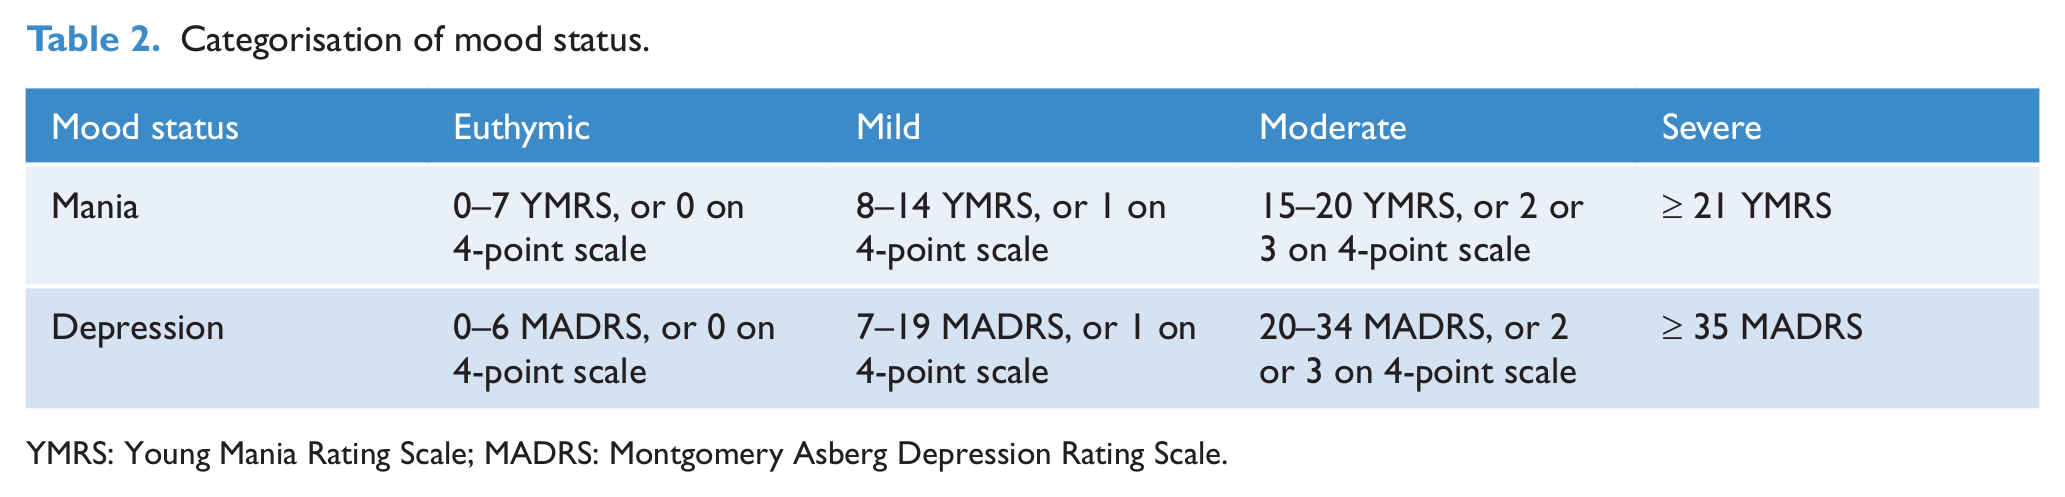
YMRS: Young Mania Rating Scale; MADRS: Montgomery Asberg Depression Rating Scale.
Experimental procedure
For the binocular rivalry task, we used the same stimulus characteristics and behavioural recording procedures as those used by Pettigrew and Miller (1998) and Miller et al. (2010). Images were presented to each eye separately using liquid-crystal shutter glasses (NuVision 60GX), with presentation of horizontal moving gratings to one eye and of vertical moving gratings to the other. Participants viewed the stimuli from a distance of approximately 3 metres. Stimuli subtended 1.5 degrees of visual angle, the spatial frequency of the gratings was 8 cycles/degree, moving was at four cycles/second, with a grating contrast of 0.9. The vertical gratings drifted rightwards, whereas the horizontal gratings drifted upwards. Participants were asked to indicate the perceived stimuli by pressing one of two adjacent keys on a standard keyboard. They pressed the left key for vertical grids and the right key for horizontal grids. They were also asked to use the spacebar to signal fused, mixed or unusual percepts, such as checkerboards, mosaic patterns or filled green circles, or to indicate indecision or an erroneous previous key press. Task duration was 30 minutes. The experiment was divided into three equally long blocks with a resting period of 2 minutes between blocks. Each block consisted of four trials, each 100 seconds long. Trials were separated by a 30-second resting period. The first block served as a practice block (during which rivalry rates stabilise; Miller et al., 2003) and was removed from all analysis. Binocular rivalry rates were calculated by dividing the number of perceptual alternations by the total time of rivalry. Predominance (the temporal dominance of one rivalry image over the other) was calculated by dividing the total time spent perceiving the vertical lines by the total time perceiving the horizontal lines. For both calculations the periods before and after spacebar presses were excluded.
Computerised functional tests
We chose several tasks from the Cambridge Neuropsychological Test Automated Battery (CANTAB), which are suitable to assess visual processing, sustained attention, memory and motor slowing – functions that have been shown to be affected in BD participants and that may have an impact on binocular rivalry alternation rates. These tasks were presented on an IBM computer fitted with a touch-sensitive screen and a response pad. Participants sat approximately 50 centimetres away from the screen and indicated their responses either through the touch screen or with the response pad, depending on the task. The CANTAB battery is a computer-based assessment device for various areas of cognitive functioning. It has been described in detail elsewhere (Robbins, 1994). The tests used in this study are described below.
Delayed matching to sample (DMS) task
This task measures visual memory and processing of complex visual patterns. A complex visual pattern (sample) is displayed to the participant who is asked to match this pattern with one of four similar choice patterns by touching the identical pattern on the screen. Choice patterns are sometimes displayed simultaneously with the sample patterns or after a delay of 0, 4 or 12 seconds. Conditions were presented randomly across the 30 sample patterns displayed. Accuracy and response time were recorded.
Motor screening test
This task provides an estimate of motor speed; that is, the speed with which motor responses are initiated and executed. In this task 10 crosses are displayed consecutively at different locations on the computer screen. Participants are asked to touch the screen where the cross appeared as quickly as possible. Reaction time for the touch response is measured.
Rapid visual information processing task (RVIP)
This task measures visual processing and sustained attention. In this task a white box is presented in the centre of the screen. In it single digits from 2 to 9 are displayed consecutively at a rate of 100 digits per minute. The participant is asked to respond to three different three-digit sequences (246, 468 or 357) by pressing keys on the response pad when a sequence is detected.
Spatial working memory task
Participants need to search for a token in a varying number of boxes while remembering which boxes they have looked in before. The total error is measured.
Spatial span
This task measures spatial short-term memory. Participants need to remember the order in which up to nine squares on the screen change colour.
Other functional tests
Controlled Oral Word Association Test (COWAT)
COWAT (Gaddes and Crockett, 1975) measures word production. Participants are asked to produce words beginning with a given letter for 1 minute. The test has three trials. Total verbal fluency is measured.
Digit span test
In the digit span test (Wechsler, 1983) number sequences of increasing length are presented. The participant has to repeat them as presented or in the backwards order. The digit span achieved is measured.
National Adult Reading Test (NART)
NART (Nelson, 1982) provides an estimate of premorbid verbal IQ. Participants are asked to pronounce 50 phonetically irregular words.
Results
Alternation rates were analysed with nonparametric tests (Kruskal–Wallis H-test and Mann–Whitney U-test) because visual inspection and statistical tests (Kolmogorov–Smirnov, p < 0.001) indicated that alternation rates were not normally distributed. We used Bonferroni correction for multiple testing when appropriate.
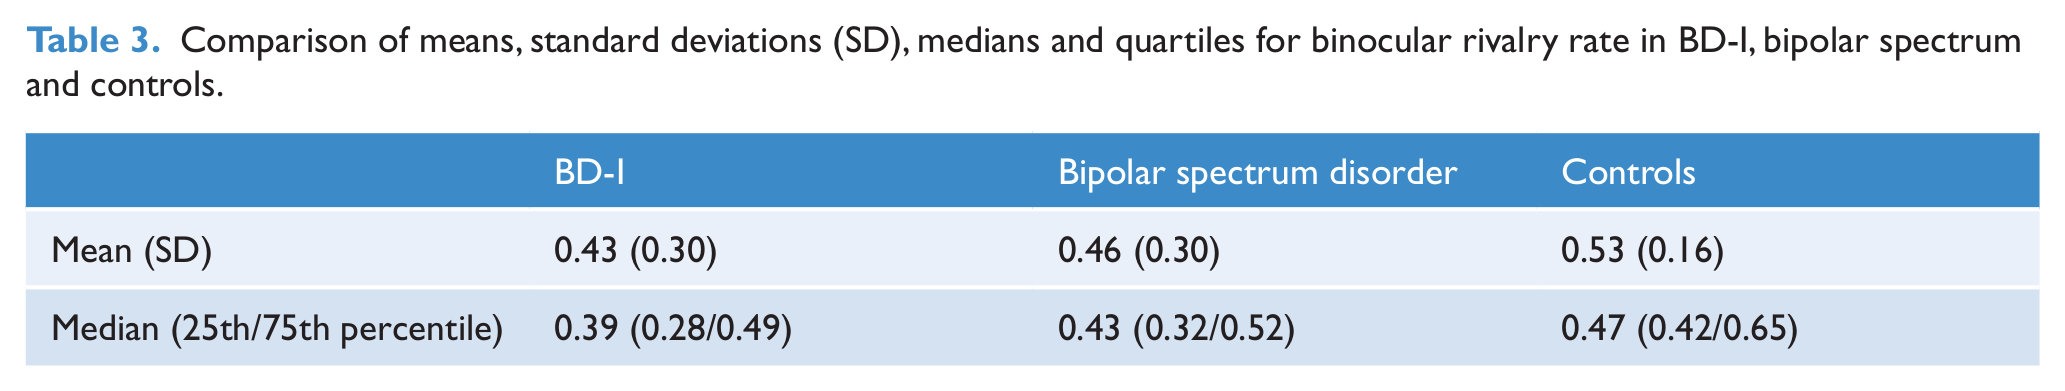
The median alternation rates did not differ significantly [Mann–Whitney U-test, p = 0.619] between the Psychotherapy for Bipolar Disorder study sample and the neuropsychological study samples. Accordingly, samples were combined to assess group differences in alternation rate between participants with BD and the healthy control group. The mean and median alternation rate for the whole sample was 0.46 Hz and 0.42 Hz, respectively. Rates ranged from 0.08 to 2.25 Hz. Means, standard deviations, medians and quartiles for all groups are displayed in Table 3. Figure 1 shows the distribution of alternation rates across participants.
Comparison of means, standard deviations (SD), medians and quartiles for binocular rivalry rate in BD-I, bipolar spectrum and controls.
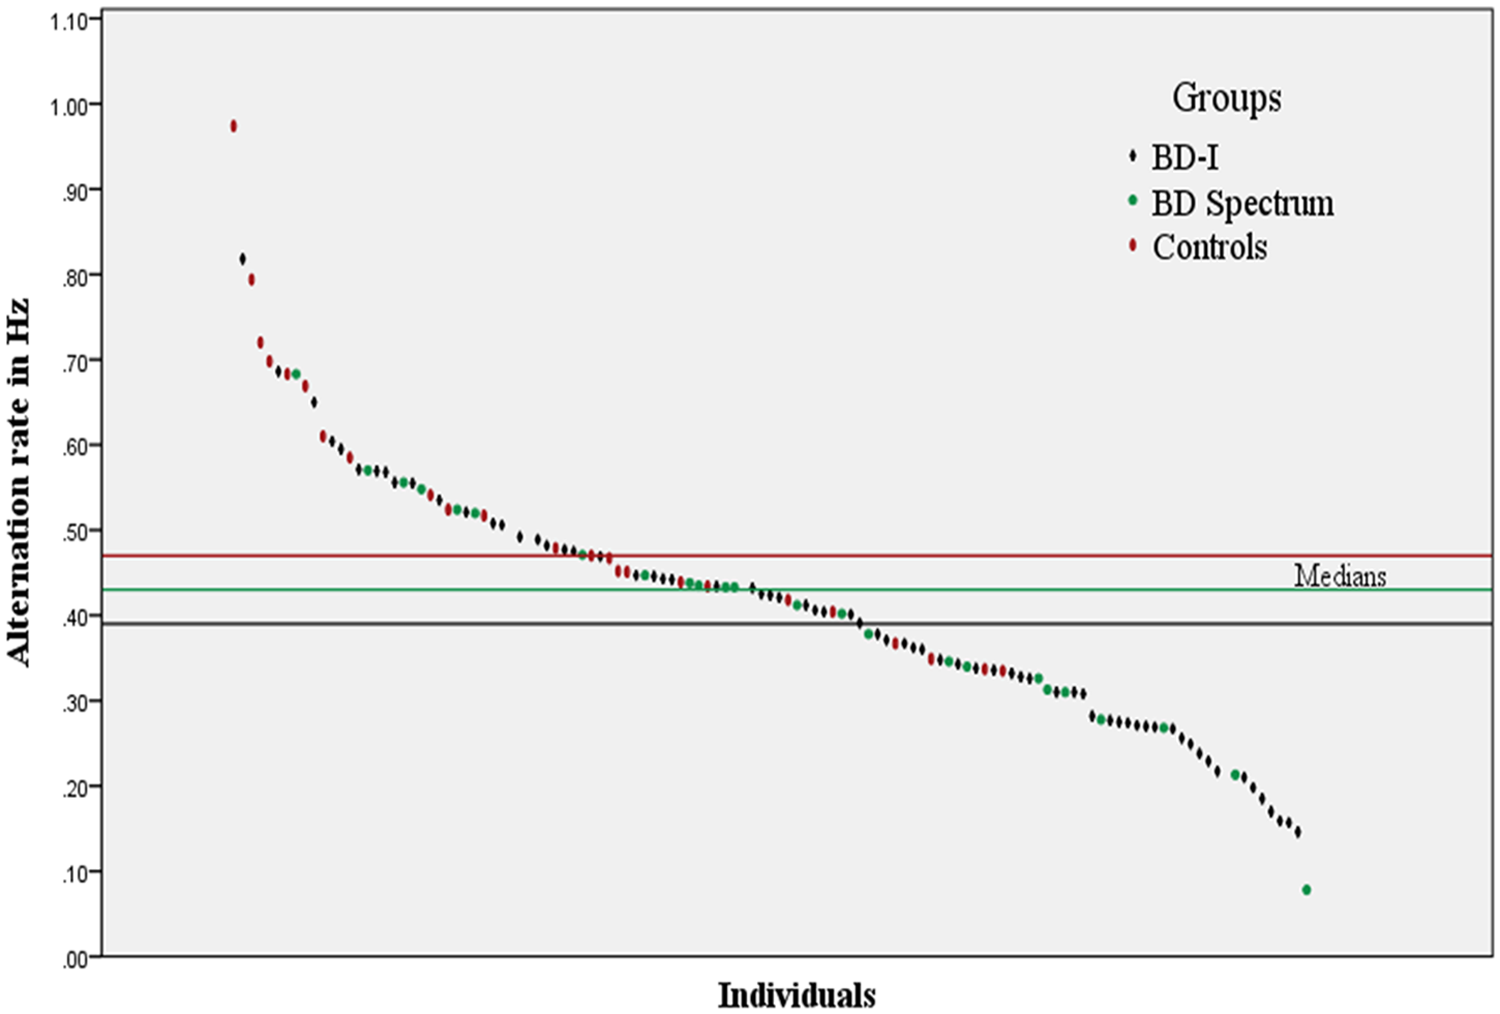
Distribution of alternation rates of all participants. Different markers refer to control participants, BD-I and BD-II participants. The horizontal lines show the median alternation rate per group. Three outlier values (1.70, 1.73 and 2.25 Hz) have been removed to improve readability.
We compared participants with BD-I, bipolar spectrum disorder and the healthy control group and found significant differences in the alternation rate [Kruskal–Wallis H-test, χ2 = 11.669, df = 2, p = 0.009]. To test for a potential influence of head injury we re-analysed the data while excluding all 18 participants who reported any form of head injury. Group differences in alternation rate remained significant under these circumstances [Kruskal–Wallis H-test, χ2 = 10.125, df = 2, p = 0.018]. Alternation rates for participants with BD-I and bipolar spectrum disorder (median 0.39 Hz and 0.43 Hz, respectively) were slower than for controls (median 0.47 Hz). Planned pairwise comparisons confirmed this. There were no alternation differences between participants with BD-I and bipolar spectrum disorder [Mann–Whitney U-test, z = −0.827, p = 0.409]. BD-I participants were slower than controls [Mann–Whitney U-test, z = −3.345, p = 0.001] as were participants with bipolar spectrum disorder [Mann–Whitney U-test, z = −2.34, p = 0.019]. The mean predominance values for BD-I participants and participants with bipolar spectrum disorder were 1.63 (range: 0.28–5.88) and 1.64 (range: 0.87–2.79), respectively. Control participants had a predominance mean value of 1.73 (range: 1.26–3.26). Predominance measures were not related to clinical group or other variables discussed below and hence are not presented further. Because there was no difference between BD-I and bipolar spectrum disorder participants, we combined these groups in all further analysis. We found no effect of medication type on alternation rate [Kruskal–Wallis H-test, p = 0.240]; alternation rate was also not different in medicated and unmedicated participants [Mann–Whitney U-test, p = 0.389].
To assess a possible influence of depressive state on alternation rate we used the mood status categories previously created (Table 2). We only compared alternation rates between euthymic participants (38 participants, median 0.40 Hz) and participants with mild (22 participants, median 0.42 Hz) and moderate (25 participants, median 0.41 Hz) depression because of the low participant number in the other categories. Depression status led to no significant differences in alternation rates (Kruskal–Wallis H-test, p = 0.98).
Because differences in rivalry rates between BD-I and BD-II participants have been reported previously (Nagamine et al., 2009), we conducted an additional analysis, in which we excluded the three BD-not otherwise specified patients from the bipolar spectrum group to assess potential differences between BD-I and BD-II participants only. Results were weaker than in the previous analysis; as before, there was no difference between BD-II and BD-I participants, but there was now only a trend for BD-II participants to alternate more slowly than control participants (p = 0.056). Because the mean alternation rate remained 0.43 Hz after the exclusion of the three BD-not otherwise specified patients, this difference is most likely due to a reduction in power caused by the diminished group size.
To compare the slowest alternating BD participants with the faster alternating BD participants, we analysed only BD participants from the Psychotherapy for Bipolar Disorder study for whom a more detailed diagnostic assessment and functional tests had been conducted. We created two subgroups – a slow and a ‘normal’ alternation group – from this sample by using a median split procedure. The slow alternation group consisted of 27 participants (nine males, mean age 26.9 ± 6.0) with a mean alternation rate of 0.31 Hz, while the normal alternation group comprised 28 participants (five males, mean age 26.6 ± 6.2) with a mean alternation rate of 0.60 Hz. The demographic data for both alternation groups are displayed in Table 4.
Demographic data for slow and normal alternating participants.
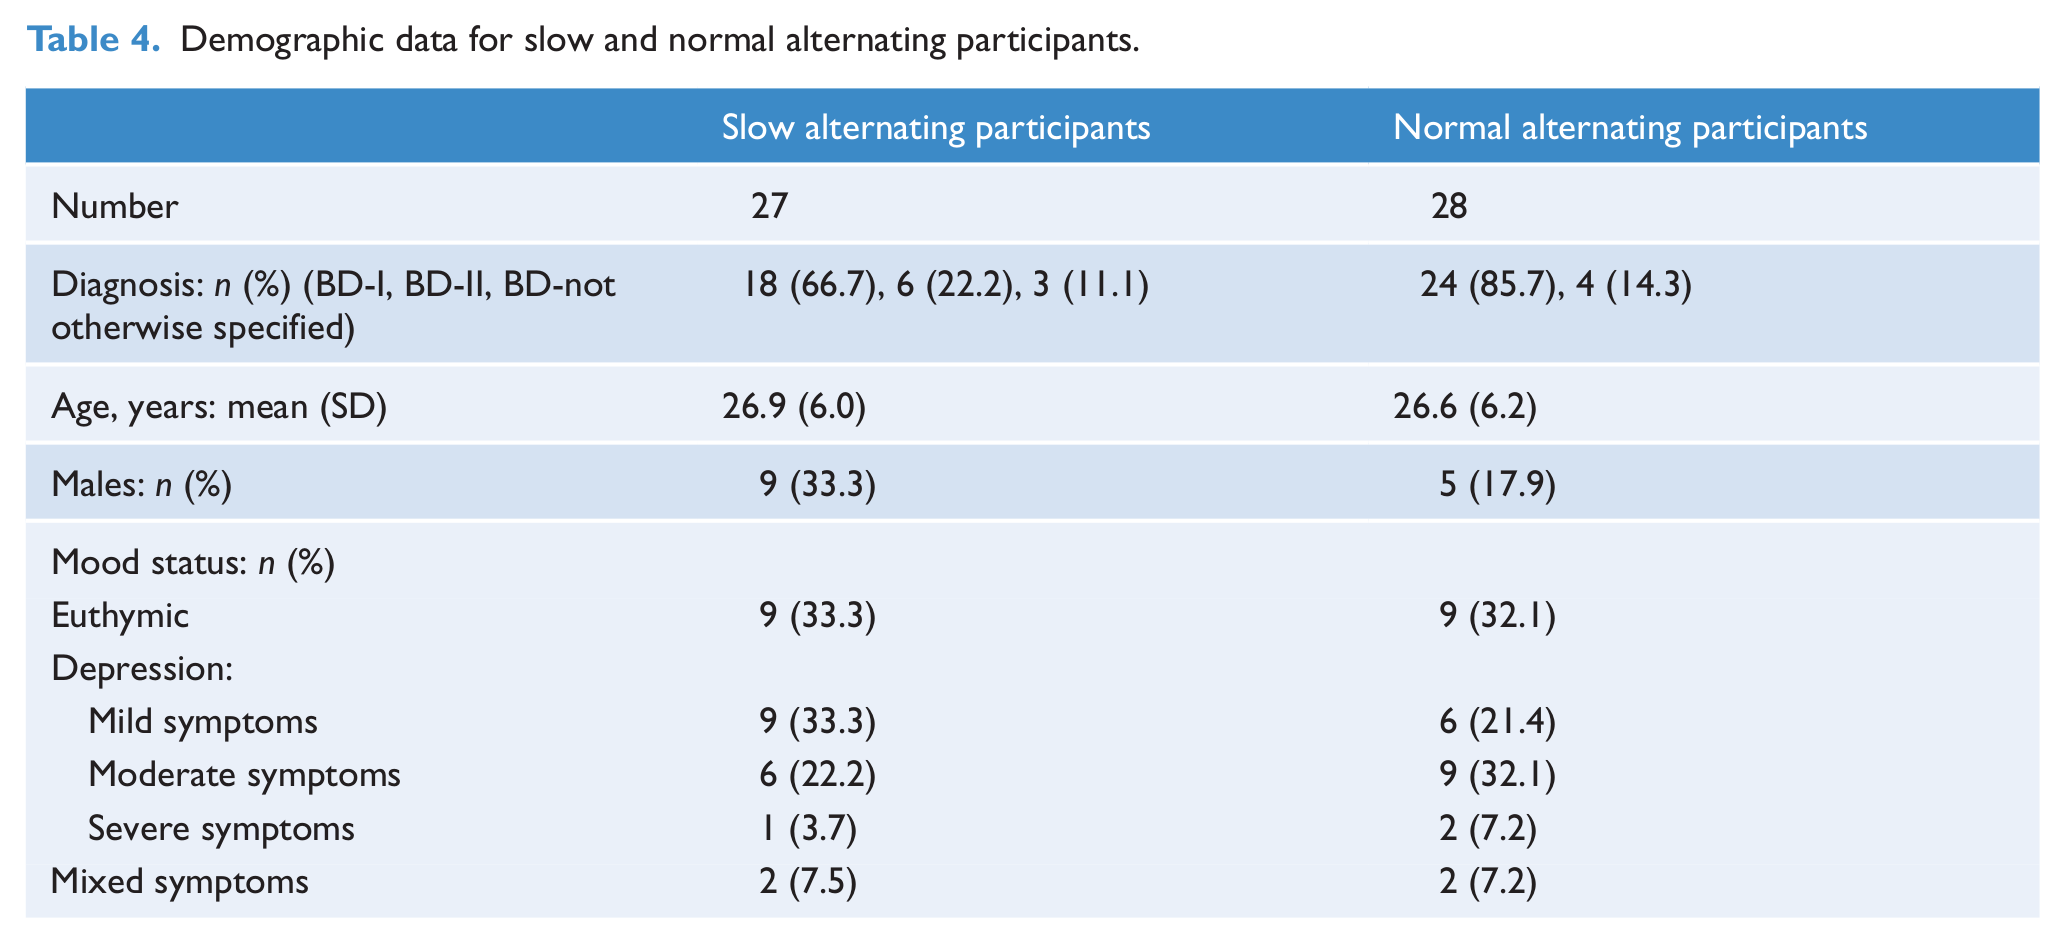
We used the Mann–Whitney U-test to assess differences in mood ratings and predominance. For categorical variables we conducted chi-squared tests to assess potential relationships between the clinical variables assessed and the different alternation groups.
As before, we tested for an effect of mood in this part of the study. MADRS (13.3 vs 15.6) and YMRS (1.9 vs 2.4) total scores were not different between slow and normal alternating groups. There was also no difference in predominance (1.8 vs 1.6) between groups.
We explored the following variables to assess potential links between alternation rate and BD characteristics by comparing expected and observed values (the numbers in brackets represent the number of participants with these characteristics): rapid cycling (19), lifetime cannabis (17) and alcohol abuse (25), lifetime comorbid diagnosis, including panic disorder (25), social phobia (12), specific phobia (13) and post-traumatic stress disorder (12), current specific phobia (12), previous head injury (11), Global Assessment of Functioning, gender, ethnicity, age and education. Other variables were excluded due to a low number of participants with these characteristics.
This exploration revealed no differences between clinical variables and alternation group.
Functional tests were only conducted with the BD participants. For the analysis we correlated (Spearman’s rho) alternation rate with the outcome measures of the functional tests used. For latency measures only correct trials were included in the analysis.
The neuropsychological results are displayed in Table 5. None of the functions measured was associated with alternation rate.
Correlation (Spearman’s rho) and p-values of alternation rate with the outcome measures of the functional tests.
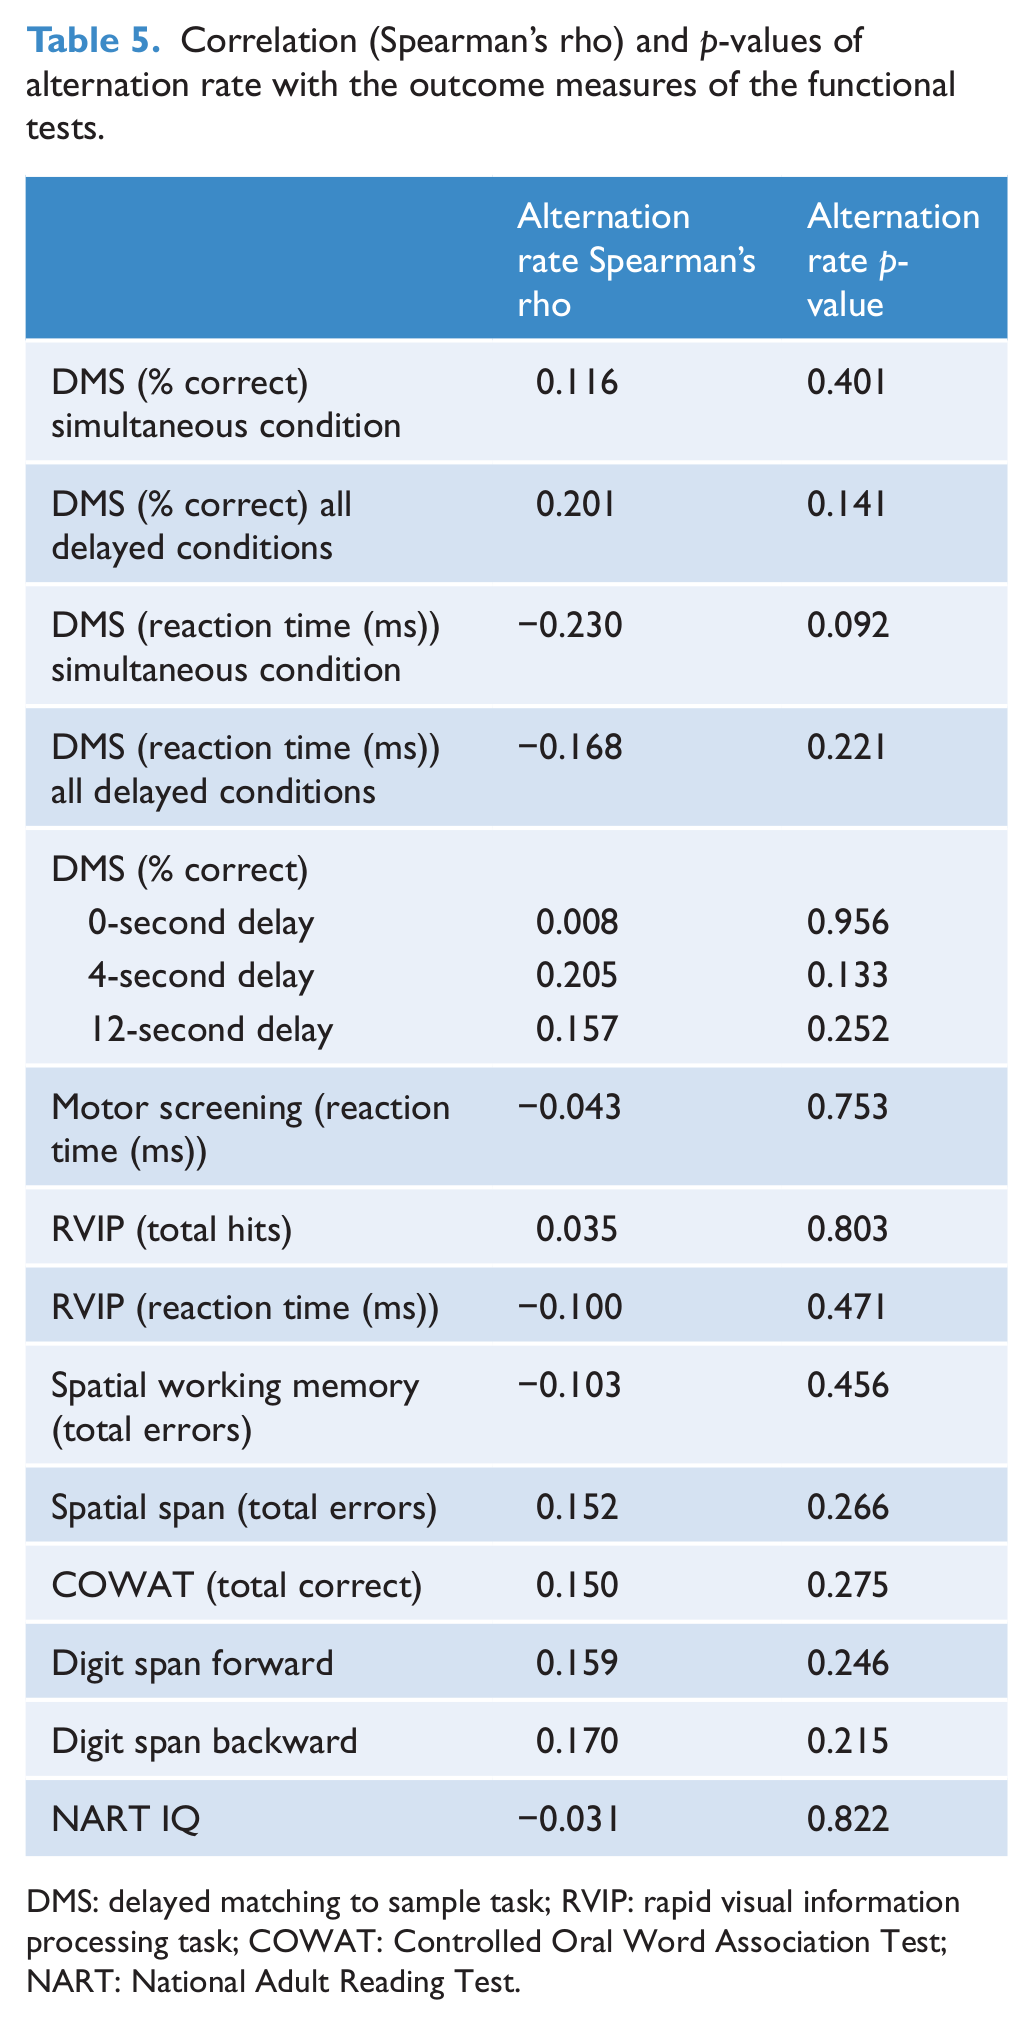
DMS: delayed matching to sample task; RVIP: rapid visual information processing task; COWAT: Controlled Oral Word Association Test; NART: National Adult Reading Test.
Discussion
The present study replicated previous results by showing a slower alternation rate in BD patients as compared to healthy controls (Hunt and Guilford, 1932; Krug et al., 2008; Miller et al., 2003; Nagamine et al., 2009; Pettigrew and Miller, 1998). In addition, we found no evidence of an effect of depression on alternation rate and no difference in alternation rate between BD-I and BD-II participants. The exploration of clinical features and cognitive functions and their relationship to alternation rate also revealed no significant results.
Previous findings suggest that alternation rate may be susceptible to the mood status of participants. More specifically, Hoffman et al. (2001) reported faster alternation rates for manic patients in a Necker cube task. We were not able to examine manic mood states due to the small number of participants with manic symptoms in our sample. There is also some indirect indication that major depressive disorder may be related to slower alternations (Bajwa et al., 2008). Pettigrew and Miller (1998; see also Miller et al., 2000) proposed a model of binocular rivalry in which each cerebral hemisphere favours one of the two images. In this model, the rate of alternation depends on the ability to switch between hemispheres. Bajwa et al. (2008) demonstrated that interactions between the two hemispheres are impaired in patients with major depression and thus a depressive state could be hypothesised to be associated with a slowing of rivalry rate. It is also conceivable that the general cognitive and motor slowing frequently observed in depressed patients (Hart and Kwentus, 1987; van der Werf-Eldering et al., 2010) may extend to visual processing performance. Our findings do not confirm either of these possibilities. Most of our participants with elevated scores in the MADRS reported having had a depressive episode in the last month, yet we found no evidence of an effect of depressive mood or motor speed on alternation rate in our experiment. Thus, our findings support the idea of binocular rivalry rate as a trait marker in BD (Miller et al., 2003, 2010; Pettigrew and Miller, 1998) because our results indicate that alternation rates in BD participants are unaffected by the state variable of depressive mood. To determine trait status, further research needs to be undertaken to investigate associations between binocular rivalry rates and manic state, as well as stage of illness (including individuals at high risk of developing BD).
Compared with previous research, our study included a large number of BD participants. This enabled us to compare the alternation rate between participants with BD-I and bipolar spectrum disorder. We found no differences between these two groups, with both groups alternating more slowly than control participants. The bipolar spectrum group in our study consisted mainly of BD-II participants. Therefore, our results are in contrast to those of Nagamine et al. (2009), who reported alternation rate differences between BD-I and BD-II participants, and between BD-I and control participants but not between BD-II and control participants. Instead, alternation rates in their study were very similar for controls and BD-II participants. It is possible, however, that the different exclusion criteria used in the two studies affected the results, as Nagamine et al. (2009) included only euthymic patients and excluded all participants with drug or alcohol abuse history or any other psychiatric comorbidity.
Alternation rates in our study ranged from 0.08 to 2.25 Hz. These values are similar to those reported previously (Miller et al., 2003, 2010; Pettigrew and Miller, 1998). Although we used the same high-strength stimuli as Pettigrew and Miller, which are thought to differentiate best between BD and control participants (Miller et al., 2003), the median alternation rate for BD-I participants (0.39 Hz) observed in our study is much faster than that reported in the study by Pettigrew and Miller (1998; 0.27 Hz). Because participants in both studies included unmedicated and medicated participants, it is unlikely that differences in rate can be attributed to medication status (discussed further below). Because our sample size is considerably larger than that in Pettigrew and Miller (1998), our median alternation rate for BD is more likely to reflect the true value for this group. In contrast, the median alternation rate for the control participants (0.47 Hz) observed in our study is much slower than that reported by Pettigrew and Miller (1998; 0.6 Hz). Since they had a larger control sample, their control median alternation rate is more likely to represent the true value for controls. A faster true value for the control group would lead to even larger differences between the BD groups and the controls than those reported in the present study. The fact that we still found a significant difference underlines the strength of the effect.
For BD participants, performance measures in tests measuring visual processing, visual and spatial memory, sustained attention, general motor speed and IQ were unrelated to alternation rates. These results match previous findings (unpublished data from Miller et al. 2010, as cited in Ngo et al., 2011) regarding the lack of relationship between binocular rivalry rate and processing speed. The performance shown by our BD participants seems to be similar to other findings that reported functional deficits in BD as compared to healthy controls. For example, we found an average span of 6.94 and 4.91 digits for forward and backward recall, respectively (Sweeney et al., 2000; Yates et al. 2011). Yates et al. (2011) reported rates of 6.87 and 4.55, which in their study were significantly fewer digits than the control group recalled. For the DMS task the latencies found in our study were in between the rates for symptomatic bipolar participants and those of the control group (Sweeney et al., 2000). It thus seems that BD performance in our study confirmed previous studies which showed that even in remission cognitive functioning in some BD patients often remains less efficient compared to the performance of control participants (Malhi et al., 2007). Yet, cognitive functioning as measured in this study seems to have no impact on binocular rivalry rates in BD. These results imply that the slowed alternation rates observed in BD participants are not simply a result of deficits in other cognitive functions, again strengthening the proposal of slow binocular rivalry rate as a trait marker for BD.
As with other studies before (Miller et al., 2003; Nagamine et al., 2009; Pettigrew and Miller, 1998), we found no effect of medication regimen on alternation rate. There was no relationship of drug type to alternation rate and no difference in alternation rates between unmedicated and medicated participants. Together with previous findings, these results suggest that medication effects cannot explain differences in alternation rates between BD and control groups.
The present study has several limitations. The most important one is the limited range of mood states in our participants. Our participants were not representative of the whole BD mood spectrum. This limits the application of our conclusions to BD patients who can be classified as euthymic and mildly to moderately depressed. Related to this, the use of a 4-point rating scale for participants from the neuropsychological study sample instead of a validated measure such as the MADRS may have led to miscategorisations in some cases. Significant miscategorisations are, however, unlikely because the scale has been used by experienced team members. A second limitation is a lack of information regarding visual acuity in our participants. We used the Snellen chart to establish sufficient sight (20/50) but did not record individual acuities. Differences in visual acuity are known to affect rivalry rate and thus may have impacted on performance; however, these are unlikely to explain the main findings of the present study (see, for example, Miller et al., 2003). Lastly, many clinical features were only present in a few participants, and thus group sizes for statistical analysis were often small. Accordingly, our study was not able to pick up subtle differences in the alternation rate for these features. Systematic assessments would lead to clearer results.
In conclusion, BD is indeed associated with a significantly slower rate of binocular rivalry with high-strength stimuli, though not all BD participants exhibit slow alternation rates. The finding of slow binocular rivalry rate in BD does not appear to be due to either current depressive state or current medication. Alternation rates also seem to be independent of comorbid diagnoses. Our results also suggest that at least in this sample, binocular rivalry alternation rates are independent of the other cognitive functions measured and are not, for instance, merely a manifestation of psychomotor function. Our findings confirm slow binocular rivalry rate as a potential trait marker for BD.
Footnotes
Acknowledgements
We thank Julia Martin, Andrea Bartram, Robyn Abbott and Chris Frampton for their assistance in these studies. Special thanks are given to all the participants in this study.
Funding
The research was funded by the Health Research Council of New Zealand, funding number: 07/282.
Declaration of interest
None of the authors had a conflict of interest.