
Abstract
Background
Serum total testosterone (T) decreases postprandially. Postprandial salivary testosterone (SalT) responses, however, have not been studied. We report on the effect of glucose ingestion on fasting SalT concentrations.
Objective
To investigate the effect of oral glucose ingestion on fasting SalT.
Methods
Salivary and blood samples were collected between 09.00 and 09.30 and 2 hours after a 75g oral glucose load in 32 men with mean (standard deviation) age of 52 (5.7) years and body mass index of 32.6 (5.56) kg/m2. Free T and bioavailable testosterone (BAT) were calculated using the Vermeulen equation.
Results
Two hours following oral glucose, there was a decrease in fasting mean (standard deviation) SalT [178.2 (56.6) versus 146.0 (42.2) pmol/L; P = .0003], serum cortisol [332 (105.0) versus 239 (75.3) nmol/L; P = <0.0001], prolactin [193 (75.0) versus 127 (55.9) mIU/L; P = <0.0001] and TSH [1.60 (0.801) versus 1.16 (0.584) mIU/L; P = <0.0001]. Plasma glucose increased [6.2 (0.72) versus 8.1 (3.71) mmol/L; P = .0029]. Serum total T, SHBG, albumin, Free T, BAT, gonadotrophins and FT4 remained unchanged.
Conclusions
SalT decreased postprandially. A concomitant decrease in serum cortisol, prolactin and TSH reflecting diurnal variation offers an alternative explanation for the decrease in SalT independent of food consumption. Further studies are required to determine whether morning temporal changes in SalT are related to food consumption or circadian rhythm or both.
Introduction
Testosterone (T) circulates as free (1–2%) and bound (98–99%) T. 1 T is predominantly bound to sex-hormone-binding globulin (SHBG), to a lesser extent albumin, and much lesser extent cortisol-binding globulin and alpha-1 acid glycoprotein. Free T is considered biologically active. It is widely accepted that low affinity binding makes albumin-bound T an accessible fraction, whereas high affinity binding makes SHBG-bound T a relatively inaccessible fraction. 1 Bioavailable T (BAT) constitutes albumin-bound and free testosterone. 1
Serum total T is a measurement of free and bound T. Serum free T and BAT may be measured directly or more commonly calculated using various formulae based on total T, SHBG and albumin values. Direct free T and BAT assays, however, are expensive, difficult to perform and not routinely available; and calculated free T and BAT values have well-recognised limitations. 2
Salivary testosterone (SalT) is unbound and in equilibrium with circulating free T and therefore accurately reflects serum free T. 3 The advantages of SalT analysis over serum total T analysis include a more accurate reflection of circulating biologically active free T, non-invasiveness, reduced stress for the patient (particularly if difficult venous access), no risk of needle stick injury and ease of collection allowing potential home testing and posting of samples. A less well-recognised potential benefit of salivary analysis over blood analysis is the provision of meaningful T results in patients with altered SHBG concentrations. SalT, therefore, potentially offers an attractive additional test in investigating male gonadal disorders; however, pre-analytical variables such as the effect of food ingestion require study.
Diurnal variation of serum total T is well-recognised. 4 In healthy young men, serum total T peaks in the early morning and decreases by 20–25% at 4 p.m. with a nadir in the evening. 4 Serum total T diurnal variation, however, is blunted in older men.5–8 There are, however, limited studies on the effect of diurnal variation on SalT. SalT in the early morning (08.00) is higher compared to mid and late afternoon (after 2 p.m.),9,10 early evening (5 p.m.) 11 and night (10 p.m.) 12 but no data are available on the temporal changes between early and late morning.
Serum total T has been reported to decrease following ingestion of glucose, a mixed meal and high fat meal.13–19 The effect of food, however, on SalT has been limited to one study reporting that healthy women had higher post-lunch SalT concentrations when on a high fat diet compared to their usual diet. 20 We, therefore, report on the effect of glucose ingestion on SalT concentrations.
Methods
Men aged between 40 and 60 years were recruited from those referred from primary care for a standard 75 g oral glucose tolerance test (OGTT). Exclusion criteria included those with or contact with COVID-19, symptoms of COVID-19, conditions known to affect androgen metabolism such as hypogonadism, chronic inflammatory diseases, chronic liver disease, chronic kidney disease or thyroid dysfunction, periodontal disease and those who had brushed their teeth within 1 hour of sample collection. Patients taking medication known to affect androgen metabolism including testosterone, ketoconazole, cimetidine, spironolactone, cyproterone acetate, dutasteride, finasteride, anabolic steroids, chemotherapy drugs and opioids were also excluded. Patients gave informed written consent to participate in this study, which was approved by the West of Scotland Research Ethics Service and Health Research Authority (IRAS Project ID: 277771, Protocol number: 2020LAB110, REC reference number: 20/WS/0115).
Oral glucose tolerance test procedure: Following a 12 h overnight fast, venous blood and salivary samples were collected between 09.00 h and 09.30 h. Subjects then consumed 75 g of glucose dissolved in 200 mL of water within 5 minutes and further venous blood and salivary samples were collected 2 hours later. Diabetes was identified using the World Health Organization criteria of fasting plasma glucose ≥7.0 mmol/L or 2 h postprandial plasma glucose of ≥11.1 mmol/L. 21
Saliva samples were collected by passive drool collection using saliva collection aids (Salimetrics, LLC, USA). 22 Saliva samples were frozen in the cryovial at −80°C until sample preparation, extraction and analysis. Blood samples were collected by the Greiner VACUETTE® system into serum clot activator tubes (Greiner Bio-One Ltd, Stonehouse UK). Serum samples were centrifuged after 30 min and the separated serum aliquoted and frozen at −80°C until thawed and analysed for serum analytes.
Analytical methods
SalT was measured by LC-MS/MS using the validated method described in detail in the appendix. Briefly, SalT was extracted using methyl tert-butyl ether (MTBE) and the extract analysed using a Waters Xevo TQ-S micro triple quadrupole mass spectrometer and ACQUITY Waters I-class plus UPLC. There was no significant ion suppression or carryover and acceptable analytical specificity. The limit of quantitation (LOQ) was 21.3 pmol/L and the method was linear up to 1058.2 pmol/L. Recovery, imprecision and bias of EQA samples and LC-MS/MS method comparison was acceptable (Appendix).
Serum total T, SHBG, albumin, luteinizing hormone (LH), follicle stimulating hormone (FSH), prolactin, cortisol, thyroid stimulating hormone (TSH) and free thyroxine (FT4) were measured using methods and reagents supplied by Abbott diagnostics on Abbott Architect c16000 and i2000 analysers (Abbott Laboratories, USA) in a single batch. The Abbott Architect testosterone method shows acceptable agreement with LC-MS/MS. 23 The intra-assay coefficient of variation were 5.87% (16.6 nmol/L) for total T, 5.43% (35.9 nmol/L) for SHBG, 0.80% (39 g/L) for albumin, 5.69% (14.9 IU/L) for LH, 4.49% (21.2 IU/L) for FSH, 3.10% (250 mIU/L) for prolactin, 2.20% (372 nmol/L) for cortisol, 2.43% (3.76 mIU/L) for TSH and 2.90% (18.7 pmol/L) for free T4. All serum assays were ISO15189 accredited by the United Kingdom Accreditation Service (UKAS), CE marked and showed acceptable IQC and EQA performance at the time of the analysis.
Free T and BAT were calculated using the Vermeulen equation by inputting the total testosterone, SHBG and albumin results into the online calculator https://www.issam.ch/freetesto.htm. 24
Statistical Analyses
There are no data on the effect of food ingestion on SalT in men. This study was, therefore, powered using previously published data on the effect of glucose ingestion on serum total T. 13 These gave a Cohen’s d anticipated effect size of 0.704. It was, therefore, estimated that a minimum sample size of 19 subjects was required to give a probability level of P < .05 and the statistical power level of 80% for a two-tailed t-test study based on a priori sample size calculation.
Data were tabulated in Excel (Microsoft Corporation), and statistical analyses performed using IBM SPSS Statistics, version 29.0.1.0 (IBM Corporation), GraphPad Prism 9, version 9.5.1 (GraphPad Software, LLC) and Analyse-it, version 5.90 (Analyse-it Software, Ltd). QQ plots demonstrated normal distribution of data. Therefore, Paired Student’s t-test was used to assess the significance between fasting and postprandial differences; Pearson’s linear correlation used to assess the significance of association between variables; and data expressed as means with standard deviations in parentheses. A P value <.05 was considered statistically significant.
Results
Mean (SD) Fasting (0 h) and Postprandial (2 h) Biochemical Parameters During an Oral Glucose Tolerance Test in 32 Male Subjects.
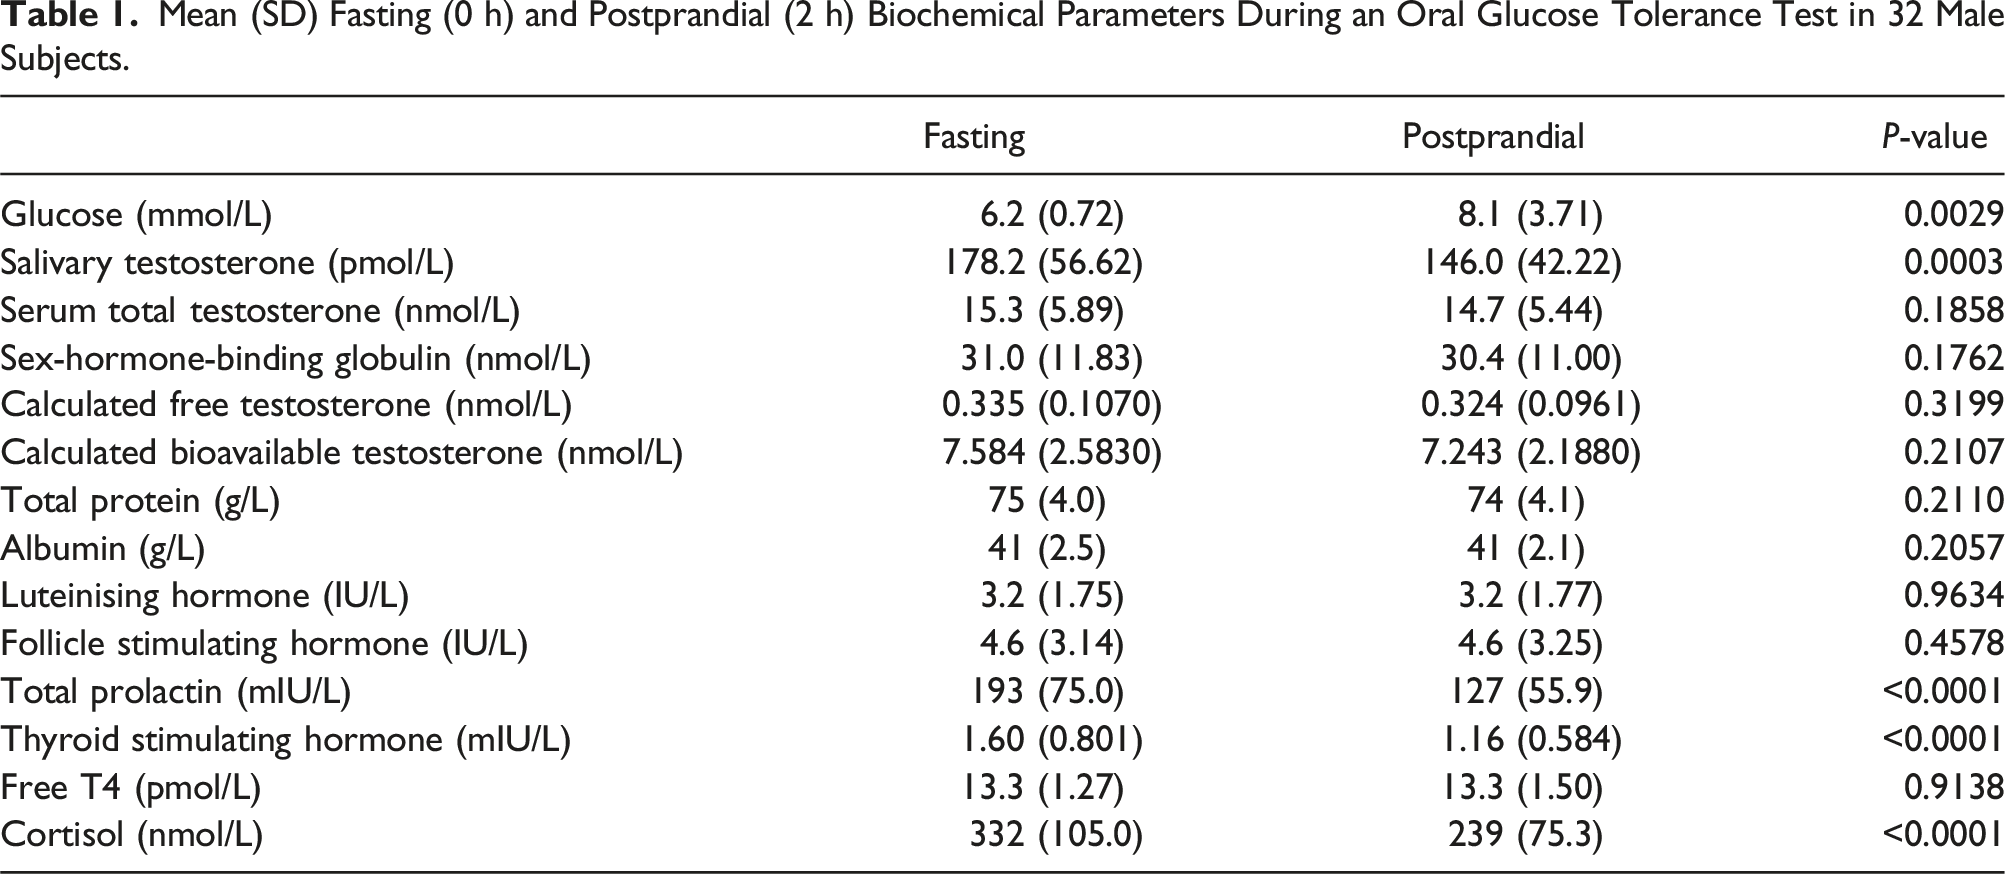
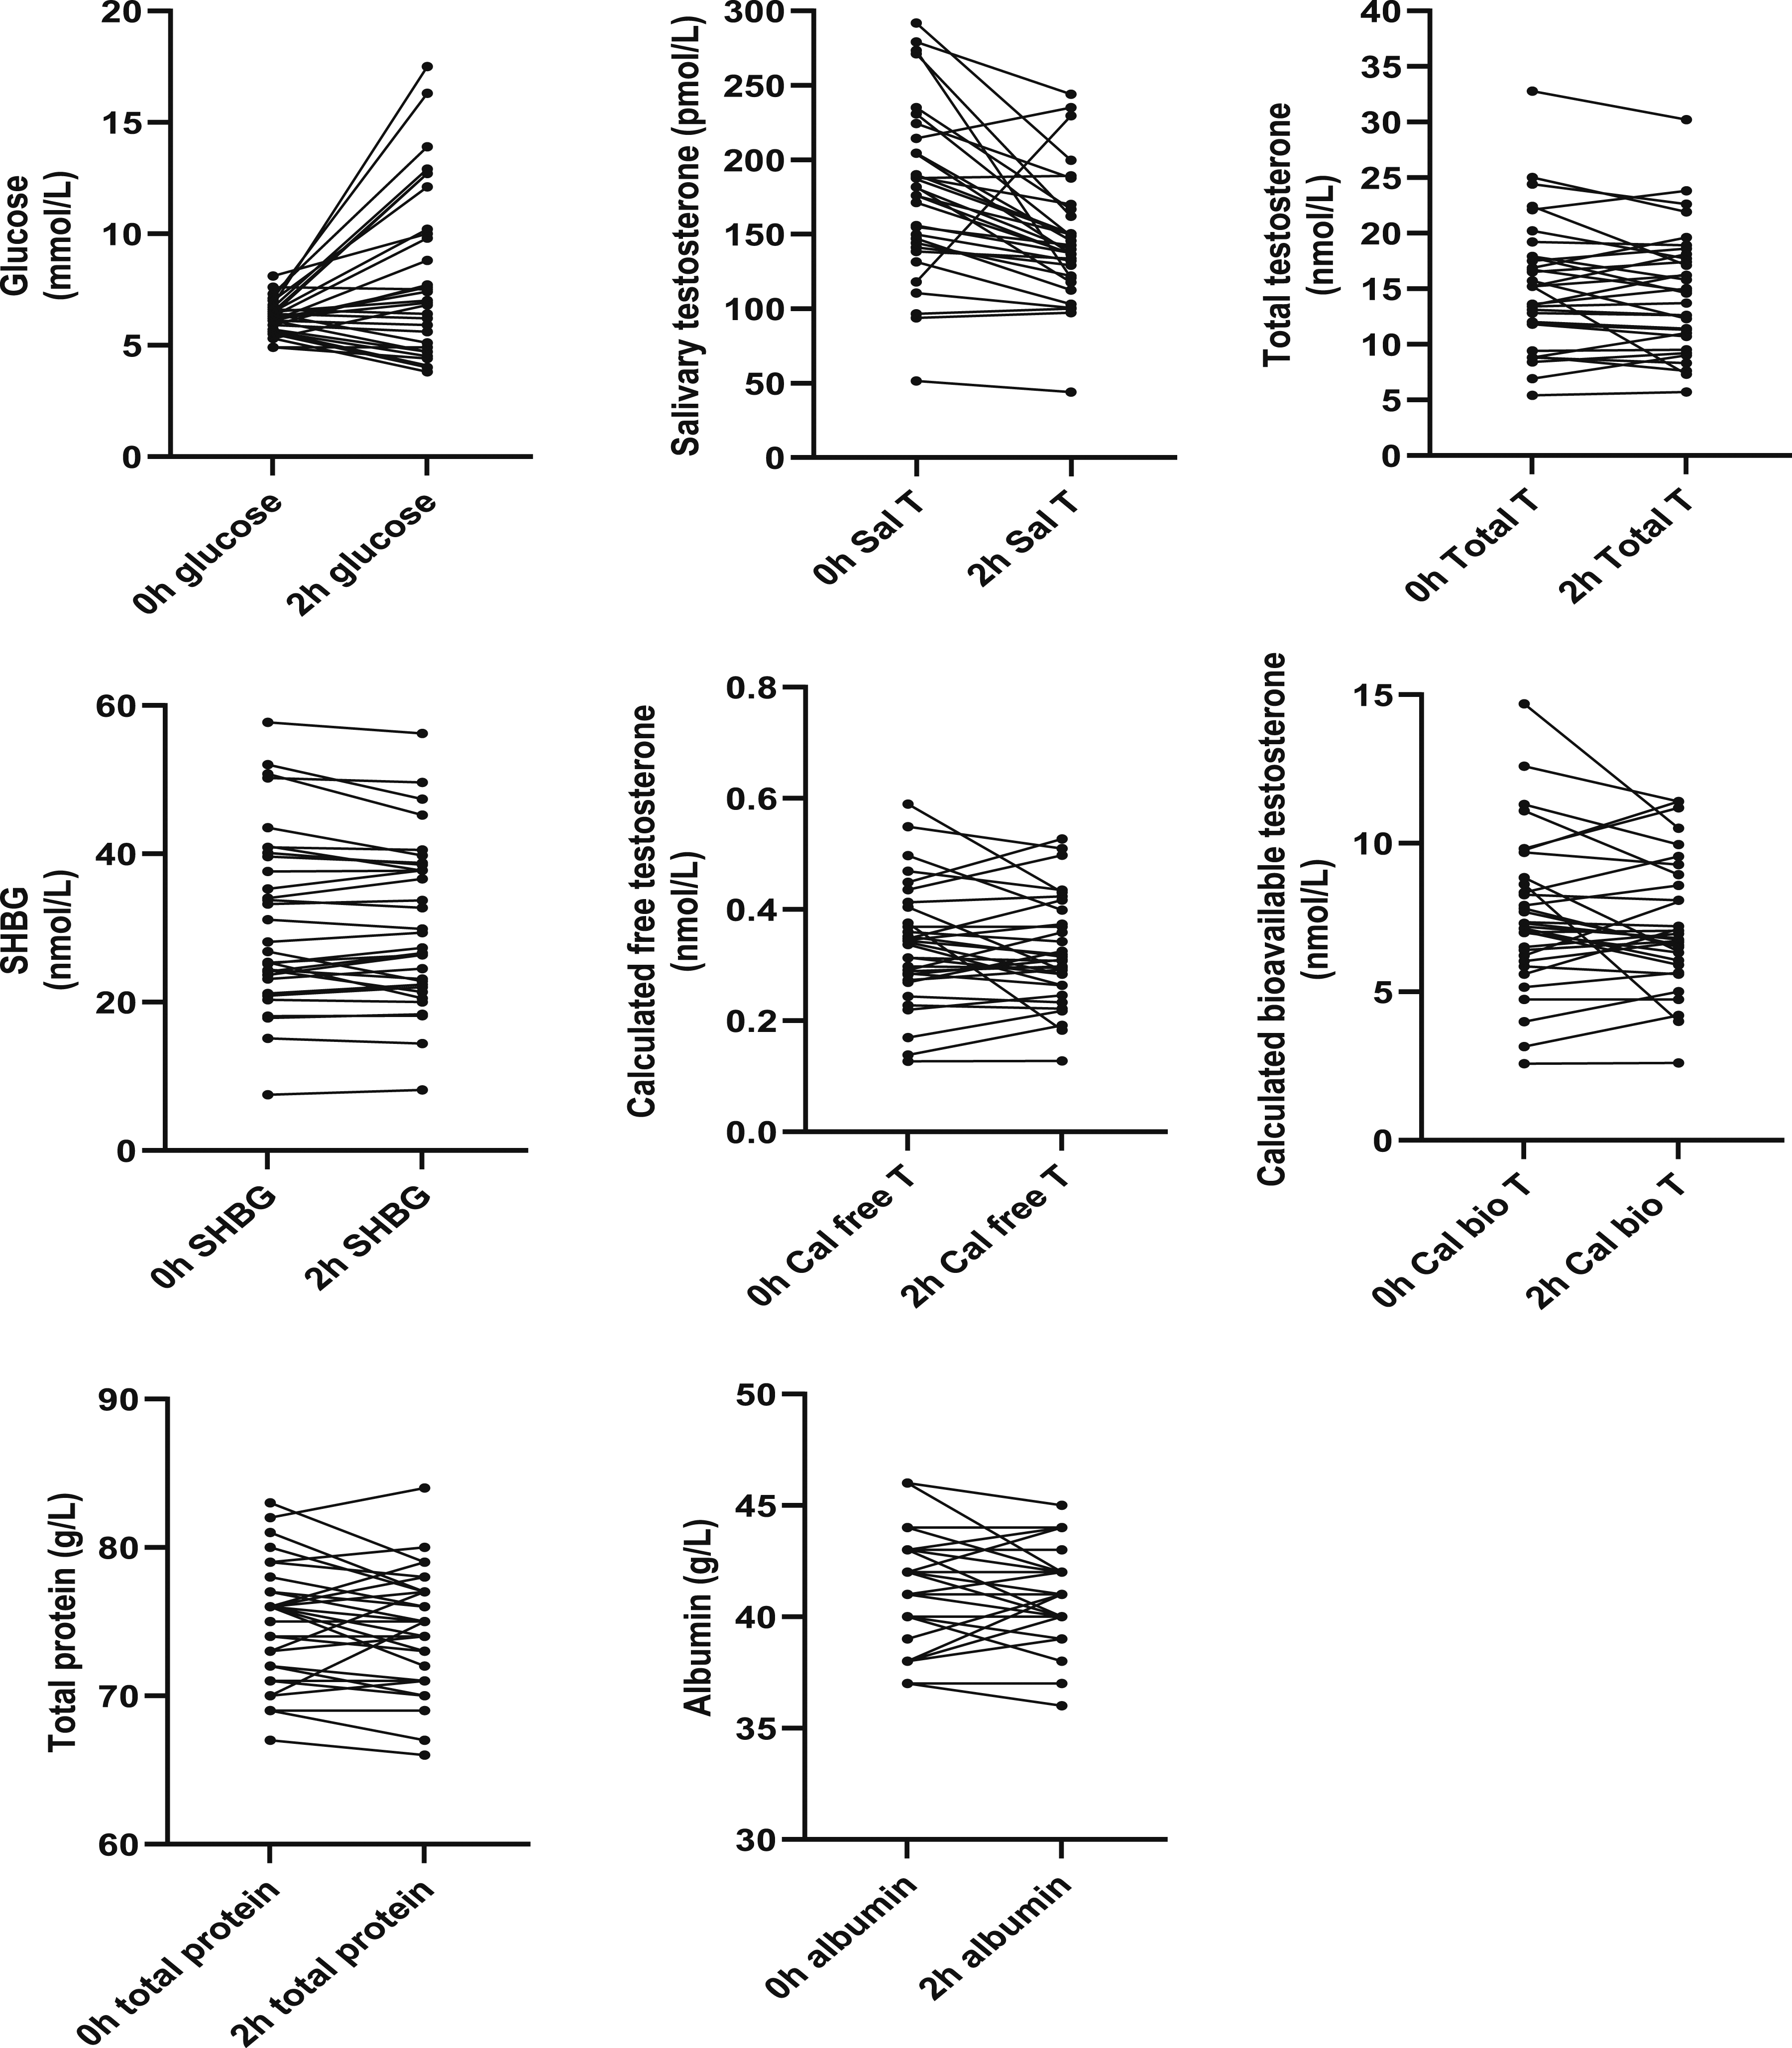
Fasting (0 h) and postprandial (2 h) glucose, salivary testosterone, total testosterone, sex-hormone-binding globulin, calculated free testosterone, calculated bioavailable testosterone, total protein and albumin during an oral glucose tolerance test in 32 male subjects.
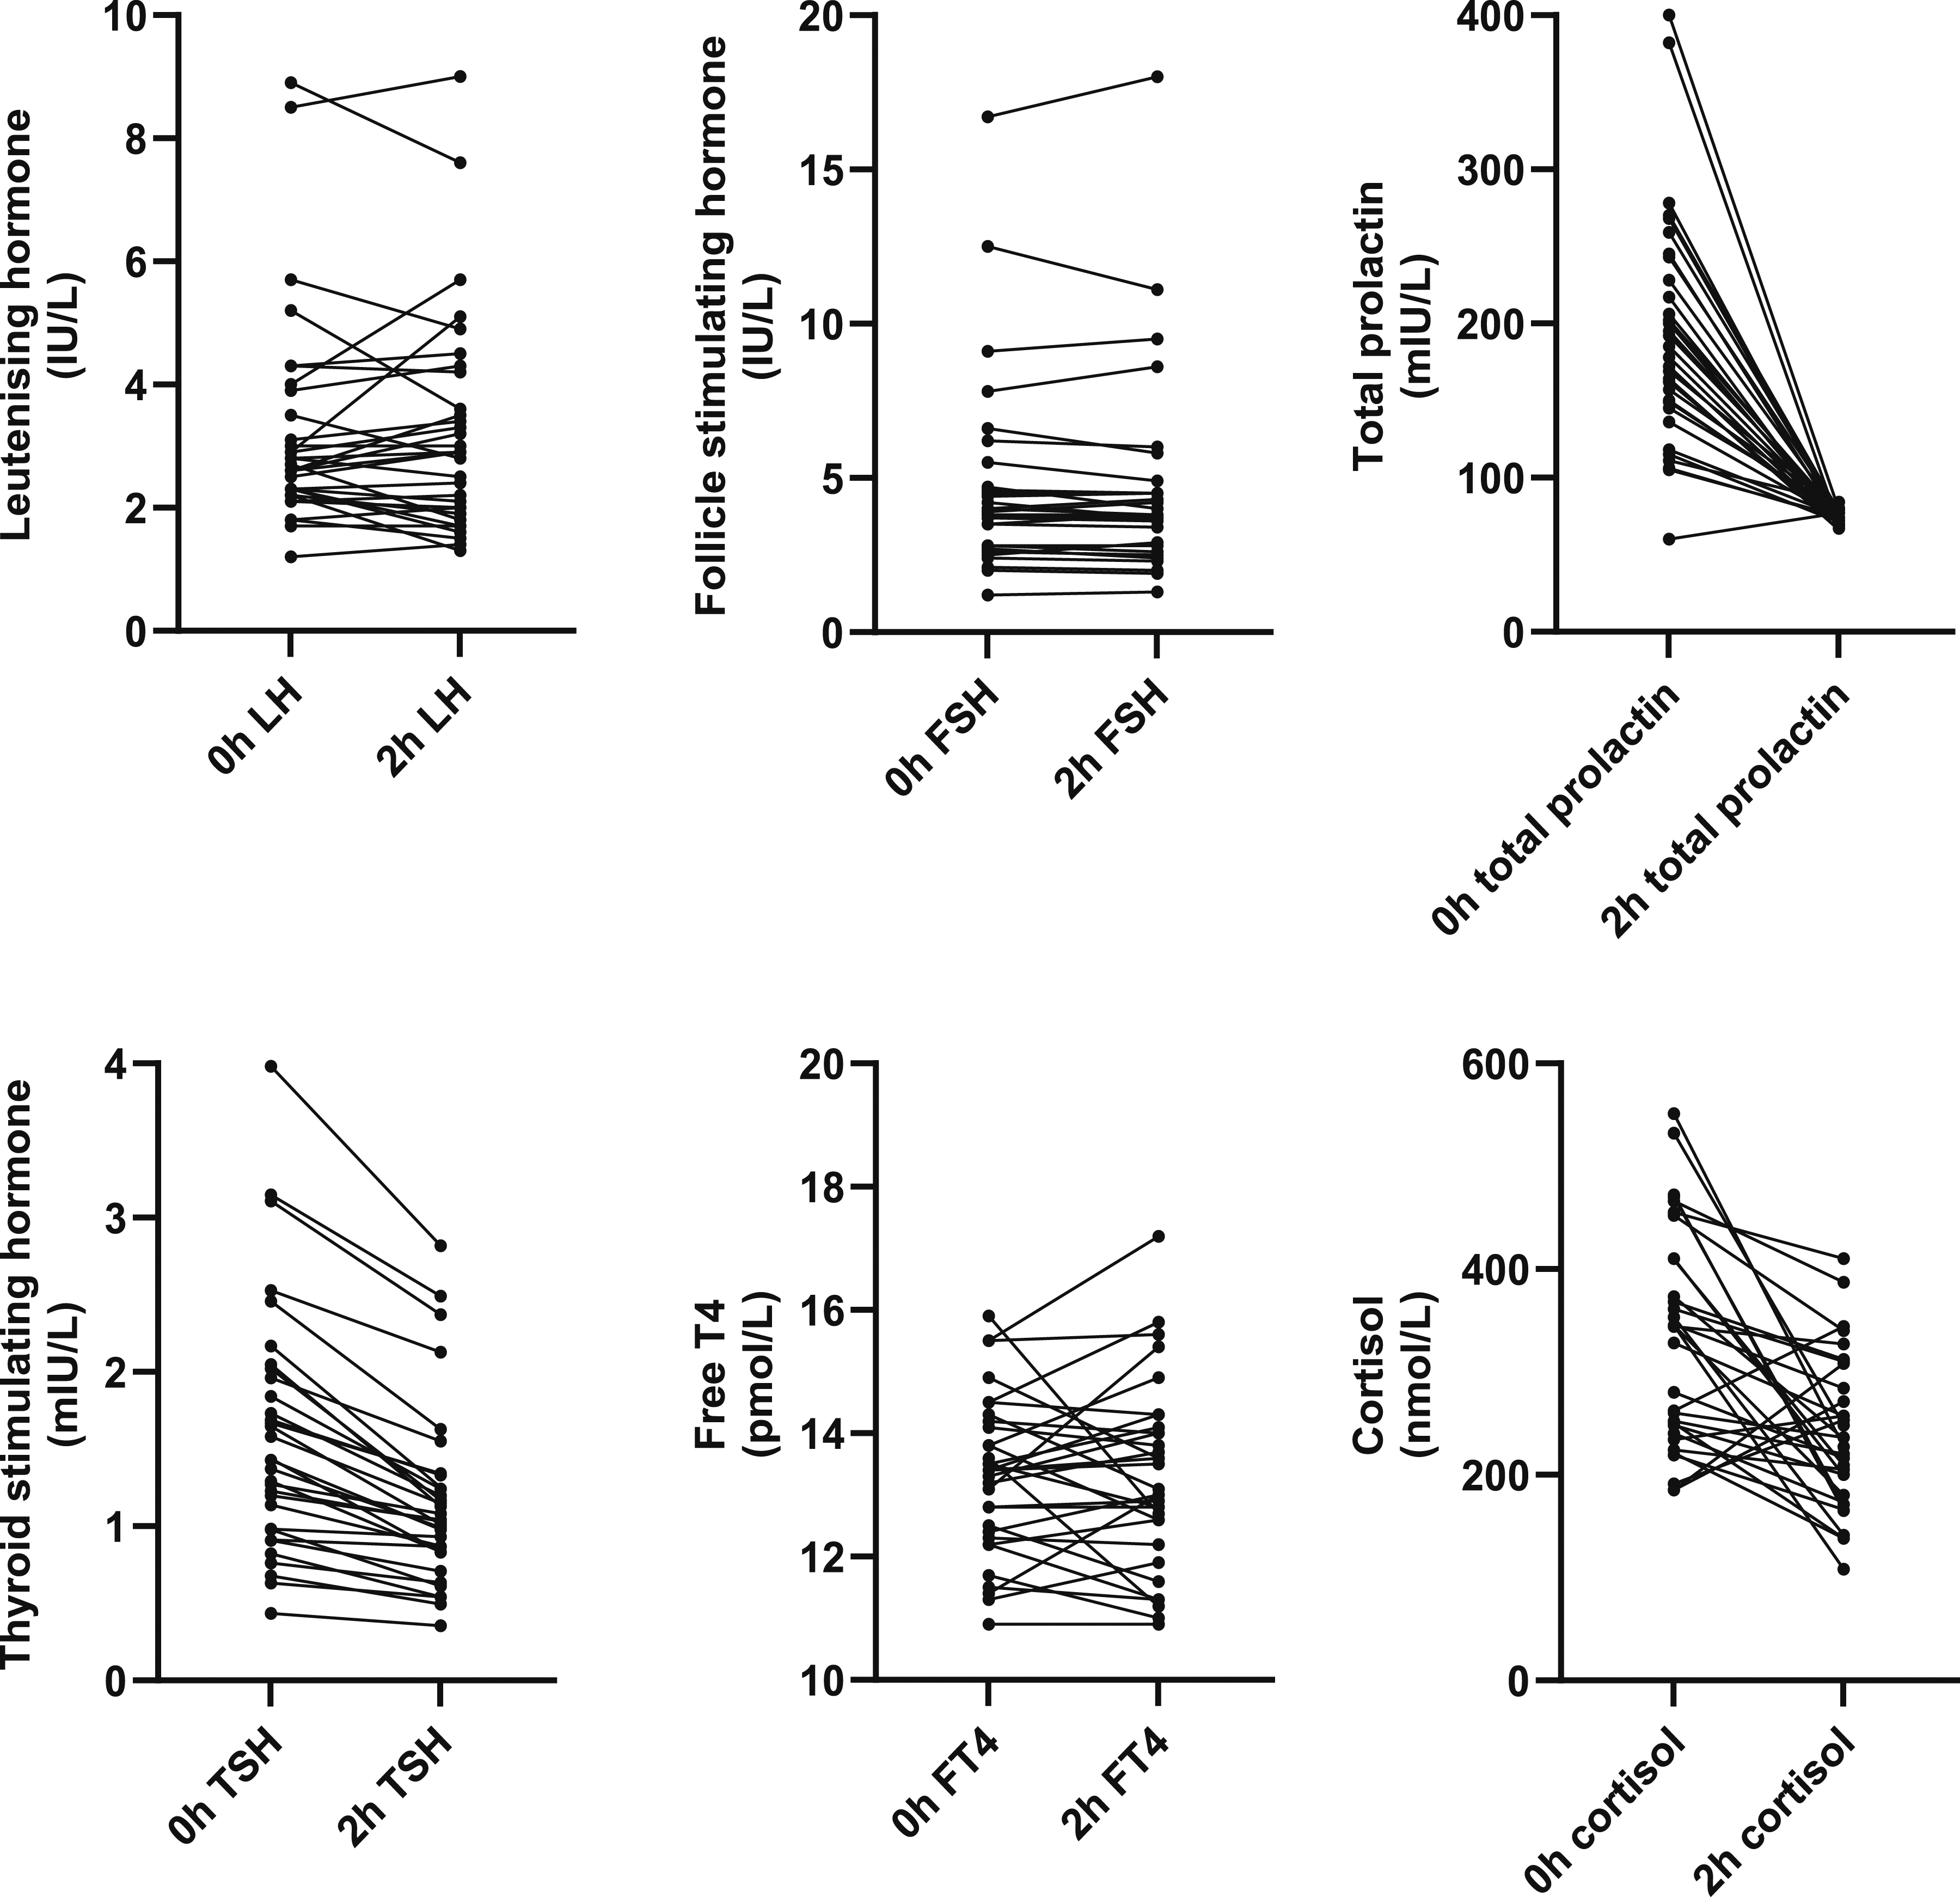
Fasting (0 h) and postprandial (2 h) luteinising hormone, follicle stimulating hormone, total prolactin, thyroid stimulating hormone, free thyroxine (FT4) and cortisol during an oral glucose tolerance test in 32 male subjects.
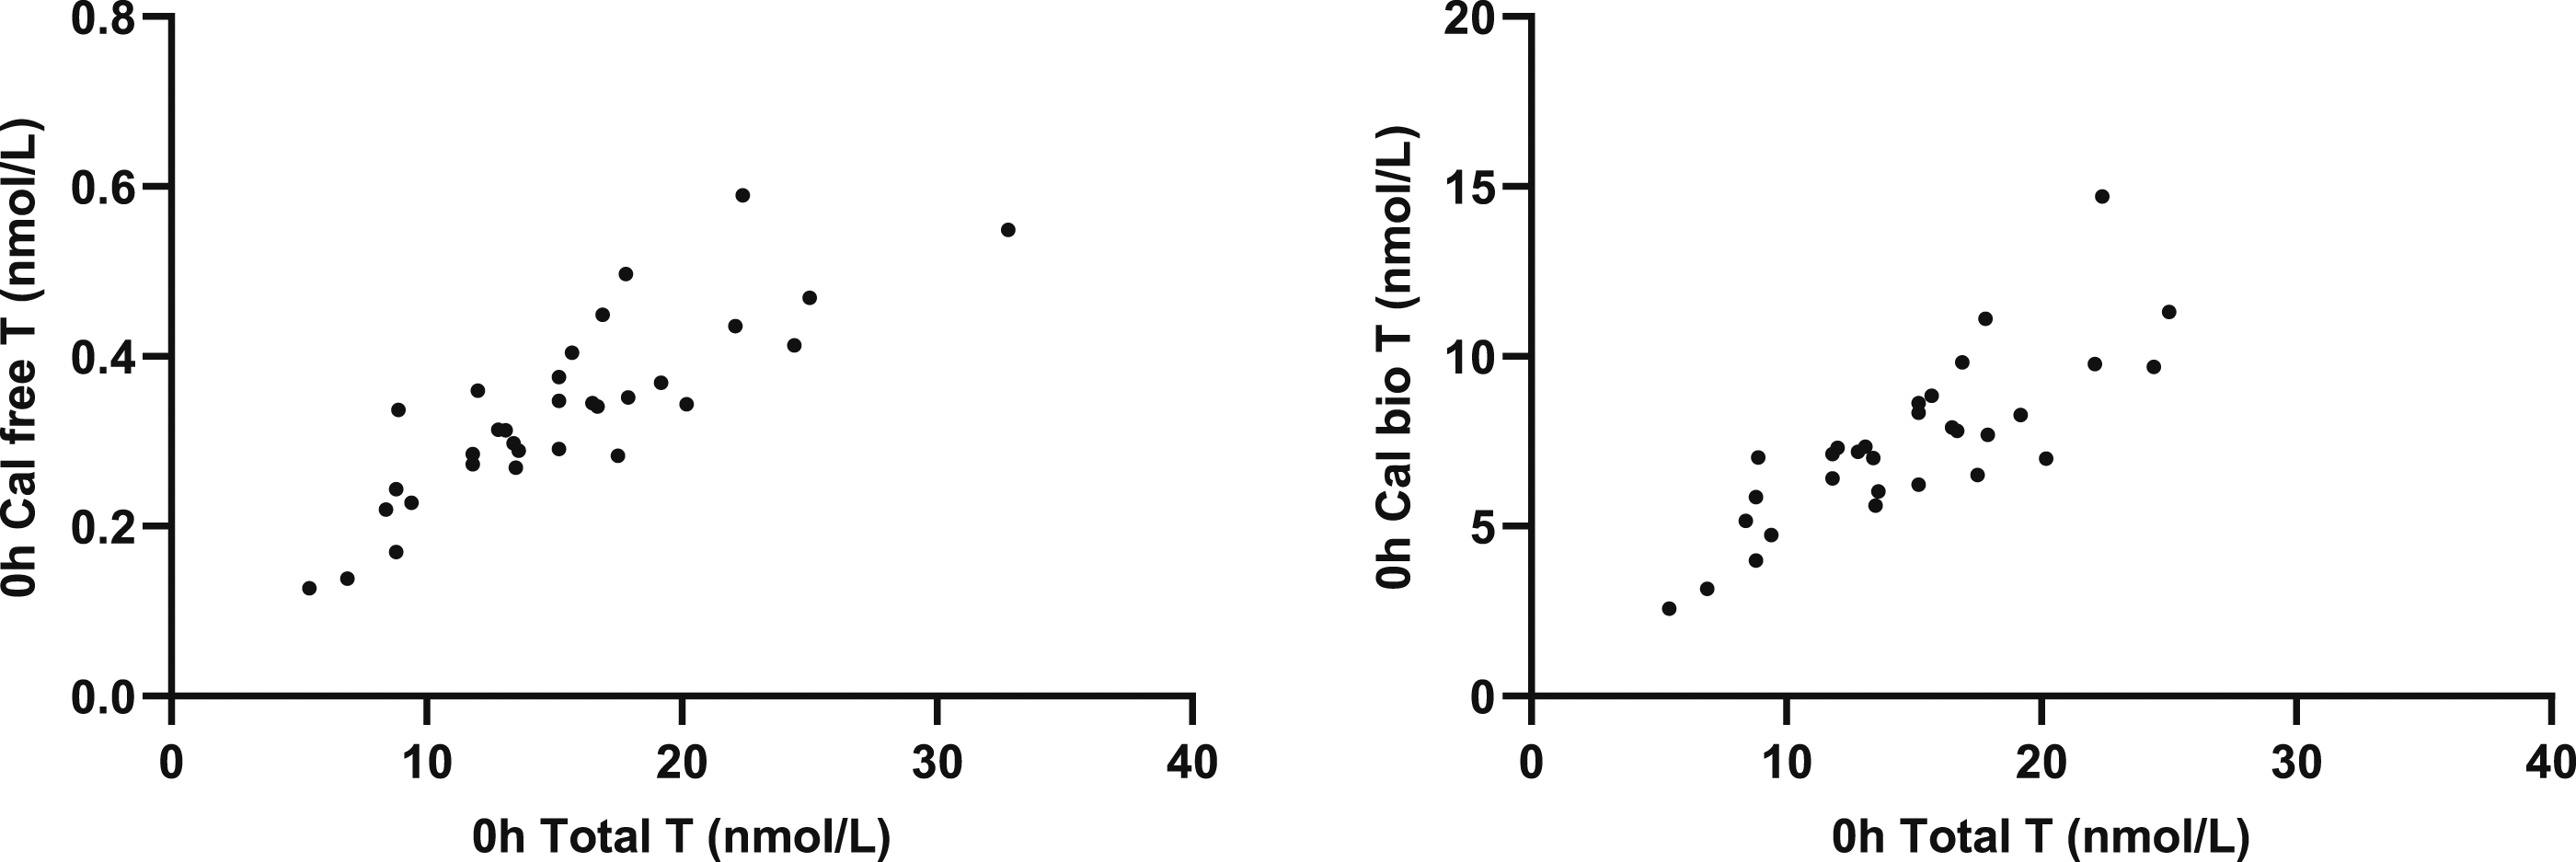
Salivary testosterone correlated with total T (r = 0.5322; P = .0017), calculated free T (r = 0.7555; P = <0.0001) and calculated BAT (r = 0.7463; P = <0.0001) (Figure 3). Total T correlated with calculated free T (r = 0.8421; P = <0.0001) and BAT (r = 0.8340; P = <0.0001) (Figure 4 and 5). Correlation of SalT with total T, calculated free T and calculated BAT. Correlation of total T with calculated free T and calculated BAT. Correlation of SalT, total T, free T and BAT with BMI.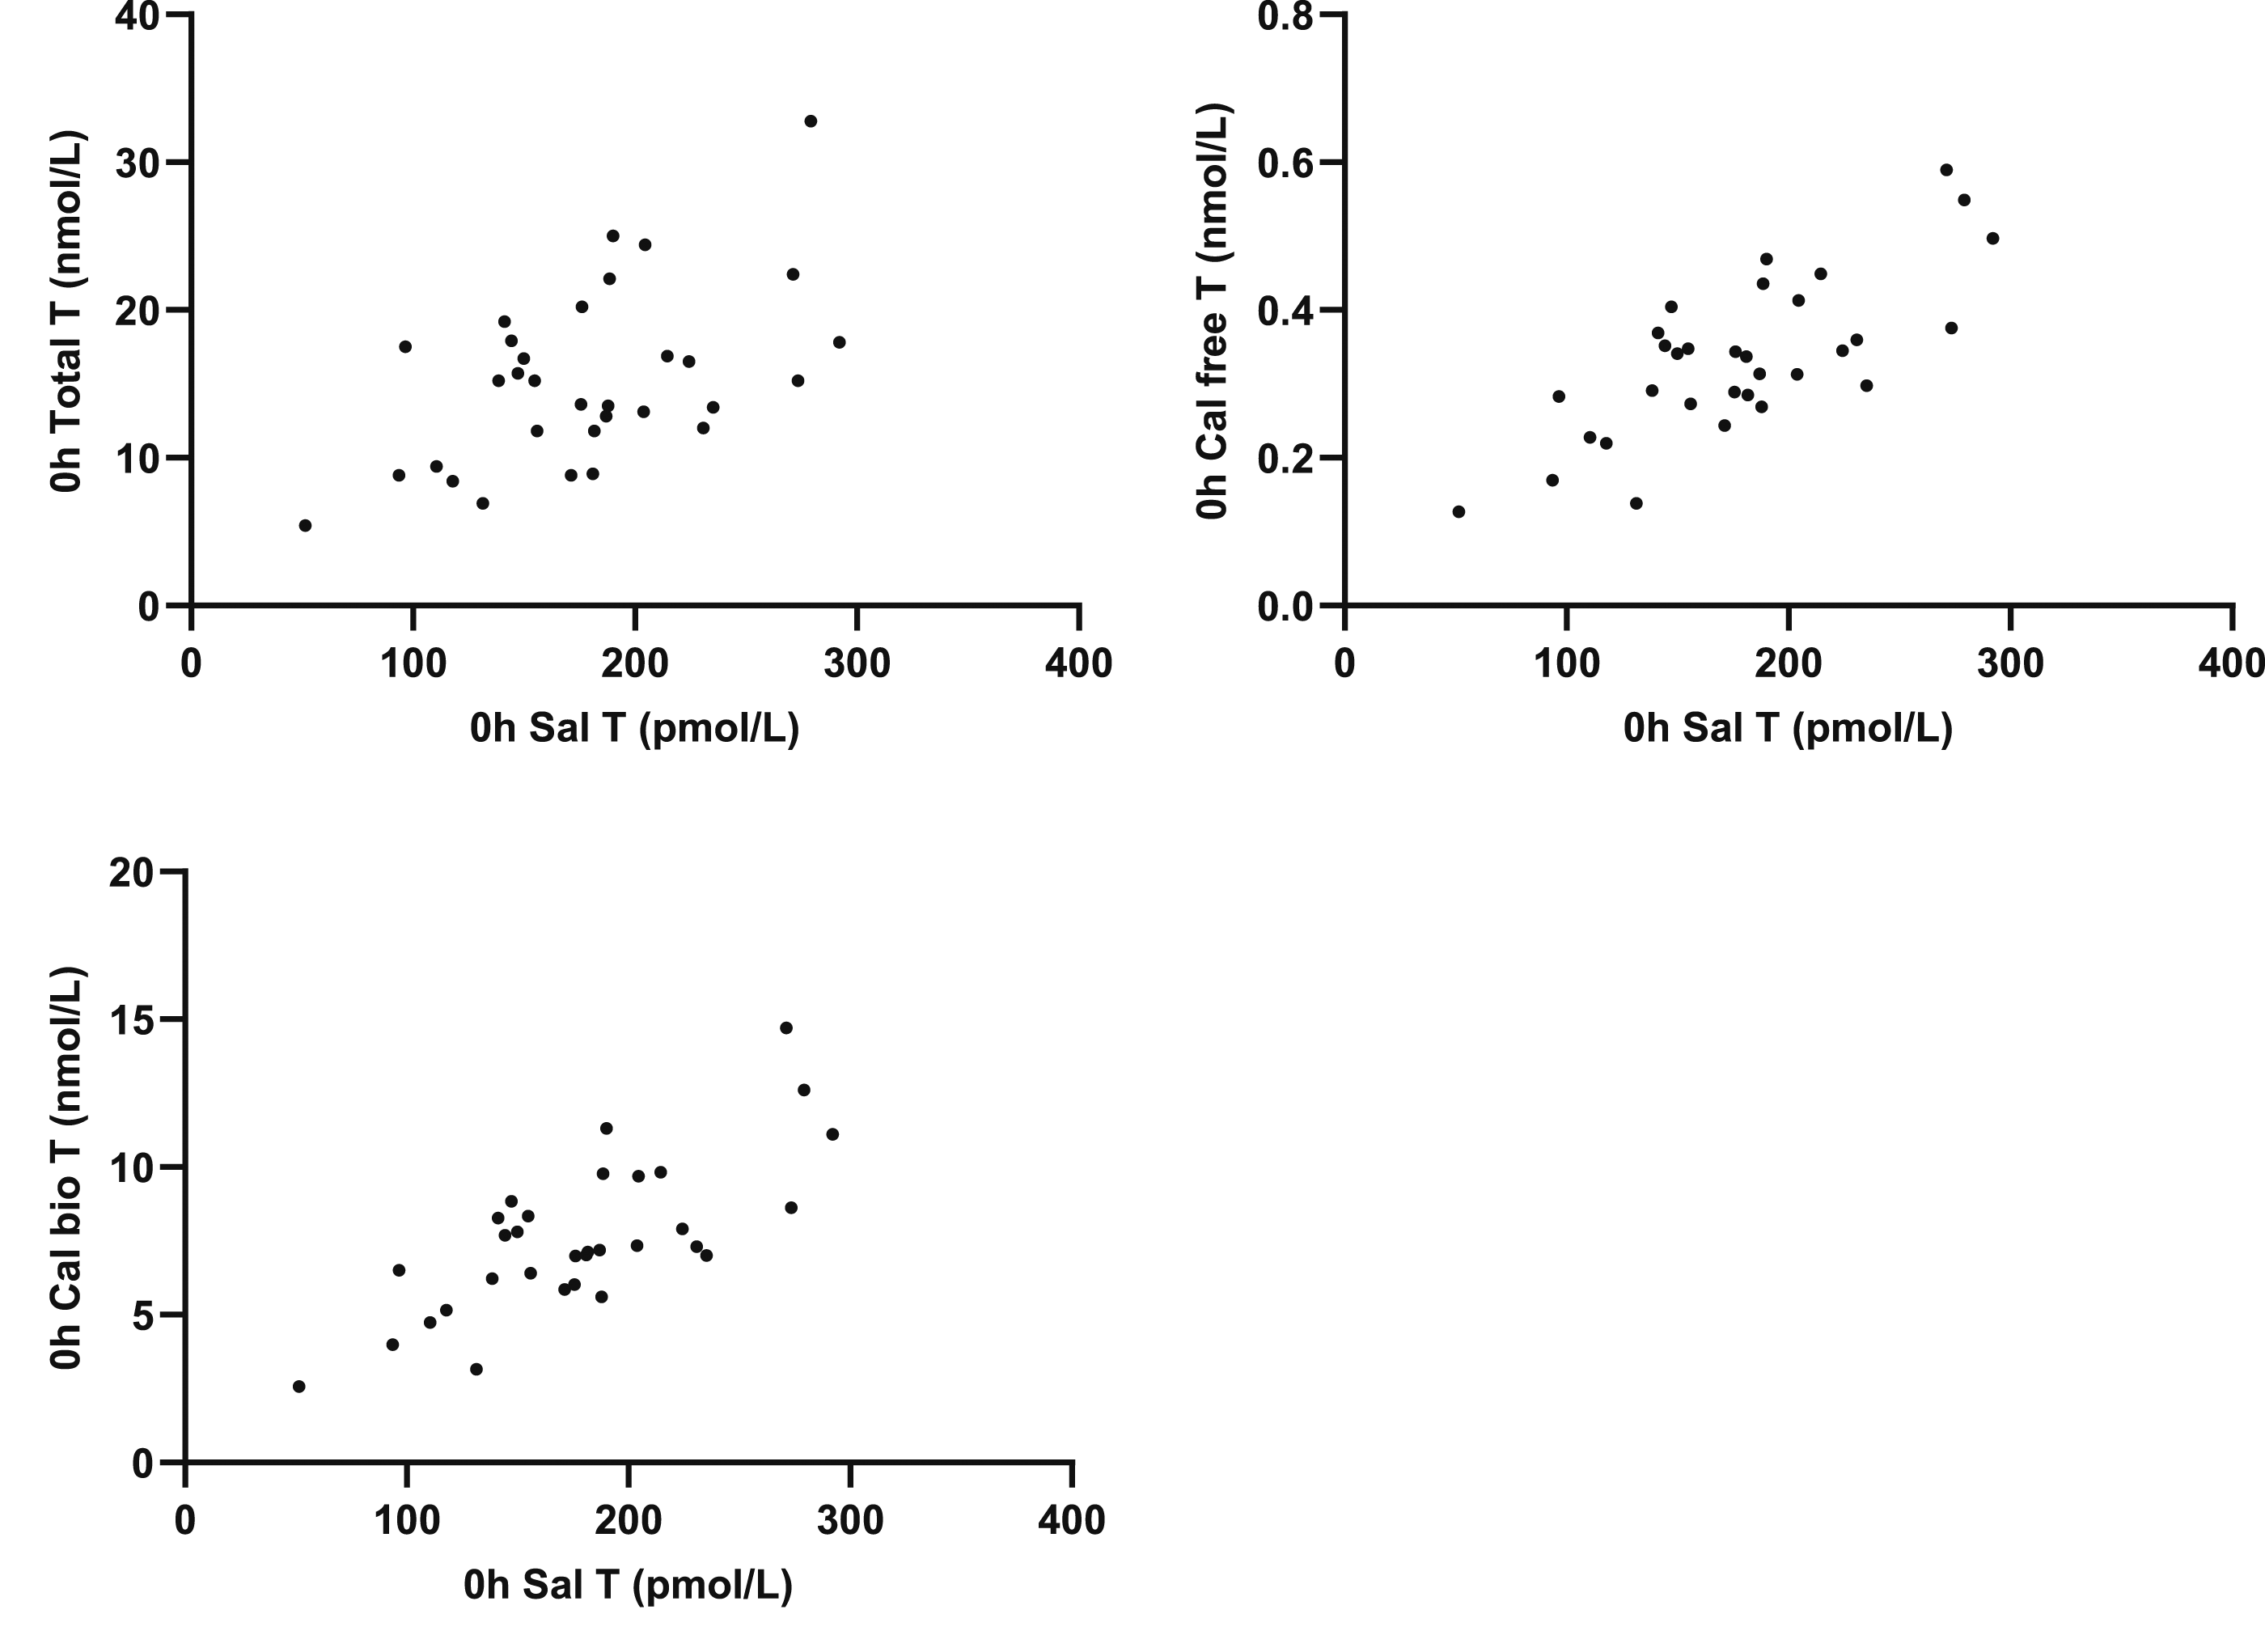
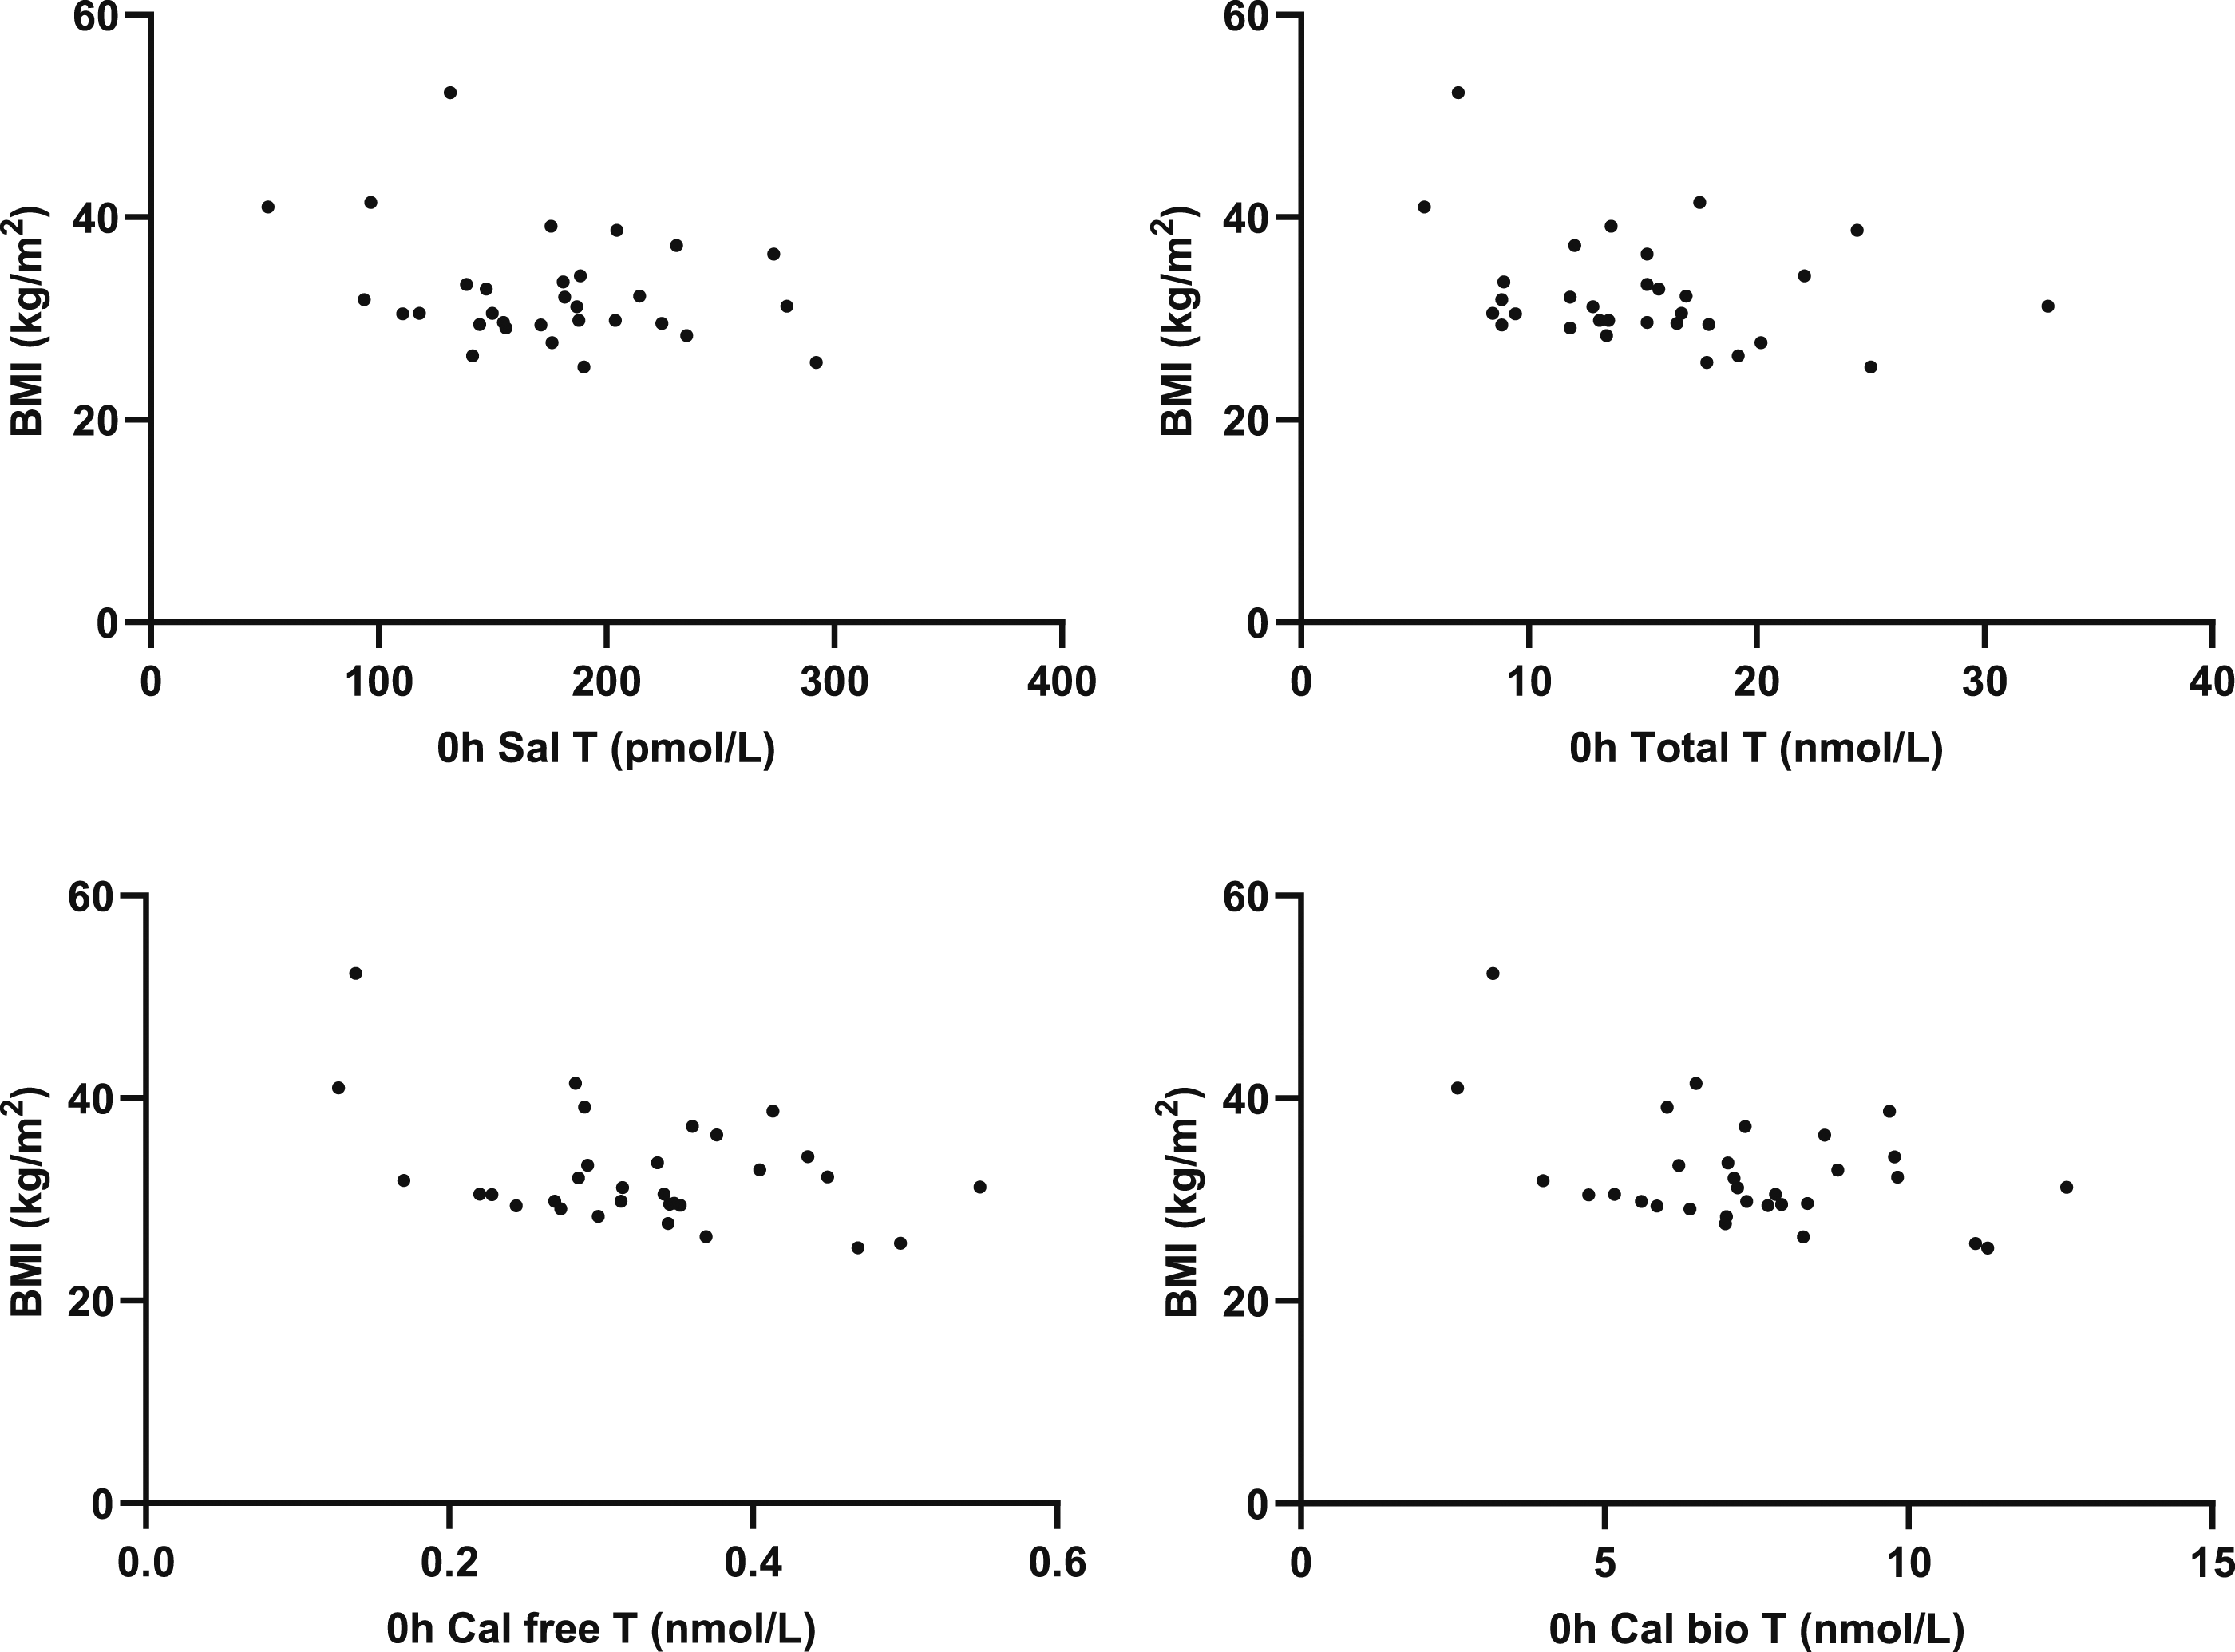
BMI correlated with calculated free T (r = −0.4154; P = .0201) and BAT (r = −0.4318; P = .0153) but not SalT (r = −0.2841; P = .1214), total T (r = −0.2915; P = .1116) or change in SalT (r = 0.0212; P = .9099). Postprandial glucose did not correlate with salivary testosterone (r = −0.1467; P = .4229 (Figure 6). Correlation of change in SalT with BMI and 2h postprandial glucose with 0h SalT.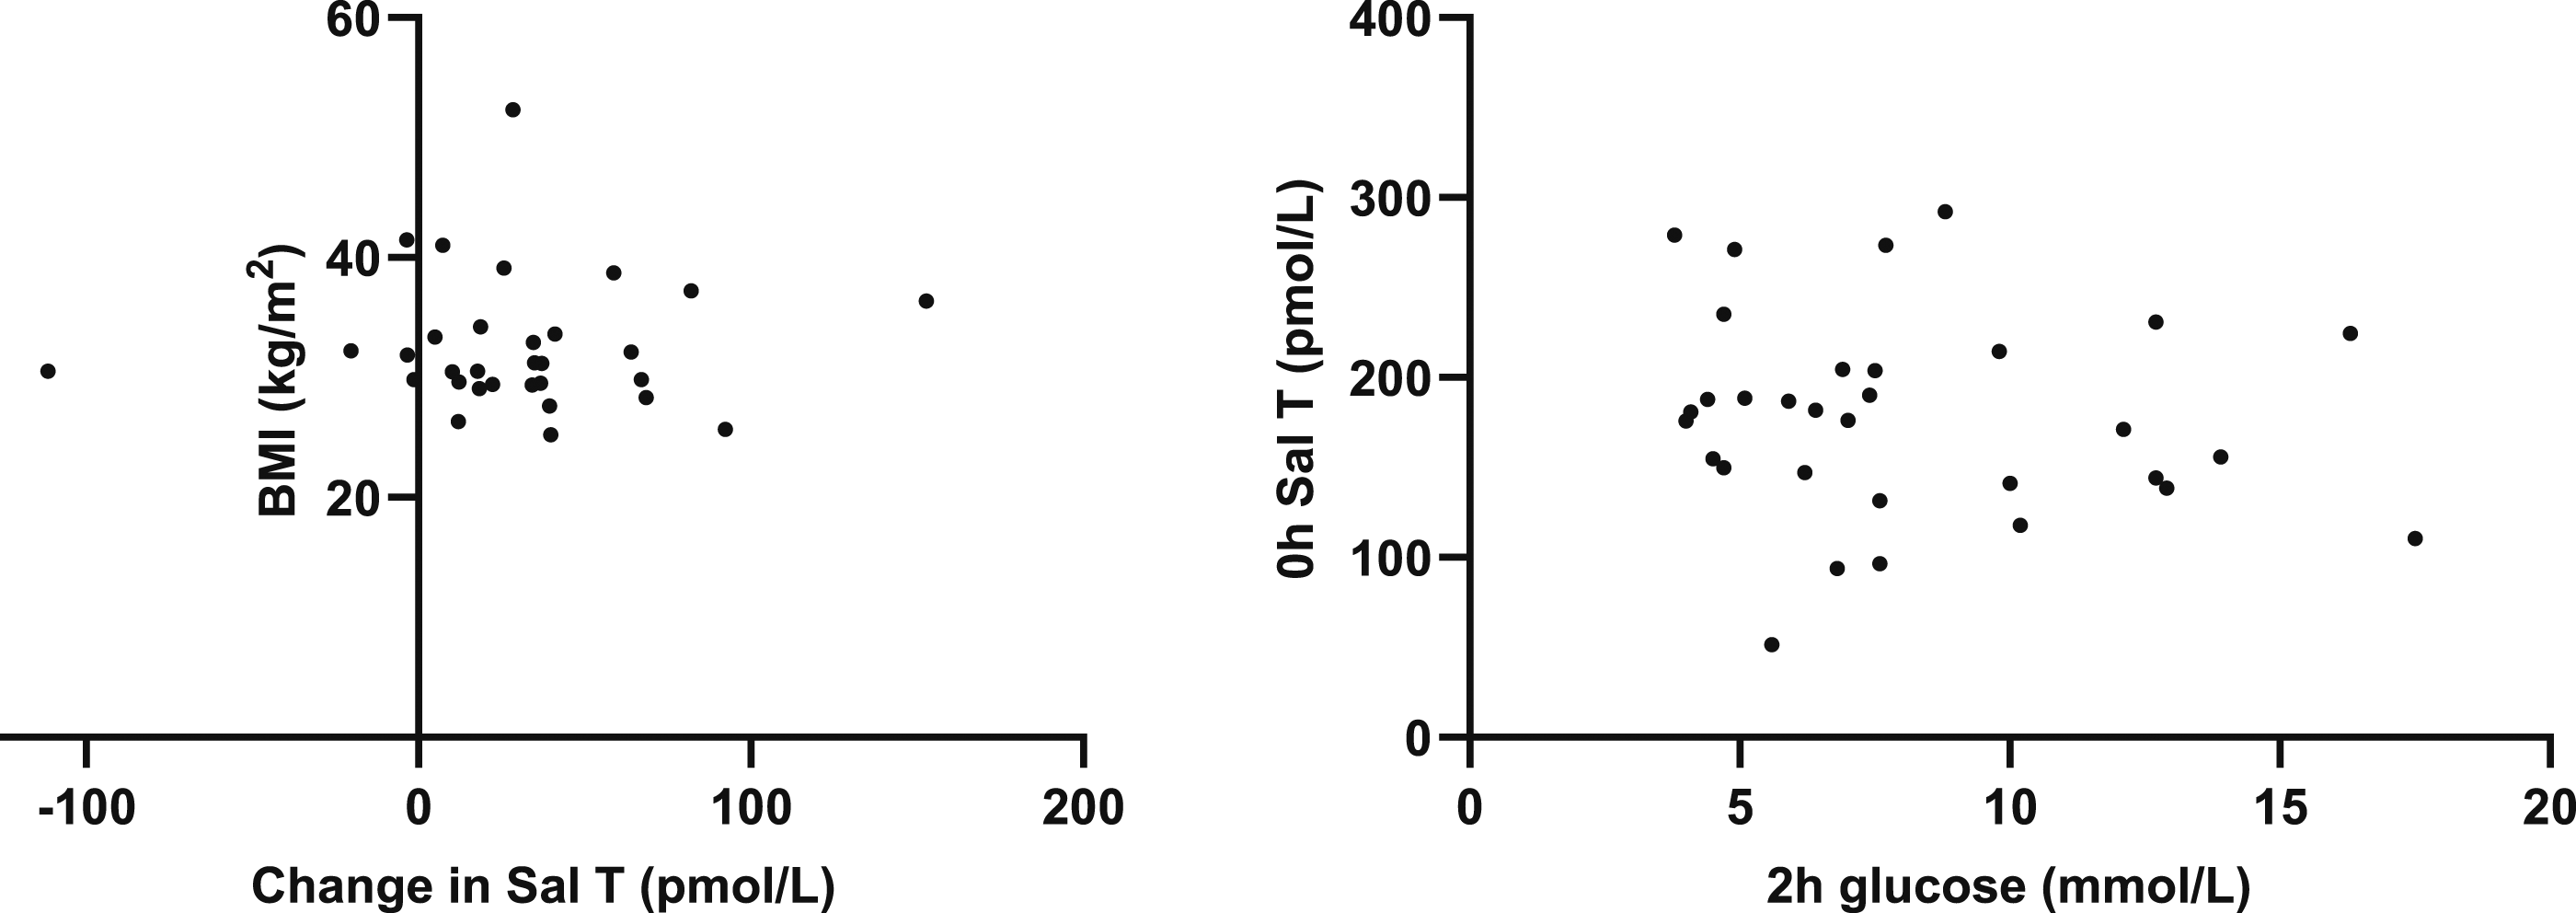
Discussion
We report for the first time that SalT decreased 2 hours after an oral glucose load. Consistent with previous studies, gonadotrophins were unchanged and prolactin decreased 13 following food ingestion, indicating that the postprandial decrease in SalT is not mediated by changes in the hypothalamic-pituitary-testicular (HPT) axis. The decrease in SalT, however, may be related to postprandial insulin-induced inhibition of steroidogenesis. 17 The decrease in serum prolactin, TSH and cortisol between 09.00 h to 09.30 h and 11.00 h to 11.30 h reflects diurnal variation and offers an alternative explanation for the decrease in SalT independent of food consumption. Although salivary testosterone exhibits a diurnal variation being highest in the morning decreasing in the afternoon and lowest at night, 12 it is unclear whether temporal variations in SalT are inherent circadian rhythms or due to meal consumption in free living individuals. In addition, there are no data on temporal variation in SalT between 09.00 h and 12.00 h.
In this study, irrespective of whether due to food or circadian rhythm, changes in SalT appear at variance with serum total T. Although total T is reported to have a diurnal variation with peak levels between 05.30 h and 08.00 h and nadir levels approximately 12 h later depending on the study, 4 the data on variation of total T between 09.00 h and 12.00 h is limited but may not be significantly different. 12 In addition, the diurnal variation in total T is blunted with increasing age. 4 Our study cohort was middle-aged, and this may have contributed to blunting of total T diurnal variation.
Serum total T, in this study, remained unchanged following an oral glucose load. These results are consistent with those studies reporting that total T is unaffected by food ingestion 25 but differs from those reporting a decrease 2 hours after ingestion of food.13–19 The differences in these studies may be related to different study cohorts, study methodology and analytical techniques. Since SHBG and albumin in this study and others14,16,17,19 are unaffected postprandially, calculated free T and BAT using recommended equations would, by definition, be expected to decrease in those studies reporting a decrease in total T13–19 but not in those, including this study, reporting unchanged total T. 25
Another possible explanation for the discordant SalT and total T results is that food consumption increased the rate of saliva production due to stimulation of autonomic activity leading to dilution of SalT and lower postprandial SalT concentrations. This, however, is unlikely since SalT concentrations are reported to be unaffected by saliva flow rates.26,27
In summary, we report fasting SalT between 09.00 h and 09.30 h decreased 2 hours after an oral glucose load between 11.00 h and 11.30 h, which was independent of changes in the HPT axis. A concomitant decrease in serum prolactin, TSH and cortisol between 09.00 h to 09.30 h and 11.00 h to 11.30 h reflecting circadian rhythm offers an alternative explanation for the decrease in SalT independent of food consumption. Further studies are required to determine whether morning temporal changes in SalT are related to food consumption or circadian variation or both and if applicable to other age and normal body weight cohorts.
Supplemental Material
Supplemental Material - Salivary testosterone changes during oral glucose tolerance tests in overweight and obese men – Postprandial or circadian variation?
Supplemental Material for Salivary testosterone changes during oral glucose tolerance tests in overweight and obese men – Postprandial or circadian variation? by Jonathan Fenn, Henry Gill, Lauren Starbrook, Loretta Ford, Hayley Sharrod-Cole, Tejas Kalaria, Clare Ford and Rousseau Gama in Annals of Clinical Biochemistry.
Footnotes
Acknowledgements
The authors thank the patients for participating in the study and outpatient phlebotomy at New Cross Hospital for their help.
Declaration of conflicting interests
The author(s) declared no potential conflicts of interest with respect to the research, authorship, and/or publication of this article.
Funding
The author(s) received no financial support for the research, authorship, and/or publication of this article.
Ethical approval
The study was approved by the West of Scotland Research Ethics Service and Health Research Authority (IRAS Project ID: 277771, Protocol Number: 2020LAB110, REC reference Number: 20/WS/0115).
Guarantor
Rousseau Gama.
Contributorship
RG, CF, HG and JF conceived the study. JF, HG, LS and TK collected the samples. JF processed and analysed samples with help from HG, LS, LF and HSC. JF analysed the data and wrote the first draft of the manuscript. All authors critically reviewed, revised and approved the final version of the manuscript.
Data availability statement
Data are available from the corresponding author.
Supplemental material
Supplemental material for this article is available online.
References
Supplementary Material
Please find the following supplemental material available below.
For Open Access articles published under a Creative Commons License, all supplemental material carries the same license as the article it is associated with.
For non-Open Access articles published, all supplemental material carries a non-exclusive license, and permission requests for re-use of supplemental material or any part of supplemental material shall be sent directly to the copyright owner as specified in the copyright notice associated with the article.