
Abstract
Background
Serum copper and zinc are measured to assess deficiency and toxicity. Atomic absorption spectrophotometry and mass spectrometry methods are expensive and require highly trained staff. Colorimetric assays are available from Randox which are inexpensive and can be automated. We validated serum copper and zinc colorimetric assays on the Binding Site Optilite analyser including comparison with flame atomic absorption spectrophotometry (FAAS) and inductively coupled plasma-mass spectrometry (ICP-MS).
Methods
Accuracy, imprecision, lower limit of quantitation, and linearity were ascertained. The impact of triglycerides, bilirubin, nickel, and iron on assay performance was also investigated. Comparison of results from colorimetric analysis of patient and external quality assurance samples with those obtained by FAAS and ICP-MS was undertaken.
Results
Intra-, and inter-assay imprecision was <9%. Serum copper and zinc assays were linear between 1.8–35.6 and 2.3–45.7 µmol/L, respectively. Agreement was good between colorimetry and FAAS (intercept = -0.7, slope = 1.04) and ICP-MS (intercept = 0.6, slope = 0.99) for serum copper in patients’ samples. For serum zinc, agreement was poor between colorimetry and FAAS (intercept = 2.2, slope = 0.87) and ICP-MS (intercept = 1.9, slope = 0.98) in patients’ samples. There was a poor concordance in assessment of hypozincaemia between colorimetry and FAAS/ICP-MS.
Conclusion
The Randox colorimetric assay for serum copper on the Optilite is simple to perform, has a short analysis time, and measured concentrations compare well with FAAS and ICP-MS. Due to poor agreement with FAAS and ICP-MS, colorimetry is not suitable for the measurement of serum zinc.
Keywords
Introduction
Copper and zinc are essential trace elements that are measured to assess deficiency and toxicity. Copper acts primarily as a co-factor in enzyme systems and within plasma is largely (> 95%) bound to caeruloplasmin. 1 Copper deficiency can be present in those on long-term parenteral/enteral nutrition or can occur from reduced absorption (e.g. coeliac disease, excessive zinc intake). Copper toxicity may arise from acute/chronic copper ingestion or in those individuals with Wilson disease. 2 Zinc deficiency arising from inadequate diets is a significant public health concern throughout much of the world and is associated with increased morbidity, delayed wound healing, and altered immune function. Severe zinc deficiency causes major dermal, gastrointestinal, and neurological disorders. 1 Conversely, zinc toxicity is uncommon and manifests as a variety of symptoms, including abdominal pain, nausea, vomiting, lethargy, anaemia, and dizziness. 3
Copper and zinc are most frequently measured in plasma or serum. This is despite concentrations of these elements fluctuating in these matrices for reasons besides deficiency or toxicity, such as the acute phase response and diurnal variation. Within children and adults, serum copper concentrations are approximately 3.0–25.0 µmol/L and 12.0–18.0 µmol/L, respectively. 1 In Wilson disease, serum copper is typically <4 µmol/L but can be elevated if severe liver disease is present. 1 Serum zinc is typically 11.0–22.0 µmol/L for all ages. 1 Copper is also measured in 24-hour urine collections or before and after administration of D-penicillamine to assist in the diagnosis of Wilson disease. 4 Within a clinical setting, urinary zinc is occasionally measured to assess zinc status, although interpretation can be difficult. 5
Measurement is most commonly performed using ‘gold standard’ Inductively Coupled Plasma-Mass Spectrometry (ICP-MS) or Flame Atomic Absorption Spectrometry (FAAS), as these methods are both sensitive and selective. However, such methods require highly trained staff, and instrumentation is expensive and may not be practical for small or geographically isolated laboratories. 6 Colorimetric methods for copper and zinc are commercially available (Randox, Parramatta, Australia), which can be undertaken manually or semi-automated on appropriate analysers. The copper assay is based on the release of copper bound from caeruloplasmin by addition of ascorbic acid and then the formation of a stable colour complex between copper and 4-(3,5-dibromo-2-pyridylazo)-N-ethyl-N-(3-sulfopropyl)aniline (3,5-di-Br-PAESA). However, the zinc assay is based on the formation of a stable colour complex of zinc with 2-(5-bromo-2-pyridylazo)-5-(N-propyl-N-sulphopropylamino)-phenol (5-Br-PAPS) in an alkaline solution (pH = 9.8). 7 The intensity of the colour complex for both assays is proportional to the copper and zinc concentrations and can be measured at wavelengths of 575 and 575/700 nm. The advantages of colorimetric assays are ease of use and that they are relatively inexpensive. However, instrument-specific assay parameters are not always available, and concern has been raised over the accuracy of colorimetric assays, especially when using the aqueous calibration solution supplied with the assay. 6
The Optilite is a benchtop analyser available from the Binding Site (Edgbaston, UK) which allows the use of third-party reagents and is well suited for small to medium throughput laboratories. Parameters for the use of the colorimetric copper and zinc assays on the Optilite are not available, and published evaluation data for these assays on chemistry analysers in serum and urine are scant.6,8–10 Therefore, we created Optilite-specific assay parameters and fully validated the performance of the copper and zinc assays for serum samples, including comparison to FAAS and ICP-MS methods. We also retrospectively reviewed imprecision data for serum copper and zinc from the Royal College of Pathologists Australia, Quality Assurance Programs (RCPAQAP) for Serum Trace Elements. We also briefly investigated the use of the colorimetric assays for copper and zinc in urine by ascertaining accuracy, imprecision, and comparison with samples from the RCPAQAP scheme for urine trace elements.
Methods
Materials and reagents
The colorimetric copper and zinc assays were purchased from Randox and consisted of deproteinisation solution (370 mmol/L aqueous trichloroacetic acid), chromogens, buffers, and an aqueous calibration solution. Water (resistivity: >18.2 MΩ) was purified by reverse osmosis and ion-exchange using a Merck Millipore Direct-Q 3 UV water purification system (Melbourne, Australia). Copper nitrate [Cu(NO3)2, 1 g/L], zinc nitrate [Zn(NO3)2, 1 g/L], nickel nitrate [Ni(NO3)2, 1 g/L], and iron nitrate [Fe(NO3)2, 1 g/L] had a purity of 99.999% (Merck). All glass and plastic vessels were soaked in 10% v/v (volume/volume) aqueous nitric acid (ACS reagent grade, Merck) for at least two hours and rinsed three times with water before use. Phosphate buffered saline (PBS, pH 7.4) was from Merck.
Instrumentation and assay
Colorimetric assay parameters used on the Binding Site, Optilite.
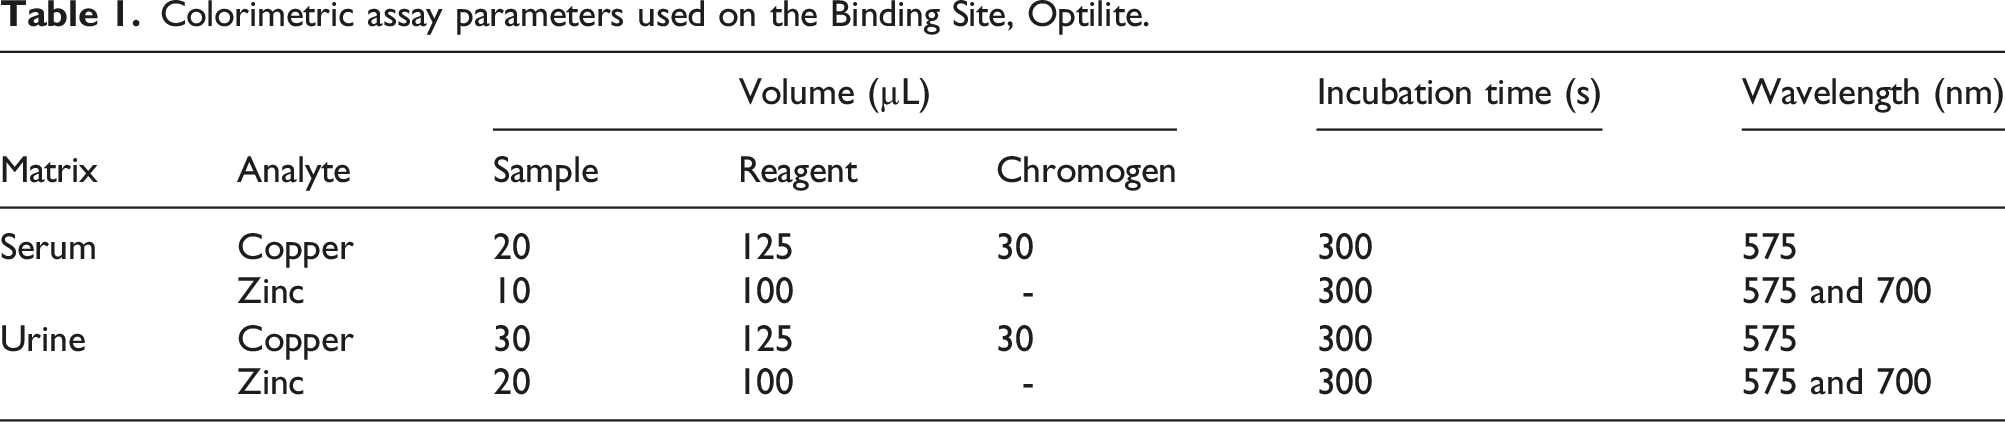
For the serum assay, the deproteinisation solution (100 µL) was added to the sample (100 µL), vortex-mixed for 10 sec, and centrifuged (10,000 g, 10 min). The supernatant was then analysed against a calibration consisting of a reagent blank (water) and a reconstituted lyophilized human serum calibration standard (Randox, Clinical Chemistry Calibration Serum Level 3, copper/zinc concentrations: 25.3/37.2 µmol/L, respectively). Internal Quality control was undertaken at 2 concentrations using reconstituted Seronorm (Billingstad, Norway) human (copper/zinc concentration: 12.7/13.0 µmol/L, respectively) and human high (copper/zinc concentration: 28.6/18.1 µmol/L, respectively) lyophilized serum controls which were analysed in duplicate with every batch of samples.
For the urine assay, the sample was centrifuged (10,000 g, 10 min) and directly analysed against a calibration consisting of a reagent blank and a reconstituted lyophilized human urine calibration standard, ClinCal calibrator, copper/zinc concentration 2.3/10.2 µmol/L, respectively (Recipe, Munich, Germany). Bio-Rad Laboratories (South Granville, Australia) Lyphocheck, Urine Metals Control levels 1 (copper/zinc concentration: 0.9/2.9 µmol/L, respectively) and 2 (copper/zinc concentration: 1.8/9.1 µmol/L, respectively) were used as IQC material.
The FAAS assay has been previously described. 6 Briefly, the sample (300 µL) was diluted with deionized water (600 µL) and measured using a Varian Spectra 880 (Agilent Technologies, Mulgrave, Australia) at a wavelength of 324.8 and 213.9 nm, for copper and zinc, respectively. Calibration was by standard addition using calibration solutions (n = 4) prepared from zinc [Zn(NO3)2, 1 g/L] and copper nitrate [Cu(NO3)2, 1 g/L] in 5% (v/v) aqueous nitric acid, added to excess pooled human serum. The ICP-MS assay involved the sample (80 µL) being diluted with 1% (v/v) aqueous nitric acid containing gallium (10 mg/L) as internal standard (3920 µL) and measured using an Agilent 7900 (Agilent Technologies, Mulgrave, Australia) in standard mode (i.e. without a collision cell). Calibration was by aqueous solutions prepared from zinc [Zn(NO3)2, 1 g/L] and copper nitrate [Cu(NO3)2, 1 g/L] in 10% (v/v) aqueous nitric acid.
Total bilirubin and triglycerides were both measured spectrophotometrically using a Cobas 6000 automated analyser (Roche, North Ryde, Australia).
Accuracy and imprecision
Intra- and inter-assay imprecision and accuracy for the serum assay were ascertained by the analysis of a patient serum sample, 1 external quality assurance (EQA) sample from the RCPAQAP scheme for Serum Trace Elements, and Seronorm human and human high serum controls in quintuplicate on the same day and on different days (n = 5). For the urine assay, 1 EQA sample from the RCPAQAP Urine Trace Elements scheme, and Bio-Rad Lyphocheck Urine Metals Control levels 1 and 2 were analysed in quintuplicate on the same day and on different days (n = 5). Accuracy and imprecision <15% were considered acceptable. 11
Carry-over, linearity, and lower limit of quantitation
Carry-over was determined by the analysis of serum samples containing copper/zinc at low (L) and high (H) concentrations (5.8/5.8 and 35.6/35.7 µmol/L, L and H, respectively) followed by a blank [water, (B)] in the following sequence: L, L, L, B, B, B, and H, H, H, B, B, B. Carry-over <1% was considered insignificant.
Linearity was assessed by non-serial dilutions (1 + 1, 1 + 4, 1 + 9, 1 + 19) of a patient serum sample (initial copper/zinc concentrations: 35.6/45.7 µmol/L, respectively) with PBS. Differences were calculated between the nominal and measured concentrations, with acceptance criteria being within 10% (mean of triplicates). 11
The lower limit of quantitation (LLoQ) was assessed by non-serial dilutions (1 + 1, 1 + 4, 1 + 9, 1 + 19) of a patient serum sample (initial copper/zinc concentration approximately 13.3/13.9 µmol/L, respectively) with PBS using an acceptance criteria of <20% inaccuracy and imprecision (mean of triplicates). 11
Interference studies
The effect of total bilirubin and triglycerides was ascertained by the non-serial dilution (i.e. 1 + 1, 1 + 4, 1 + 9, 1 + 19) of 3 separate serum samples (copper and zinc; 12.5/16.9/21.6, and 12.1/15.6/25.5 µmol/L, respectively) that contained low concentrations of total bilirubin (median: 3, range: 1–6 µmol/L) and triglycerides (median: 0.6, range: 0.4–1.0 µmol/L) with a separate sample (copper and zinc: 13.5 and 13.2 µmol/L, respectively) containing high concentrations of total bilirubin (184 µmol/L) and triglycerides (8.89 mmol/L). All samples had no discernible haemolysis. Differences were calculated between the nominal and measured concentrations of copper and zinc, with acceptance criteria being within 10% (mean of triplicates).
Interference from nickel and iron in both copper and zinc assays, and copper and zinc in zinc and copper assays, respectively, was ascertained by addition (fortification) of aqueous copper, zinc, iron, and nickel nitrate (final concentration: 100 µmol/L) to aqueous solutions separately containing copper and zinc at 5, 20, and 30 µmol/L. Differences in copper and zinc concentrations between fortified and non-fortified samples were calculated, with acceptance criteria being within 10% (mean of triplicates).
Method comparison
For method comparison, excess serum patients’ samples submitted to the laboratory for the assessment of copper and zinc were used. Whole blood was collected into a polypropylene Vacuette serum separator blood collection tube (Greiner Bio-One, Kremsmünster, Austria) and transported to the laboratory on the day of collection. Once received in the laboratory, samples were centrifuged (12,000 g, 10 min), and portions (approximately 0.5 mL) of serum were stored in 1.5 mL natural microcentrifuge tubes (Eppendorf, Macquarie Park, Australia) for up to three days at 2–8°C before analysis by colorimetric, FAAS, and ICP-MS assays (microcentrifuge tubes were soaked in 10% (v/v) aqueous nitric acid for at least two hours and rinsed three times with water before use). Quality assurance samples from the RCPAQAP schemes for serum and urine trace elements were also analysed and stored at -18 to -20°C for up to 3 days from receipt in the laboratory until analysis. Serum and urine samples are prepared from bovine and human matrices, respectively, and distributed as frozen liquid samples. Retrospective precision data (relative standard deviation %) for serum copper and zinc 2017–2022 by analytical technique was obtained from RCPAQAP. 12
Statistical analysis
Statistical analysis was performed using Analyse-it (Analyse-it Software Ltd, Leeds, UK) for Microsoft Excel. Normality was assessed by the Shapiro–Wilk test and data were found to be parametric. Data were expressed as means and standard deviations (SD). Difference between assays was evaluated using the t-test for matched pairs, correlation was assessed using Pearson’s correlation (r), and method comparison undertaken using Bland–Altman and Passing–Bablok regression analyses.
Results
Accuracy, imprecision, linearity, lower limit of quantitation, and carry-over
Summary accuracy and imprecision data for serum copper (A), serum zinc (B), urine copper (C), and urine zinc (D) measured using Randox colorimetric assays on the Binding Site, Optilite analyser.
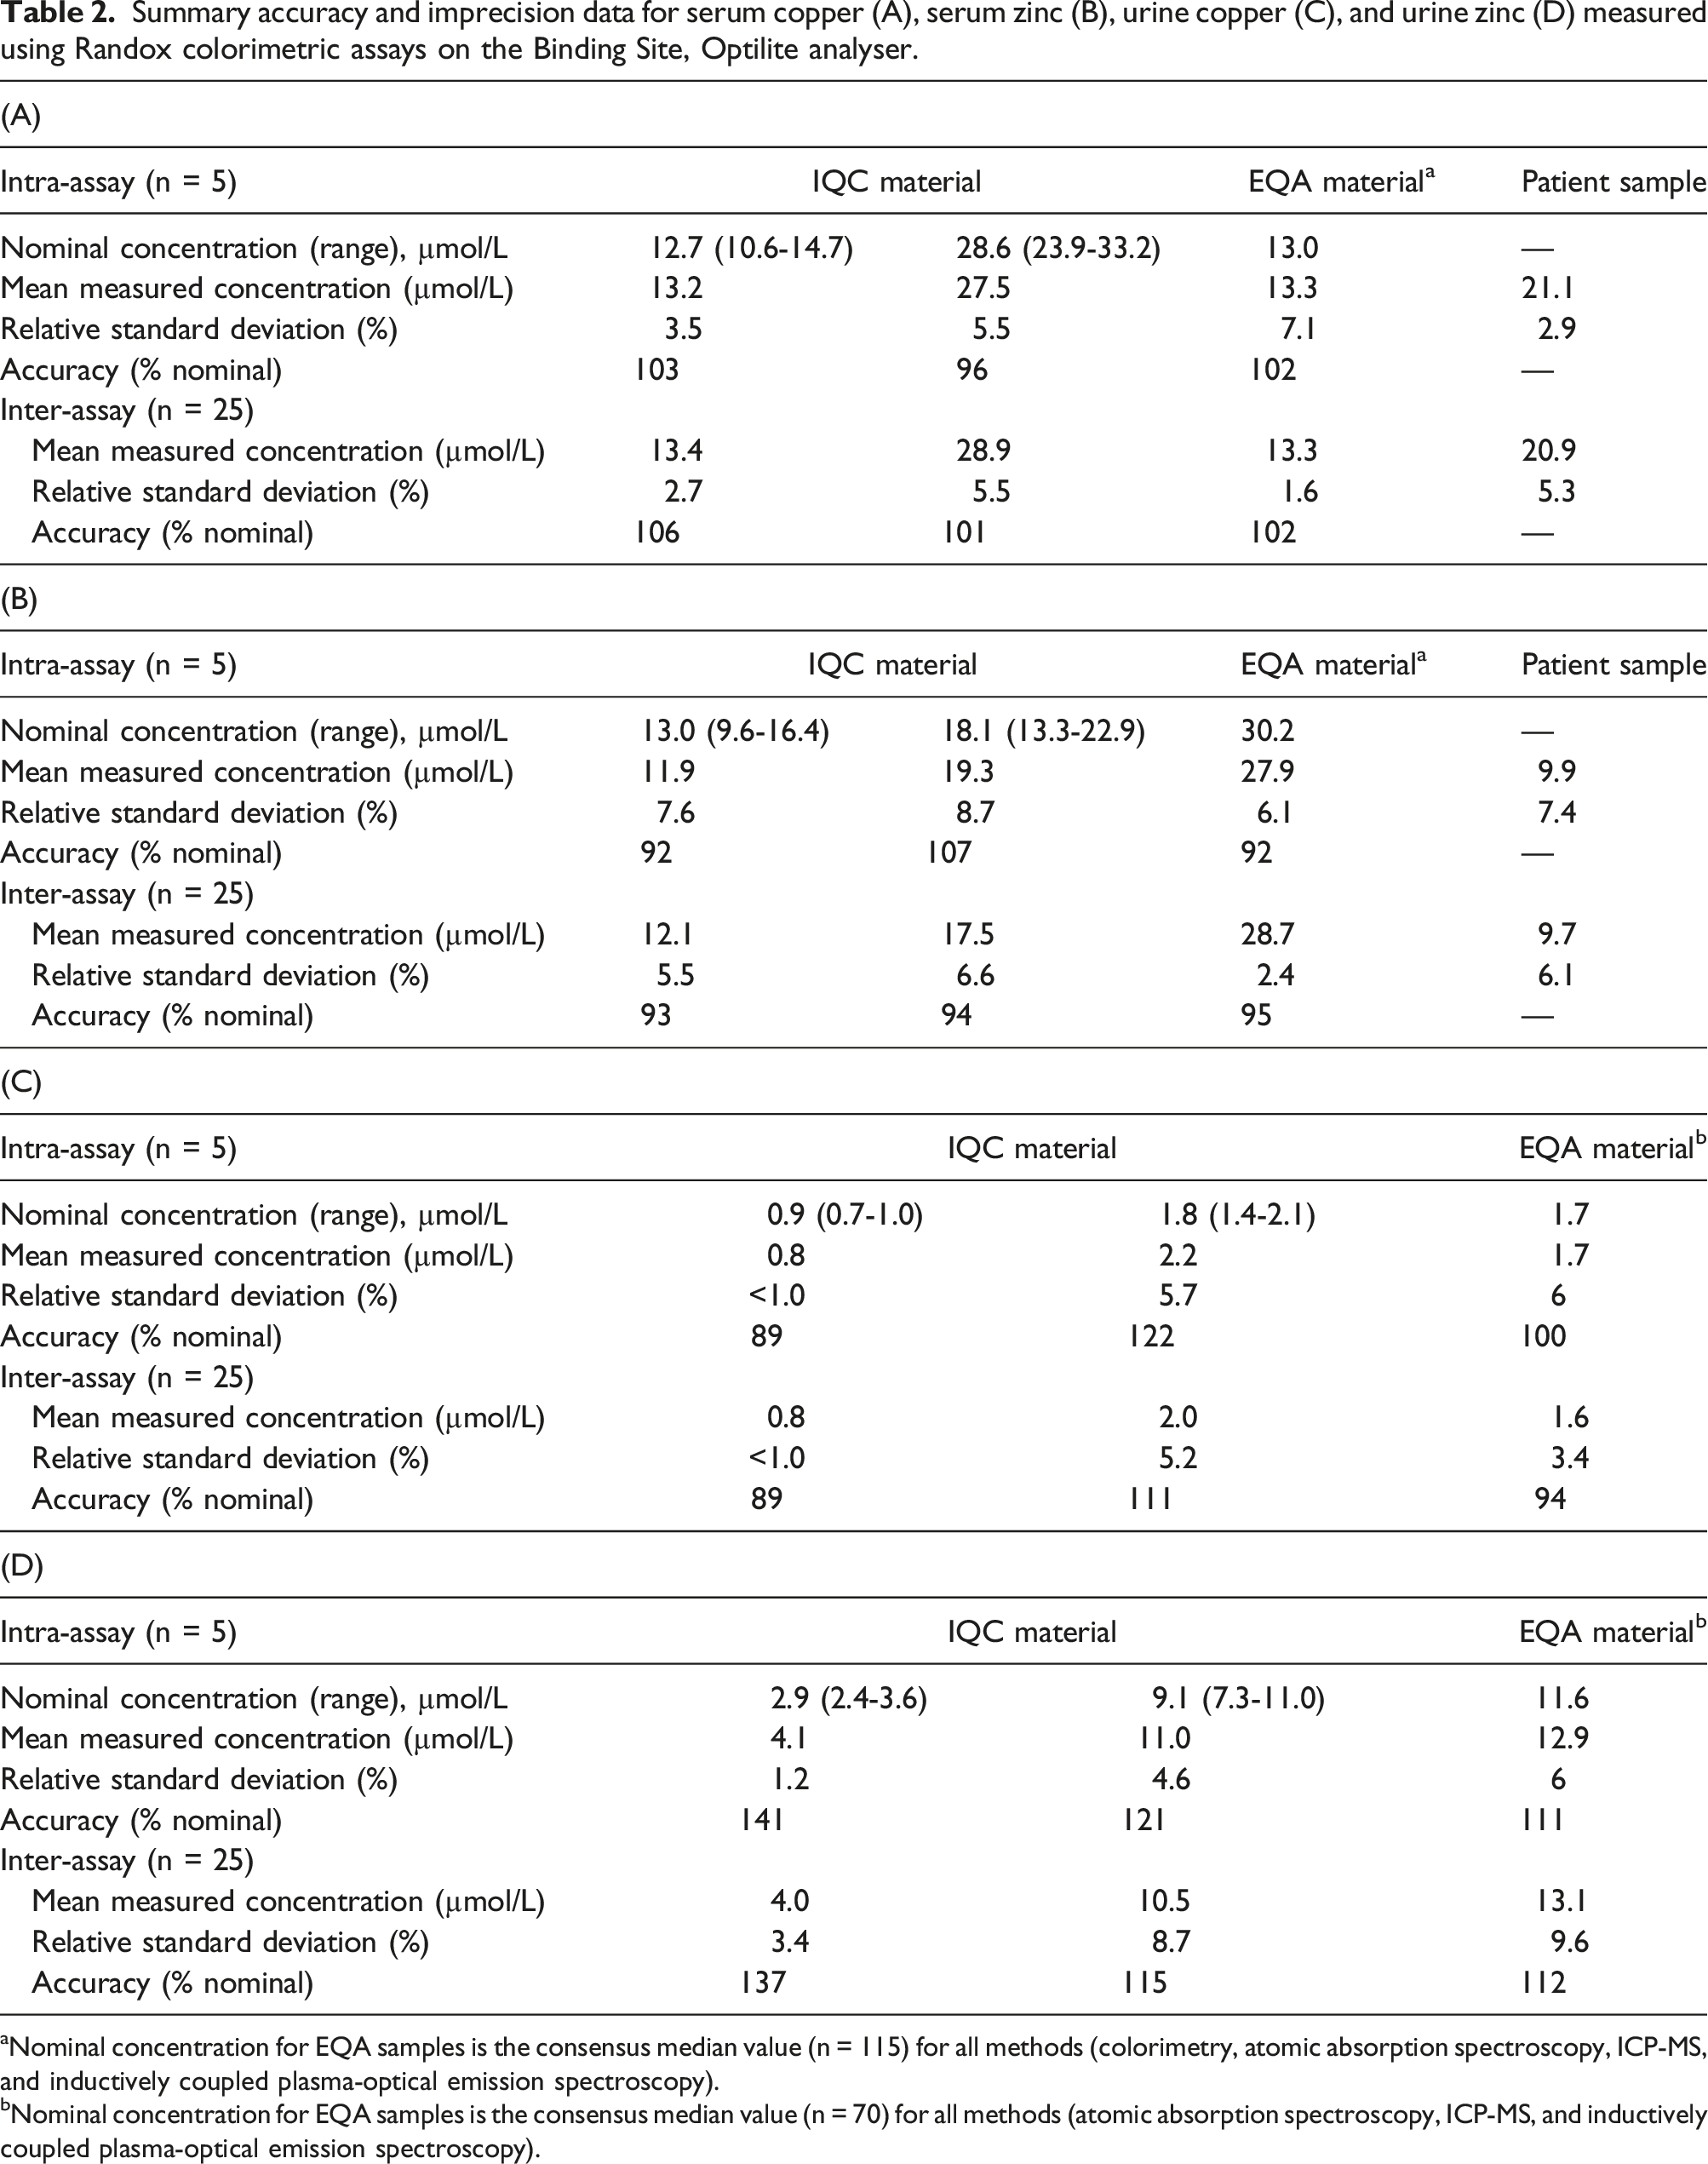
aNominal concentration for EQA samples is the consensus median value (n = 115) for all methods (colorimetry, atomic absorption spectroscopy, ICP-MS, and inductively coupled plasma-optical emission spectroscopy).
bNominal concentration for EQA samples is the consensus median value (n = 70) for all methods (atomic absorption spectroscopy, ICP-MS, and inductively coupled plasma-optical emission spectroscopy).
Interference studies
Total bilirubin concentrations up to 184 µmol/L and triglyceride concentrations up to 8.89 mmol/L did not interfere with the measurement of either copper (accuracy: 93–105%) or zinc (accuracy: 95–109%), neither did the addition of nickel, iron, copper, or zinc (copper/zinc accuracy: 96–104%).
Method comparison
Serum
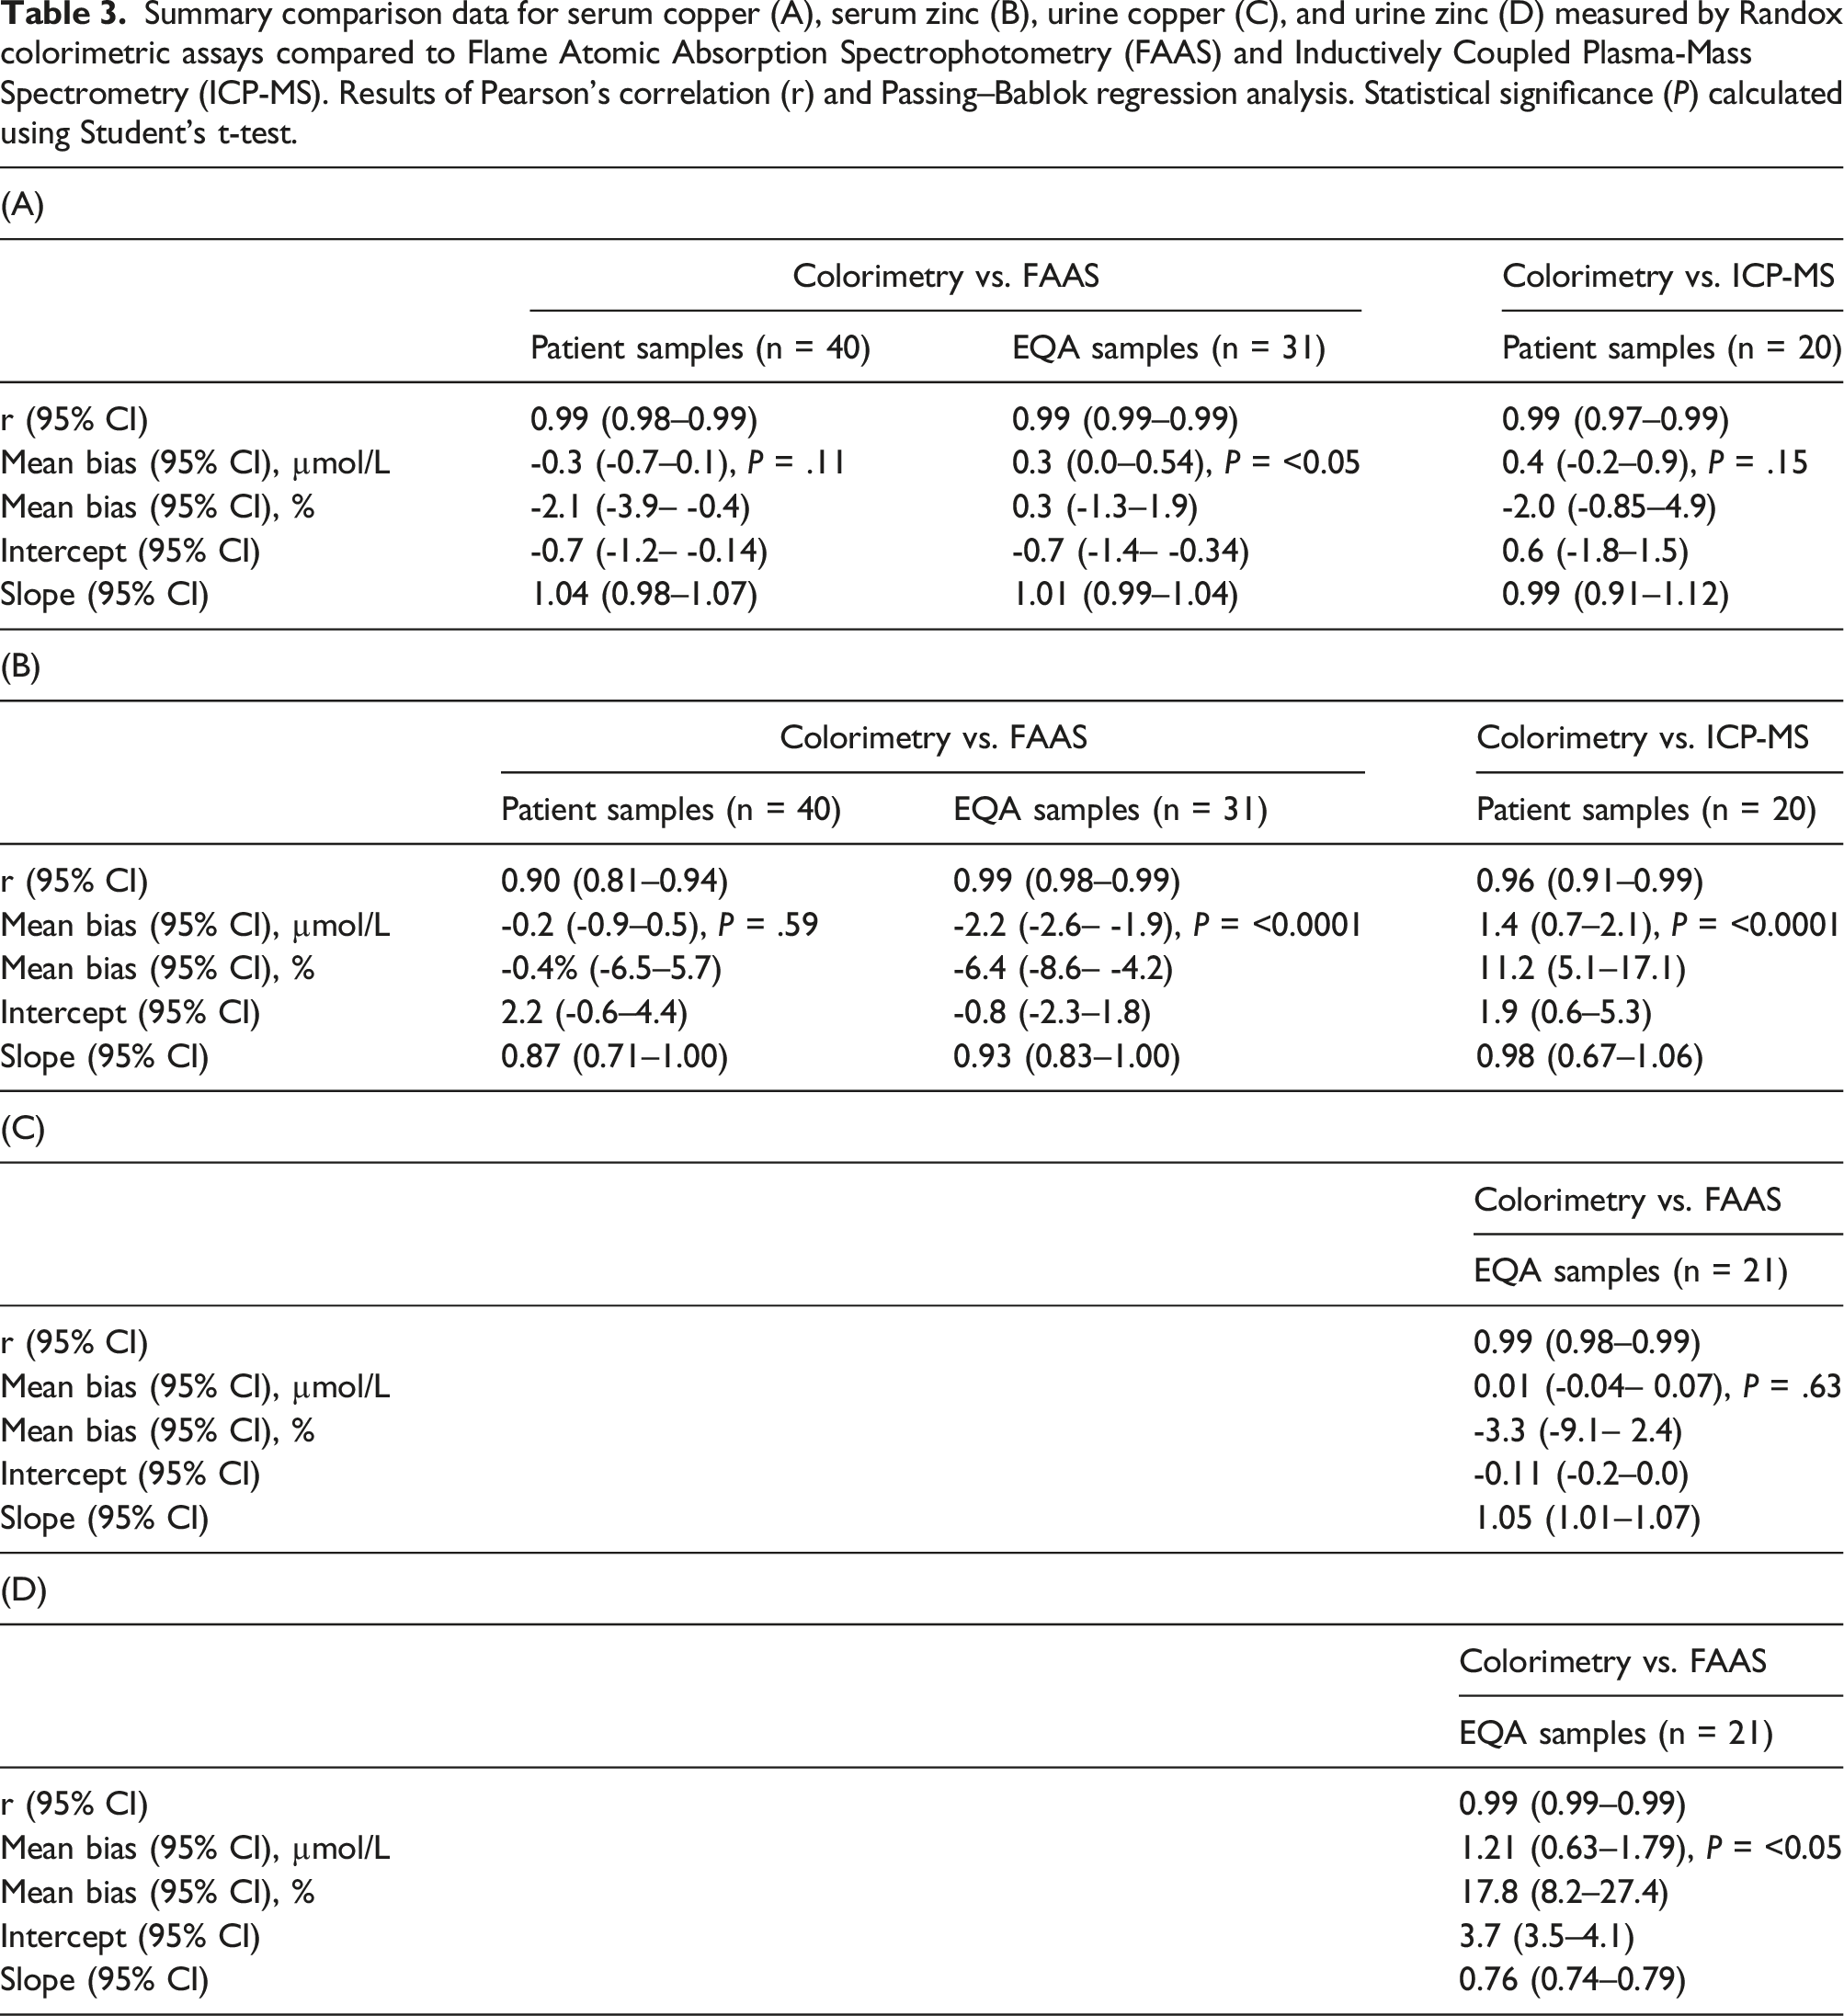
Summary comparison data for serum copper (A), serum zinc (B), urine copper (C), and urine zinc (D) measured by Randox colorimetric assays compared to Flame Atomic Absorption Spectrophotometry (FAAS) and Inductively Coupled Plasma-Mass Spectrometry (ICP-MS). Results of Pearson’s correlation (r) and Passing–Bablok regression analysis. Statistical significance (P) calculated using Student’s t-test.
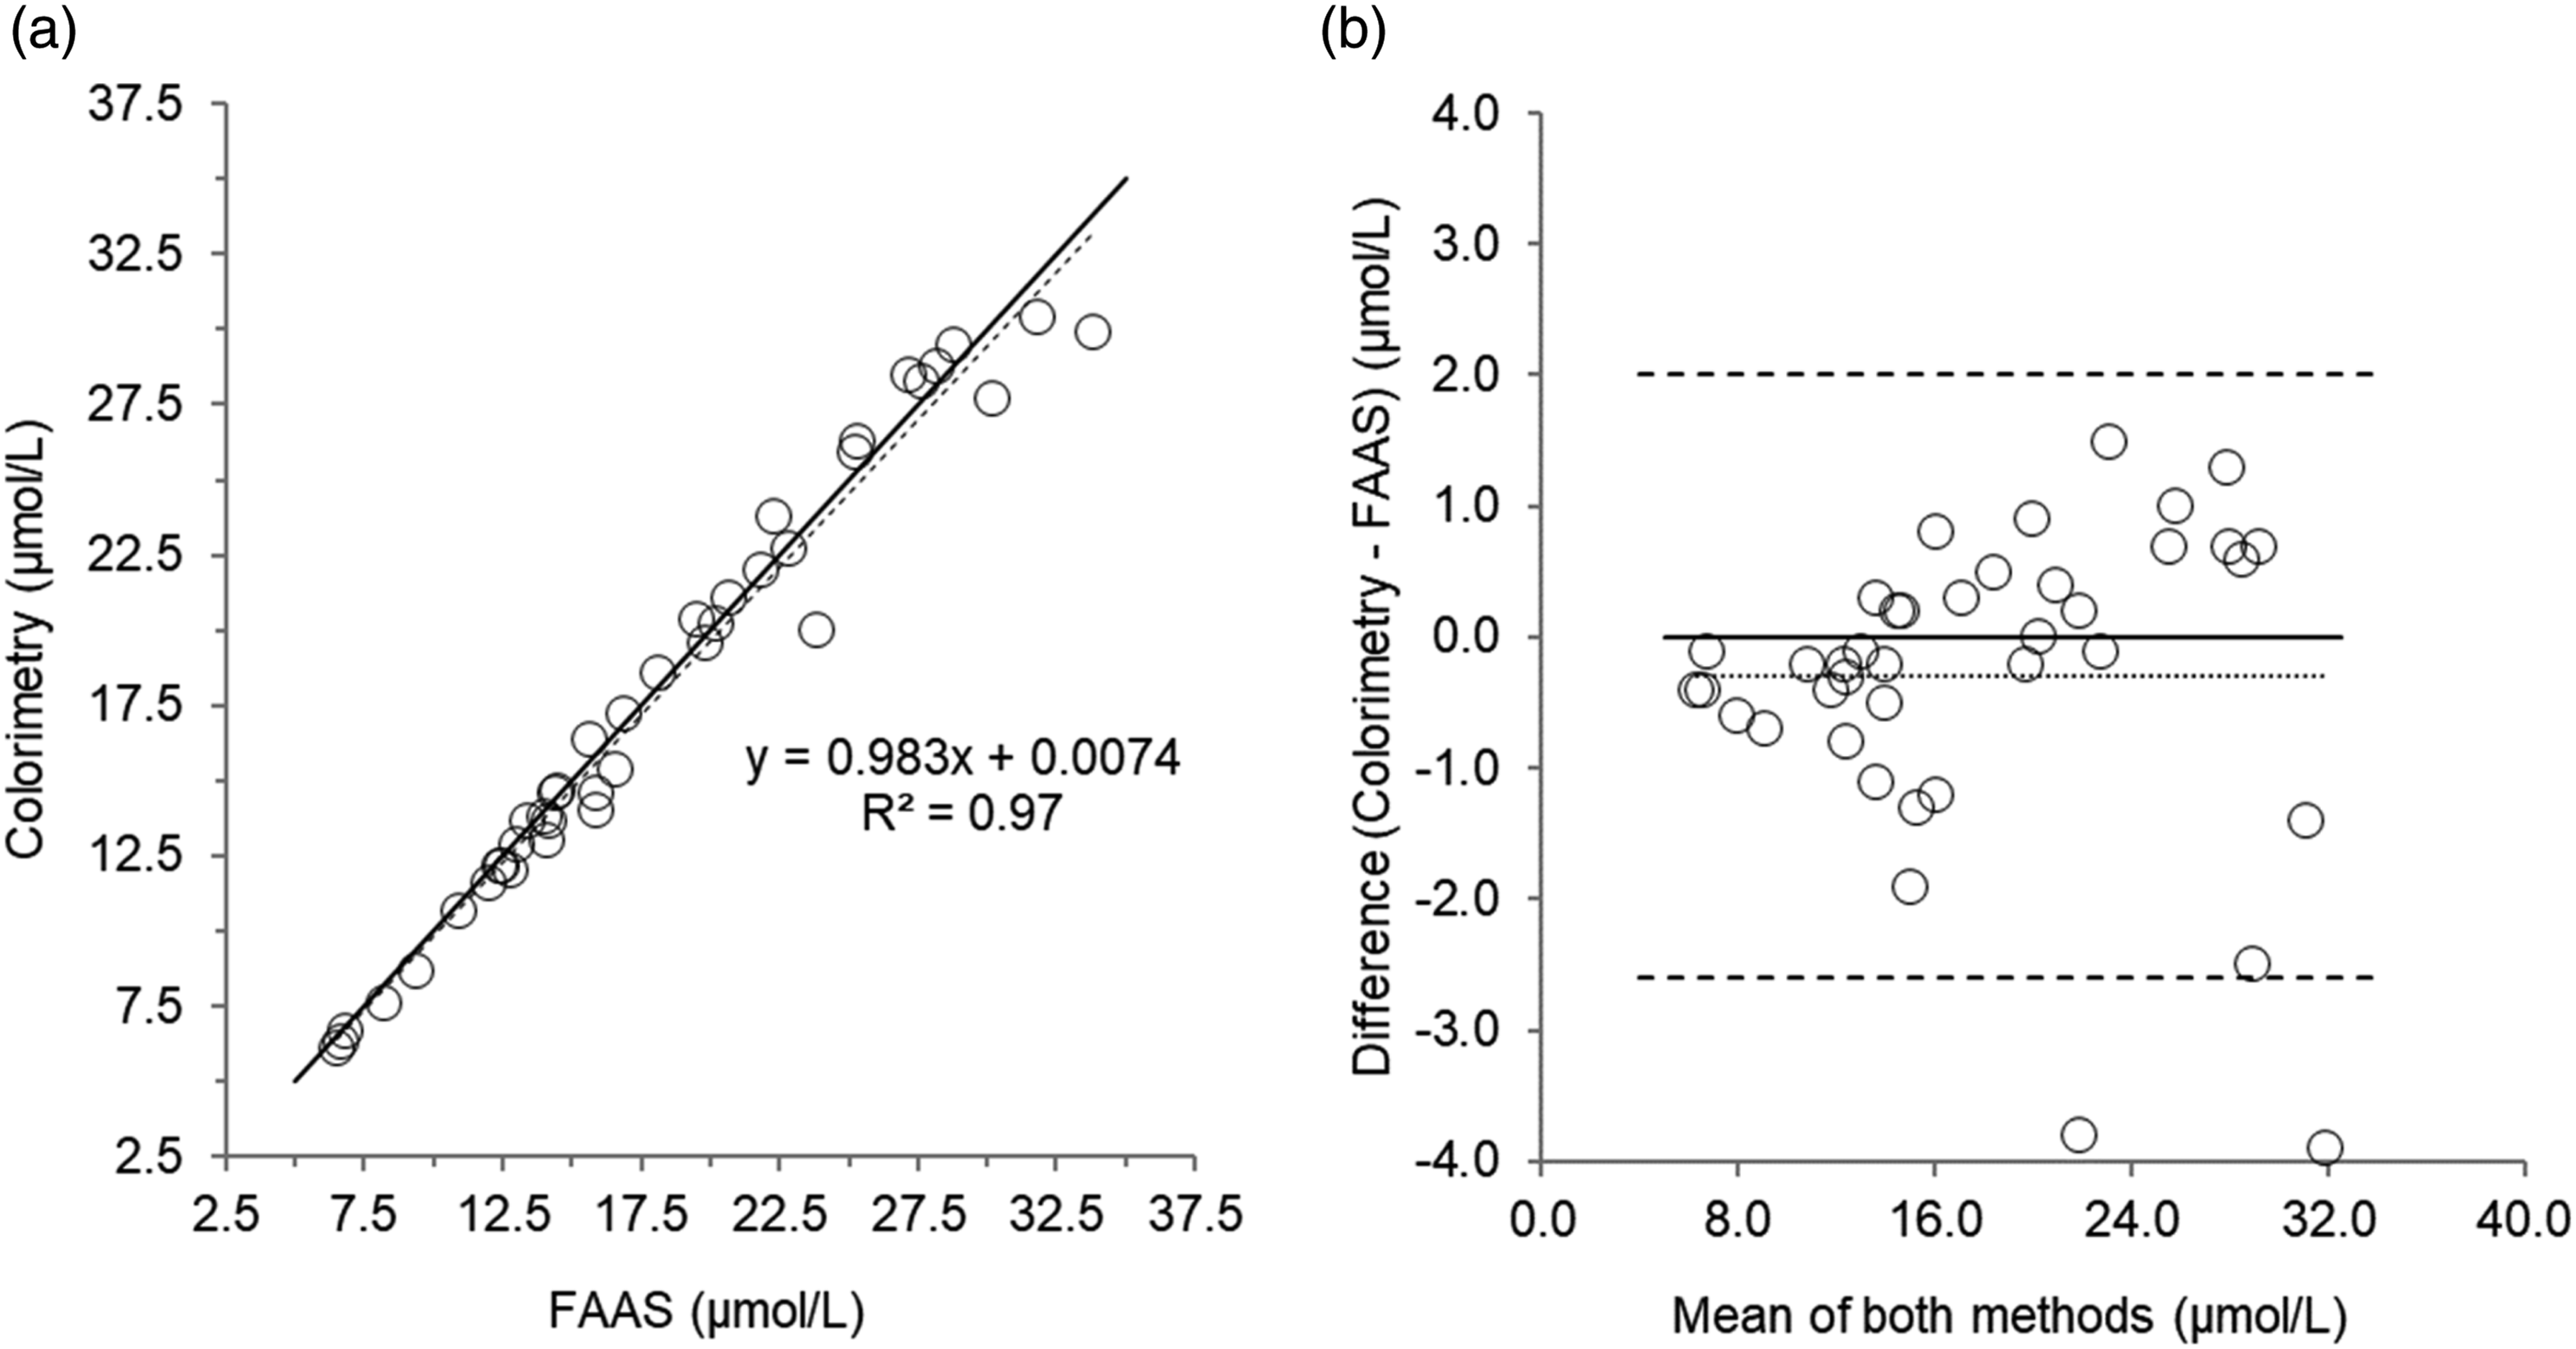
Scatterplot (a) and Bland–Altman plot (b) for serum copper measured by colorimetry compared to Flame Atomic Absorption Spectrophotometry (FAAS) in 40 patient’s samples. Scatterplot shows line of identity (solid line) and linear regression analysis (dashed line); Bland–Altman plot shows the line of identity (solid line) and the mean (95% limits of agreement) bias (dotted line and dashed lines, respectively). Mean bias (95% limits of agreement); -0.30 (2 to -2.6) µmol/L.
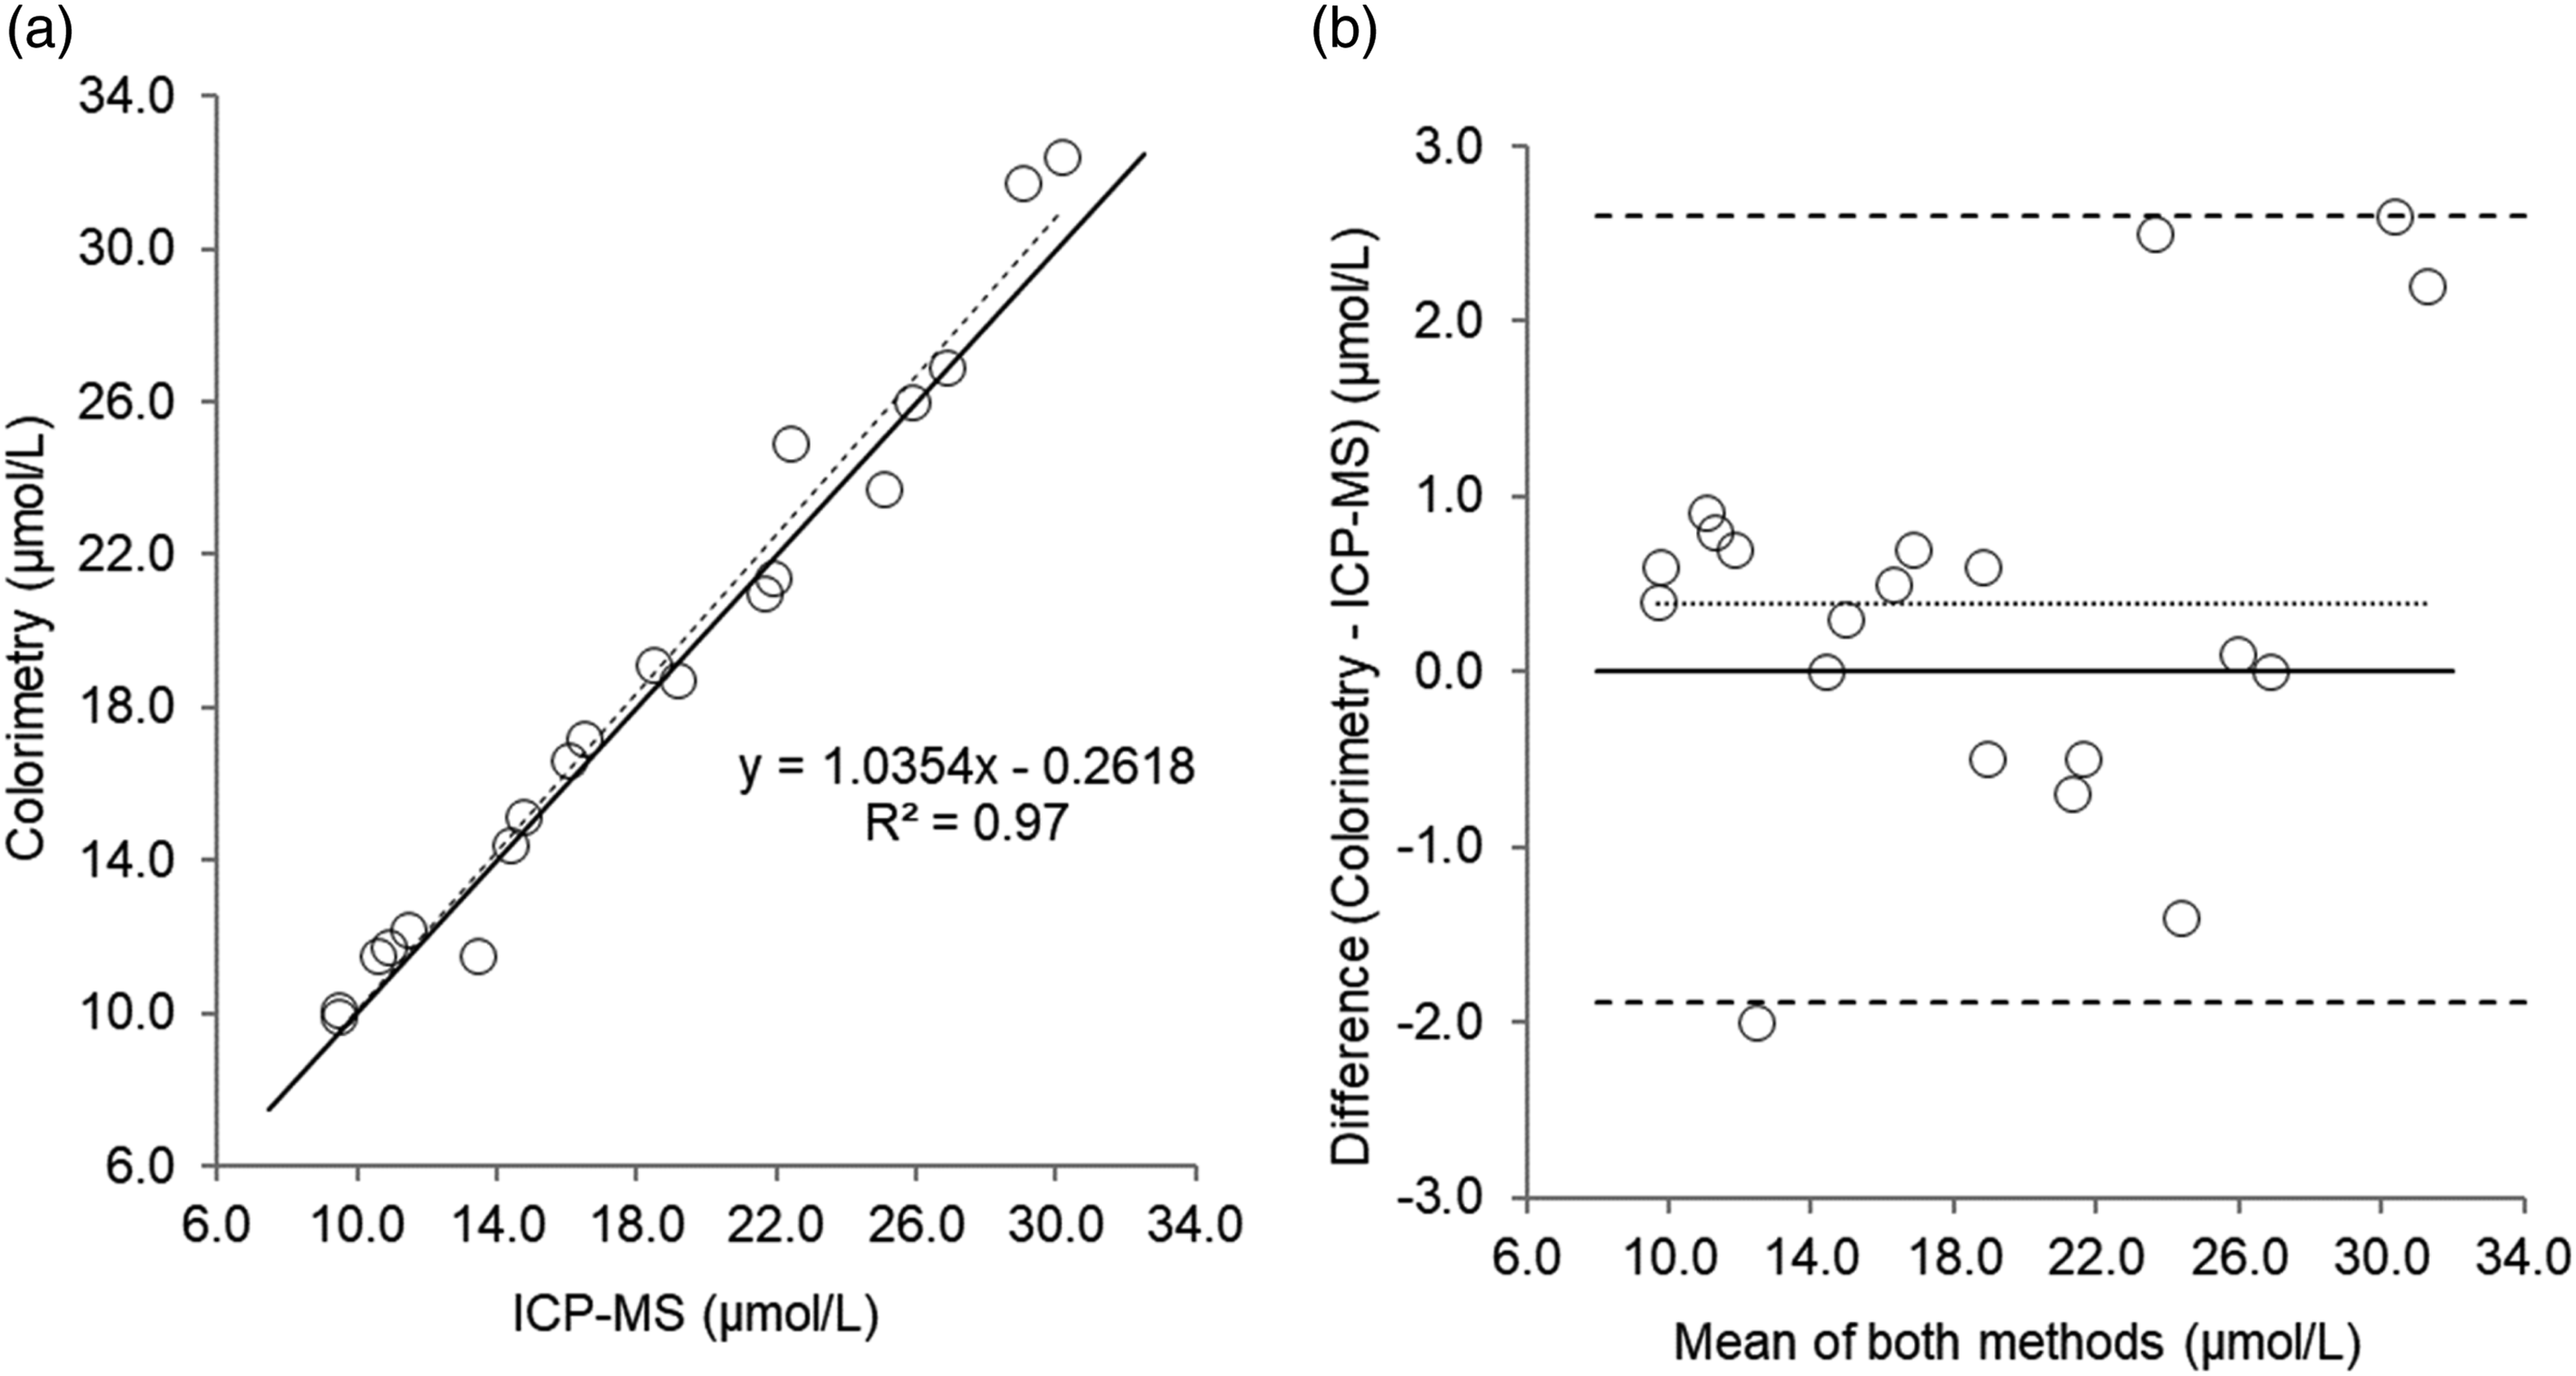
Scatterplot (a) and Bland–Altman plot (b) for serum copper measured by colorimetry compared to Inductively Coupled Plasma-Mass Spectrometry (ICP-MS) in 20 patient’s samples. Scatterplot shows line of identity (solid line) and linear regression analysis (dashed line); Bland–Altman plot shows the line of identity (solid line) and the mean (95% limits of agreement) bias (dotted line and dashed lines, respectively). Mean bias (95% limits of agreement); 0.40 (2.6 to -1.9) µmol/L.
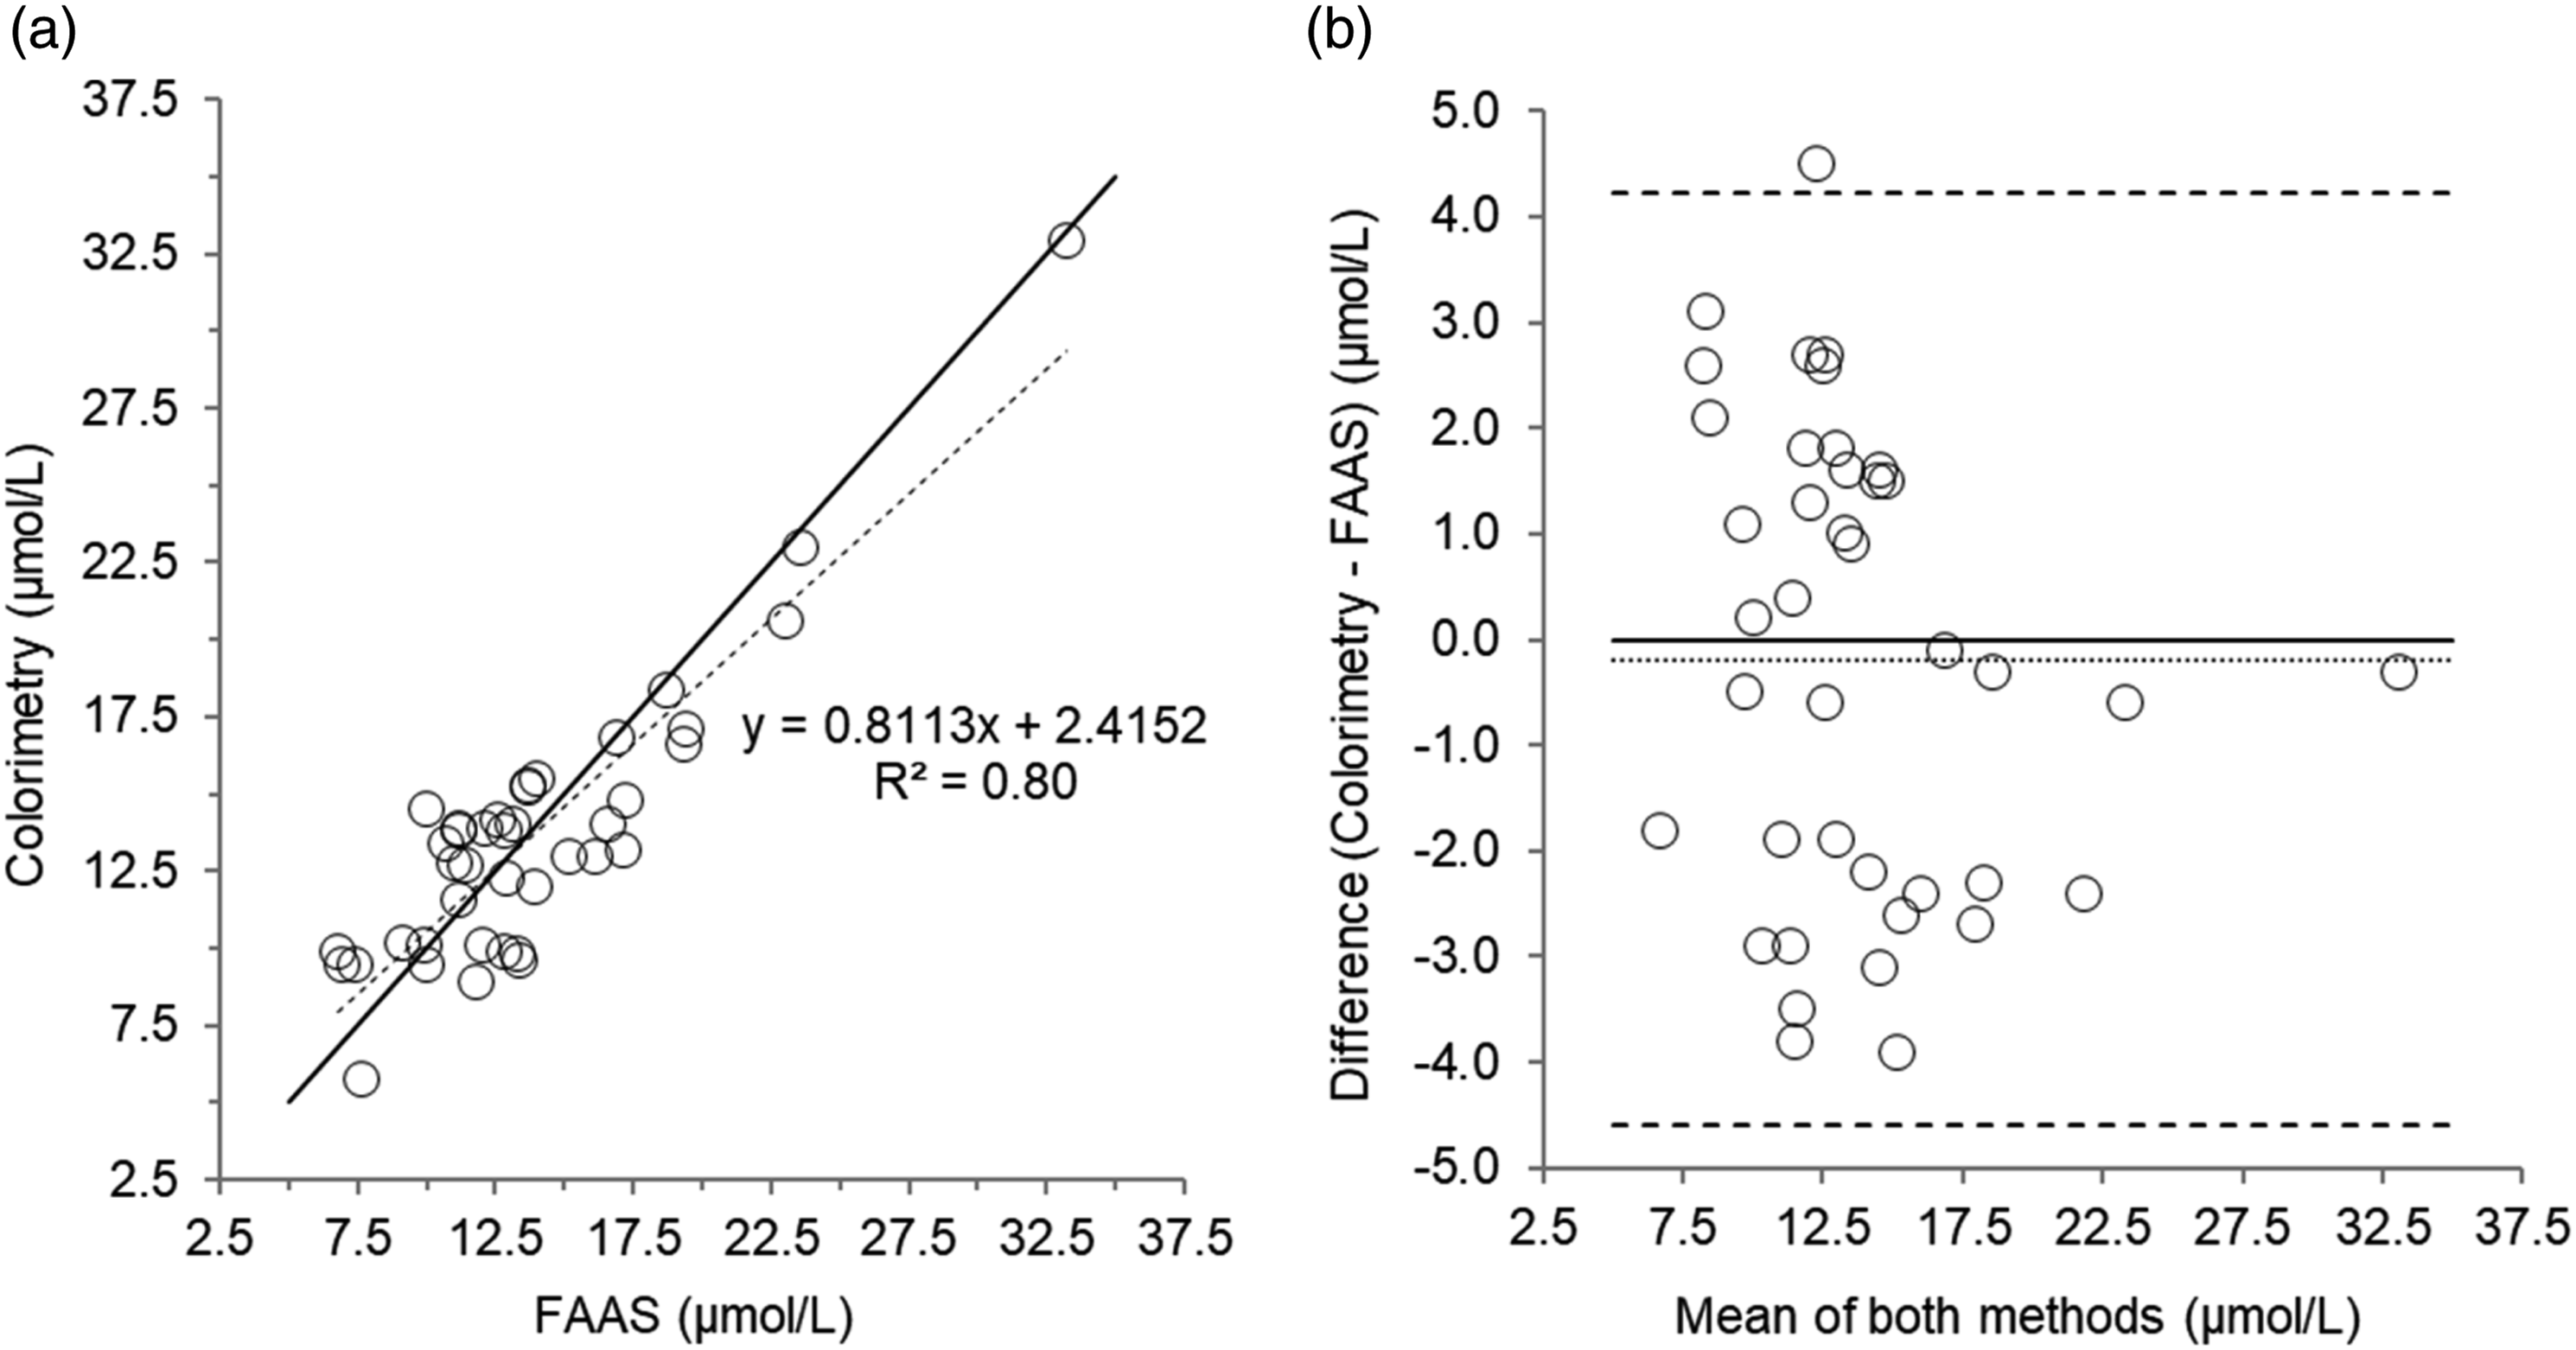
Scatterplot (a) and Bland–Altman plot (b) for serum zinc measured by colorimetry compared to Flame Atomic Absorption Spectrophotometry (FAAS) in 40 patient’s samples. Scatterplot shows line of identity (solid line) and linear regression analysis (dashed line); Bland–Altman plot shows the line of identity (solid line) and the mean (95% limits of agreement) bias (dotted line and dashed lines, respectively). Mean bias (95% limits of agreement); -0.20 (4.2 to -4.6) µmol/L.
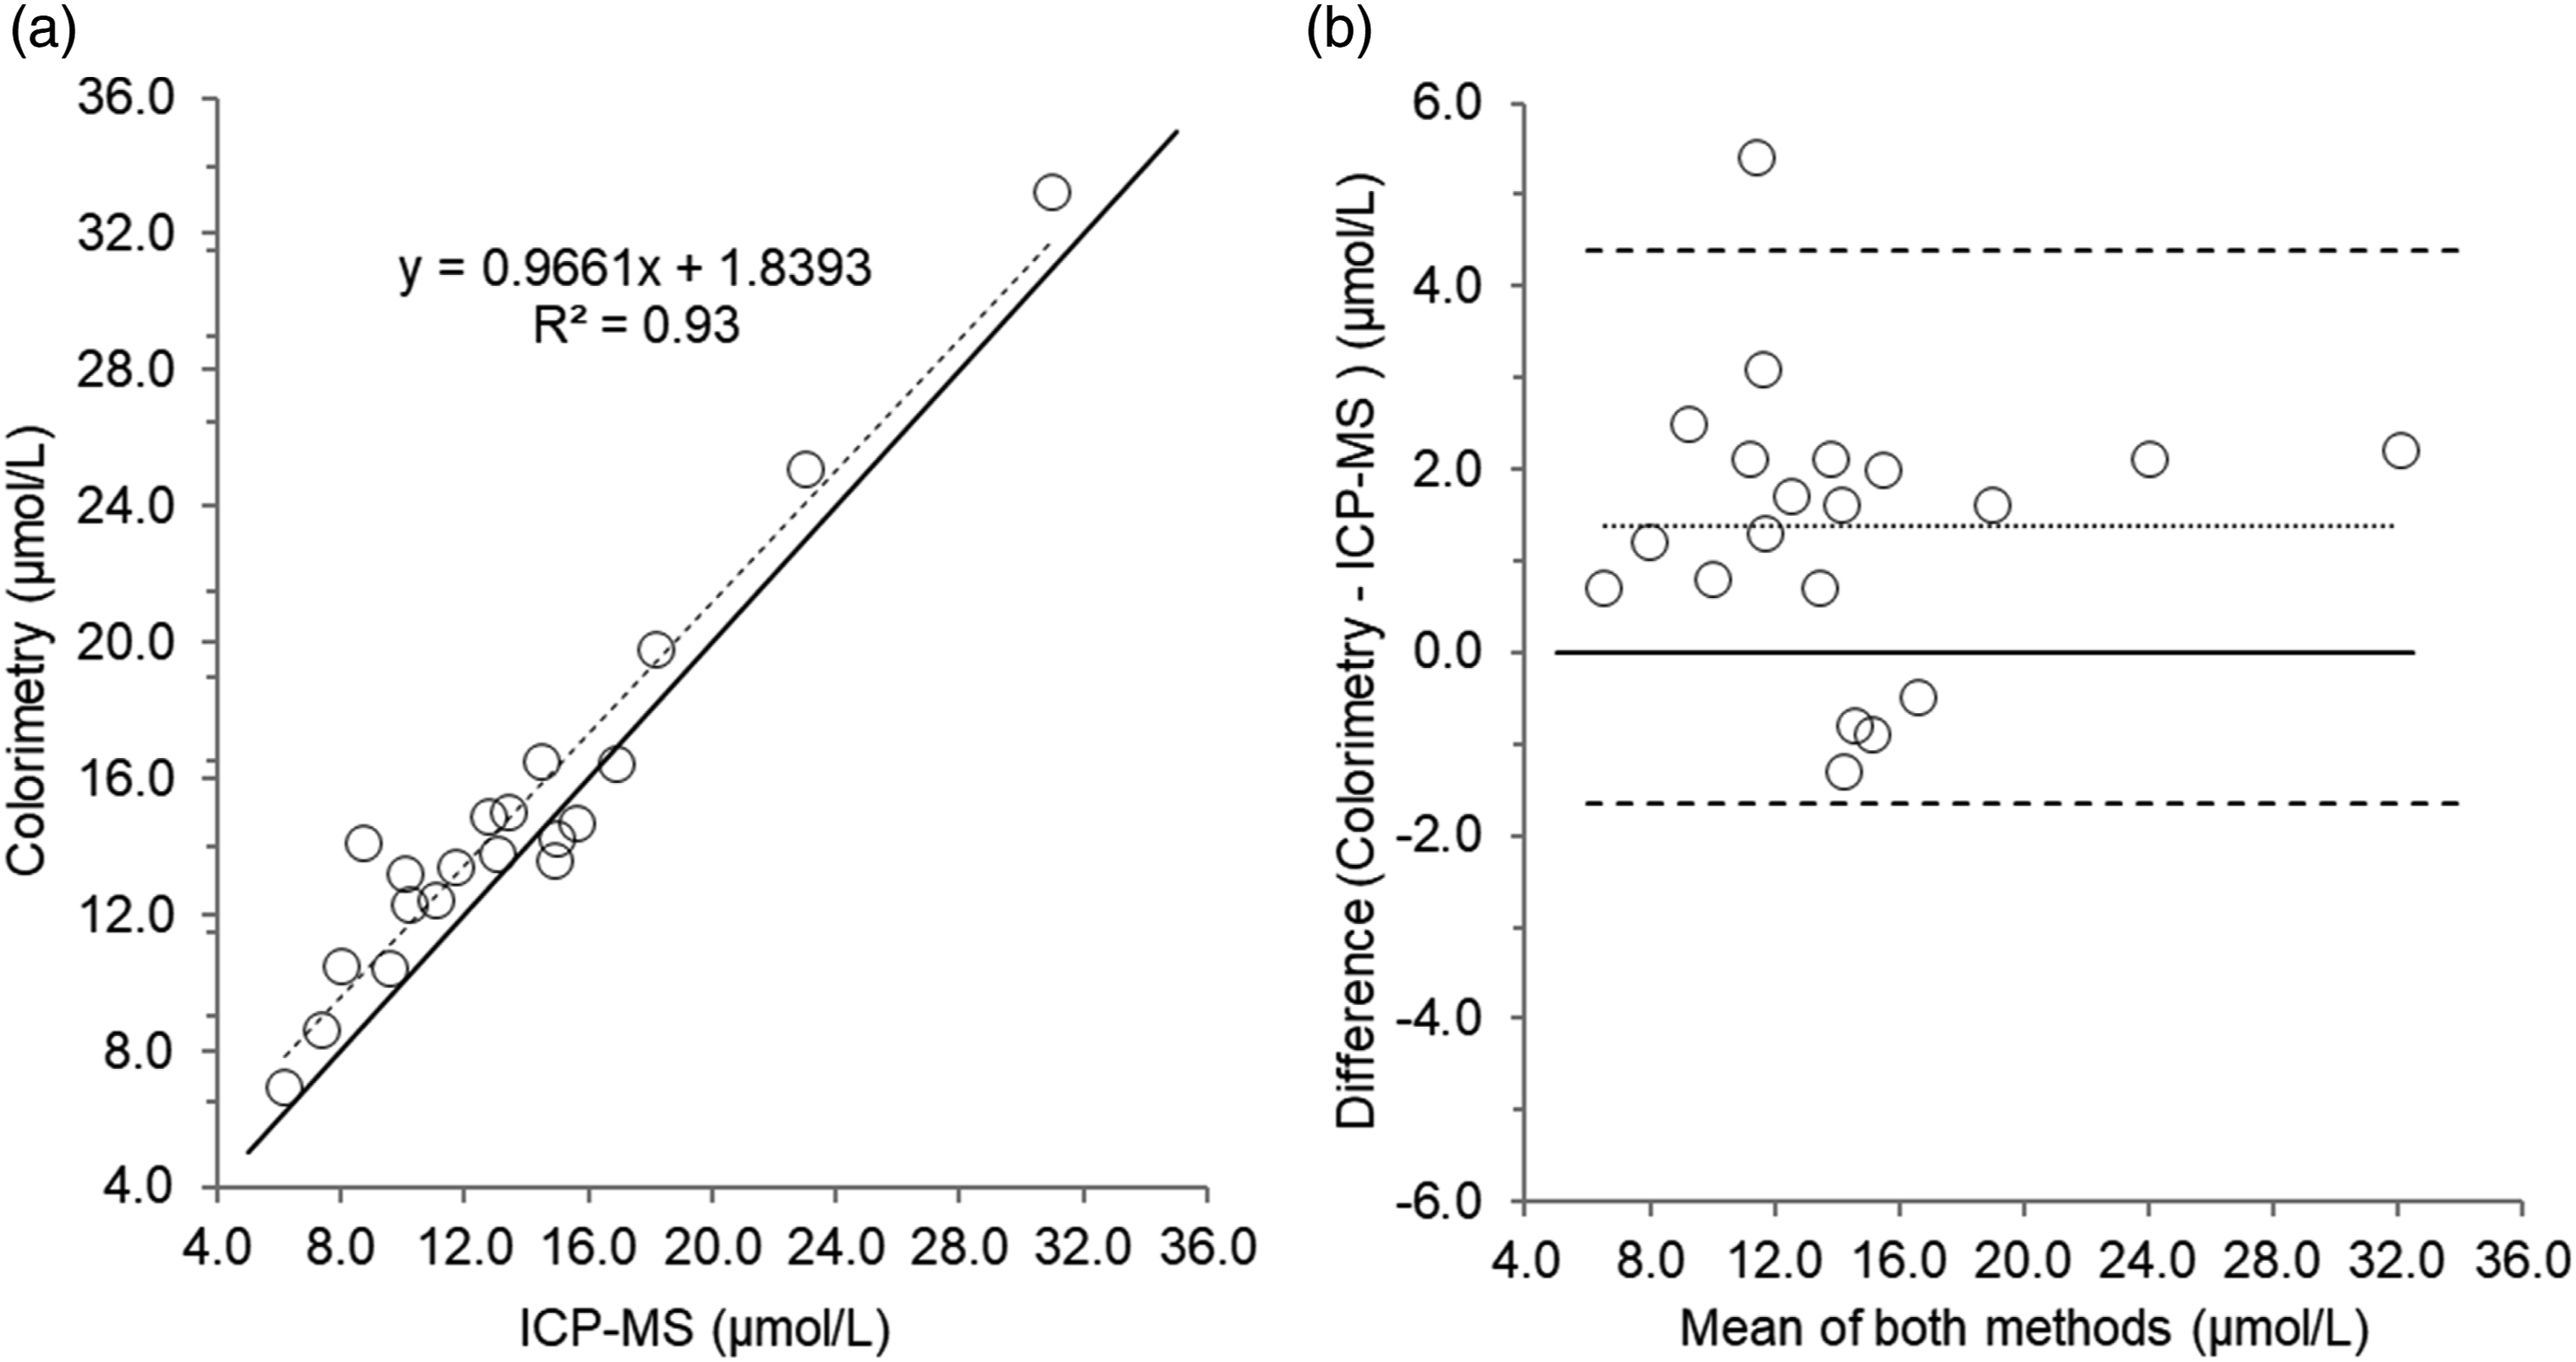
Scatterplot (a) and Bland–Altman plot (b) for serum zinc measured by colorimetry compared to Inductively Coupled Plasma-Mass Spectrometry (ICP-MS) in 20 patient’s samples. Scatterplot shows line of identity (solid line) and linear regression analysis (dashed line); Bland–Altman plot shows the line of identity (solid line) and the mean (95% limits of agreement) bias (dotted line and dashed lines, respectively). Mean bias (95% limits of agreement); 1.40 (4.4 to -1.7) µmol/L.
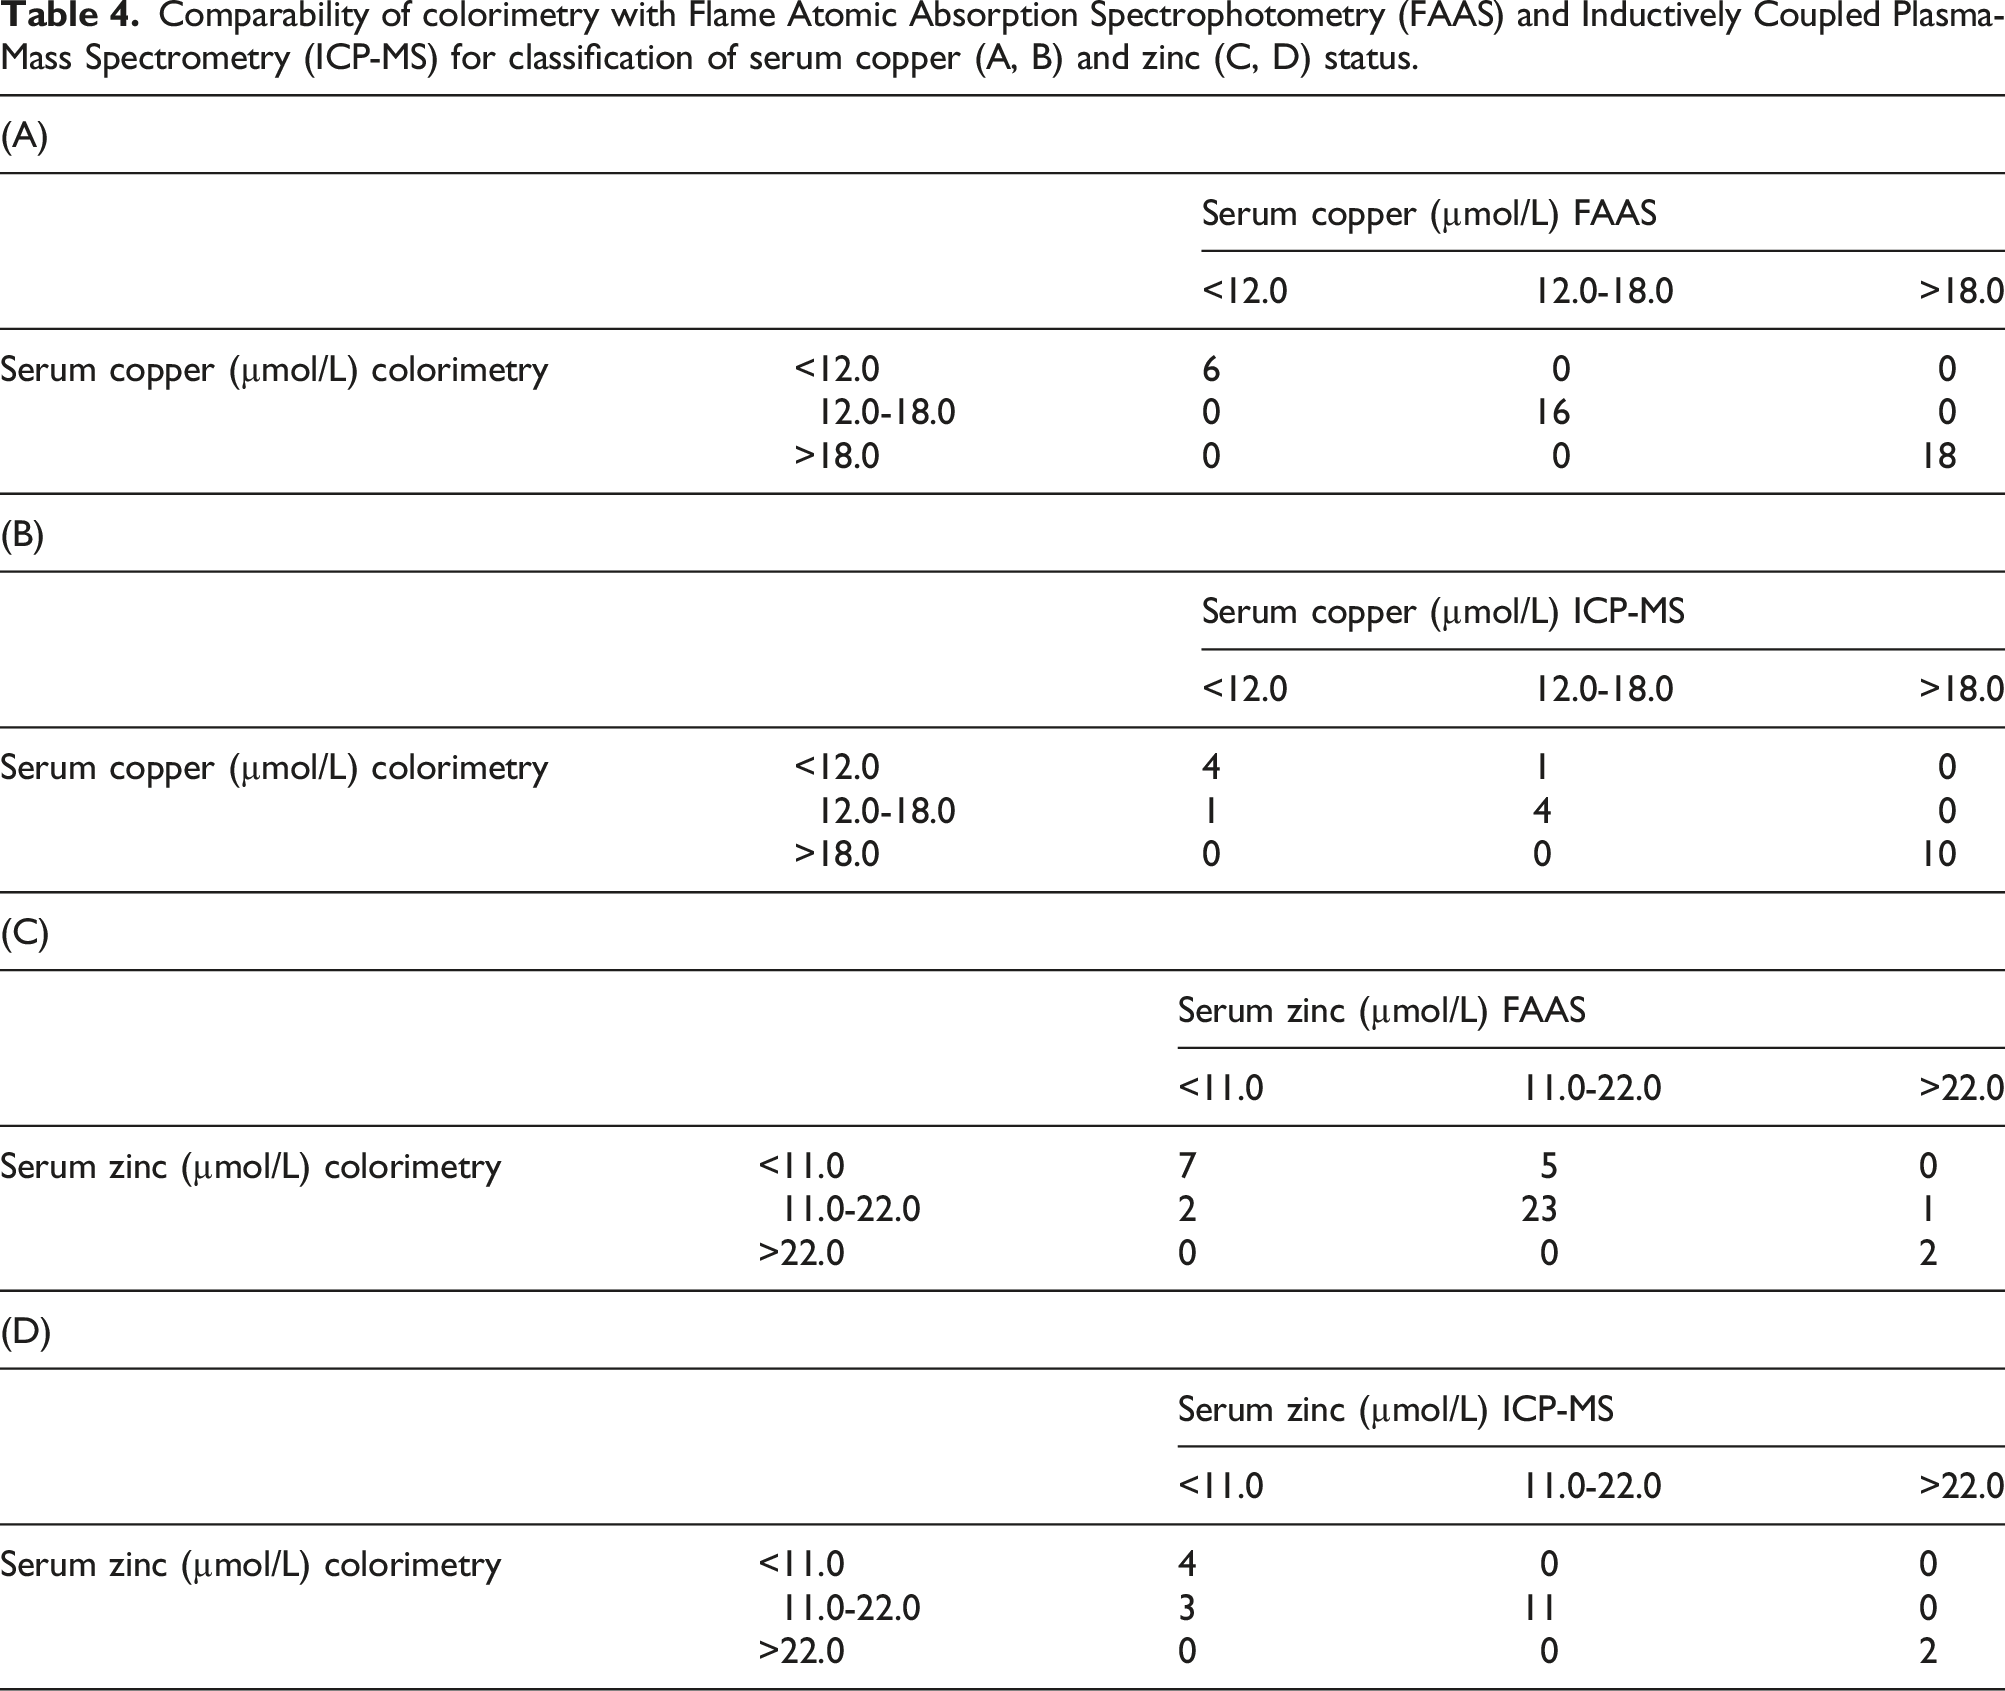
Comparability of colorimetry with Flame Atomic Absorption Spectrophotometry (FAAS) and Inductively Coupled Plasma-Mass Spectrometry (ICP-MS) for classification of serum copper (A, B) and zinc (C, D) status.
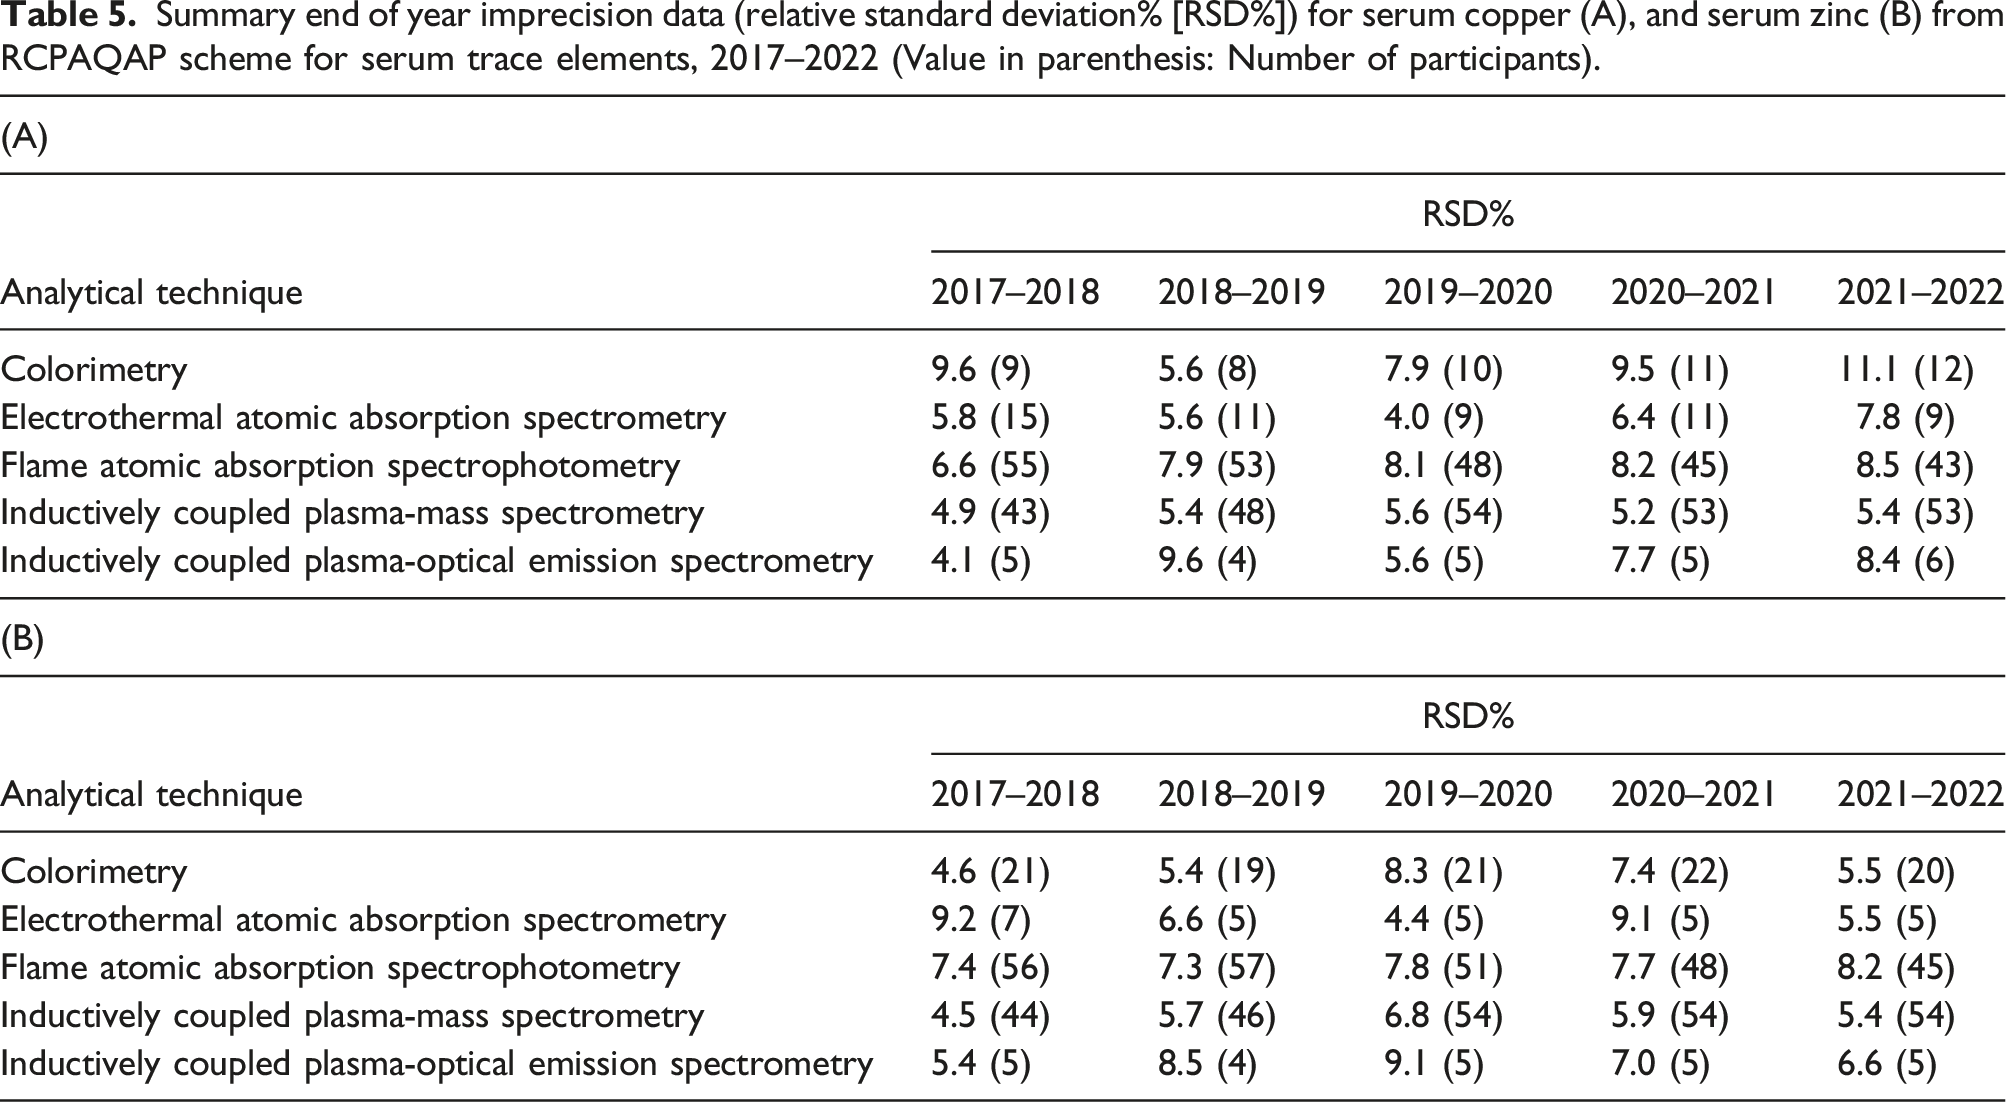
Summary end of year imprecision data (relative standard deviation% [RSD%]) for serum copper (A), and serum zinc (B) from RCPAQAP scheme for serum trace elements, 2017–2022 (Value in parenthesis: Number of participants).
Urine
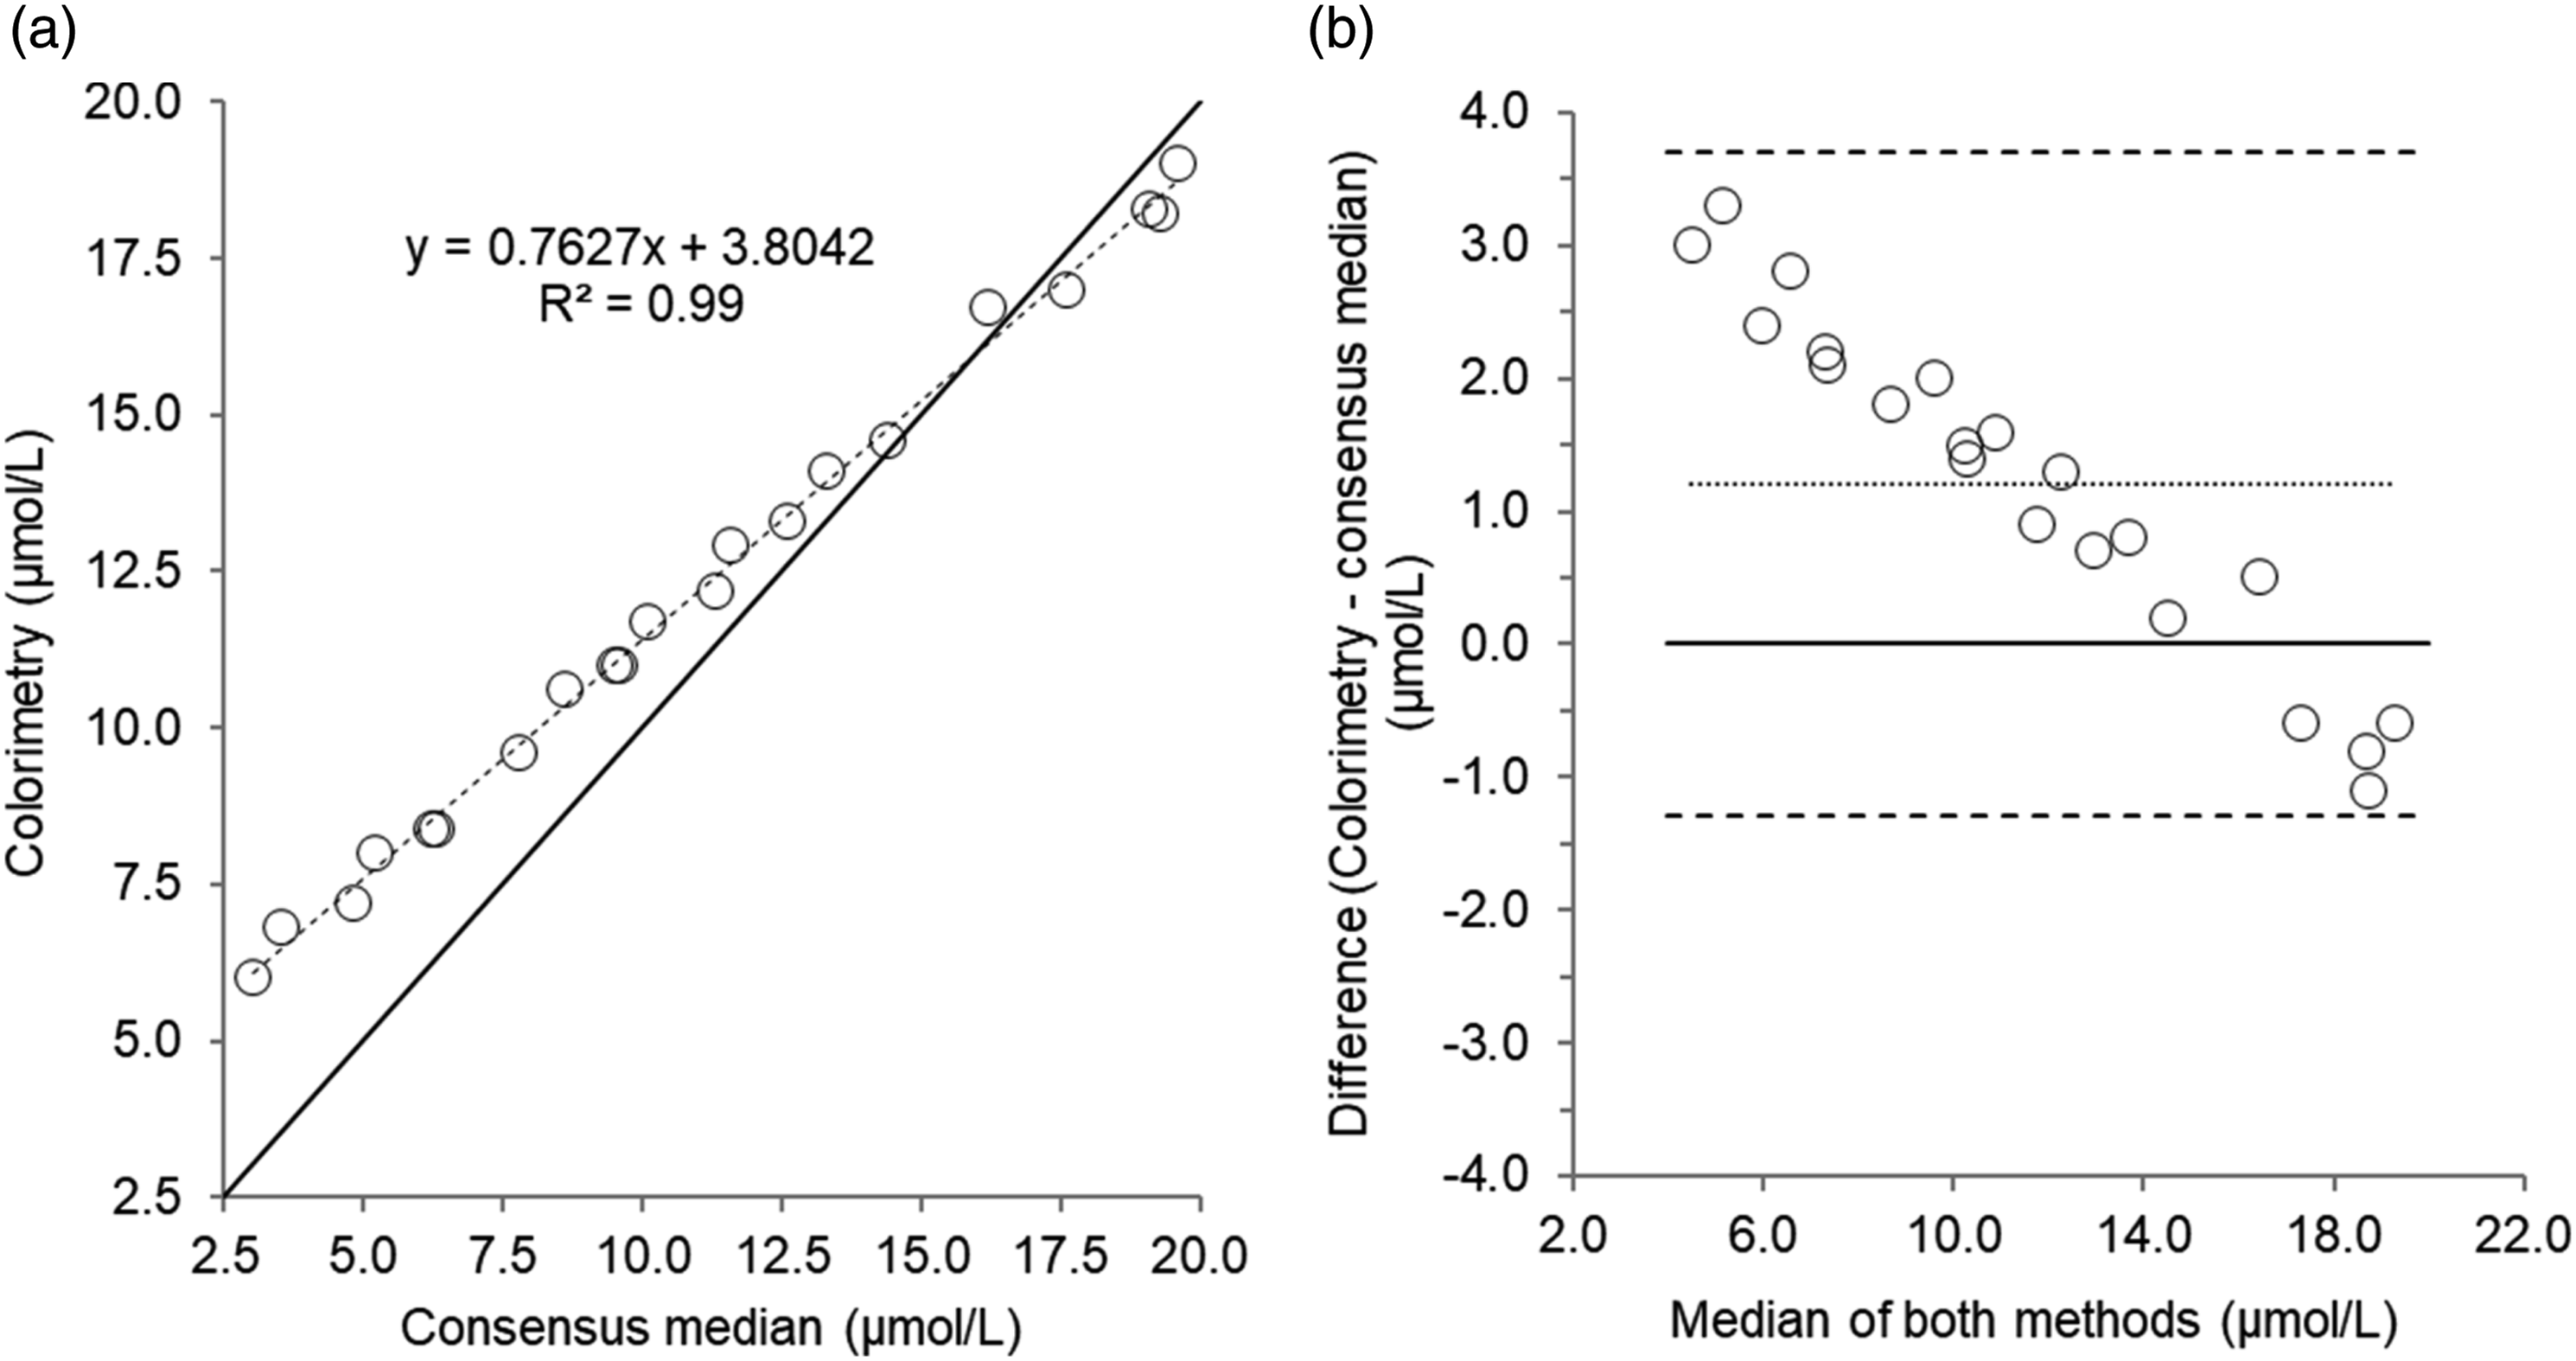
Twenty-one urine EQA samples were analysed. Results of comparison studies are provided in Table 3 and Figures 5 and 6. For urine copper in EQA samples, there was a good correlation and agreement between colorimetric and RCPAQAP consensus median values. Despite a good correlation for urine zinc measured by colorimetry and the RCPAQAP consensus median values, Passing–Bablok and Bland–Altman analysis identified a poor agreement and bias (1.21 µmol/L, P = <0.05). Scatterplot (a) and Bland–Altman plot (b) for urine copper measured by colorimetry compared to the consensus median values in 21 urine external quality assurance samples. Scatterplot shows line of identity (solid line) and linear regression analysis (dashed line); Bland–Altman plot shows the line of identity (solid line) and the mean (95% limits of agreement) bias (dotted line and dashed lines, respectively). Mean bias (95% limits of agreement); 0.01 (0.25 to -0.23) µmol/L. Scatterplot (a) and Bland–Altman plot (b) for urine zinc measured by colorimetry compared to the consensus median values in 21 urine external quality assurance samples. Scatterplot shows line of identity (solid line) and linear regression analysis (dashed line); Bland–Altman plot shows the line of identity (solid line) and the mean (95% limits of agreement) bias (dotted line and dashed lines, respectively). Mean bias (95% limits of agreement); 1.21 (3.71 to -1.29) µmol/L.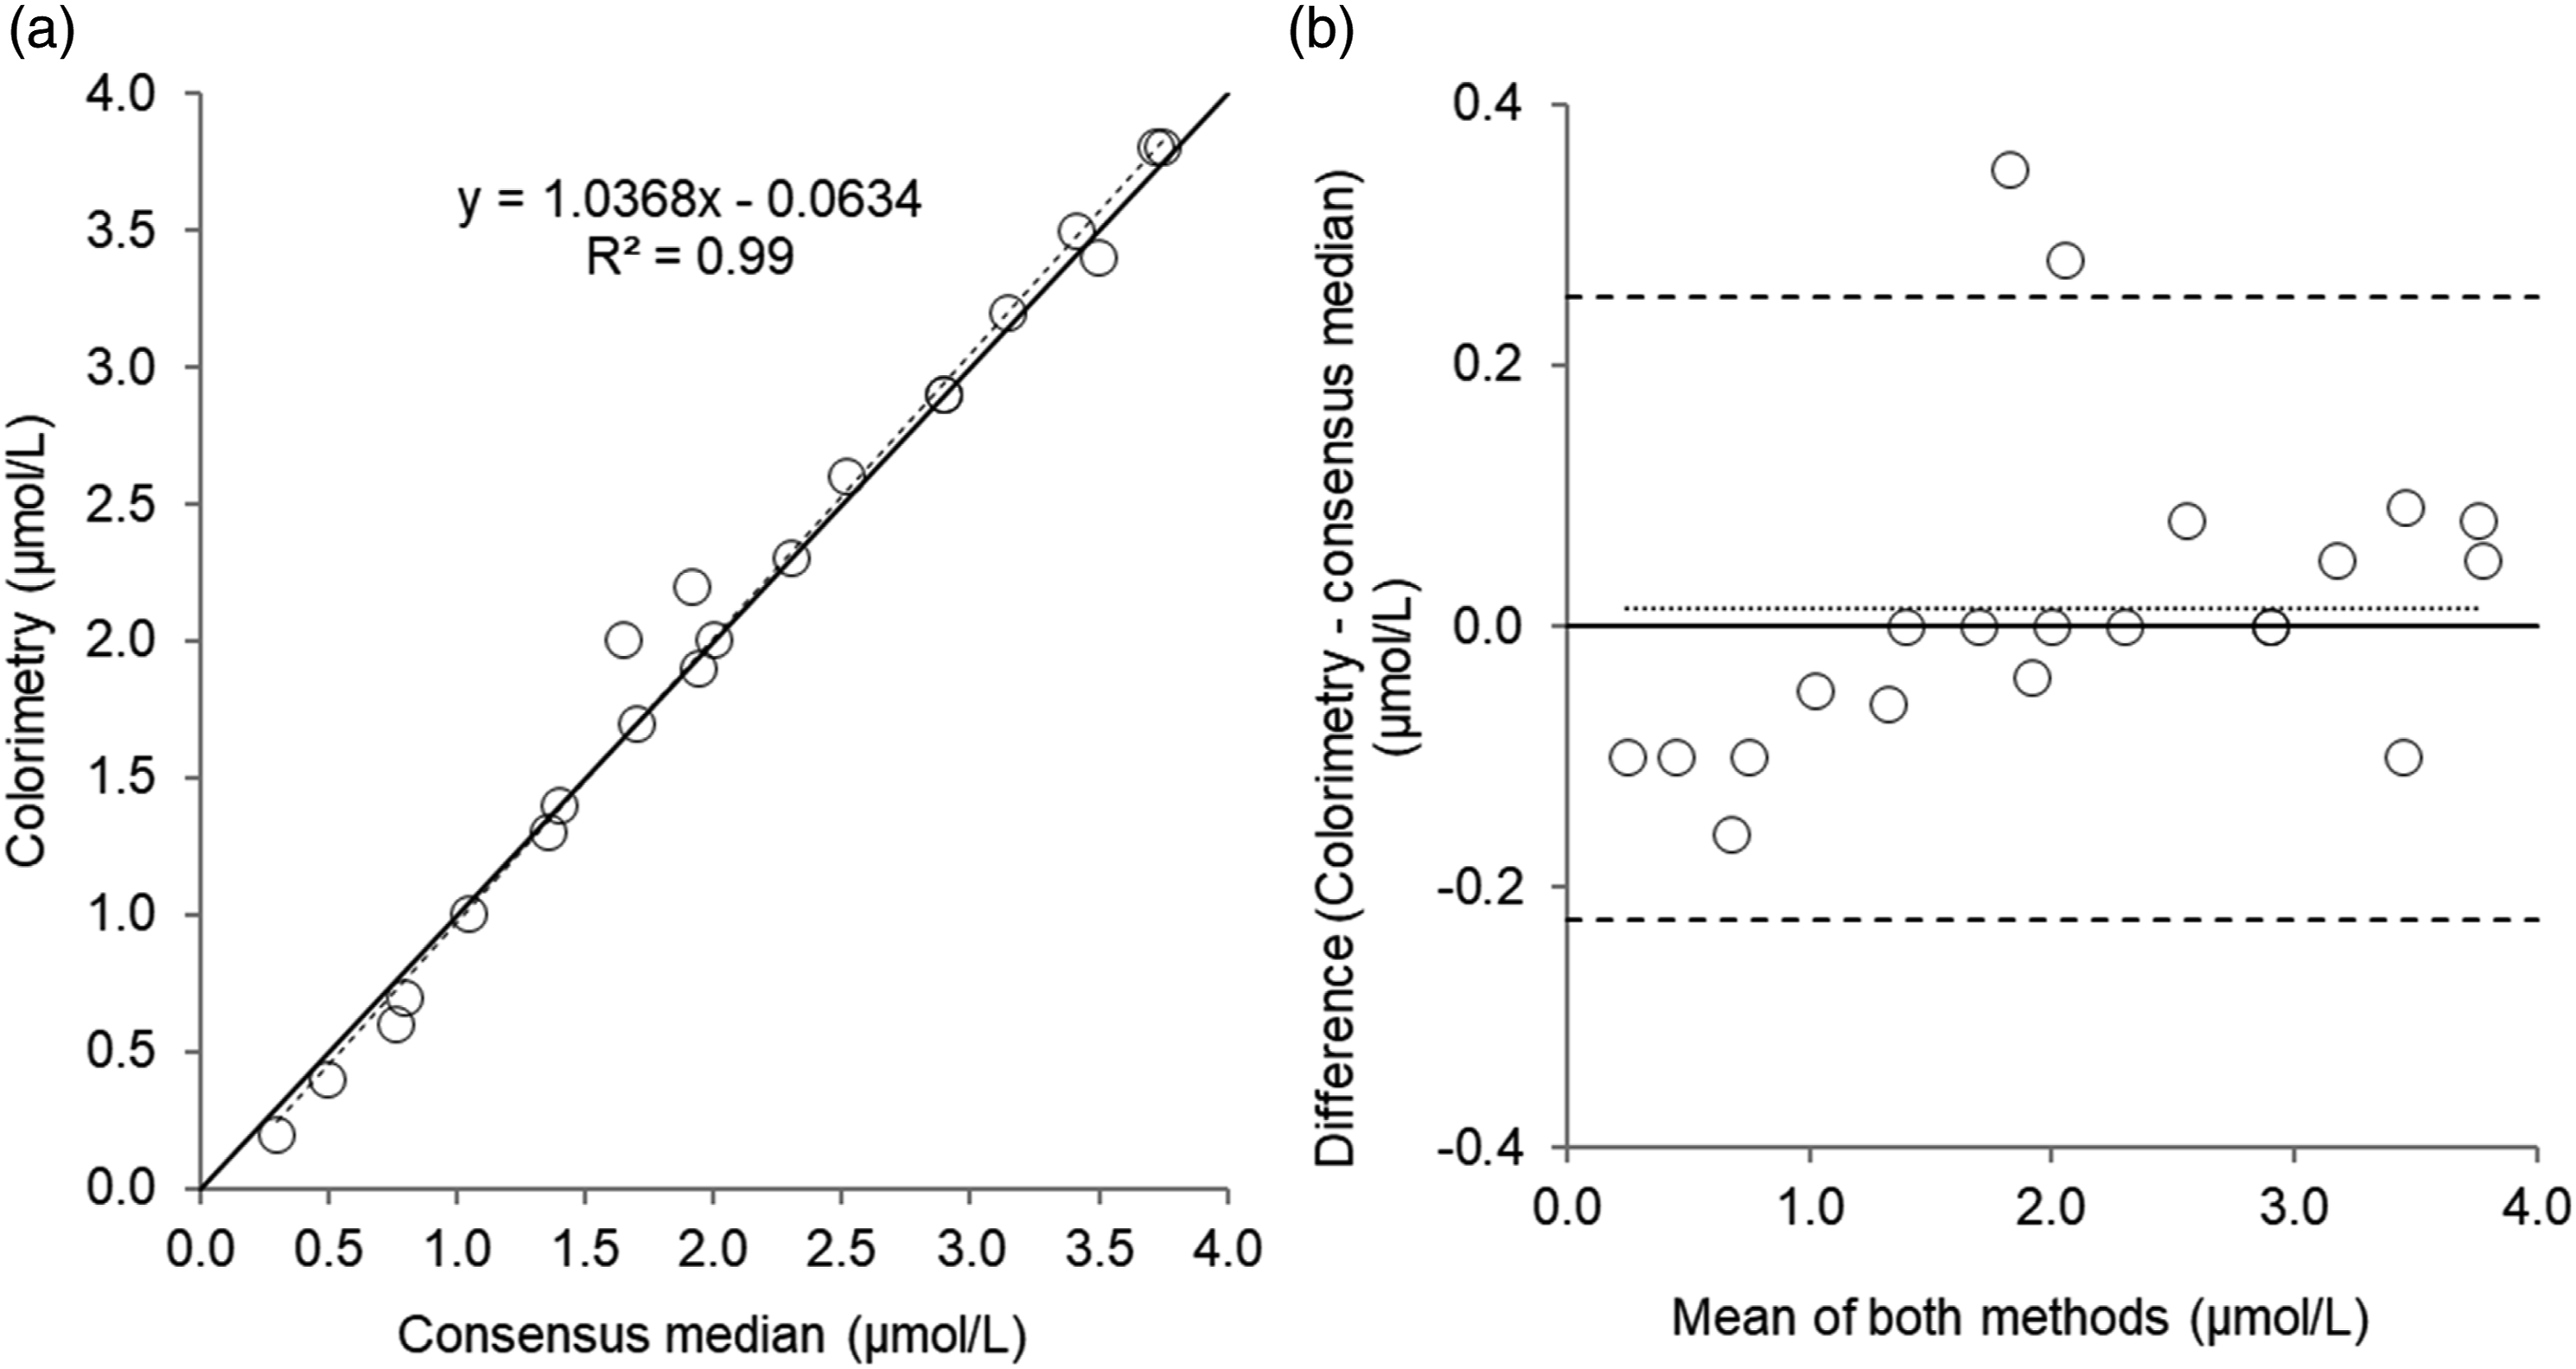
Discussion
We found the developed instrument parameters to provide acceptable accuracy and sensitivity for the routine measurement of serum copper in clinical samples. A good correlation and agreement were identified for copper in serum patient and EQA samples for colorimetry vs. FAAS. To date, a comparison of serum copper measured by colorimetry and ICP-MS has not been published, and in this study, we found a good agreement between these methods. Furthermore, there was good comparability between methods in assessing copper status. Although intra- and inter-assay imprecision for serum copper was deemed acceptable, we used acceptance criteria from Bioanalytical Method Validation Guidelines 11 which is likely to be too broad for clinical purposes, instead, analytical performance specifications using biological variation data may be more appropriate. 13 The values obtained here are greater than those stated by other investigators (3.5 and 5.4%, respectively), 6 which may be due to different analysers used. Furthermore, both intra- and inter-assay imprecision only meets the desirable (3.8%) and minimum (5.6%) analytical performance specifications suggested by the European Federation of Clinical Chemistry and Laboratory Medicine (EFLM) 13 based on biological variation data for IQC and patient samples. However, the intra-assay imprecision for the EQA material is outside of the minimum requirements, and intra-assay imprecision is markedly greater for EQA samples than IQC or patient samples. Furthermore, for EQA material, intra-assay imprecision is far worse than inter-assay imprecision, which is an unusual finding. Matrix effects maybe the cause of the results, and we did not investigate the imprecision of other QAP samples. It is advisable for laboratories to make their own assessments as to whether the imprecision data presented here meets the need of the service they provide. There was also some variability at concentrations above the target range, but this is likely to have minimal clinical significance.
For serum zinc, accuracy and sensitivity were acceptable, and although imprecision was deemed acceptable and broadly comparable to those published by other investigators, 6 the values obtained were outside of the desirable (4.3%) and minimum (6.4%) analytical performance specifications suggested by the EFLM and unlikely to be acceptable for clinical use. As with copper in the EQA material, intra-assay imprecision is far worse than inter-assay imprecision and matrix effects may be a cause. Although there was a positive correlation between colorimetry and FAAS for serum zinc, there was considerable variability in the measured concentration and random error, which would be unacceptable for clinical use – as indicated by the lack of comparability between methods in assessing zinc status (Table 4). Interestingly, there was a better agreement between colorimetry and ICP-MS but still considerable variability which would be unacceptable. The poor agreement between colorimetry and FAAS reported here has also been identified by other investigators, 6 who in-part attributed it to the use of an aqueous calibration solution provided with the kit. Indeed, the manufacturer recommends against using the supplied aqueous calibrator but instead a matrix matched human serum calibration solution should be used. However, we did not investigate the aqueous calibration solution provided, and still found that a matrix-matched, human serum calibrator did not improve agreement between methods – a comparable finding to other investigators. 8
We achieved a similar linear range for serum copper and zinc to other investigators who were using large Roche Cobas 8000 analysers (copper: 4.08–33.8 µmol/L, zinc: 1.15–34.7 µmol/L).9,10 With regards to the upper limit of quantitation, Randox states values of 158 and 459 µmol/L, for copper and zinc, respectively, on the Thermo Scientific Konelab 20. Given such high concentrations are not present in human serum, we did not investigate this claim on the Optilite.
Imprecision data for serum copper and zinc from the RCPAQAP scheme for serum trace elements was available for a 5-year period (2017–2022; Table 5). Colorimetry performance was broadly comparable to FAAS for serum copper, except for two years (2017–2018, and 2021–2022) where colorimetric performance was markedly worse than FAAS; similar data was found by other investigators. 14 Again performance for serum zinc by colorimetry was broadly comparable to that by FAAS. It is important to note that the relatively few participants using colorimetric methods compared to FAAS and ICP-MS may influence the apparent imprecision, and also the matrix used for preparation of external quality samples is bovine serum, and therefore not directly comparable to human serum. Nonetheless, it allows some comparisons to be made between methodologies. Unfortunately, data on instrumentation, reagents, or calibrators (i.e. commercial or prepared in-house) was not available for any analytical technique. Therefore, the impact of different instrumentation or calibrators cannot be ascertained.
For urine copper, there was a good agreement and correlation between colorimetry and the median consensus values from EQA samples, and overall performance was promising. However, we did not investigate the assay any further as requests for urine copper are minimal in our institution and there was a lack of patient urine samples for method comparison. With regards to urine zinc, accuracy and imprecision were unacceptable, and agreement with the median consensus values from EQA samples was poor. The cause of this poor performance in part, could be due to contamination, interference from endogenous compounds, or inappropriate instrument parameters or calibration material. However, this was not investigated further as measurement of urine zinc is infrequently requested and is of limited clinical value. Subsequently, the use of colorimetry for urine zinc is deemed unsuitable.
A concern with the use of colorimetric assays for serum copper and zinc is potential interference from lipids, bilirubin, proteins in the sample, or from haemoglobin. 5 Deproteinisation of the sample with aqueous trichloroacetic acid and analysis of the resulting supernatant helps limit the potential impact of some of these concerns, and we did not identify any deleterious effects of high bilirubin or triglyceride concentrations on serum copper or zinc measurements. However, it would be advisable for laboratories to be cautious of measuring copper or zinc in samples with excessive lipid or bilirubin concentrations, and measurement of these parameters beforehand to exclude inappropriate samples should be undertaken. We did not investigate potential interference from haemoglobin, as zinc, in-particular, is located within erythrocytes and haemolysis would falsely elevate serum zinc concentrations. Therefore, the presence of haemolysis would exclude the measurement of serum copper or zinc. Furthermore, we did not observe interference from divalent cations (iron, nickel) investigated on either copper or zinc assays at concentrations greater than what they are present in human serum. This is of especial concern for the zinc assay, as the reagents contain trisodium citrate, dimethylglyoxime, and salicylaldoxine to mask reactions with iron, copper, and nickel. 5 With regards to interfering substances for the colorimetric urine copper assay, the manufacturer reports no interference from uric acid, glutathione, or D-penicillamine at concentrations of up to 250, 200, and 100 mg/L, respectively – the later compound being of importance in urine samples from patients suspected of having Wilson disease and having undergone a D-penicillamine challenge.
As to limitations of the study, trace element-free whole blood collection tubes were not used for the collection of patients’ samples, therefore, copper and zinc contamination may have been present. However, samples analysed by colorimetric, FAAS, and ICP-MS methods would have all been subject to the same degree of contamination. Furthermore, plasticware (e.g. microcentrifuge) tubes could be a source of contamination for both copper and zinc, but all were thoroughly washed with aqueous nitric acid to reduce the impact of any potential contamination. We also did not ascertain inter- or intra-assay accuracy or imprecision data for serum copper at concentrations below the target range, and for serum zinc, the concentration investigated was marginally below the target range. However, patients’ samples used for comparison studies did cover a wider range of clinically relevant concentrations.
For both serum assays, analysis time on the Optilite was short, with a result available within 5 minutes of loading the supernatant onto the analyser. Furthermore, assay calibration was stable for 61 days as indicated by IQC results being within RCPAQAP analytical performance specifications, allowing savings in terms of reduced reagent consumption and analysis time.
Conclusions
The Randox colorimetric assay for serum copper compares well with FAAS and ICP-MS assays. Due to poor agreement with FAAS and ICP-MS, the Randox colorimetric assay for serum zinc is not suitable for use. The Randox colorimetric assay for urine copper requires further investigation, especially comparison studies using patients’ urine samples, while the urine zinc assay is unsuitable for routine clinical use.
Supplemental material
Supplemental Material - Validation of the Randox colorimetric assays for serum copper and zinc
Supplemental Material for Validation of the Randox colorimetric assays for serum copper and zinc by Simon A Handley, Troy Wanandy, and Louise Prentice in Annals of Clinical Biochemistry.
Footnotes
Acknowledgements
We thank RCPAQAP for permission to quote EQA data, Dr DS Handley for constructive criticism of the draft manuscript and Ms J Houston for analysis of samples by FAAS.
Declaration of conflicting interests
The author(s) declared no potential conflicts of interest with respect to the research, authorship, and/or publication of this article.
Funding
The author(s) received no financial support for the research, authorship, and/or publication of this article.
Ethical approval
Ethics approval was not required as work undertaken does not include studies on humans.
Guarantor
LP.
Contributorship
SH researched literature and conceived the study. SH and TW were involved in protocol development and data analysis. SH, TW, and LP drafted the manuscript. All authors reviewed and edited the manuscript and approved the final version of the manuscript.
Supplemental material
Supplemental material for this article is available online.
References
Supplementary Material
Please find the following supplemental material available below.
For Open Access articles published under a Creative Commons License, all supplemental material carries the same license as the article it is associated with.
For non-Open Access articles published, all supplemental material carries a non-exclusive license, and permission requests for re-use of supplemental material or any part of supplemental material shall be sent directly to the copyright owner as specified in the copyright notice associated with the article.