
Abstract
Background
Studies comparing venous total carbon dioxide (tCO2) and standard hydrogen carbonate (HCO3–(P,st)) has shown diverse results, and it is debatable whether these two parameters can be used interchangeably for workup of acid–base disorders in a hospital setting.
Method
All patients with an HCO3–(P,st) requisition from any department at Odense University Hospital between 11th May 2021 and 1st June 2021 had tCO2 and HCO3–(P,st) analysed simultaneously. TCO2 was measured on Cobas® 8000, c702 module, while HCO3–(P,st) was calculated based on measurements on ABL835 Flex.
Results
From 1210 patients, mean (standard deviation (SD)) was 22.9 (3.7) mmol/L for tCO2 and 22.5 (2.9) mmol/L for HCO3–(P,st). TCO2 range was 10.1–42.3 mmol/L and 11.7–41.4 mmol/L for HCO3–(P,st). Linear regression showed that tCO2 (mmol/L) = −2.90 + 1.15 × HCO3–(P,st) (mmol/L) with R2 = 0.81. Bias (mean (SD) difference) between tCO2 and HCO3–(P,st)) was 0.4 (1.7) mmol/L with a −5.0–9.6 mmol/L range. Limits of agreement was −2.90–3.70 mmol/L. Comparison of classification within, above or below reference interval for tCO2 and HCO3–(P,st) showed that 984 samples (81%) retained their classification. Only one sample (0.1%) would be severely misclassified (outside the respective reference intervals) if HCO3–(P,st) was considered the gold standard. Of the samples investigated, 46.1% had a mean difference between tCO2 and HCO3–(P,st) of 0–1 mmol/L and 30.3% had 1.1–2.0 mmol/L.
Conclusions
Our results indicate that venous tCO2 and venous HCO3–(P,st) can be used interchangeably in a hospital setting for workup of acid–base disorders.
Introduction
The carbon dioxide (CO2)–hydrogen carbonate buffer system, described by the Henderson–Hasselbalch equation, is crucial for pH control in the human body.1,2 Standard hydrogen carbonate (HCO3–(P,st)) constitute around 95% of the total CO2 (tCO2) volume in human blood.3,4 As diseases of the kidneys, liver or lungs can cause changes in blood pH,1,2 measurement of tCO2 or HCO3–(P,st) are important to detect and monitor acid-base disorders. In both chronic and acute patients, analysis of tCO2 or HCO3–(P,st) provides important clinical information as patients can present mild or few symptoms. Furthermore, tCO2 or HCO3–(P,st) can be used to monitor treatment response and disease regression or progression.
The tCO2 analysis measures all CO2 forms in the blood (hydrogen carbonate, carbonate, dissolved CO2 etc.), 5 while the HCO3–(P,st) analysis is the calculated amount of hydrogen carbonate in the blood under standard conditions. 6 Analysis of tCO2 can be performed on automatic high-throughput equipment connected to an automated track, while HCO3–(P,st) often is performed on stand-alone blood gas analysers requiring manual handling. Therefore, the time from phlebotomy to analysis is potentially longer for tCO2 and with longer uncapping time but is cheaper and less prone to human errors. Unfortunately, studies comparing tCO2 and HCO3–(P,st) has shown conflicting results,3,7,8 and whether these two analyses can be used interchangeably is therefore questionable. The purpose of this study was to compare venous tCO2 and venous HCO3–(P,st) from a broad spectrum of patients to determine, whether venous tCO2 can substitute venous HCO3–(P,st) in a hospital setting for workup of acid–base disorders.
Methods
We performed a retrospective comparison study of HCO3–(P,st) and tCO2. All patients with a HCO3–(P,st) requisition from any department at Odense University Hospital in the period 11th May 2021 to 1st June 2021 were included. For all included patients, tCO2 was analysed simultaneously with standard HCO3–(P,st) as described below.
Phlebotomy was performed by trained phlebotomists according to the ISO15189 accredited standard operating procedure, and samples were received at the laboratory within 30 min.
After phlebotomy, a Li-heparin vacutainer® (Becton Dickinson, Franklin Lakes, NJ, USA) for tCO2 was centrifuged and uncapped at the automated laboratory track (GLP, Abbott, Chicago, IL, USA), and tCO2 was measured immediately on a Cobas® 8000, c702 module (Roche, Basel, Switzerland), connected to the track with dedicated reagents. Based on previous findings of tCO2 stability 9 and a small pilot project (n = 40) performed at our department, the timespan allowed for Li-heparin plasma samples to be uncapped until tCO2 measurement was limited to 60 min.
Simultaneously with the Li-heparin vacutainer, a Na-Fluoride-Citrate vacutainer® (BD, Franklin Lakes, NJ, USA) was collected for HCO3–(P,st) analysis and handled manually at the laboratory. After 3 min of mixing, the sample was uncapped and immediately analysed on ABL835 Flex (Radiometer Medical, Copenhagen, Denmark) followed by calculation of HCO3–(P,st) using the embedded equation: HCO3–(P,st) = 24.47 + 0.919 × Z + Z x a´ x (Z-8), where Z = cBase(B)-0.3062 × ctHb x (1-sO2) and a´ = 4.04 × 10⁻³ + 4.25 × 10⁻⁴ x ctHb. 10
Limit of detection was 2 mmol/L for tCO2. Coefficient of variation (CV%) at our laboratory was 2.3% at 17 mmol/L tCO2 and 2.1% at 39 mmol/L tCO2. Reference interval (RI) for tCO2 was 22–29 mmol/L 11 and 22–27 mmol/L for HCO3–(P,st). 12 Our a priori demand for a clinically acceptable limit of agreement (LoA) in the Bland–Altman plot was 7.3%.13,14
According to local ethical guidelines, the data used in this study constitutes a quality project and does therefore not require ethical approval from the Ethical Committee of Region Southern Denmark. All data obtained were completely anonymised, and according to the Danish National Committee on Health Research Ethics permissions from the Danish authorities were not required. 15 Therefore, only data regarding tCO2 and HCO3–(P,st), including the department requesting the analysis, was available. Samples included in this study were requested for routine HCO3–(P,st) analysis and would otherwise be discarded afterwards. The tCO2 analysis did not require an additional sample or phlebotomy. Furthermore, the tCO2 result was not visible to the requesting physician and therefore did not influence any clinical decisions.
Results
In total, tCO2 and HCO3–(P,st) were analysed simultaneously in samples from 1210 patients. Of note, 702 (58%) of the samples were retrieved from the Nephrology Department, while the remaining samples were from a wide variety of clinical departments.
The Anderson-Darling test on tCO2 and HCO3–(P,st) showed that data was not normally distributed (p-value: <0.05). However, the residuals on the linear regression were normally distributed and we found homoscedasticity. Mean (standard deviation (SD)) was 22.9 (3.7) mmol/L for tCO2 and 22.5 (2.9) mmol/L for HCO3–(P,st). Range was 10.1–42.3 mmol/L for tCO2 and 11.7–41.4 mmol/L for HCO3–(P,st). Bias (mean (SD) difference) between tCO2 and HCO3–(P,st)) was 0.4 (1.7) mmol/L with a −5.0-9.6 mmol/L range. Of the 1210 samples, 46.1% had a mean difference between tCO2 and HCO3–(P,st) of 0–1 mmol/L, 30.3% had 1.1–2.0 mmol/L, 16.5% had 2.1–3.0 mmol/L, 5.3% had 3.1–4.0 mmol/L, 1.4% had 4.1–5.0 mmol/L, and 0.3% had >5.0 mmol/L. Bland-Altman difference plot showed a concentration-dependent distribution, where samples in the low concentration range had higher HCO3–(P,st) concentrations than tCO2, while samples in the high concentration range had higher tCO2 concentrations than HCO3–(P,st) (Figure 1). Bland–Altman difference plot showing the comparison of total CO2 (tCO2) and standard hydrogen carbonate (HCO3–(P,st)) measured simultaneously in patients from any department at Odense University Hospital between 11th May and 1st June 2021. N = 1210. Mean value (0.40 mmol/L) is shown as a black line and 95% limit of agreement (LoA) as dotted lines (−2.90–3.70 mmol/L).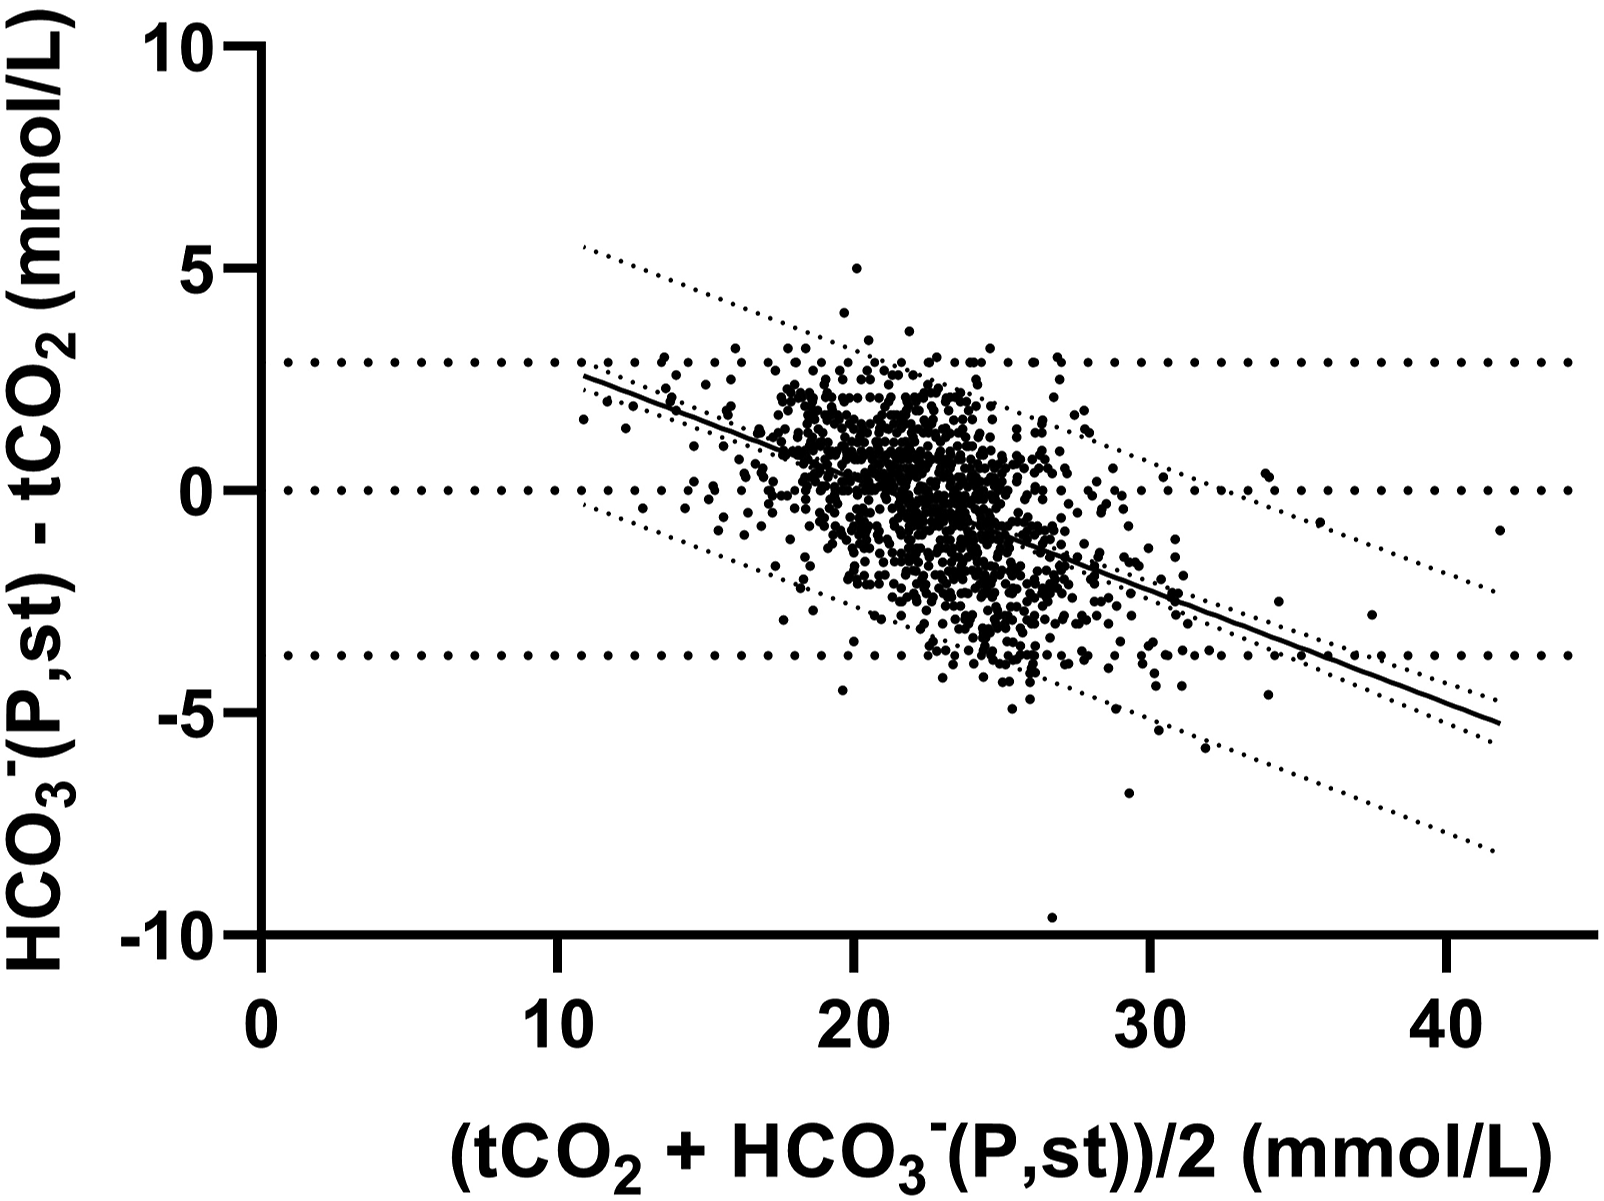
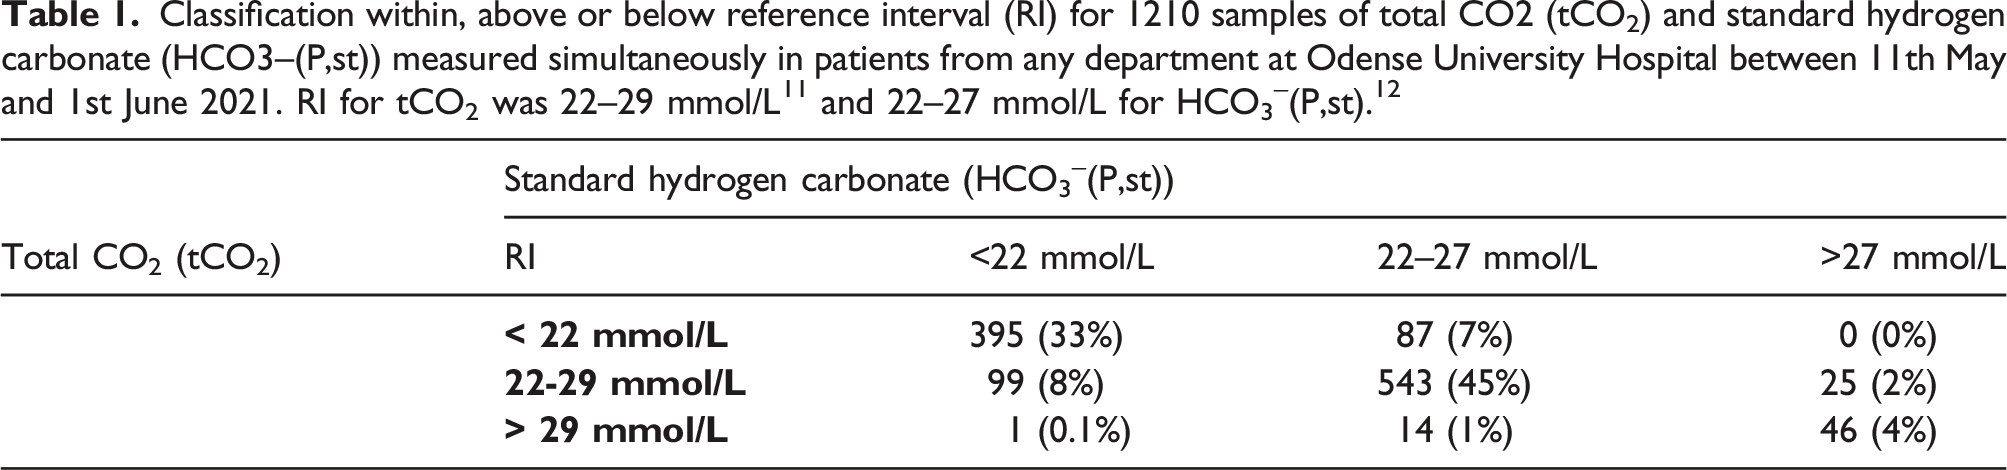
Classification within, above or below reference interval (RI) for 1210 samples of total CO2 (tCO2) and standard hydrogen carbonate (HCO3–(P,st)) measured simultaneously in patients from any department at Odense University Hospital between 11th May and 1st June 2021. RI for tCO2 was 22–29 mmol/L 11 and 22–27 mmol/L for HCO3–(P,st). 12
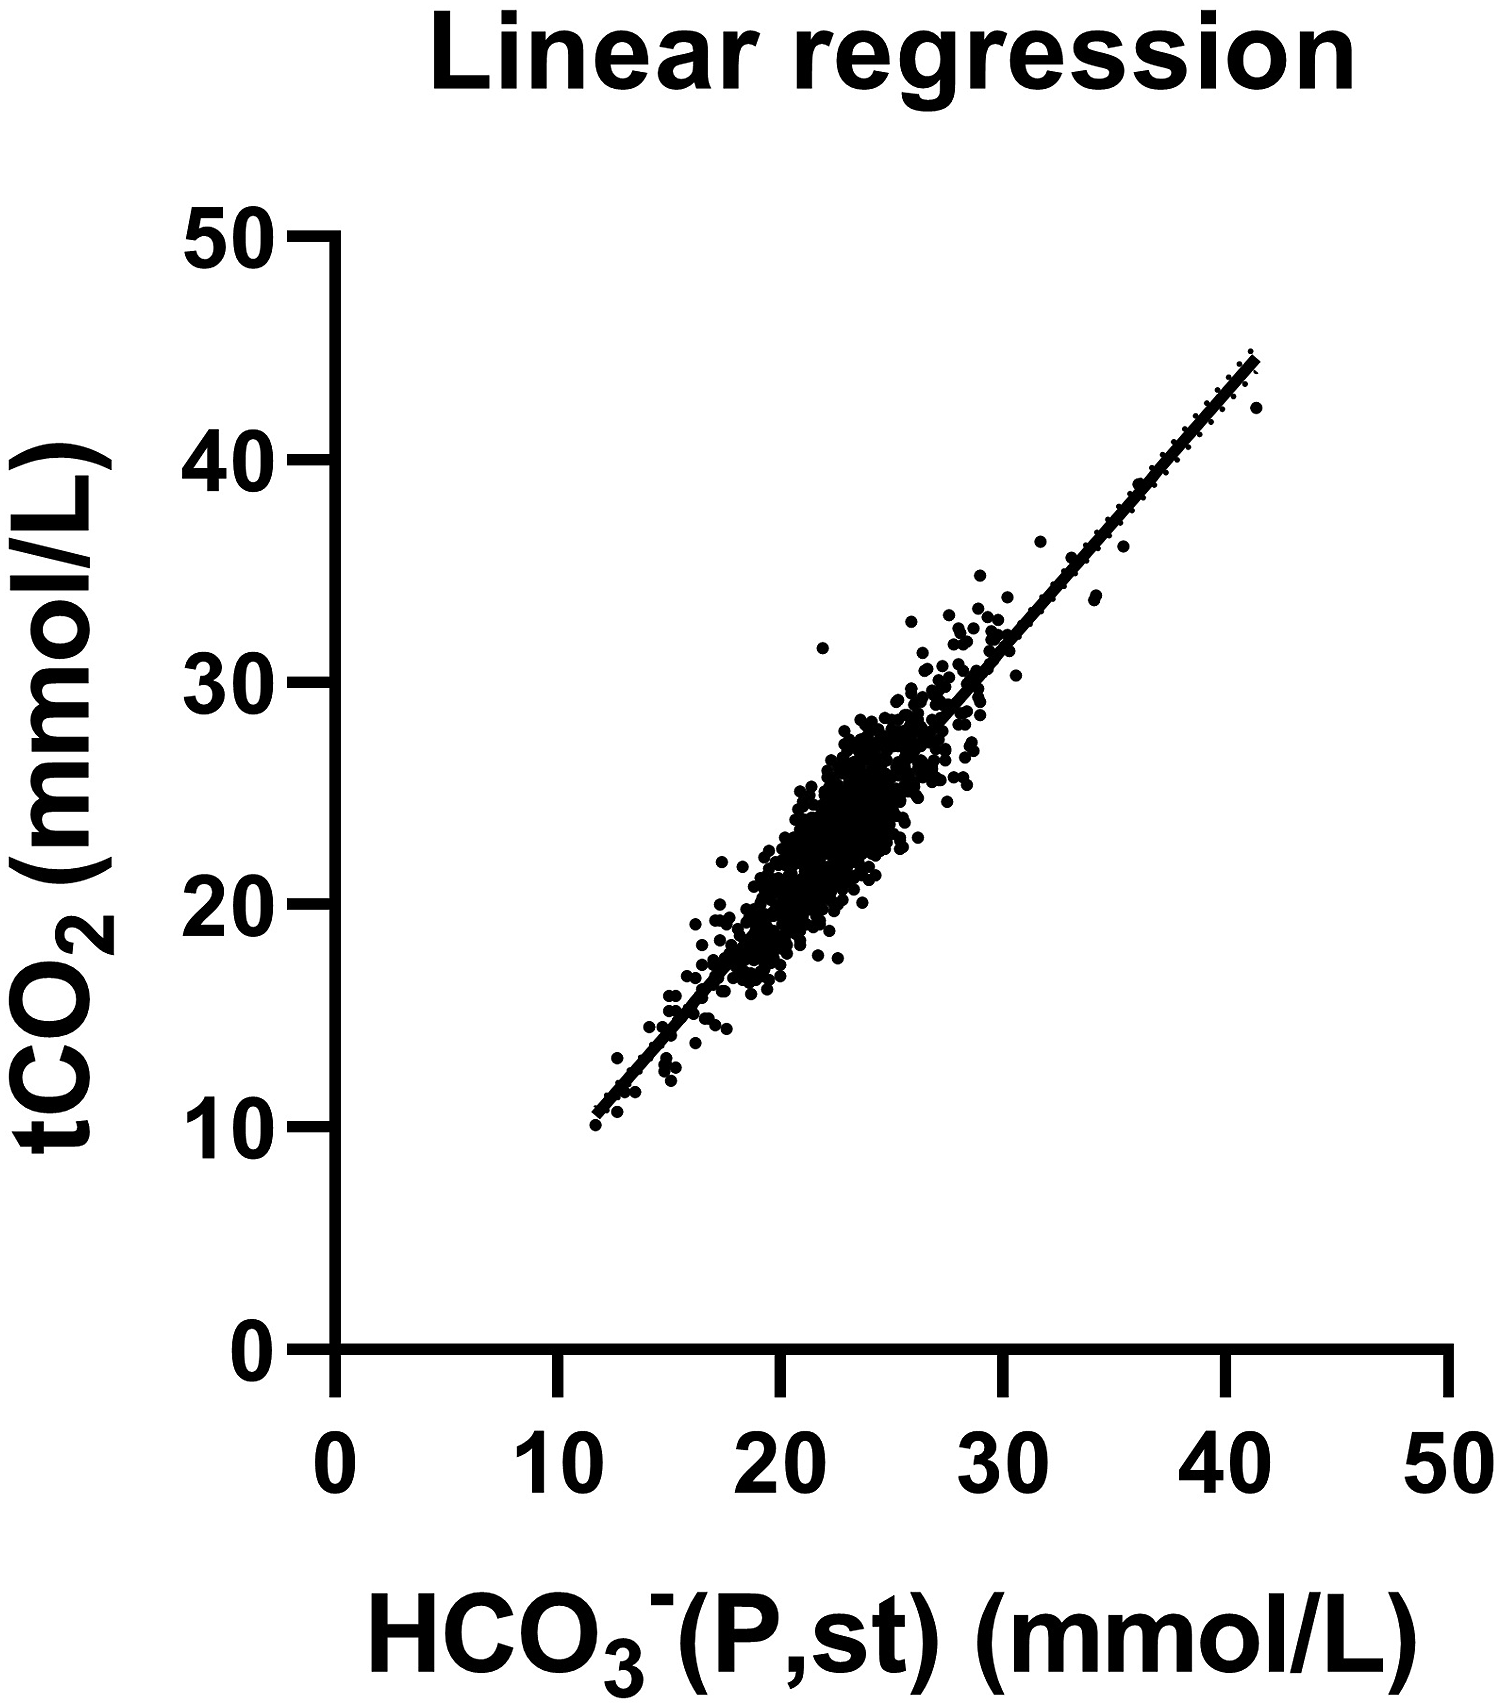
Linear regression showing the correlation between total CO2 (tCO2) and standard hydrogen carbonate (HCO3–(P,st)) measured simultaneously in patients from any department at Odense University Hospital between 11th May and 1st June 2021. N = 1210. Regression formula: tCO2 (mmol/L) = −2.90 + 1.15 × HCO3–(P,st) (mmol/L) with R2 = 0.81, and 95% CI for intercept −3.61 to −2.19 and 1.12–1.18 for slope.
Discussion
Since the tCO2 analysis can be performed automatically and therefore is less laborious and cheaper than HCO3–(P,st), our interest was to determine whether tCO2 can safely substitute HCO3–(P,st) in a hospital setting. In 1210 patient samples, we found a linear relationship between tCO2 and HCO3–(P,st) compatible with previous findings.3,7 The R2-values however differ between the studies, which could be due to differences in equipment, analysis method, and cohort; e.g. the study by Hirai et al. 7 was based on pre-dialysis patients with chronic kidney disease. Despite a strong linear relationship, Nasir et al. 3 concluded that tCO2 could not substitute HCO3–(P,st) based on Story and Poustie 16 ’s criterion . This criterion states that plasma HCO3–(P,st) concentrations is clinically important if bias is greater than ±1 mmol/L and LoA is wider than bias ±2 mmol/L (span of maximum 4 mmol/L) . Similar to Nasir et al., 3 our findings did not fulfil the criterion: Although our data only indicated a bias of 0.40 mmol/L, LoA spanned 6.60 mmol/L (−2.90–3.70). We would however like to question the usability of Story and Poustie’s criterion in this context: It originates from a comparison study of two different arterial HCO3–(P,st) analyses on 102 intensive care patients, and it is therefore safe to presume that it is not directly applicable to venous samples from patients attending a hospital in general.
Majority of the samples had a mean difference between tCO2 and HCO3–(P,st) within ±3.0 mmol/L and 46% of the samples within ±1.0 mmol/L. We found that samples in the low concentration range had higher HCO3–(P,st) concentrations than tCO2, while samples in the high concentration range had higher tCO2 concentrations compared to HCO3–(P,st). This could indicate that tCO2 and HCO3–(P,st) results are not directly equivalent, and an analytical or pre-analytical bias could be present, and the Bland–Altman plot reveals that there are no systematic bias. If looking solely at the mean difference distribution it could be argued that there is an analytical uncertainty. However, when looking at the mean difference from a clinical point of view, the agreement was deemed sufficient as changes of 1–3 mmol/L within the RI was considered clinically irrelevant. For results outside the RI, we recommend to perform additional analysis (e.g. pH), especially when results are below RI, where we found that tCO2 tended to be lower than HCO3–(P,st), and therefore potentially could help early detection of metabolic acidosis or a compensated respiratory alkalosis. Furthermore, the concentration-dependent difference could indicate that further studies on the RI for tCO2 and HCO3–(P,st) is needed. In a clinical context, this indicates that for acute patients with symptoms of respiratory or metabolic acidosis or alkalosis, it could be beneficial to measure pH simultaneous with tCO2, as results in acute patients tends to be outside RI. However, in chronic patients with a known disease who needs monitoring, venous tCO2 could be part of a standard surveillance, hopefully decreasing the number of phlebotomies performed.
We measured HCO3–(P,st) immediately after uncapping the samples, whereas tCO2 was measured up to 60 min after uncapping. Uncapping causes diffusion of gases from the sample and therefore reduces the tCO2 level. This factor could potentially increase bias and cause misclassification of results within, above or below RI. However, Kirschbaum 9 found a 5% change in tCO2 after 60 min exposure to room air, and our small pilot study of 40 samples found a 7% change, which we deemed was within clinically acceptable range.
Of note, it is important to emphasize that comparison of biomarkers requires a gold standard to assure that a misclassification is not caused by superiority of the new biomarker. In our case, the clinical presentation along with pH and pCO2 could be considered the gold standard, as measurement of HCO3–(P,st) also has its limitations and can be affected by recent treatment (eg dialysis). Unfortunately, data on clinical presentation were not available. However, tCO2 and HCO3–(P,st) is widely used in patients with risk of, or clinical symptoms indicating, acidosis or alkalosis, where pH is also a key parameter. A large retrospective study of 21,586 samples showed a very strong correlation (R = 0.99) between real pH and pH estimated from tCO2. 17 When comparing tCO2 and pH for classification of acidosis and alkalosis in patients on continuous kidney replacement therapy, tCO2 is reported to have a high misclassification risk, 6 but whether this also holds true for HCO3–(P,st) is unknown and warrants further investigation.
Arterial and venous HCO3–(P,st) has been found reasonably compatible in clinical settings,18,19 and although the agreement for pCO2 was poor, direct comparison of venous and arterial tCO2 is sparsely evaluated. A study of 151 paired arterial and venous samples found an acceptable correlation between venous tCO2 and arterial HCO3–(P,st). 20 Our study is based on venous tCO2 and venous HCO3–(P,st), but in emergency situations, we recommend use of arterial blood gas analysis, which also provides a variety of other critical parameters.
In conclusion, our results indicate that venous tCO2 and venous HCO3–(P,st) can be used interchangeably in a hospital setting for workup of acid-base disorders. In a clinical context, it would be beneficial to measure pH simultaneous with tCO2 in acute patients, while in chronic patients with a known disease who needs monitoring for acid-base disorders, venous tCO2 could be part of a standard surveillance.
Footnotes
Acknowledgements
All the authors have accepted full responsibility for the entire content of this submitted manuscript and approved the submission. We would like to thank Louise Falk Nielsen, Johanne Rullhøj Knudsen, Kathrine Keil and Pernille Winther Thrane for their contribution with performing the pilot study on tCO2 stability.
Declaration of conflicting interests
The author(s) declared no potential conflicts of interest with respect to the research, authorship, and/or publication of this article.
Funding
The author(s) received no financial support for the research, authorship, and/or publication of this article.
Ethical approval
According to local ethical guidelines, the completely anonymised data used in this study constitutes a quality project and does not require ethical approval.
Guarantor
Mads Nybo.
Contributorship
RSH, JR, MBS, LHJ and MN: Protocol development, performing the study, obtaining data, analysis of data, editing and critical review of the manuscript RSH: Researched literature, Wrote paper draft, MBS and LHJ: Performed the figures.