
Abstract
Background
Left ventricular remodelling that frequently occurs after acute myocardial infarction is associated with an increased risk of heart failure and cardiovascular death. Although several risk factors have been identified, there is still no marker in clinical use to predict left ventricular remodelling. Plasma concentration of coenzyme Q10, which plays a key role in mitochondrial energy production and as an antioxidant, seems to be negatively correlated with left ventricular function after acute myocardial infarction.
Objective
The goal of our study was to determine whether the plasma coenzyme Q10 baseline concentrations at time of the ST-elevation myocardial infarction (STEMI) could predict left ventricular remodelling at six months’ follow-up.
Methods
Sixty-eight patients who were admitted to hospital for STEMI and successfully revascularized with primary percutaneous coronary intervention were recruited. All patients underwent a 3D-echocardiography examination within the first four days after percutaneous coronary intervention and six months later then divided into two groups based on the presence or not of left ventricular remodelling. Plasma coenzyme Q10 concentration at the time of percutaneous coronary intervention was determined using high-performance liquid chromatography-tandem mass spectrometry.
Results
While we found similar plasma coenzyme Q10 concentrations compared with other studies, no association was evidenced between coenzyme Q10 concentrations and left ventricular remodelling (P = 0.89).
Conclusion
We found no evidence for using plasma coenzyme Q10 concentration as an early prediction marker of left ventricular remodelling after STEMI.
Keywords
Introduction
Acute myocardial infarction (AMI) is a frequent and severe disease which constitutes a great socioeconomic burden for society, with high mortality and morbidity. 1 Over the past few decades, reperfusion therapies and secondary prevention medications have considerably reduced short-term mortality after AMI. Following AMI, patients who develop left ventricular remodelling (LVR), a progressive alteration in ventricular function and architecture, are at increased risk of heart failure and cardiovascular death.2,3 Morphological changes include cardiomyocyte loss, cardiac hypertrophy and fibrosis. 4 Several biomarkers have been investigated to predict the risk of LVR, including natriuretic peptides, markers of fibrosis (collagen peptides, matrix metalloproteinases) and markers of inflammation (soluble suppression of tumorigenicity 2 or SST2, Galectin-3). 5 However, there is still no reliable biomarker that could be used in clinical practice for the early diagnosis and management of patients who may develop LVR. 6 This is probably due to the complexity of the pathophysiological mechanisms involved in LVR which is a dynamic, time-dependent and multifactorial process triggered by mechanical stretch, neurohormonal activation, inflammation, metabolic abnormalities and oxidative stress. 7 It is well admitted that mitochondrial dysfunction which results from ischaemia/reperfusion injury leads to reactive oxygen species (ROS)-induced cellular damages, including lipid peroxidation, antioxidant deficiency and decrease in energy production.8,9
Coenzyme Q10 (CoQ10), or ubiquinone/ubiquinol, is a liposoluble vitamin-like molecule mainly located within the inner mitochondrial membrane. 10 CoQ10 plays a key role in oxidative phosphorylation, acting as an electron transporter from mitochondrial complexes I and II to complex III. 11 It also acts as a powerful endogenous antioxidant and free radical scavenger due to its ability to switch from a reduced to an oxidized state (ubiquinol → semiquinone → ubiquinone). 12 Other biological functions of CoQ10 include extramitochondrial oxidative phosphorylation (platelets, myelin sheath, retina, etc.), regulation of the mitochondrial permeability transition pore, activation of mitochondrial uncoupling proteins and improvement of endothelial dysfunction (probably by increasing nitrogen oxide). 13
In rat models of AMI, pretreatment with exogenous administration of CoQ10 has been shown to reduce infarct size and preserve ventricular function by reducing oxidative stress, pro-inflammatory cytokines and pro-apoptotic factors.14–16 A recent clinical study suggests that early CoQ10 supplementation in patients with left ventricular ejection fraction <50% after AMI may reduce LVR. 17 In another study, plasma CoQ10 concentrations one month after percutaneous coronary intervention (PCI) in patients with STEMI are positively correlated with favourable LVR. 18 These studies suggest that CoQ10 could play a role in LVR, by reducing ROS production and optimizing mitochondrial function, but data are scarce and the clinical interest of CoQ10 concentration in AMI has to be established.19,20
Therefore, we aimed to assess the hypothesis that low plasma concentrations of CoQ10 at the time of myocardial infarction may be associated with an increased risk of developing adverse LVR at six months of follow-up.
Materials and methods
Patients and study protocol
A total of 68 adult patients admitted for STEMI and treated with PCI between 1 January 2017 and 30 October 2018 at Caen University Hospital (France) were retrospectively enrolled. This study is an ancillary study that was designed by Legallois et al. with inclusion and exclusion criteria previously described. 21 The study complied with the Declaration of Helsinki and was approved by the local ethics committee (protocol number A14-D17-VOL.20).
In an exploratory analysis, we compared plasma and muscle CoQ10 concentrations in an independent cohort of 12 patients who simultaneously underwent a muscle biopsy and a blood test in the course of the investigation of a putative mitochondrial disorder. Written informed consent was obtained from all patients.
Sample collection
Peripheral venous blood samples for baseline plasma CoQ10 measurement were collected at the sheath insertion prior to percutaneous coronary intervention in Vacutainer tube (Becton-Dickinson) with EDTA as anticoagulant. Samples were centrifuged at room temperature for 12 min at 2000 g and plasma was stored at –80°C until analysis. Muscle samples mainly involved deltoid or quadriceps muscle according to clinical symptoms. Biopsies were performed under local anaesthesia and stored at –80°C until their preparation.
Measurement of biochemical parameters
Plasma CoQ10 measurement
The plasma CoQ10 concentration was determined using high-performance liquid chromatography-tandem mass spectrometry (HPLC/MSMS) following a slightly modified procedure described by Ruiz-Jimenez et al. 22 A mixture of 100 µL of thawed plasma and 50 µL CoQ10-d 9 internal standard at 2 µg/mL was deproteinized with 500 µL methanol and extracted three times with 1000 µL n-hexane. The organic phases were pooled and evaporated to dryness using a vacuum concentrator. The dry residue was suspended within 100 µL of ethanol, vortexed for 2 min and put into vial. Three microlitres were injected on a NexeraXR® system (Shimadzu, Marne-la-Vallée, France) with a 3 µm (2.0 × 150 mm) Pursuit PFP® column (Agilent, Santa Clara, USA). The mobile phase was methanol-formic acid 0.1% from 80:20 (v/v) to 100% methanol. The flow rate was fixed at 0.35 mL/min for 7.5 min and the temperature of the analytical column was 40°C. CoQ10 was detected and quantified using an API 5500 QTRAP® (ABSciex, Les Ulis, France) tandem mass spectrometer equipped with an APCI source in positive mode. CoQ10 was analysed in the MRM mode with the following transitions: CoQ10 m/z 863.4 → 197.1 and CoQ10-d 9 m/z 872.9 → 206.3. Linearity was achieved over the following range: 0.02 to 2.30 µmol/L. The intra- and inter-assay precision were, respectively, 3.3% and 6.6% for a CoQ10 concentration of 0.96 µmol/L and 3.0% and 8.5% for a concentration of 1.97 µmol/L. The recoveries of CoQ10 were comprised between 90 and 110%. Measurement of the patients’ plasma CoQ10 concentration was performed in duplicate. Plasma CoQ10 concentration was expressed in µmol/L or indexed to LDL or total cholesterol (µmol/mmoL).
Muscle CoQ10 measurement
Pieces of frozen tissue (m = 30–50 mg) were homogenized twice in 10 volumes of grinding buffer (mannitol 225 mM; sucrose 70 mM; Tris-HCl 10 mM; EDTA 0.1mM; pH 7.2) using a tight-fit Potter-Elvehjem tissue grinder. Samples were centrifuged at 650 g for 20 min at +4°C. Supernatants were pooled and stored at –80°C until CoQ10 quantification. CoQ10 concentration was determined as previously described using 40 µL of the muscle homogenate diluted by a two- or a four-fold in grinding buffer (according to protein content) and 40 µL of internal standard. Linearity was achieved over the following range: 0.015 to 2.30 µmol/L. The intra- and inter-assay precision were, respectively, 3.92% and 4.81% for a CoQ10 concentration of 0.40 µmol/L and 2.21% and 3.53% for a concentration of 0.74 µmol/L. Protein content of muscle homogenate was determined with the bicinchoninic acid assay, and muscle CoQ10 content was finally expressed as molar concentration per gram of protein (nmol/g of protein). 23
Other biochemical parameters
Total cholesterol, high-density lipoprotein cholesterol and triglycerides were determined using enzymatic assays on an AU680 chemistry analyser (Beckman Coulter). Evaluation of total and HDL cholesterol relied on a cholesterol oxidase method. Glycerol blanking for triglycerides determination automatically subtracted 0.11 mmol/L from the obtained value. According to the manufacturer, performance parameters were as follows for total cholesterol (analytical range: 0.5–18 mmol/L, CV = 0.8% at 2.48 mmol/L), HDL cholesterol (0.05–4.65 mmol/L, CV = 1.92% at 0.69 mmol/L) and triglycerides (1.1–11.3 mmol/L, CV = 1.76% at 0.47 mmol/L). Plasma low-density lipoprotein cholesterol concentration was calculated using the Friedwald equation when triglyceride concentration was below 3.75 mmol/L or measured using a Konelab 20 analyser (Thermo Scientific). High-sensitivity cardiac troponin I (hs-cTnI) and N-terminal pro-B-type natriuretic peptide (NT-pro-BNP) concentrations were, respectively, measured on a Unicel DxI system (Beckman Coulter) and a Cobas e411 system (Roche). The 99th percentile upper reference limit value of hs-cTnI, as determined by the manufacturer, was 17.5 ng/L and the 10% CV limit of quantification was 5.6 ng/L. The serum creatinine values were determined using an enzymatic creatinine assay with a calibration traceable to the isotope dilution mass spectrometry. Glomerular flow rate (GFR) was calculated using the Chronic Kidney Disease – Epidemiology Collaboration (CKD-EPI) equation. 24
Echocardiographic assessments
All subjects had two transthoracic echocardiograms, within 48 h following PCI and after a median follow-up of seven months (6 to 10 months). Echocardiograms were performed as described by Legallois et al. and obtained by experienced ultrasonographers who were blinded to the patients’ plasma CoQ10 concentrations. 21 Left ventricular volumes and ejection fraction were measured using 3D echocardiography as recommended. 25 Adverse LVR was defined as a 20% increase in end-diastolic volume between baseline and follow-up imaging sessions.26,27
Statistical analysis
Qualitative variables are shown as count and frequency (%). Quantitative variables are presented as mean±SD or median and quartiles, depending on the form of the distribution. A log-binomial regression model was used to test the association between plasma CoQ10 concentration and unfavourable LVR and to estimate a relative risk with 95% confidence interval. The same kind of analysis was done to test the association between unfavourable LVR and the baseline demographic, clinical and biological factors. All quantitative variables were kept continuous in the models, and the fractional polynomial method was used to account for potential non-linear effects. Linearity was rejected for none of the variables. Two-group mean comparisons were done using Student’s t-test, and Spearman correlation coefficients were used to test the association between quantitative variables. Statistical significance was set at P < 0.05. Data were analysed with IBM SPSS version 23 and Stata version 13 (for the fractional polynomial analysis).
Results
A total of 68 patients fulfilling complete biological data and echocardiography were included in the analysis. Demographic and clinical characteristics are summarized in Table 1. Mean age was 58.6 ± 12.7 years and 57 (83.8%) were men. Using the definition of adverse LVR as a 20% increase in EDV between baseline and follow-up echocardiography, we could discriminate an adverse LVR group (n = 19, 28%) and a no adverse LVR group (n = 49, 72%). As shown in Table 1, LVR was associated with none of the baseline characteristics. At the baseline, LV end-diastolic and end-systolic volumes, as well as the LV ejection fraction, were similar between the two groups. At six-month follow-up, as expected, both LV end-diastolic and end-systolic volumes were significantly higher in the adverse LVR group compared with the no adverse LVR group (Table 2). Biological data of interest for the study are depicted in Table 3. No significant associations were found between LVR and concentrations of hs-cTnI and NT-proBNP concentrations but also the lipid profile.
Association between left ventricular remodelling and baseline demographic/clinical factors.
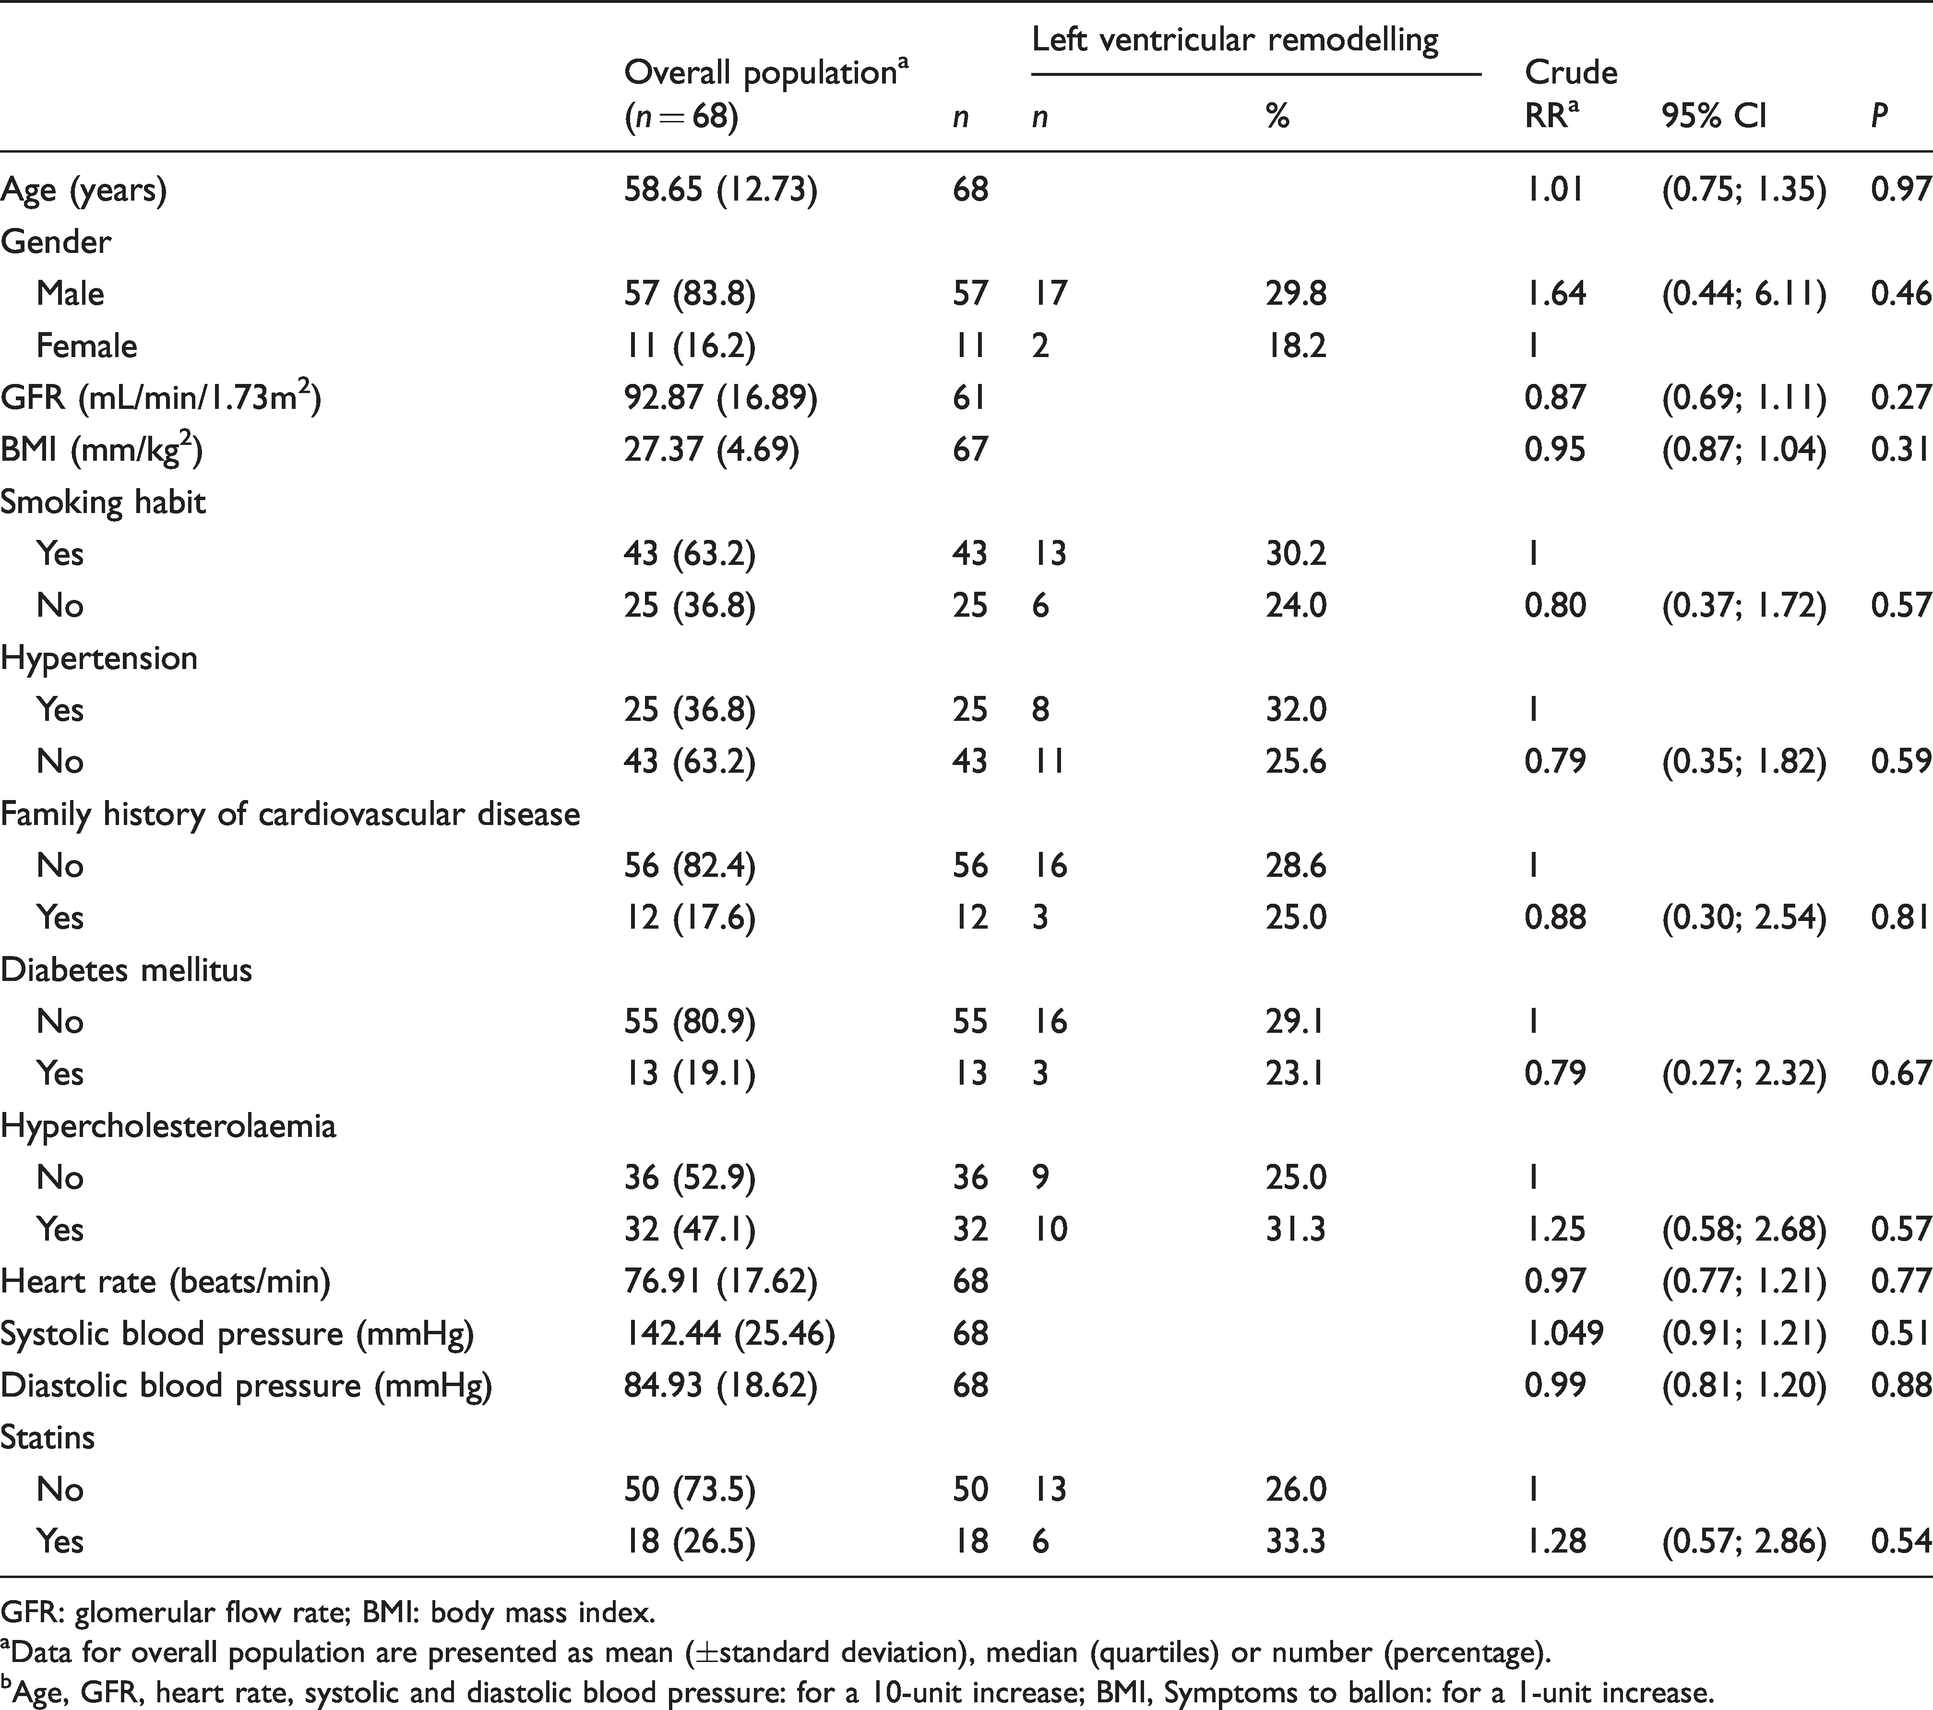
GFR: glomerular flow rate; BMI: body mass index.
aData for overall population are presented as mean (±standard deviation), median (quartiles) or number (percentage).
bAge, GFR, heart rate, systolic and diastolic blood pressure: for a 10-unit increase; BMI, Symptoms to ballon: for a 1-unit increase.
Changes in left ventricular characteristics on 3 D-echocardiography.
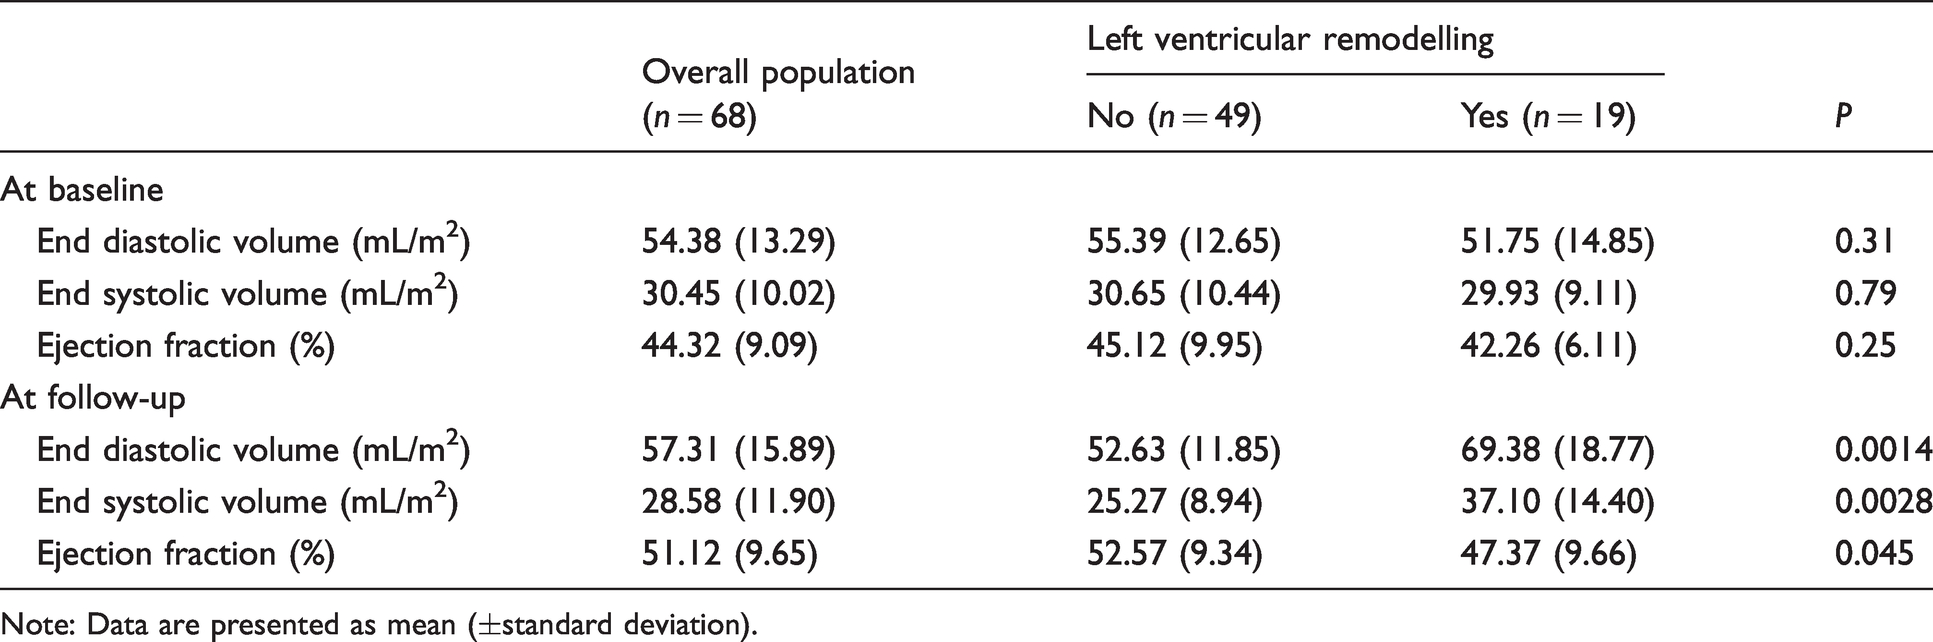
Note: Data are presented as mean (±standard deviation).
Association between left ventricular remodelling and baseline biological factors.
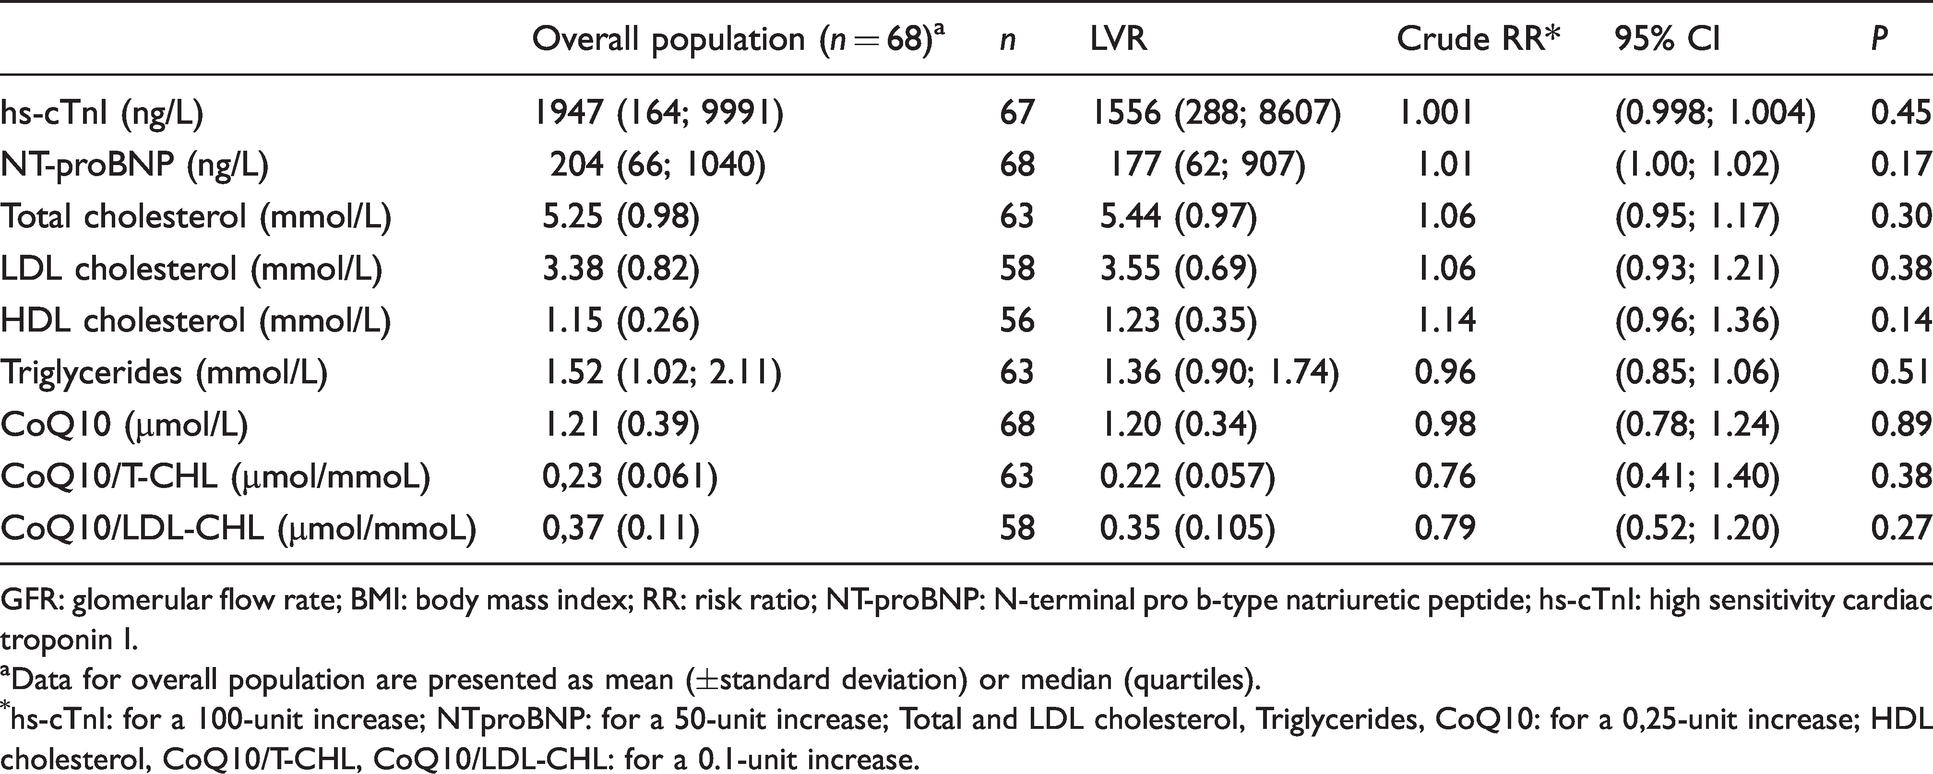
GFR: glomerular flow rate; BMI: body mass index; RR: risk ratio; NT-proBNP: N-terminal pro b-type natriuretic peptide; hs-cTnI: high sensitivity cardiac troponin I.
aData for overall population are presented as mean (±standard deviation) or median (quartiles).
*hs-cTnI: for a 100-unit increase; NTproBNP: for a 50-unit increase; Total and LDL cholesterol, Triglycerides, CoQ10: for a 0,25-unit increase; HDL cholesterol, CoQ10/T-CHL, CoQ10/LDL-CHL: for a 0.1-unit increase.
While investigating plasma CoQ10 concentrations, values ranged from 0.46 to 2.21 µmol/L (mean 1.21±0.32 µmol/L), but no association was evidenced with LVR (Risk Ratio (RR) = 0.98; P = 0.89) (Table 3). As expected, we found a similar positive correlation between CoQ10 and total cholesterol concentrations (r = 0.60; P < 0.001), as well as between CoQ10 and LDL-cholesterol concentrations (r = 0.59; P < 0.001) (see supplemental data). In contrast, HDL-cholesterol concentrations were not significantly related to CoQ10 concentrations (r = 0.12; P = 0.360, data not shown). Thus, CoQ10 concentrations were indexed to total and LDL cholesterol, but once more, no association with LVR was observed (T-CHL: RR = 0.76; P = 0.38/LDL-CHL: RR = 0.79; P = 0.27) (Table 3). Among the 68 patients, 18 (26.5%) were treated with statins at the time of STEMI. We observed a trend toward a lower plasma CoQ10 concentration in patients with statins (mean 1.06±0.41 µmol/L vs. 1.26±0.38 µmol/L in patients without statins, P = 0.06).
Finally, skeletal muscle and plasma CoQ10 status were investigated in an independent series of 12 patients undergoing a muscle biopsy in our laboratory. Plasma CoQ10 values ranged from 0.42 to 2.04 µmol/L and muscle values ranged from 50.00 to 1431.43 pmol/mg of protein. We found no correlation between skeletal muscle and plasma CoQ10 concentrations (r = −0.32, P = 0.34, see supplemental data).
Discussion
Among the 68 patients included in the study, 19 patients (28%) developed adverse LVR. This is in accordance with data from literature where adverse postinfarct ventricular remodelling was found in about 30% of the patients.28,29 We found plasma CoQ10 concentrations ranged from 0.46 to 2.21 µmol/L which are similar to previous data. 30 For example, plasma concentrations of total CoQ10 in healthy subjects have been reported (means ± SD) with different methods: 0.67±0.31 µmol/L (HPLC/MSMS), 31 0.75±0.22 µmol/L (HPLC with UV detection) 32 and 1.11±0.24 µmol/L (HPLC with electrochemical detection). 33 As circulating CoQ10 is mainly transported by lipoproteins (about 58% with LDL and 26% with HDL), we studied their relationships and found a positive correlation between CoQ10 and total cholesterol concentrations (r = 0.60; P < 0.001), as well as between CoQ10 and LDL-cholesterol concentrations (r = 0.59; P < 0.001). This is also in accordance with results from Tomasetti et al. and Niklowitz et al.34,35 Statins, that interfere with CoQ10 synthesis by inhibiting HMG-CoA reductase activity, are well known to decrease plasma CoQ10 concentrations. 36 Indeed, we observed a trend toward a lower plasma CoQ10 concentration in patients treated with statins. However, we found no evidence that a lowered plasma CoQ10 concentration at the baseline was associated with unfavourable LVR six months after the STEMI.
The most probable hypothesis is that plasma CoQ10 concentrations may not accurately reflect tissue concentrations, particularly in cardiomyocytes. 37 As with many biomarkers, CoQ10 status in humans is determined from plasma concentrations primarily because of easy sample collection. However, plasma and tissue CoQ10 contents exhibit several differences. In heart, CoQ10 is mainly intracellular and located within the mitochondrial inner membrane where it constitutes a 50/50 ubiquinone/ubiquinol pool that both participates in the respiratory chain and as an antioxidant. 31 In plasma, CoQ10 is known to be carried by lipoproteins and is present almost entirely – about 95% – in its reduced form to protect lipoproteins from oxidative stress and lipid peroxidation. 38
Furthermore, the correlation between tissue and plasma CoQ10 status is not obvious. For example, Duncan et al. found a close association between skeletal muscle and mononuclear cells CoQ10 concentration, but no correlation between skeletal muscle and plasma CoQ10 concentrations. 39 In our study, we also did not find any correlation between skeletal muscle and plasma CoQ10 concentrations either (r = –0.32, P = 0.34). A similar conclusion was drawn by Folkers et al. who showed no correlation between blood and heart CoQ10 concentrations. However, they observed low blood CoQ10 concentrations in patients suffering from cardiomyopathy but not as markedly as for the heart biopsies. Thus, they hypothesized that a correlation between plasma and organ concentrations may exist only for the most severe deficiency states. 40 In our study, since we found similar values of plasma CoQ10 concentrations to those described in the literature, we could rule out severe CoQ10 deficiency in our patients. This may explain the lack of correlation between plasma and cardiac CoQ10 concentrations and the absence of significant difference in CoQ10 concentrations between patients with and without adverse LVR. Thus, it would be interesting to investigate whether patients who exhibit a real plasma CoQ10 deficiency/overload would be more/less likely to develop LVR compared with patients with CoQ10 in the normal range.
The reason why the plasma and tissue CoQ10 concentrations are not correlated is probably due to their independent origin. In physiological conditions, tissue CoQ10 concentrations mainly rely on de novo synthesis. In contrast, plasma CoQ10 concentrations are significantly influenced by dietary uptake and exogenous CoQ10 does not down-regulate its endogenous synthesis.41,42 The situation is, however, completely different when there is a severe deficiency in CoQ10 tissue concentration, for example in patients with a genetic deficiency of CoQ10 synthesis or in patients with heart failure who exhibit low concentrations of CoQ10 in cardiomyocytes. In those cases, the plasma uptake of exogenous CoQ10 is necessary to maintain adequate tissue concentrations, suggesting that tissue deficiency precedes plasma deficiency.
Another point to consider is that we decided to investigate the plasma CoQ10 concentration at the onset of STEMI. In a similar study, Huang et al. examined the potential correlation between plasma CoQ10 concentration at baseline and three days, seven days and one month after STEMI and the LV performance. They found that CoQ10 concentrations gradually decreased with time and that lower CoQ10 concentrations in plasma at one month was predictive of adverse LVR six months after STEMI (adverse LVR was defined as a 10% increase in end-systolic volume between baseline and follow-up). 18 However, they did not interpret the prognostic value of CoQ10 at other measured times, suggesting that earlier measurements – particularly at the baseline – were not predictive of LV performance as found in our study. It is thus likely that we did not find any evidence that circulating concentrations of CoQ10 were lowered before cardiac remodelling because the CoQ10 decrease might happen as a result of compensatory mechanisms that gradually set up after the onset of STEMI. This is consistent with all findings in patients with chronic heart failure where myocardial remodelling is severely established and who exhibit low circulating and tissue concentrations of CoQ10. 43
When we initially designed the study, we did not consider taking a blood sample at six months of follow-up and it would have been interesting to determine the CoQ10 concentration at that time. Another limitation is that we measured the amount of CoQ10 in its oxidized form but not the Ubiquinol (CoQ10H2)/Ubiquinone (CoQ10) ratio. However, measurement of both reduced and oxidized forms implies great technical considerations regarding sample processing and analytical stability. 28 Ubiquinol is readily oxidized to Ubiquinone during sample preparation or long-term storage, even at –80°C, which is the case in our study where the first samples were collected in January 2017 and analysed two years later. A prospective study with immediate determination of CoQ10 redox state would be interesting, as altered plasma ratios reflect oxidative stress and could be involved in the LV remodelling. 28 At last, we did not assess the reproducibility of left ventricular volumes assessment in our STEMI population, which could have impacted the classification of patients in adverse and non-adverse LVR groups. Finally, given the low number of events (28% of LVR) – which is in accordance with the literature – we could not have performed multivariate analysis. In particular, we did not adjust the results for age and statin intake that are known to decrease CoQ10 concentrations. However, neither of these two parameters were linked to the occurrence of LVR (P = 0.97 and P = 0.54, Table 1).
In conclusion, we found no evidence for a role of circulating CoQ10 as an early biomarker predicting LVR in patients with STEMI. As shown by a comparison between plasma and skeletal muscle, the plasma CoQ10 concentrations presumably do not reflect CoQ10 content in cardiomyocytes. Our results highlight the difficulty to accurately assess the CoQ10 status with only one non-invasive biological sample. Even if we found no significant difference between CoQ10 concentrations in patients with or without LVR, our results cannot rule out a putative benefice of CoQ10 supplementation in STEMI. 44
Supplemental Material
sj-pdf-1-acb-10.1177_00045632211001100 - Supplemental material for Is plasma concentration of coenzyme Q10 a predictive marker for left ventricular remodelling after revascularization for ST-segment elevation myocardial infarction?
Supplemental material, sj-pdf-1-acb-10.1177_00045632211001100 for Is plasma concentration of coenzyme Q10 a predictive marker for left ventricular remodelling after revascularization for ST-segment elevation myocardial infarction? by Fanny Fontaine, Damien Legallois, Christian Créveuil, Mohamed Chtourou, Laurent Coulbault, Paul Milliez, Amir Hodzic, Eric Saloux, Farzin Beygui and Stéphane Allouche in Annals of Clinical Biochemistry
Footnotes
Declaration of conflicting interests
The author(s) declared no potential conflicts of interest with respect to the research, authorship, and/or publication of this article.
Funding
The author(s) disclosed receipt of the following financial support for the research, authorship, and/or publication of this article: This work was supported by the Clinical Research and Innovation Office of Caen University Hospital (grant number 20–512).
Ethical approval
The study complied with the Declaration of Helsinki and was approved by the local ethics committee (NORTHWEST III HUMAN PROTECTION COMMITTEE, protocol number A14-D17-VOL.20).
Guarantor
SA.
Contributorship
FF performed the CoQ10 assays, analysed the data and drafted the manuscript. DL designed the study, extracted and analysed the data and revised the manuscript. CC performed the statistical analysis. MC and LC participated in the CoQ10 assays. AH and ES carried out echocardiography imaging. PM and FB participated in the clinical part. SA designed the study and revised the manuscript. All authors read and approved the final version of the article.
Supplemental material
Supplemental material for this article is available online.
References
Supplementary Material
Please find the following supplemental material available below.
For Open Access articles published under a Creative Commons License, all supplemental material carries the same license as the article it is associated with.
For non-Open Access articles published, all supplemental material carries a non-exclusive license, and permission requests for re-use of supplemental material or any part of supplemental material shall be sent directly to the copyright owner as specified in the copyright notice associated with the article.