
Abstract
Background
Sigma metrics are commonly used to evaluate laboratory management. In this study, we aimed to evaluate the analytical performance of cystatin C using sigma metrics and to develop an individualized quality control scheme for cystatin C concentrations.
Methods
Bias was calculated based on the samples used for the external quality assessment. The coefficient of variation was calculated using six months of internal quality control measurements at two levels, and desirable specification derived from biological variation was used as the quality goal. The sigma value for cystatin C was calculated using the above data. The internal quality control scheme and improvement measures were formulated according to the Westgard sigma standards for batch size and quality goal index.
Results
The sigma values for cystatin C, for quality control levels 1 and 2, were 3.04 and 4.95, respectively. The 13s/22s/R4s/41s/6x multirules (n = 6, R = 1), with a batch size of 45 patient samples, were selected as the internal quality control schemes for cystatin C. With different concentrations of cystatin C, the power function graph showed a probability for error detection of 94% and 100% and a probability for false rejection of 4% and 2%, respectively. According to the quality goal index of cystatin C, its precision needs to be improved.
Conclusions
With a ‘desirable’ biological variation of 6.50%, the Westgard rule 13s/22s/R4s/41s/6x (n = 6, R = 1, batch size of 45) with high efficacy for determining the detection error is recommended for individualized quality control schemes of cystatin C.
Introduction
Cystatin C is an endogenous marker for the glomerular filtration rate, and it is widely used during the early diagnosis of compromised renal function and the evaluation and monitoring of renal function recovery.1–3 Therefore, the accuracy of cystatin C measurements can directly affect the diagnosis and evaluation of clinically related diseases. However, at present, no standard reference measurement procedures have been established for cystatin C. 4 The European Institute for Reference Materials and Measurements released an international reference substance for cystatin C (ERM-DA471) in 2010, but its labelled value of 5.48 ± 0.15 mg/L is significantly higher than the level used for medical decision-making (the reference range for cystatin C is 0.61–1.01 mg/L). 5 Hence, the application of this reference substance for cystatin C measurements has been limited.
He et al. 6 conducted a survey in China from 2014 to 2017 examining the internal quality control (IQC) standards for cystatin C measurements. These authors showed that the results generated by different laboratories varied greatly due to the lack of standardized quality control (QC) materials and detection systems. Eckfeldt et al. 7 investigated the recommendations made by the College of American Pathologists for the detection of cystatin C. Using the commutability quality assessment substances CYS-WC1 and CYS-WC2, at concentrations of 0.96 mg/L and 2.37 mg/L, respectively, the maximum differences in measurements made by 123 laboratories for these different reagent groups were 29% and 36%, respectively. In view of the above findings, the objective evaluation of the accuracy and analytical performance of cystatin C detection methods is very important.
The six-sigma theory, as an important method of laboratory quality management, was first applied to the medical field by Nevalainen et al. 8 Sigma metrics have also been commonly applied to the fields of clinical haematology and clinical chemistry to assess the QC process for different analytes. Sigma metrics have played significant roles in the evaluation of analytical performance, the formulation of IQC schemes and the assessment of continuous quality improvements.9–12 Therefore, this study aimed to apply sigma metrics to the objective evaluation of the analytical performance of cystatin C measurements and to formulate an individualized QC scheme for cystatin C.
Materials and methods
Instruments and reagents
Cystatin C was measured by latex-enhanced immunoturbidimetry, using an AU5800 automatic biochemical analyser and corresponding reagents (Beckman Co., Kraemer Boulevard Brea, USA). The calibrator (lots: AUZ7167; traceability: ERM DA471/IFCC) was set to the original matched reagent. IQC materials were obtained from Qualab (lots 1:379C4E4 and 2:379EBF4; Shanghai, China). External quality assessment (EQA) samples (lots: 202015 and 202011) were provided by the National Center for Clinical Laboratories (NCCL, Beijing, China).
Assessment of measurement performance
Calculation of sigma metrics
Sigma metrics were calculated using the following formula: sigma = [TEa (%) − |bias (%)|]/CV (%). Allowable total error (TEa) was derived from the quality specification of the ‘desirable’ biological variation that was established by the European Federation of Clinical Chemistry and Laboratory Medicine (EFLM).
13
CV was the coefficient of variation for the IQC data for a consecutive six months (January to June 2020). According to the two levels of IQC, the CVs of cystatin C (CV1 and CV 2) were calculated using the following formula
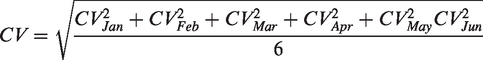
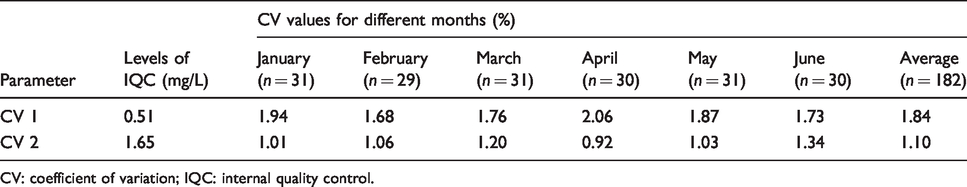
Bias was evaluated based on the data of EQA. According to the two levels of IQC, two EQA samples with similar levels were selected. Bias 1 was matched with CV 1 and bias 2 was matched with CV 2. The target value of the bias was calculated with the average value of all participating laboratories (n = 60) using the same detection system (the detection platform of the AU5800 automatic biochemical analyser). The EQA samples were measured five times repeatedly, and five measured values were obtained. Then, the percentage difference between the measured value and the target value was calculated, and the average value of the absolute value of the percentage difference was taken as the bias (Bias 1 and Bias 2). Biases were calculated using the following formula
The purpose of matching the IQC concentration of cystatin C with the EQA sample concentration is to ensure the accuracy of the sigma metrics (Tables 1 and 2).
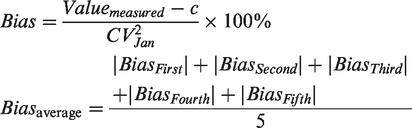
CV determined by IQC for cystatin C (January to June 2020).
CV: coefficient of variation; IQC: internal quality control.
Bias of EQA for cystatin C (2020).
EQA: external quality assessment.
Standardized sigma performance verification diagram for cystatin C
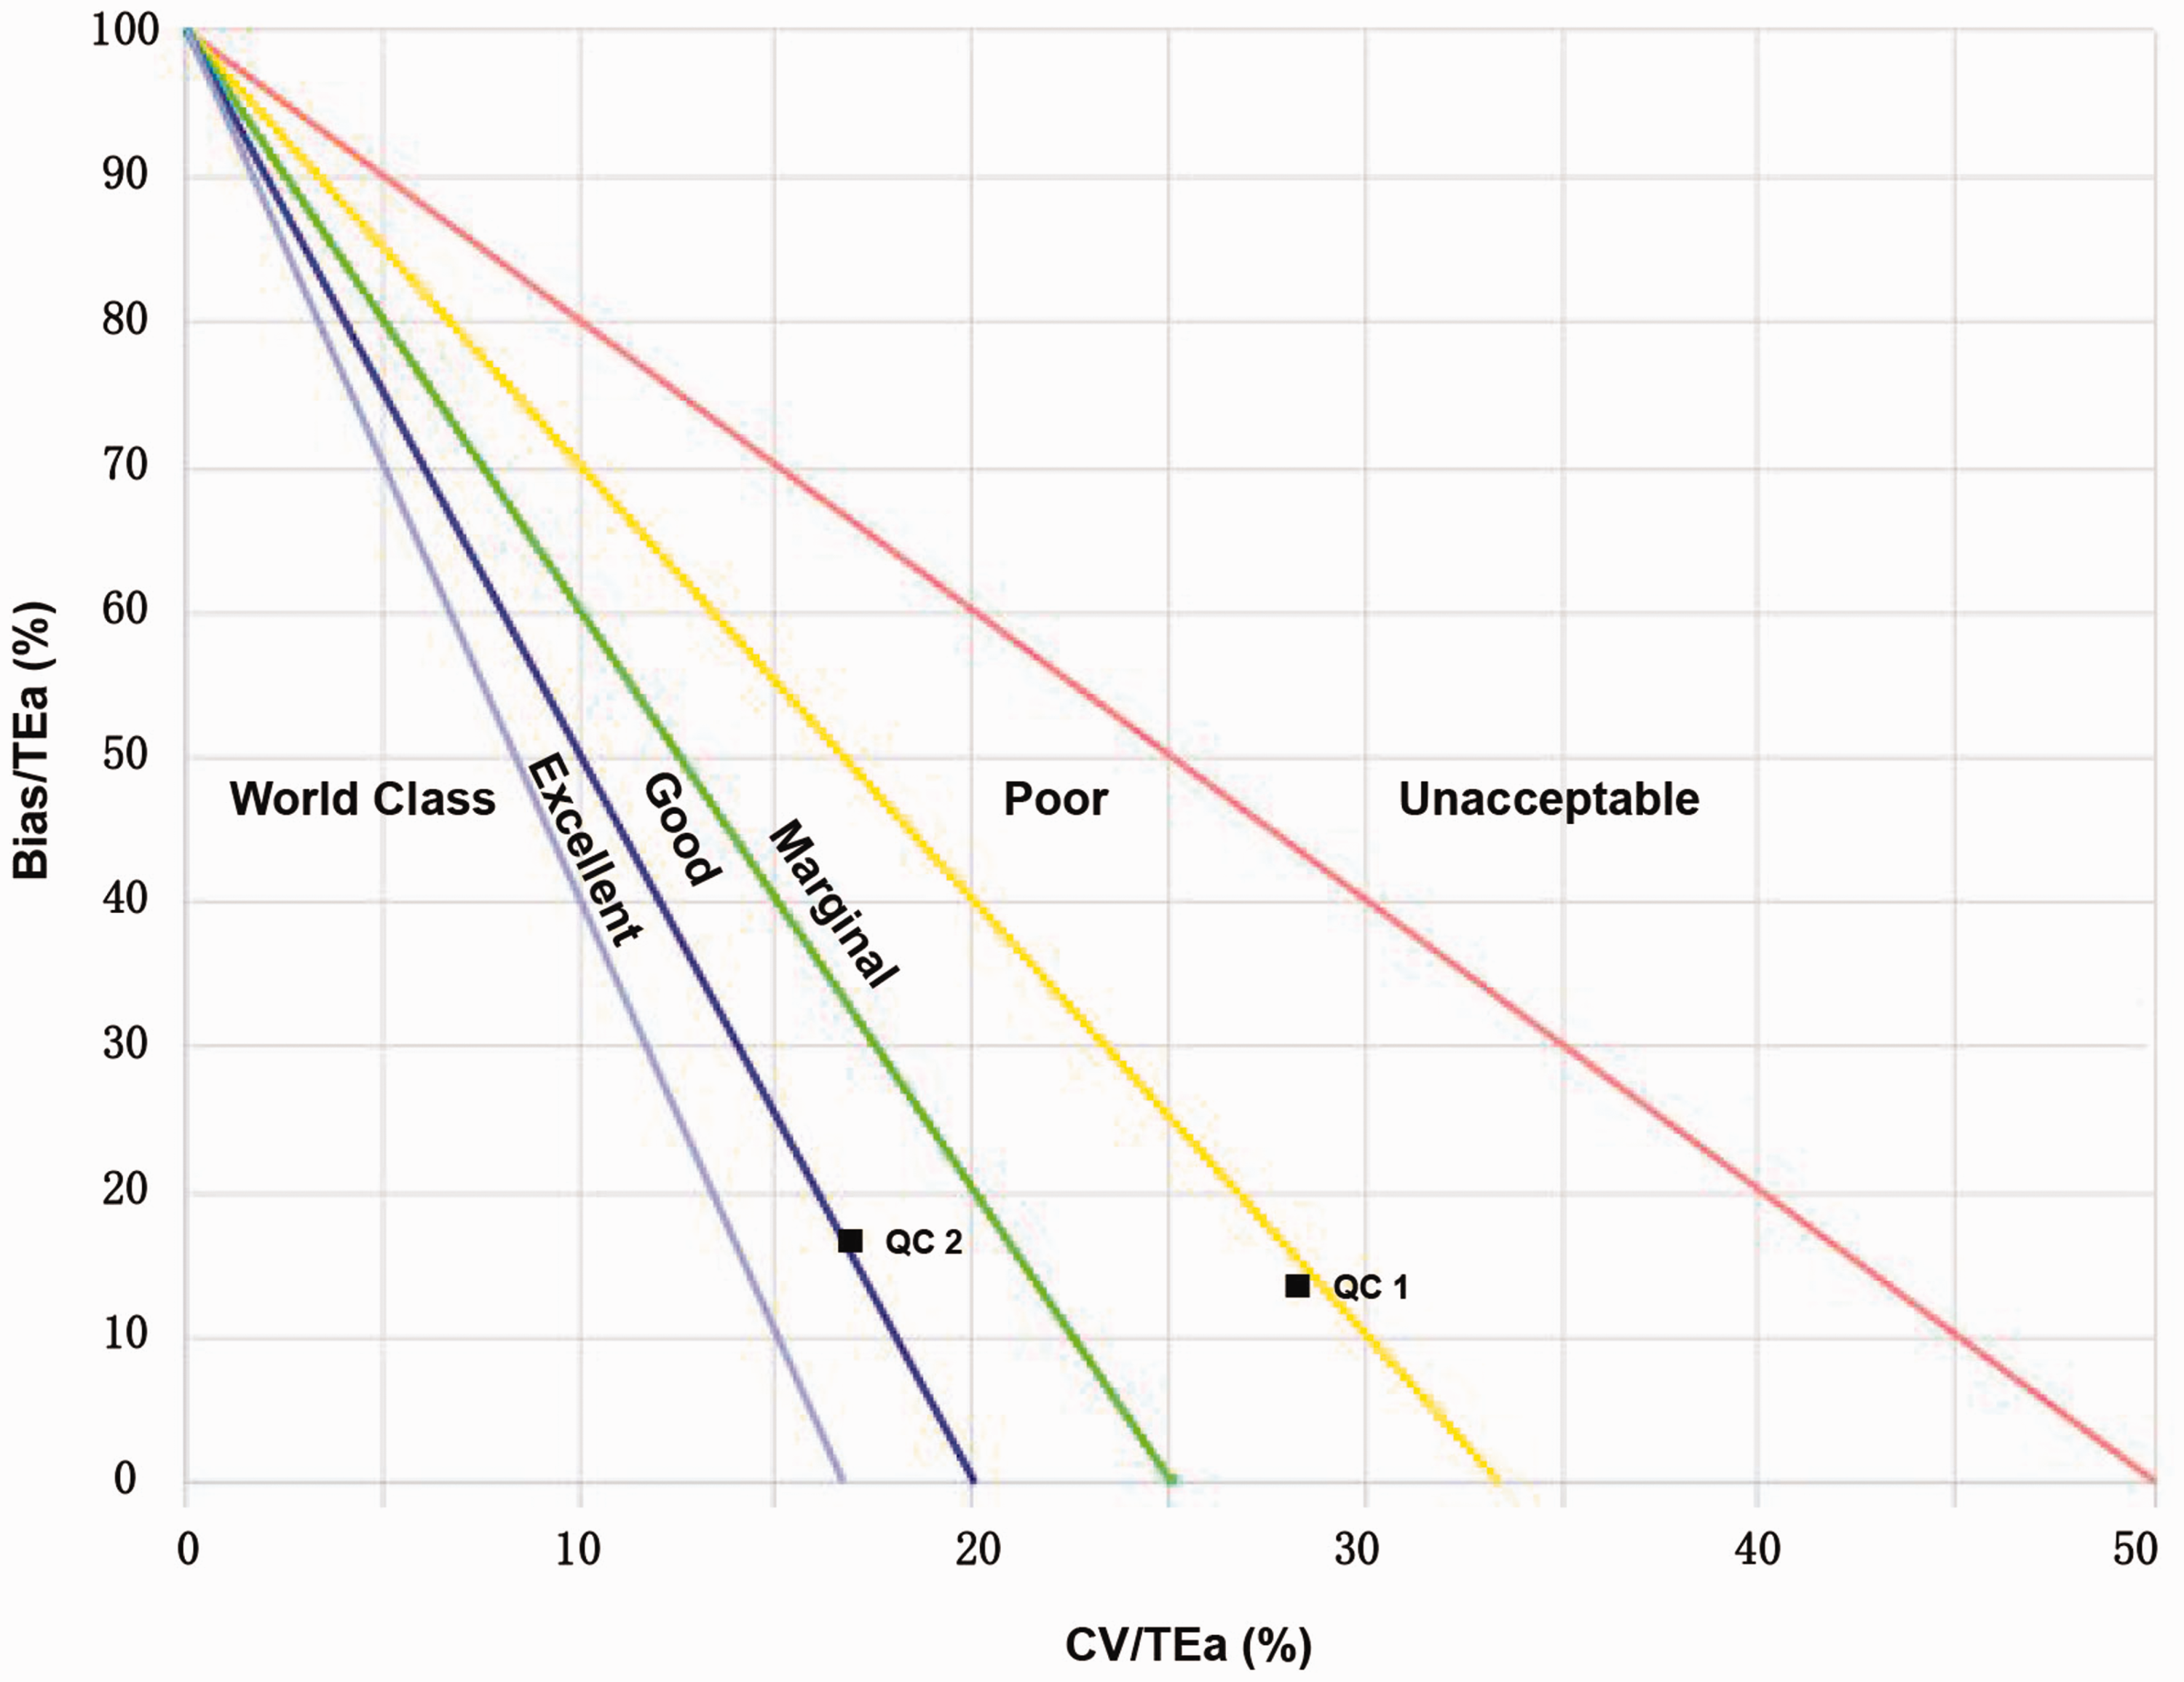
A standardized sigma performance verification diagram was constructed (Figure 1), according to the instructions available on www.clinet.com.cn. The name of the analyte, TEa, bias and CV values were entered in order. In Figure 1, the abscissa depicts CV/TEa(%), and the ordinate depicts bias/TEa(%), which was divided into six regions that represent the different analytical performances of the analyte. From the bottom left to the top right, Figure 1 depicts sigma values greater than 6 (world-class), between 5 and 6 (excellent), between 4 and 5 (good), between 3 and 4 (marginal), between 2 and 3 (poor) and less than 2 (unacceptable). 14
Standard sigma performance verification chart for cystatin C.
IQC scheme and improvement measures
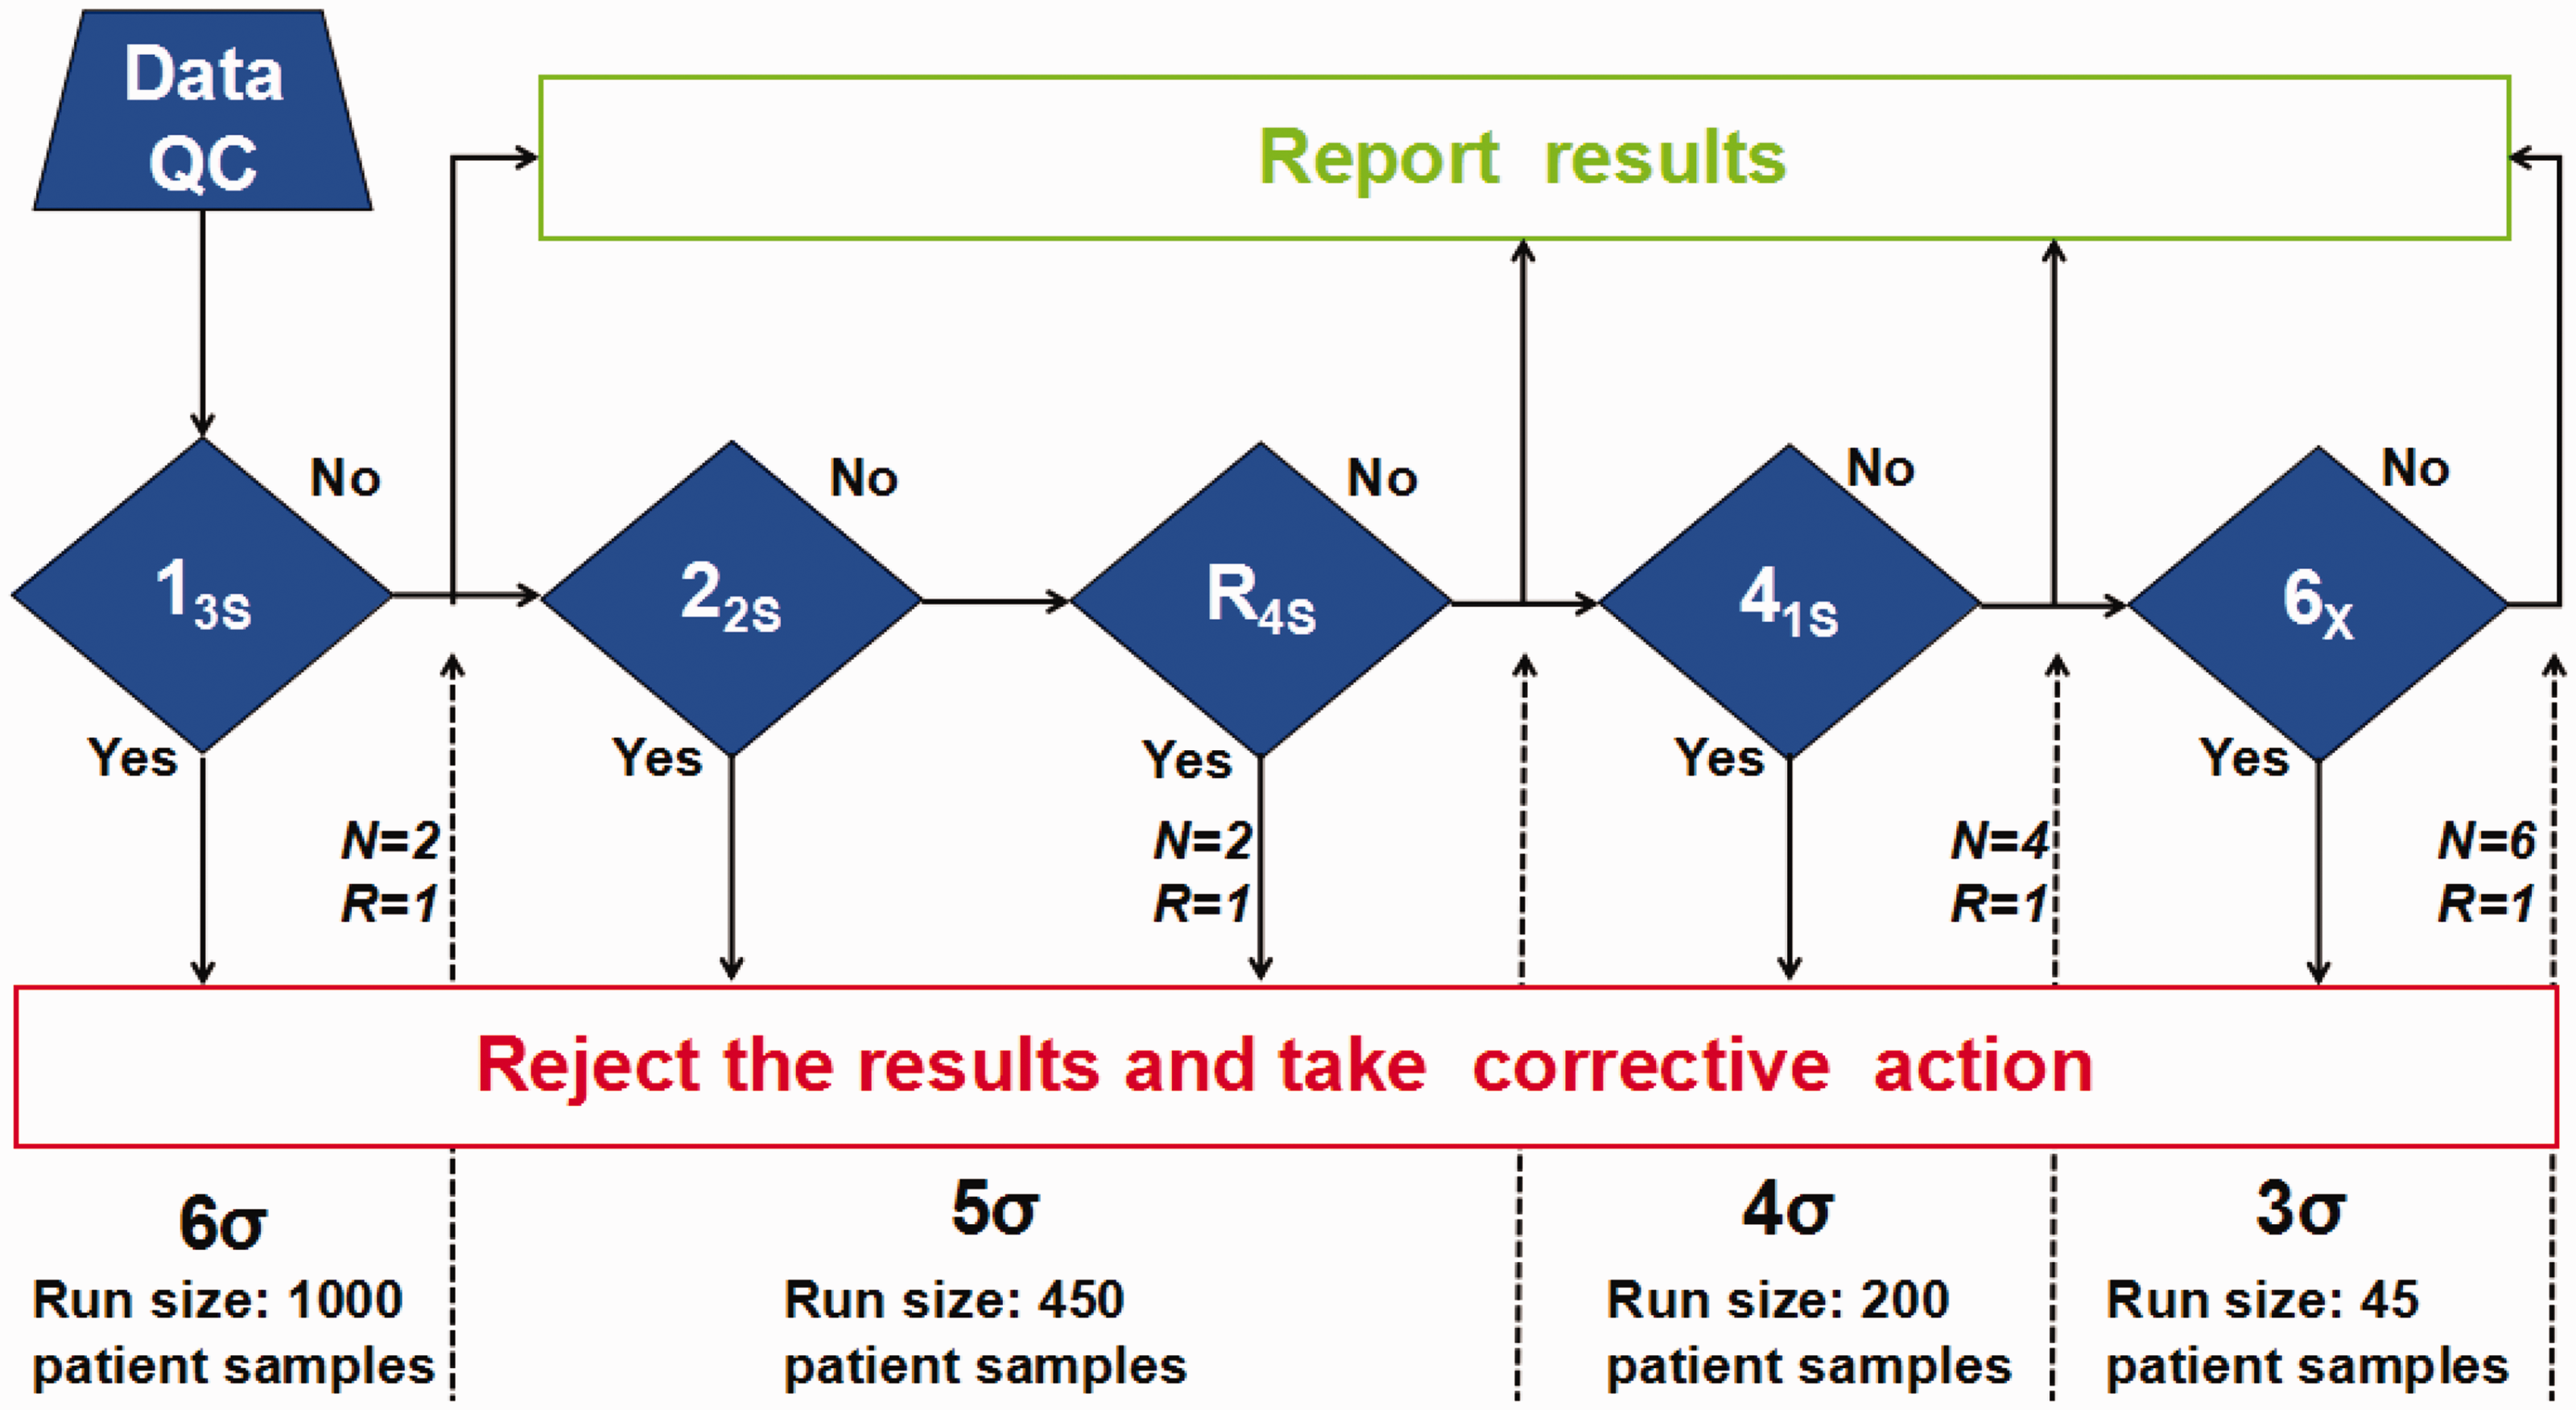
An individualized IQC scheme for cystatin C was formulated by applying Figure 2 (Westgard sigma rules with batch size), which was obtained from the website http://www.clinet.com.cn/sigmapv/#sgm4. In addition, the power function graph, provided by Q-expert Quality Management Software (Qualab Biotech Co., Shanghai, China), was used to evaluate the performance characteristics of the QC method. 15 Moreover, the quality goal index (QGI) for cystatin C was applied, which is calculated for sigma values less than 6 to determine the causes of poor performance and the corresponding improvement measures. QGIs were calculated using the formula: QGI=bias(%)/1.5×CV(%). A QGI value of less than 0.8 indicates that precision is the primary factor affecting analytical performance and it must be improved prior to the implementation of any other improvement measures. A QGI value greater than 1.2 indicates that accuracy is the primary factor affecting analytical performance and must be improved prior to the implementation of any other improvement measures. A QGI value between 0.8 and 1.2 indicates that both precision and accuracy are affecting analytical performance and both must be improved. 16
Westgard sigma rules with batch size.
Results
Distribution of sigma metrics for different concentrations of cystatin C
Using the desirable specification derived from the biological variation as the quality goal for our laboratory, we found differences in the sigma values calculated for different concentrations of cystatin C. At the level of QC 1, the sigma value of cystatin C was 3.04, with an analytical performance of ‘marginal’. However, at the level of QC 2, the sigma value of cystatin C was 4.95, with an analytical performance of ‘good’ (Figure 1 and Table 3).
Distribution of sigma values for two concentrations of cystatin C.
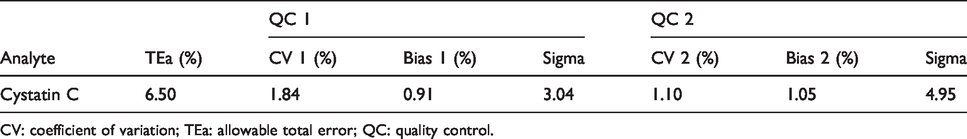
CV: coefficient of variation; TEa: allowable total error; QC: quality control.
IQC strategy and improvement measures for cystatin C
Individualized IQC schemes for cystatin C were designed based on its analytical performance and the Westgard sigma rules with the batch size. With a sigma value of 4.95 for cystatin C at the QC 2 level, the 13s/22s/R4s/41s multirules (n = 4, R = 1), with a batch size of 200 patient samples, was recommended. However, with a sigma value of 3.04 for cystatin C at the QC 1 level, the 13s/22s/R4s/41s/6x multirules (n = 6, R = 1), with a batch size of 45 patient samples, were used for the IQC scheme of cystatin C. Besides, we also used the power function graph to evaluate the performance of the IQC scheme for cystatin C. Our study showed a probability for error detection (Ped) of 94%, 100% and a probability for false rejection (Pfr) of 4%, 2% based on the levels of QC1, QC2 respectively. In addition, the results also indicated that QGI values of cystatin C for the QC 1 and 2 levels were 0.33 and 0.64, respectively, indicating that the precision was the primary factor affecting analytical performance. Therefore, precision requires improvement prior to any other improvement measures (Figures 2 and 3).
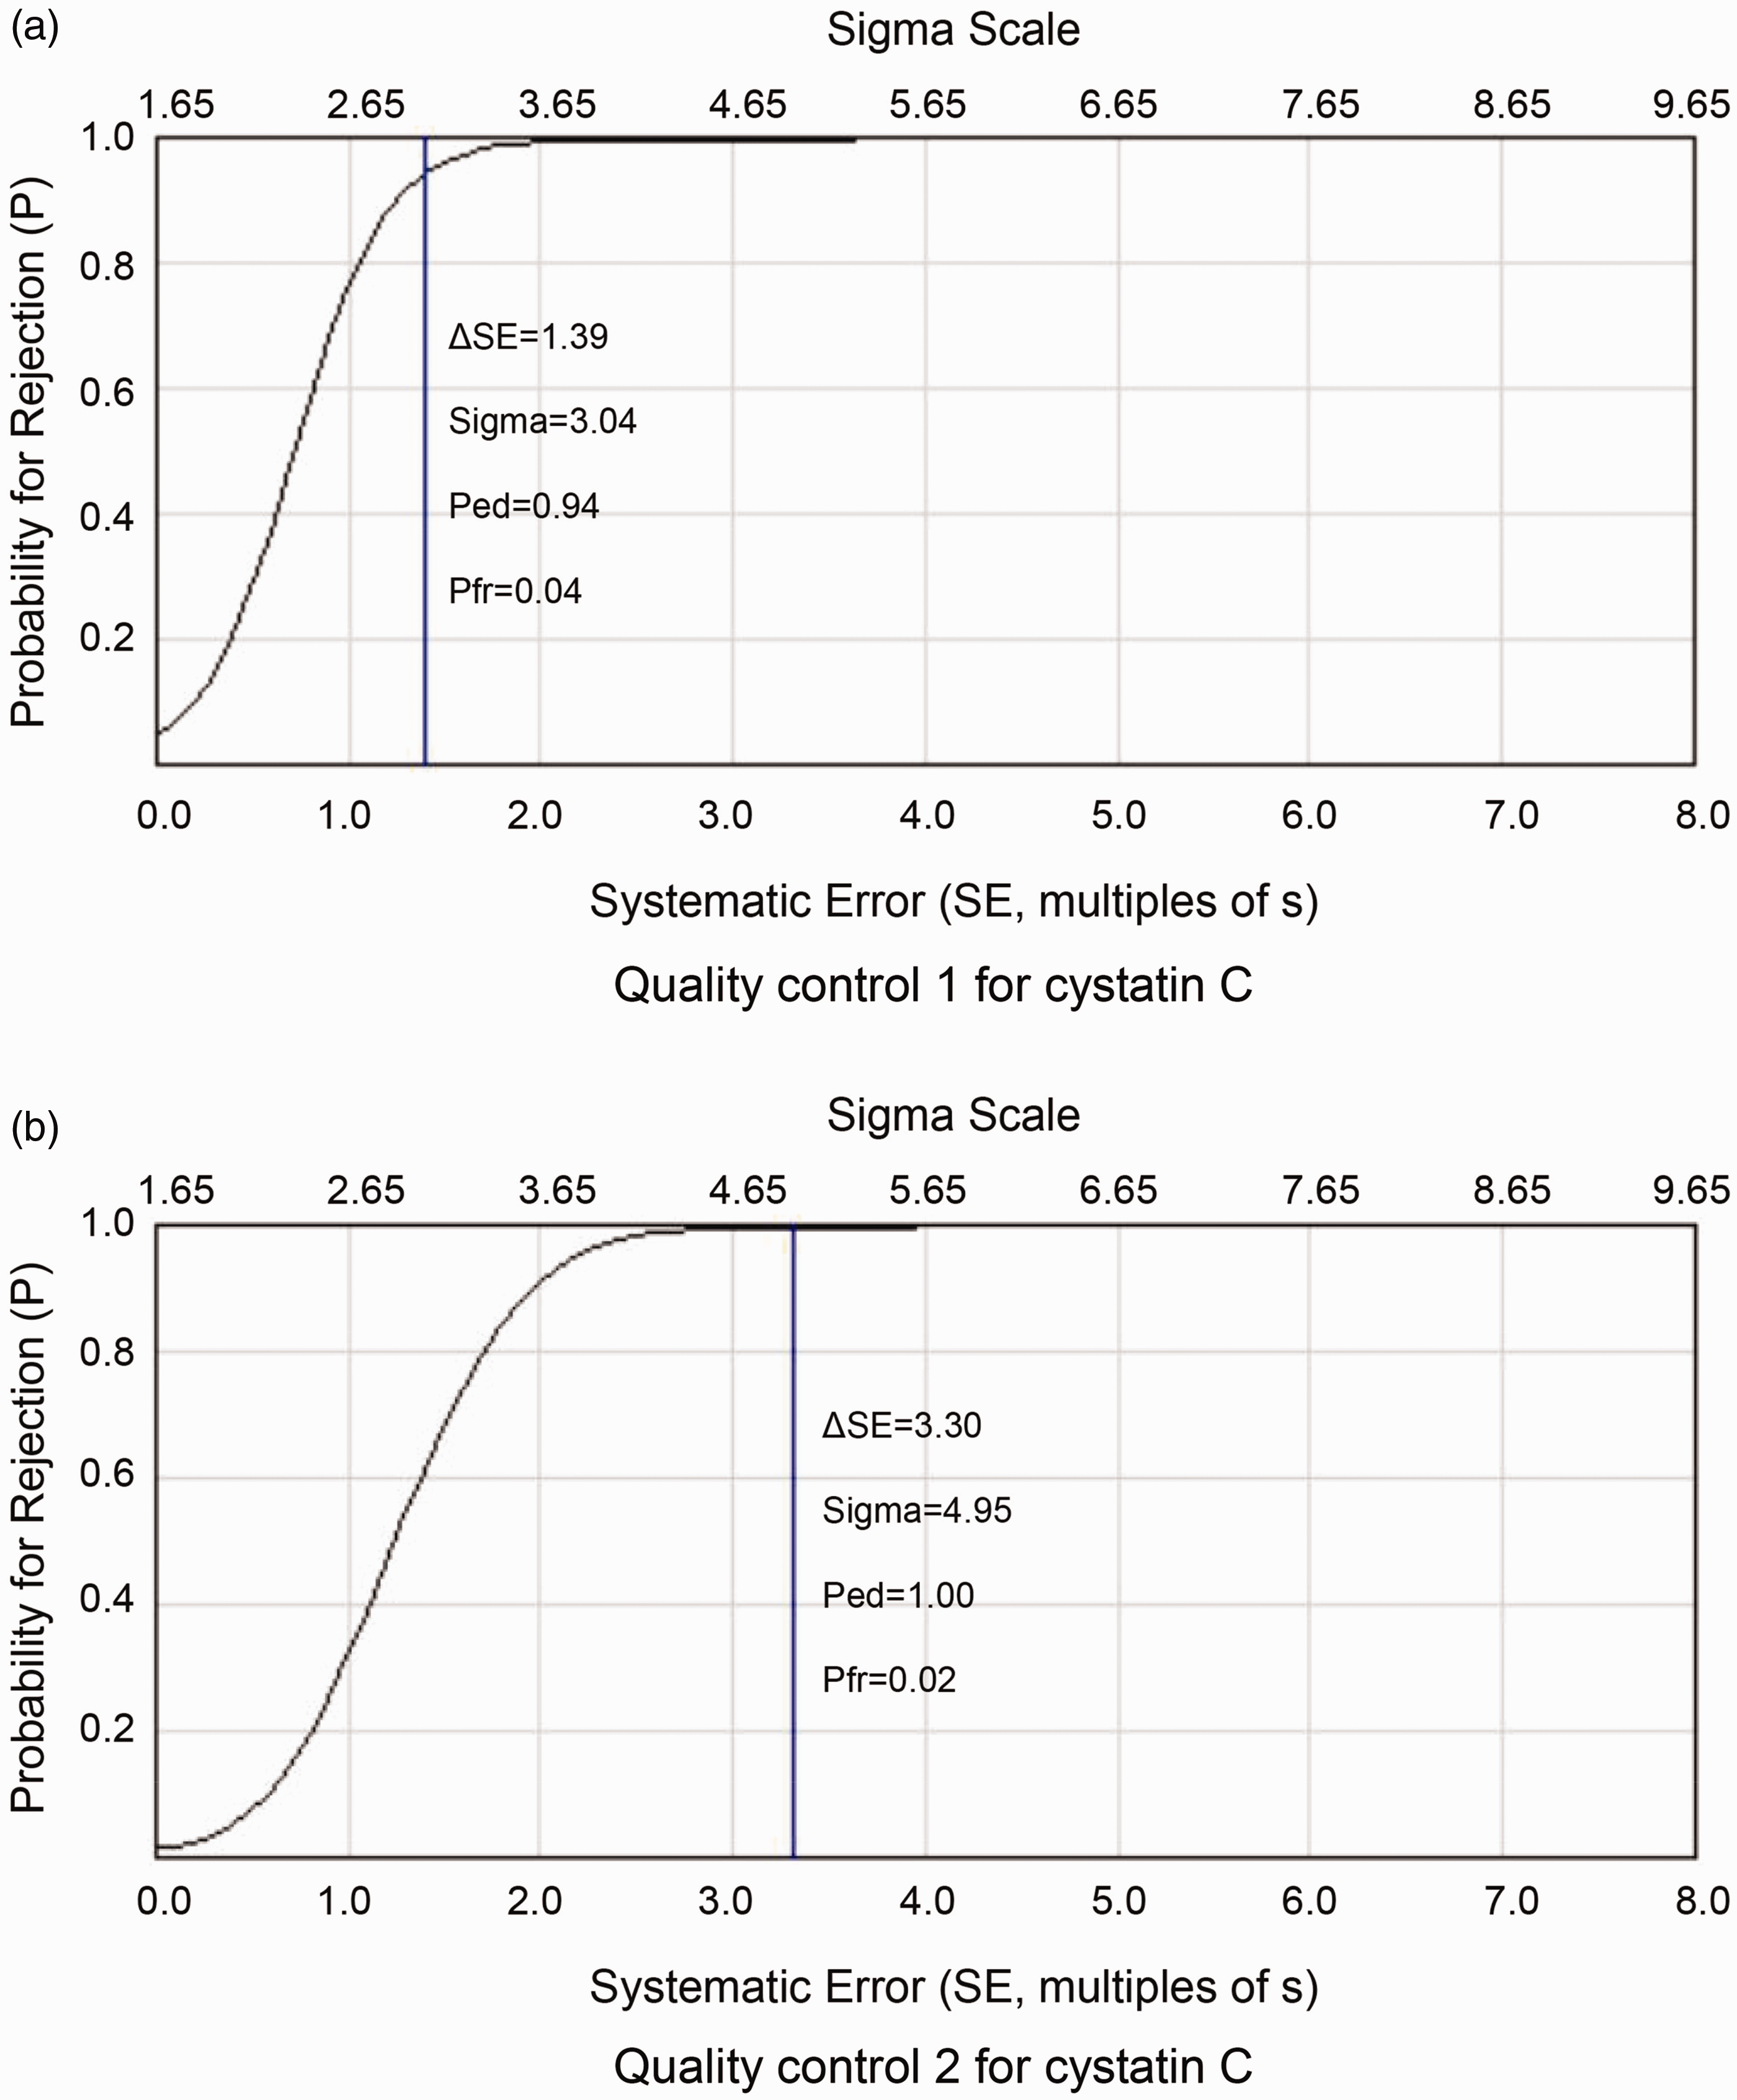
Power function graph for different levels of cystatin C. (a) quality control 1, using 13s/22s/R4s/41s/6x multi-rules; (b) quality control 2, using 13s/22s/R4s/41s/6x multi-rules.
Discussion
The sigma symbol represents the ‘standard deviation’ in mathematical statistics, and its value usually reflects the testing quality level. 17 Six sigma represents a ‘world-class’ quality level, indicating that for every one million products (or services), only 3.4 defects can be detected, which is the expected quality goal. 17 The calculation of sigma depends on three variables: TEa, precision and accuracy. TEa represents the quality goals selected by the laboratory, and previous studies have shown that there are significant differences in sigma levels for the quality goals used for the same analytes in the same laboratories.18,19 Thus, based on the model developed at the Milan Conference, 20 the desirable specification derived from biological variation was selected as the quality goal for cystatin C, and the sigma values were calculated based on the concentrations of two IQC materials. Our study found differences in the analytical performance for cystatin C at different concentrations. When cystatin C was at QC 2 levels, analytical performance reached a sigma value close to 5. However, analytical performance decreased slightly at the QC 1 level, with a sigma value between 3 and 4. Wang et al. 21 applied sigma metrics to the evaluation of analytical performance for urinary albumin and revealed significant performance differences when the analyte levels differed. Furthermore, Đido et al. 22 applied sigma metrics to the evaluation of the analytical performance for serum enzymes and showed significant differences in the sigma values for analytes at different concentrations.
Our research findings are consistent with the above studies. Hence, our study confirmed that when sigma metrics are used to evaluate the analytical performance for an analyte, the sigma metrics should be adjusted according to the concentration of the analyte in question, especially analyte levels associated with medical decision-making, to ensure the objective and reasonable evaluation of analytical performance. Our study investigated the analytical performance of cystatin C at different concentrations by applying a standardized sigma performance verification chart. The chart is simple and clear, which can help laboratories easily determine their analytical performance for cystatin C.
Once a quality goal has been determined by a laboratory, the sigma value should reflect the changes in precision and accuracy.23,24 Precision is usually expressed as the long-term cumulative CV in each laboratory, which is a feasible assessment for conventional laboratories to perform using data over a six-month period.23,24 For assessments of accuracy, reference measurement procedures or reference materials are preferred. 25 Because a reference measurement procedure has not yet been established for cystatin C and the concentration of its reference substance is much higher than the upper limit of its reference interval, EQA samples were used as candidate materials for the evaluation of cystatin C measurement accuracy. Based on the concentrations of two QC levels of cystatin C, we selected two EQA samples that had similar concentrations to the IQC material. This approach ensured that the sigma metrics applied to cystatin C at different concentrations were objective and reasonable.
Westgard et al.26–29 have long been engaged in the field of laboratory quality management and have updated many quality control strategies. However, laboratories do not apply laboratory quality control measures uniformly and the implementation of laboratory quality control measures can often be associated with difficulty and confusion.30,31 When a laboratory does not evaluate the analytical performance of each analyte using the sigma metric approach, the true capacity of the laboratory cannot be accurately reflected, and they may implement inappropriate IQC schemes.
The IQC schemes used in our laboratory applied the 13s/22s/R4s/41s/10X multirules for all analytes, but detection efficiency was not being evaluated effectively. Therefore, whether the multirules met the requirements for testing quality was impossible to determine. Based on the sigma metrics for cystatin C and the Westgard sigma rules with batch size, this study established an individualized IQC scheme for cystatin C, which applied the 13s/22s/R4s/41s/6x multirules and a batch size of 45 patient samples.
Westgard et al. 27 also showed that using different batch sizes for different sigma values facilitates the development of appropriate QC strategies for laboratories and reduces patient risk. The performance characteristics of the QC method included Ped and Pfr. The QC method generally meets the requirements for testing quality when Ped is greater than 90% and Pfr is less than 5%.28,29 Our study showed that when cystatin C was applied to the above QC scheme, the Ped and Pfr values of QC 1 and 2 levels all met the requirements for testing quality. In this study, the IQC scheme for cystatin C was formulated by applying sigma metrics, which significantly increased Ped, reduced Pfr, reduced costs and reduced time waste associated with the processing of false out-of-control signals, which will reduce the time needed for patients to obtain reports.
In addition, because the sigma value for cystatin C at the QC 1 level was lower than 6, based on the QGI calculation, precision must be improved. Verma et al. 32 evaluated analytical performance for 16 clinical analytes using sigma metrics and developed quality improvement measures based on QGI calculations. Therefore, to improve the analytical performance for cystatin C, we plan to establish the following quality improvement programs: (1) strengthen the maintenance and repair procedures for the automatic biochemical analyser; (2) improve the training of team members to ensure that QC products, calibrators and instruments meet specifications; (3) select reagents from different manufacturers for comparative testing, objectively evaluate their analytical performance and select kits whose quality meets the requirements and (4) dynamically evaluate the sigma values for each analyte to ensure the continuous improvement of laboratory testing capabilities.
However, the limitations of our study merit discussion. First, TEa (quality goal) is an important parameter that affects sigma metrics. Therefore, setting the TEa value in each laboratory is very important. If the selected TEa value is too large (minimum specification derived from the biological variation for cystatin C was 9.70%) or too small (optimum specification derived from the biological variation for cystatin C was 3.20%), 13 the sigma metrics will overestimate or underestimate the analytical performance. Unfortunately, no accepted standards exist to guide laboratories when choosing quality goals. Therefore, our study selected the desirable specification derived from biological variation for the evaluation of analytical performance for cystatin C. Second, EQA samples provided by the NCCL were selected to perform bias assessments in this study. However, the target value of the EQA samples was not a ‘true’ value because it was not derived using a reference measurement procedure but instead used the average value from all of the participating laboratories. Third, uncertainty is involved in the entire measurement process. 33 However, we ignored the impact of uncertainty for cystatin C on the research results. Therefore, we need to pay more attention to the measurement uncertainty of analytes to ensure that the results are more scientific and reliable in the future.
In conclusion, a TEa of 6.50% (derived from the ‘desirable’ biological variation) and the Westgard rule 13s/22s/R4s/41s/6x (n = 6, R = 1, batch size of 45) with a high efficacy for determining the detection error is recommended for individualized IQC schemes of cystatin C.
Footnotes
Acknowledgements
We would like to thank Jiahao Zhu, application engineer of Qualab Biotech Co., who gave important technical assistance.
Declaration of conflicting interests
The author(s) declared no potential conflicts of interest with respect to the study, authorship, and/or publication of this article.
Funding
The author(s) disclosed receipt of the following financial support for the research, authorship, and/or publication of this article: This research was funded by Jiangsu Commission of Health (M2020079), Key Project of Scientific Research Development Fund of Kangda College of Nanjing Medical University (KD2019KYJJZD010), and the Health Scientific Research Project in Lianyungang (201817).
Ethical approval
Not applicable.
Guarantor
FMY.
Contributorship
QL and FMY conceived and designed the experiments. QL, WJZ, GRB and CXZ performed the experiments. WL, QL and WJZ analysed the data. QL, WJZ and FMY wrote the paper.