
Abstract

Melatonin is mainly produced by the pineal gland and has been identified as a regulatory hormone in circadian rhythms. 1 Moreover, increasing evidence demonstrates a role for melatonin in anticancer and antimetastatic activity. 2
Melatonin secretion normally follows a light-dark cycle that itself follows the sleep-wake rhythm of the individual. 1 Melatonin concentrations are low during daytime, rise in the evening and peak at night. Serial measurements are used to evaluate the time at which the concentration is above a certain level, the ‘dim light melatonin onset’ (DLMO). This is used to evaluate circadian rhythm disorders and/or fine-tune timing of oral melatonin therapy intake, and can be defined as the time at which concentrations exceed a cut-off of 3–4 pg/mL when measured in saliva, or alternatively as twice the basal level. 3 More detailed melatonin secretion profiles might assist in the assessment of non-classically presenting sleeping disorders. 4
Melatonin secretion profiles require accurate measurement of the hormone at low concentrations. Saliva is usually preferred to blood, first, because it contains the unbound (active) fraction of melatonin and, second, because salivary sampling is noninvasive and can be achieved in a non-clinical setting. However, some research suggests local production of melatonin in the salivary glands. 5
Until recently, radioimmunoassays (RIA) were most commonly used for melatonin analysis. Other methods have been developed, e.g. gas chromatography coupled to mass spectrometry (GC-MS). Due to cross-reactivity and assay heterogeneity in RIA, and the laborious nature of GC-MS analysis, several liquid chromatography coupled to mass spectrometry (LC-MS/MS) methods have been developed. 5
No information is available on agreement of LC-MS/MS methods for melatonin. Here we report a comparison between two different LC-MS/MS methods on the one hand and a conventional RIA on the other for the analysis of salivary melatonin. The RIA (Bühlmann, Schönenbuch, Switzerland) and a LC-MS/MS method developed in-house (method A) are used in a routine setting; the other LC-MS/MS method (method B) is only used in a research setting and is described elsewhere. 5 Method A consists of solid-phase extraction followed by evaporation. The reconstituted sample is separated using C8-reversed-phase chromatography followed by mass spectrometric detection on a QTRAP 3200 (ABI Sciex, Foster City, CA, USA). No reference method is available for melatonin measurement, but method A is calibrated every run with Certified Reference Material (CRM, Cerilliant, TX, USA).
Assay precision was evaluated using a modified Evaluation Protocol 5 (EP5) of the Clinical and Laboratory Standards Institute (CLSI) (duplicate measurements, three levels, 10 days, two runs per day), while an EP6 protocol (duplicate measurements, five levels, five days) was used to assess linearity. CV of both LC-MS/MS methods was <10% throughout the measured range; they were both linear up to at least 60 pg/mL. The RIA showed higher inter-assay variation in the low range (CV = 16.2%) and linearity up to 40 pg/mL according to the assay method sheet. 6 The limit of quantitation (LoQ) (the lowest concentration with a CV < 20%) was <1 pg/mL and 0.9 pg/mL for method A and B, respectively. 5 The method sheet of the RIA claims a LoQ of 0.9 pg/mL (defined as CV < 10%), which is discrepant with the precision study which claims an intra-assay variation of 10% at 1.9 pg/mL. 6 Method comparisons of the LC-MS/MS method A and RIA, compared to method B, were performed using CLSI ‘alternate comparison’ protocols on discarded patients’ samples ranging up to 43 pg/mL. The data are represented in Figure 1(a) (method B vs. method A) and (b) (method B vs. RIA) and include the Deming regression analyses. Regression analysis revealed that the two LC-MS/MS methods showed high agreement and low variability across the measurement range. In contrast, the agreement between the RIA and method B showed much greater variance
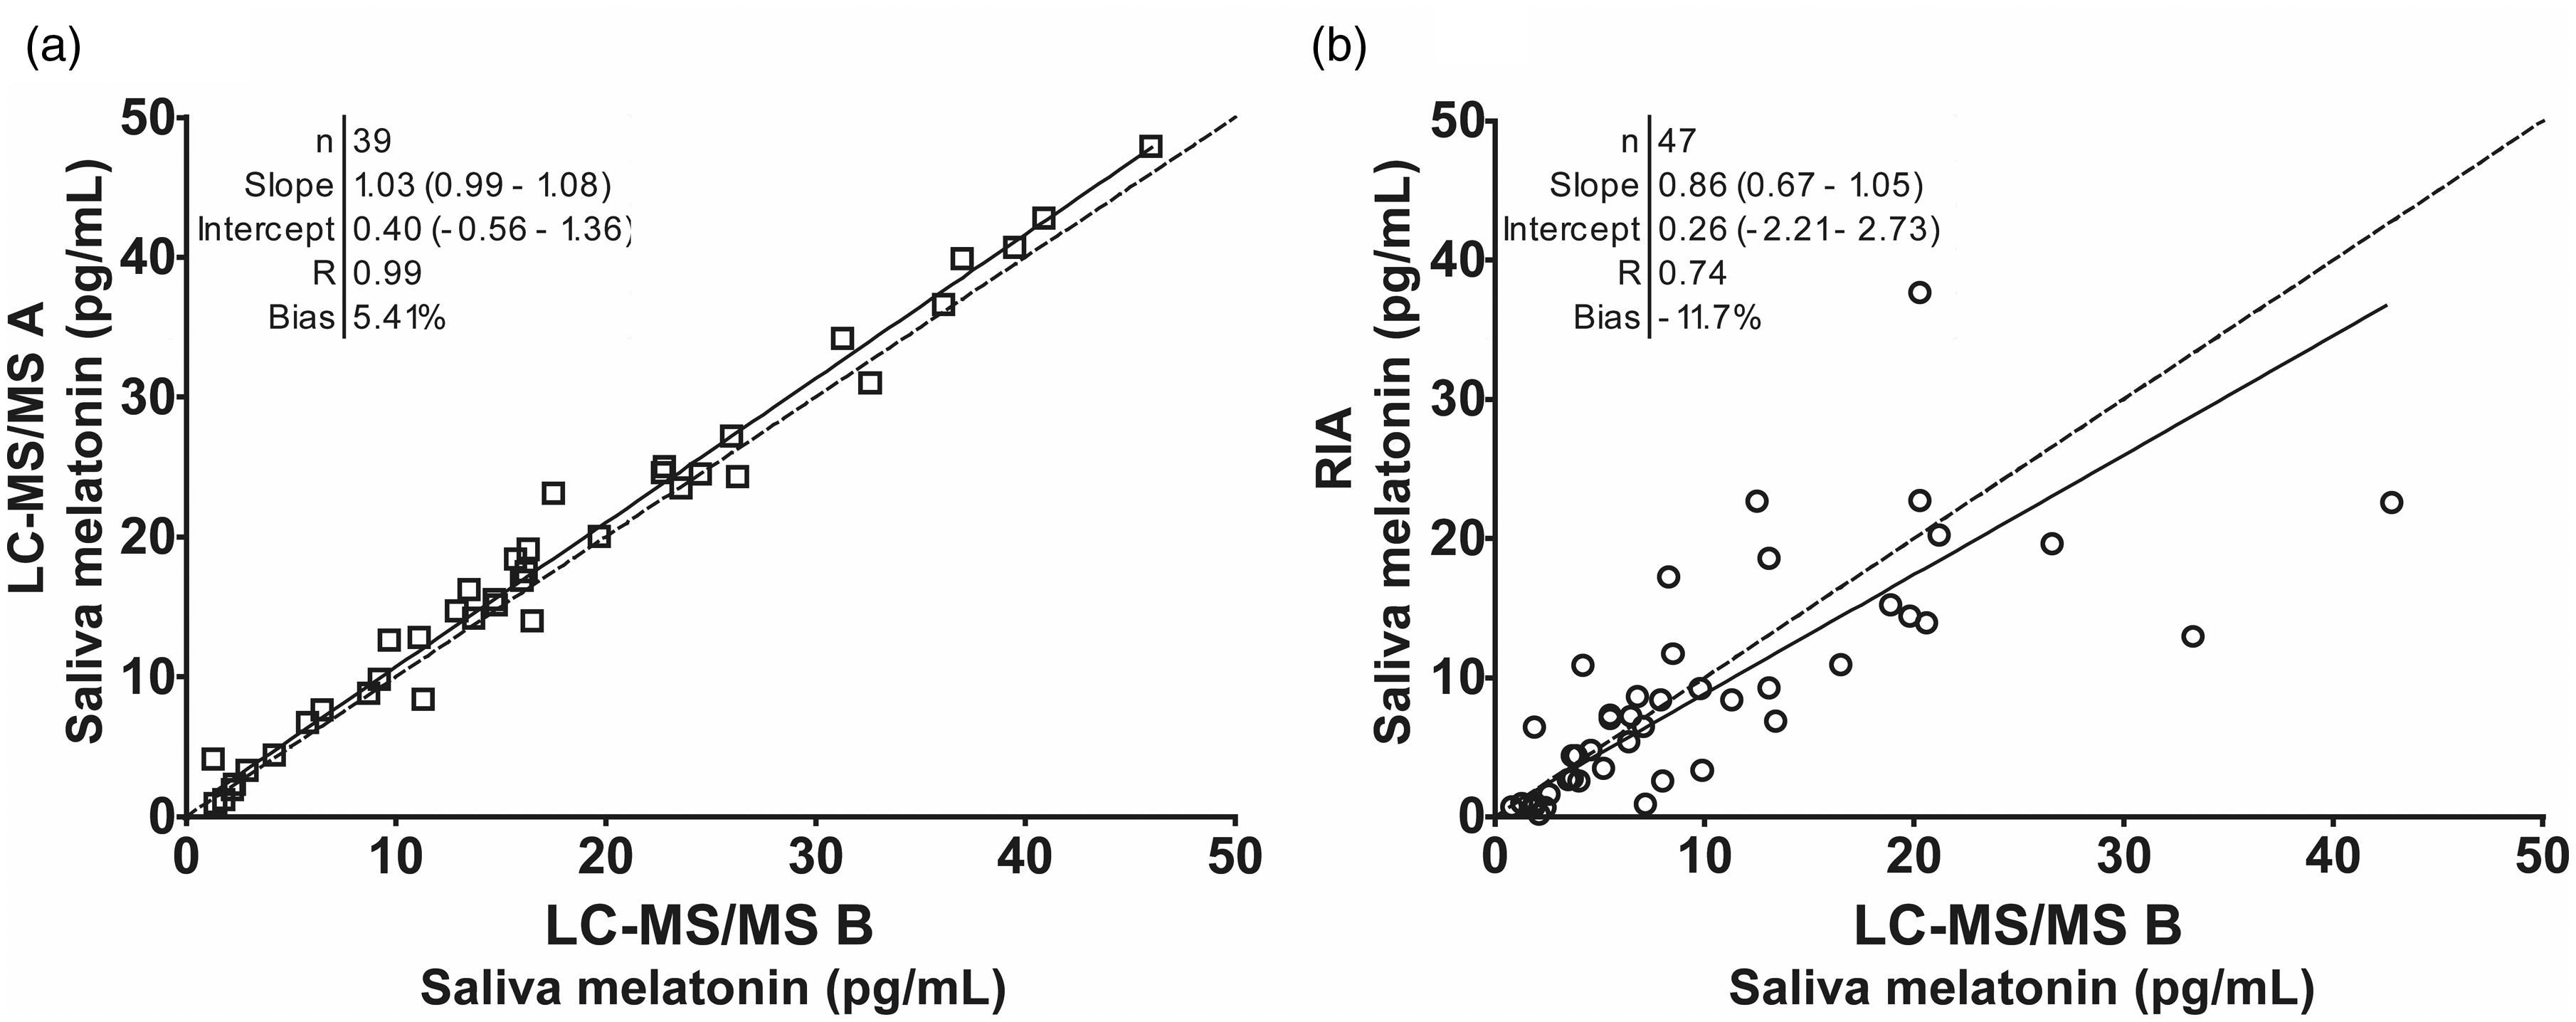
Alternate method comparison of three melatonin assays. (a) LC-MS/MS method B vs. A, data shown as open squares. (b) LC-MS/MS B vs. RIA, data shown as open circles. In both figures, the solid line depicts the Deming regression fitted curve and the dashed line indicates the diagonal (x = y). Both figures contain Deming regression statistics: n, slope (95% CI), intercept (95% CI), R, and bias.
In this study, the LC-MS/MS methods out-performed the RIA in both precision and trueness, the latter defined by CRM calibration of method A. However, similar functional sensitivity and linearity were observed between the three methods. This improved performance of LC-MS/MS over immunoassay is consistent with the findings of Faassen et al. 5 Improved analytical performance can be crucial in producing accurate DLMO measurements and melatonin secretion profiles in the diagnosis of sleeping disorders, as well as increased accuracy and reliability in melatonin-related research.
Footnotes
Acknowledgements
None.
Declaration of conflicting interests
The author(s) declared no potential conflicts of interest with respect to the research, authorship, and/or publication of this article.
Funding
The author(s) received no financial support for the research, authorship, and/or publication of this article.
Ethical approval
Not applicable.
Guarantor
JGK.
Contributorship
JK, RB, LM, LR, IK conceived the study and designed the experiments. ES, MF, HW collected samples, executed the experiments and gathered and analysed the data. PK analysed the data and wrote the first draft of the manuscript. All authors reviewed and edited the manuscript and approved the final version of the manuscript.