
Abstract
A recent paper
1
evaluated the effects of low-end censoring and differing method uncertainties on Bland-Altman plots.
2
In particular, differing uncertainties were shown to produce an unexpected but systematic diagonal tilt in plots of differences versus means (i.e. a parallelogram shape), thereby producing bias additional to that generated by data censoring alone. However, in a recent personal communication, Prof. DM Hawkins (School of Statistics, University of Minnesota) pointed out that the optimum estimate of the mean is not the simple average (i.e. (A + B)/2 in the case of paired A and B values), but a weighted average

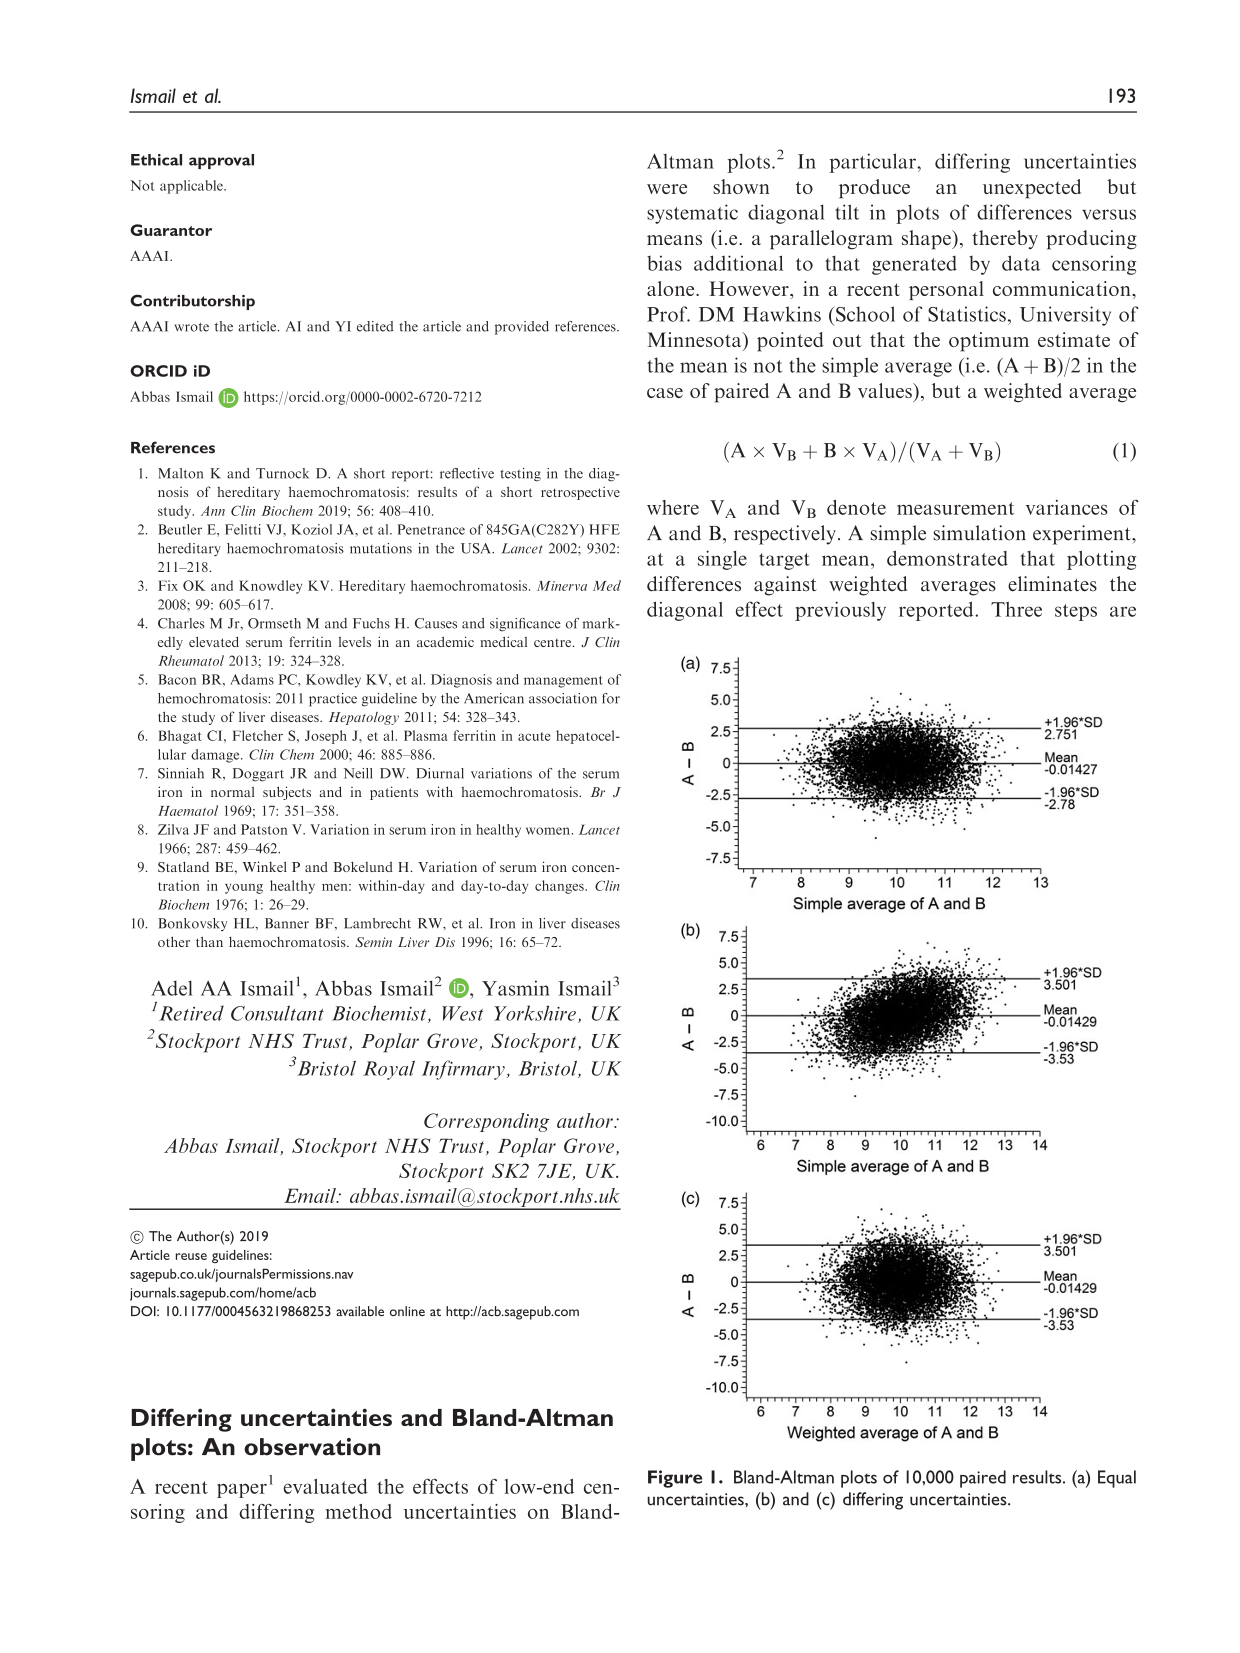
where VA and VB denote measurement variances of A and B, respectively. A simple simulation experiment, at a single target mean, demonstrated that plotting differences against weighted averages eliminates the diagonal effect previously reported. Three steps are involved: (i) randomly draw 10,000 paired A, B results from two Gaussian distributions each with Mean = 10 and SD = 1.0, and plot (A–B) differences against simple averages; (ii) repeat the experiment using the same sequence of pseudorandom numbers with the alteration that the Gaussian distribution generating A values has SD = 1.5; (iii) plot differences against simple averages and also against weighted averages, i.e. (A + 2.25B)/3.25. Figure 1 shows the results.
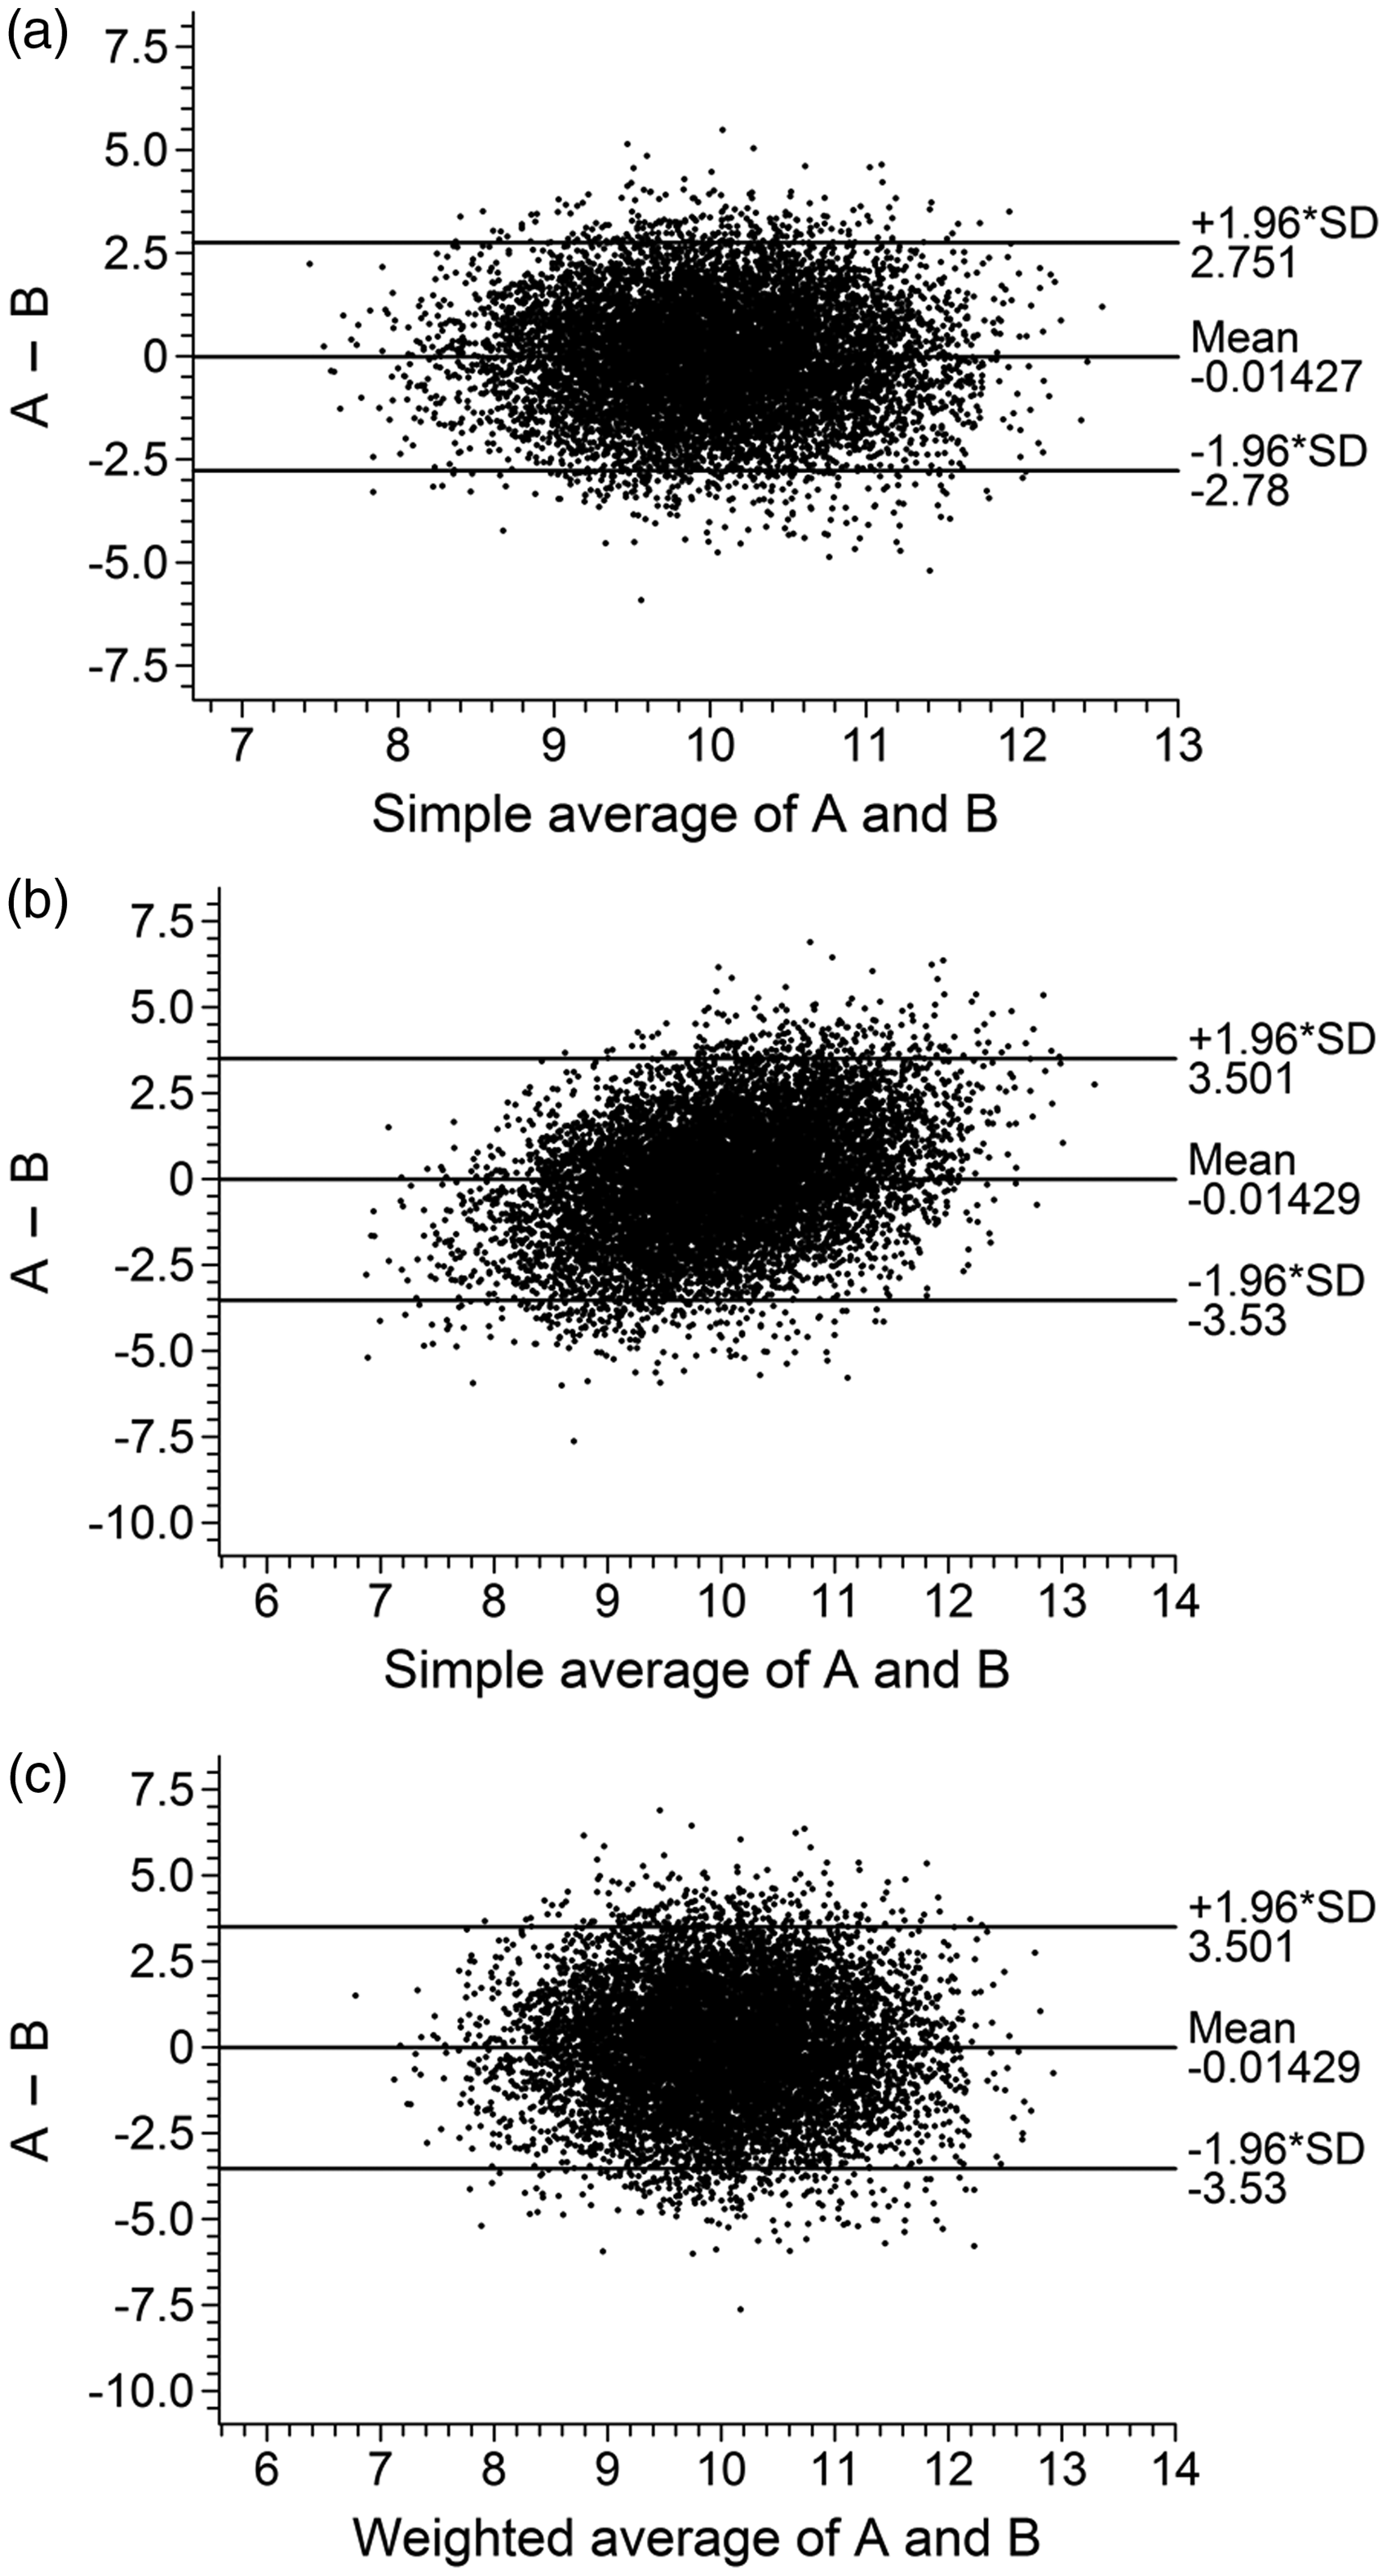
Bland-Altman plots of 10,000 paired results. (a) Equal uncertainties, (b) and (c) differing uncertainties.
In all cases, Bland-Altman summary results were completely in accordance with expectation and were identical in the differing uncertainty cases (Figure 1(b) and (c)), as calculations depend solely on observed (A–B) differences. 95% limits of agreement enclosed 95.02% of the data points in Figure 1(a) and 95.12% in Figure 1(b) and (c). Figure 1(b) and (c) data patterns represent further information on the ‘diagonal’ effect. The underlying cause is a matter for theoreticians.
In practice, it is feasible that, with duplicate measurements, variance functions could be estimated for both sets of paired results, thereby allowing predicted VA and VB values to be used in conjunction with equation (1), but that would add another level of complexity to Bland-Altman analyses. Is it worth the effort? Probably not. When methods have differing uncertainties, low-end censoring will always generate spurious biases regardless of how averages are calculated. The key factor is retrieval and use of actual rather than censored results. 1
Footnotes
Declaration of conflicting interests
The author(s) declared no potential conflicts of interest with respect to the research, authorship, and/or publication of this article.
Funding
The author(s) received no financial support for the research, authorship, and/or publication of this article.
Ethical approval
Not applicable.
Guarantor
WAS.
Contributorship
Sole authorship.