
Abstract
Background
The Six Sigma theory is an important tool for laboratory quality management. It has been widely used in clinical chemistry, haematology and other disciplines. The aim of our study was to evaluate the analytical performance of plasma proteins by application of Sigma metric and to compare the differences among three different allowable total errors in evaluating the analytical performance of plasma proteins.
Methods
Three different allowable total error values were used as quality goals. Data from an external quality assessment were used as bias, and the cumulative coefficient of variation in internal quality control data was used to represent the amount of imprecision during the same period. Sigma metric of analytes was calculated using the above data. The quality goal index was calculated to provide corrected measures for continuous improvements in analytical quality.
Results
The Sigma metric was highest using the external quality assessment standards of China: it was sigma ≥6 or higher in 57.1% of plasma proteins. But Sigma metric was lower by using RiliBÄK or biological variation standards. IgG, C3 and C-reactive protein all required quality improvements in imprecision. A single-rule 13s for internal quality control was recommended for IgA, IgM, C4 and rheumatoid factor, whereas multiple rules (13s/22s/R4s) were recommended for IgG, C3 and C-reactive protein, according to the external quality assessment standards of China.
Conclusions
Different quality goals can lead to different Sigma metric for the same analyte. As the lowest acceptable standard in clinical practice, the external quality assessment standard of China can guide laboratories to formulate reasonable quality improvement programmes.
Introduction
The plasma proteins are the basis of the normal function of the body, and they are usually present in immunoglobulin A (IgA), immunoglobulin G (IgG), immunoglobulin M (IgM), complement 3 (C3), complement 4 (C4), C-reactive protein (CRP) and rheumatoid factor (RF). 1 Due to their wide utility in clinical diseases and continuous improvements in detection methods, plasma proteins have become an important evaluation index for disease diagnosis, progression and prognosis in a variety of specimens.2–4 Therefore, test result accuracy is directly related to the correctness of clinical diagnoses and the use of appropriate interventions.
Sigma represents the ‘standard deviation’ in mathematical statistics. The performance of the production process is usually measured by the million defect rate; Sigma is expressed as defects per million (DPM) opportunities. The goal of Six Sigma theory is to achieve a DPM of less than 3.4 per million. 5 Six Sigma has been used in industry for >30 years and has also been used in healthcare for decades. 6 It is an important method to evaluate the errors in quality management of different analytical tests. Sigma metric indicates how often errors are likely to occur. The higher the Sigma metric, the lower the chance of erroneous test results by the laboratory. It calculates an estimate of the exact number of errors by combining imprecision, bias and total allowable error (TEa). 7 Sigma metric has been widely used in clinical chemistry, haematology and other disciplines,8–11 but its application in the quality analyses of plasma proteins is rare. Hence, we aimed to evaluate the analytical performance of plasma proteins by application of Sigma metric and to compare the differences among three different TEas in evaluating the analytical performance of plasma proteins.
Material and methods
Quality goals
This study evaluated three different standards for TEa: (1) external quality assessment (EQA) standards of China; (2) standards from the 2015 quality guide created by the German medical laboratory quantitative analysis and quality assessment committee (RiliBÄK) and (3) ‘desirable’ quality standards derived from biological variation. 12
Instruments and reagents
Plasma proteins (IgA, IgG, IgM, C3, C4, CRP and RF) were measured by immunoturbidimetry using an IMMAGE 800 automatic plasma protein analyser and corresponding reagents (Beckman Co., Ltd, USA). Calibration was set to the original matched reagent. Internal quality control products were obtained from Randox (lots 1:502LPC and 2:455LPC; Crumline, UK). All EQA samples were provided by the National Center for Clinical Laboratories (lots 201711, 201712, 201713, 201714, 201715, 201721, 201722, 201723, 201724 and 201725).
Evaluation of assay performance
Imprecision
The coefficient of variation (CV) was used as a representation of imprecision. A total of 2576 internal quality control data were collected from the plasma proteins in our laboratory over six months from July 2017 to December 2017, of which 12 were rejected. CV values for two concentration levels of quality control products (levels 1 and 2; Table 1) were calculated according to the above data.
Coefficient of variation, bias and total allowable error based on three standards for seven plasma proteins.
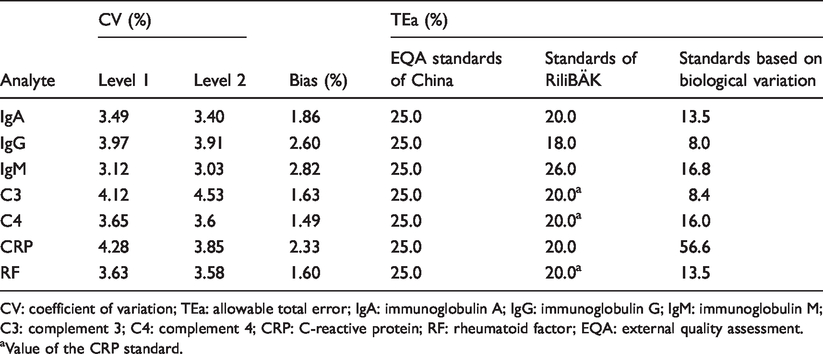
CV: coefficient of variation; TEa: allowable total error; IgA: immunoglobulin A; IgG: immunoglobulin G; IgM: immunoglobulin M; C3: complement 3; C4: complement 4; CRP: C-reactive protein; RF: rheumatoid factor; EQA: external quality assessment.
aValue of the CRP standard.
Trueness
Bias was used as a representation of trueness, and per cent differences were used to estimate bias. The per cent difference was calculated based on EQA samples. According to the data from the first and second plasma proteins performed in 2017, the laboratory obtained 10 specimens data of percentage differences. The average value of absolute percentage differences was used to evaluate bias in our laboratory (Table 1).
Calculation of Sigma metric
Sigma metric was calculated using the following formula: sigma= [TEa(%)−|bias (%)|]/CV(%). Sigma metric was determined for three different TEa standards and two concentration levels of quality control products.
Calculation of the quality goal index
The quality goal index (QGI) represents the relative extent to which both bias and imprecision meet their respective quality goals. It was calculated according to the following formula: QGI= bias(%)/[1.5×CV(%)]. QGI represents the reason behind lower Sigma metric, i.e. imprecision, untrueness or both. 7 We calculated the QGI for each specific protein analyte, which falls short of Six Sigma and determined the priority measures for quality improvements. When QGI was less than 0.8, the CV was relatively large, suggesting that the priority should be to improve imprecision. When the QGI was higher than 1.2, the bias was relatively large, suggesting that the priority should be to improve trueness. A QGI between 0.8 and 1.2 suggested that both imprecision and trueness should be improved simultaneously. 7
Results
Distribution of Sigma values for three TEa standards
Using the EQA standards of China, the distribution of Sigma metric for the seven plasma protein assays was as follows: more than 6, 57.1% (4/7); 4 to 6, 42.9% (3/7) and none were less than 4. Using the RiliBÄK standards, the distribution of Sigma metric for the seven plasma protein assays was as follows: more than 6, 14.3% (1/7); 4 to 6, 71.4% (5/7) and less than 4, 14.3% (1/7). Using the standards of ‘desirable’ biological variation, the distribution of Sigma metric was as follows: more than 6, 14.3% (1/7); 4 to 6, 14.3% (1/7) and less than 4, 71.4% (5/7) (Table 2).
Sigma metric from seven plasma proteins using three different standards for total allowable error target values.
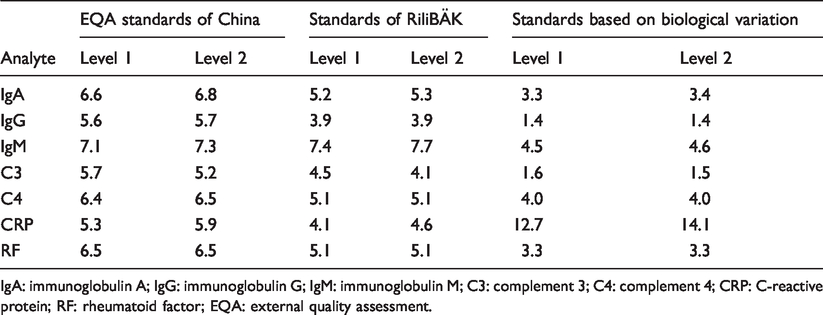
IgA: immunoglobulin A; IgG: immunoglobulin G; IgM: immunoglobulin M; C3: complement 3; C4: complement 4; CRP: C-reactive protein; RF: rheumatoid factor; EQA: external quality assessment.
Quality corrective actions
Normalized method decision chart was used to show the analytical performance of all plasma proteins by using three different sources of TEa standards. Using the EQA standards of China, the QGI was calculated for plasma proteins with Sigma metric less than 6. This study showed that improvements in imprecision measures should be adopted for IgG, C3 and CRP, whereas for the other assays, no corrective actions were required (Table 3 and Figure 1).
Quality target index and quality improvement measures of plasma proteins (sigma < 6) according to the EQA standards of China.
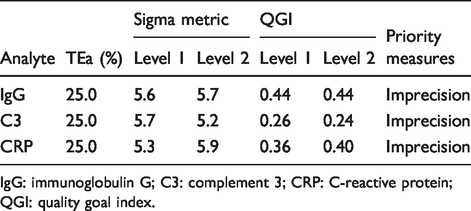
IgG: immunoglobulin G; C3: complement 3; CRP: C-reactive protein; QGI: quality goal index.
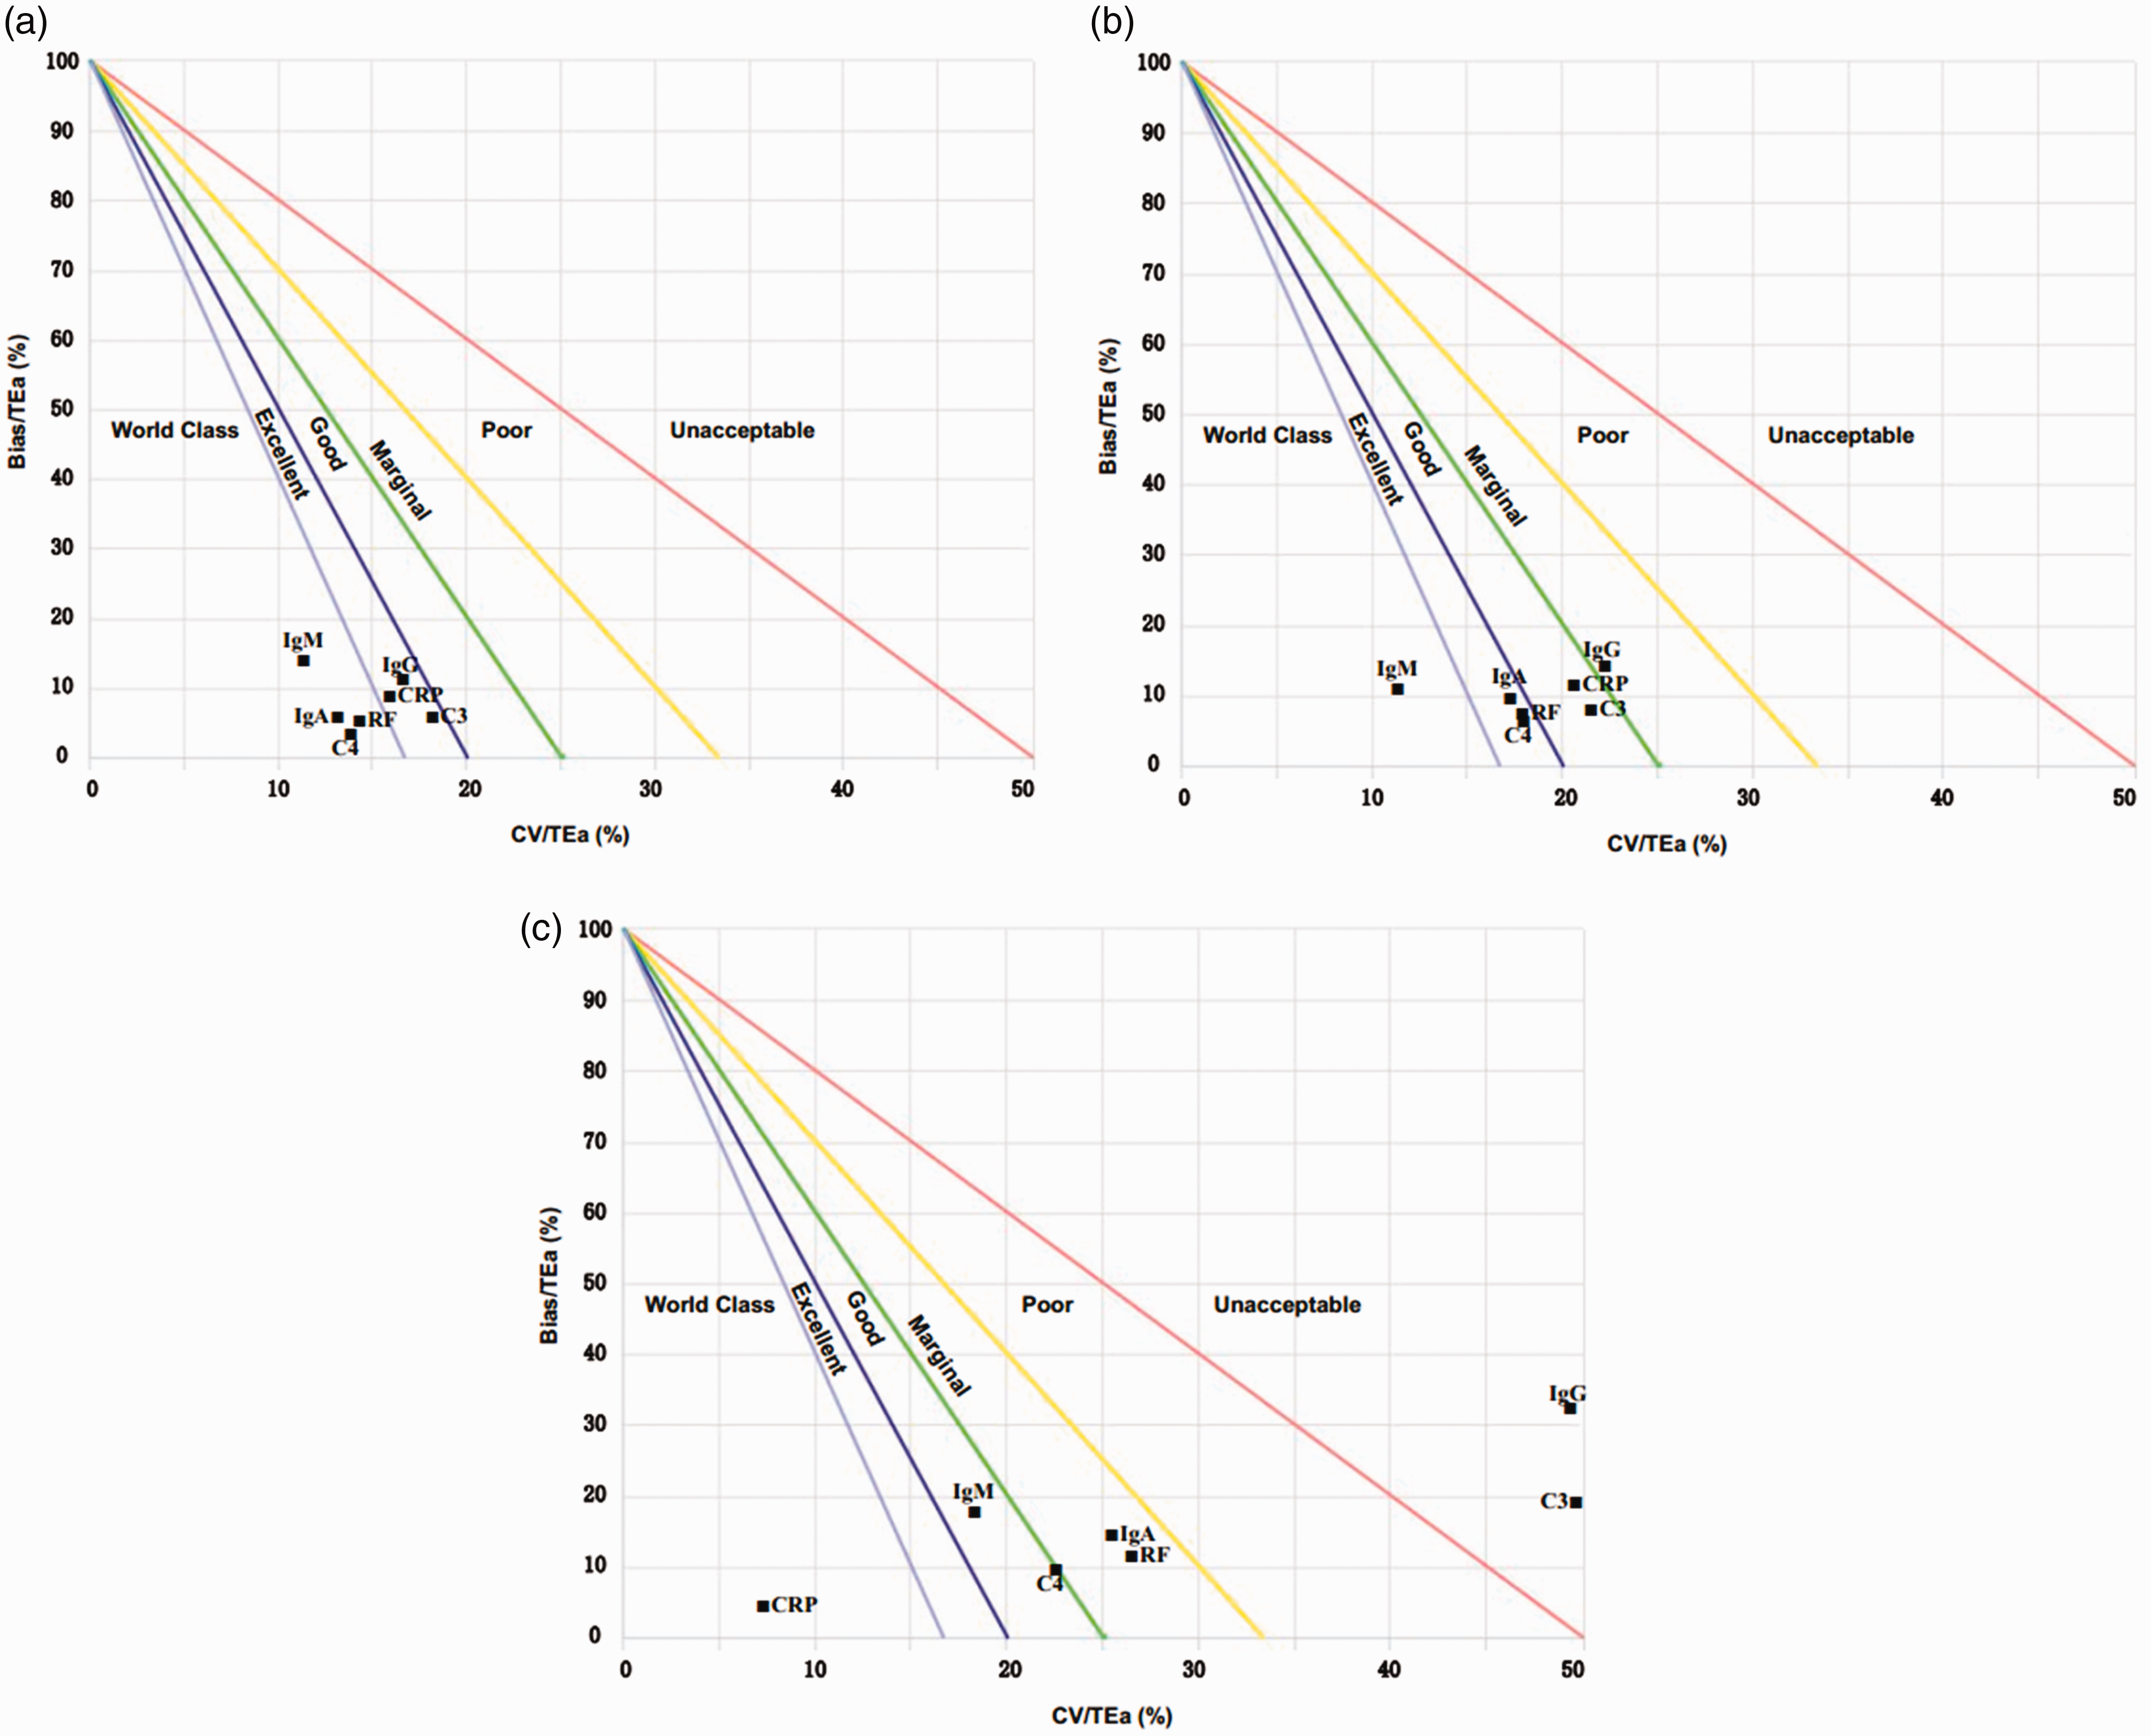
Normalized method decision chart. (a) EQA standards of China are taken as TEa; (b) standards of RiliBÄK are taken as TEa; (c) standards based on biological variation are taken as TEa.
Measures of internal quality control
Westgard Sigma Rules were used to select individualized internal quality control measures using the EQA standards of China. A flowchart of Westgard Sigma Rules for two levels of controls is shown in Figure 2. 13 The most important aspect is the Sigma scale at the bottom of the diagram that provides guidance for the rules and run sizes of patient samples that should be applied, based on the Sigma metric of each assay. This study shows that only the 13s single rule is required for IgA, IgM, C4 and RF (with sigma values > 6), using one batch of two quality control measurements (n = 2, R = 1) and a run size of 1000 patient samples. For IgG, C3 and CRP (with sigma values of 5 or 6), multiple rules (13s/22s/R4s) are required, using one batch of two quality control measurements (n = 2, R = 1) and a run size of 450 patient samples (Figure 2).
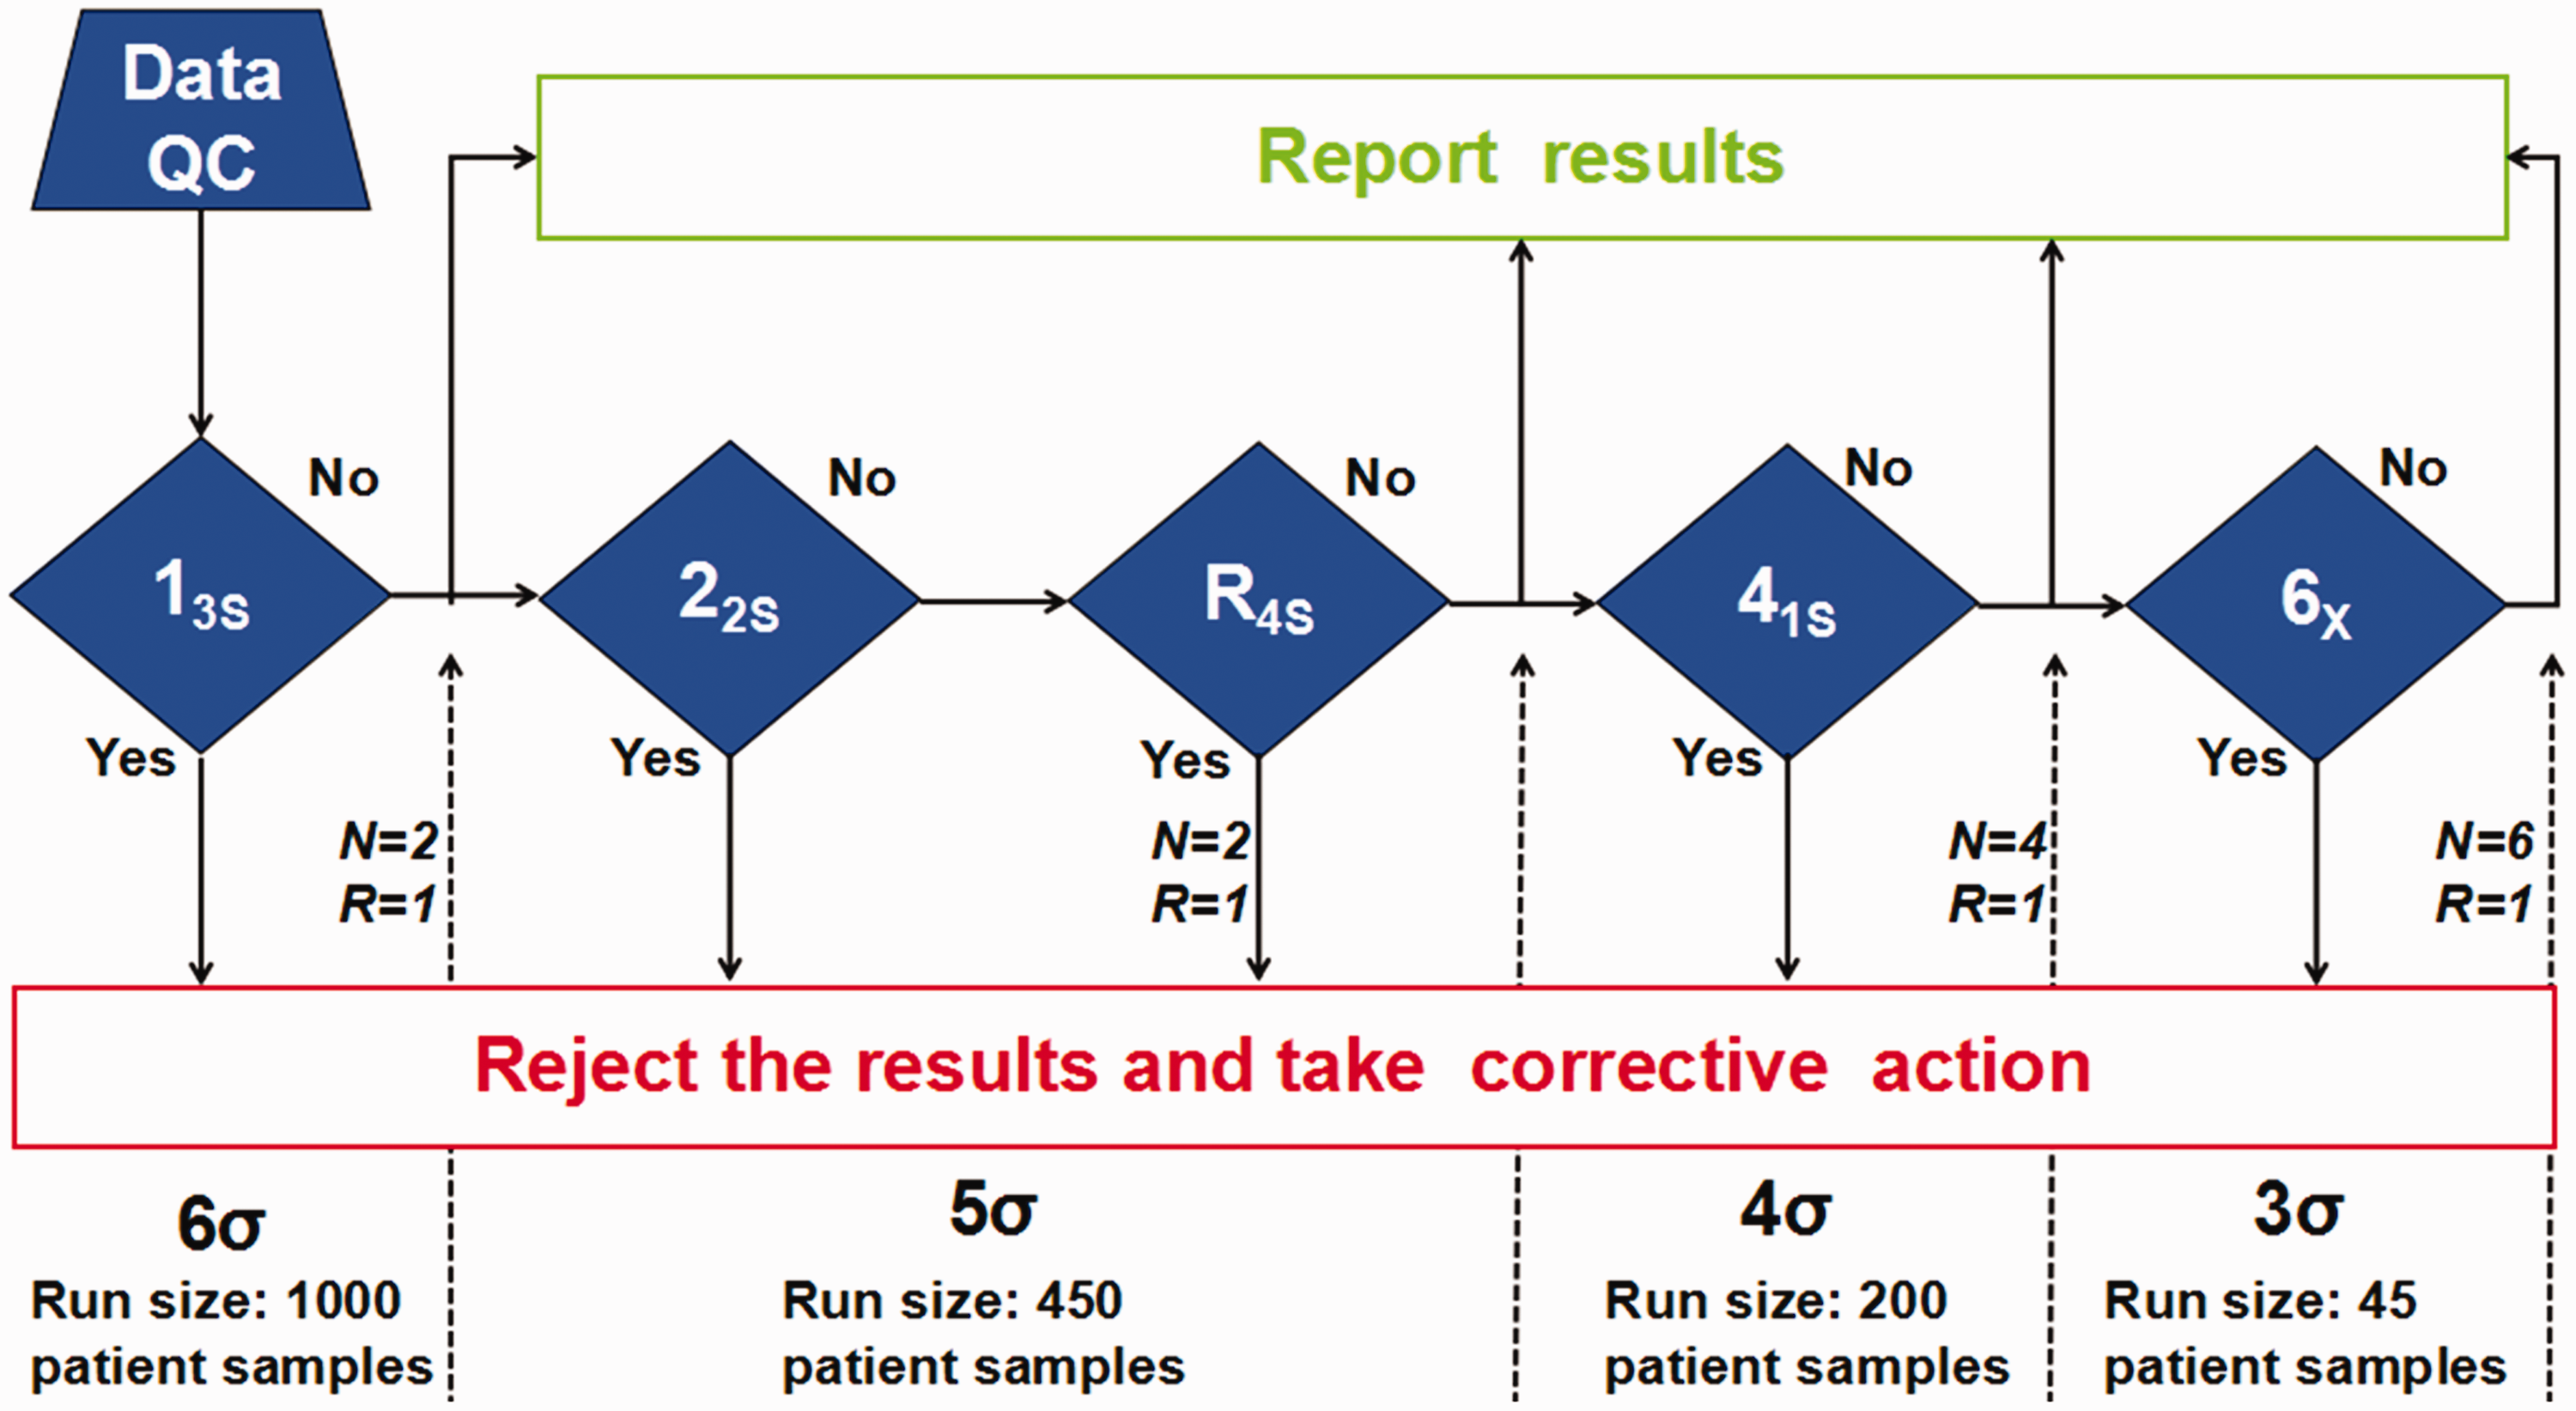
Flow chart of Westgard Sigma Rules for two levels of controls. 13
Discussion
According to the performance specifications of the 2014 Milan Conference, there were three unique goals (called the Milan Consensus) for laboratories to selectively undertake to improve quality. 14 The Milan Consensus included the following three goals: clinical outcomes, biological variation and state-of-the-art analytical performance, 14 the first two of which are emphasized by the Milan Conference. 15 Therefore, we have selected three different quality goals to evaluate the analytical performance of plasma proteins by Sigma metric. Our results showed that ‘desirable’ standards based on biological variation were the most stringent, as only CRP reached Six Sigma. Tran et al. 16 conducted a research on the practical application of biological variation and Sigma metrics quality models to evaluate 20 chemistry analytes on the Beckman AU680. Their research recommended desirable biological variation database as standard of TEa. 16 Our study also showed that the EQA standards of China were the least strict, with 57.1% of analytes reaching Six Sigma. Furthermore, our study found that Sigma metrics of IgA, IgG, IgM, C3, C4, CRP and RF varied from 6.8 to 3.3, 5.7 to 1.4, 7.7 to 4.5, 5.7 to 1.5, 6.5 to 4.0, 14.1 to 4.1 and 3.3 to 6.5, respectively. Hence, our data indicate a great difference in Sigma metric among different quality goals.
A recent study conducted by Hens et al. has shown that the choice in TEa goals is important in calculating an appropriate Sigma metric. 17 Their findings suggest that laboratories should formulate the most appropriate internal quality control rules to ensure the imprecision of their testing results, maximizing their detection capabilities.16,17 Both their research and our study show that Sigma metric has significant differences among different quality goals. Therefore, our research suggests that laboratories should select the most appropriate performance specifications to objectively evaluate analytical performance of each analyte according to the Milan Consensus. If the quality goals selected by a laboratory are too strict, the laboratory's testing capabilities will be underestimated, causing it to adopt harsh quality control measures, thereby increasing the expenditure of unnecessary reagents, quality control products and other materials. On the contrary, if the quality goals chosen by a laboratory are too loose, its detection abilities will be overestimated, causing reduced reliability in test results, and leading to serious consequences for clinical decision-making. In addition, Westgard et al. recommended that laboratories should select detecting systems with excellent performance to ensure the accuracy and reliability of their detection results. 18
The EQA standards of China was developed on the basis of Clinical Laboratory Improvement Amendments of 1988 (CLIA’88), which was considered to be the lowest acceptable standard in clinical practice.19,20 Therefore, this study used the EQA standards of China as the quality goal to objectively evaluate the analytical performance of plasma proteins. According to the EQA standards of China, the analytical performance of IgG, C3 and CRP is less than Six Sigma in our laboratory, which indicates that our detection capabilities must be further improved. To implement more reliable measures, we calculated the QGI of the above three analytes. This study showed that the QGI of IgG, C3 and CRP was less than 0.8, suggesting that there are shortcomings in the imprecision of the detection system. Therefore, it was necessary to improve the imprecision of the detection system to enhance the analytical performance in detecting these three analytes. In order to improve the imprecision of the test, we needed to take the following measures: (1) Increase the maintenance frequency of the instrument; (2) strengthen the daily check of reagents to ensure the quality meets requirements; (3) replace lyophilized quality control with liquid quality control to reduce experimental error caused by reconstitution of lyophilized quality control and (4) refine training of laboratory personnel to ensure consistency and to reduce errors caused by improper operation. In this study, a normalized method decision chart was also used to show the performance of plasma protein detection. It indicated that the Sigma metric of the seven analytes had reached a level of ‘world class’ or ‘excellent’.
Individualized quality control rules are developed according to an analyte’s Sigma metric. For example, if the analytical performance of an analyte reaches Six Sigma, a single rule, 13 s or 13.5 s, can be selected as an internal quality control. Consequently, this maintains high error detection, reduces the false rejection rate and promotes continuous improvements in analytical detection capabilities.21,22 According to the flow chart of Westgard Sigma Rules, the analytes IgA, IgM, C4 and RF only needed single rule 13 s for indoor quality control because of their excellent analytical performance. Since the analytical performances of IgG, C3 and CRP were lower than Six Sigma, multiple rules of 13 s/22s/R4s were needed to ensure the imprecision and reliability of test results. Our previous study also demonstrated that Six Sigma was useful for evaluating performance of tumour markers assays and had potential application value in indoor quality control. 23 A study conducted by Westgard et al. suggested that no less than two concentrations of quality control products should be used daily as an internal quality control to ensure the reliability of the detection results. 24
However, the limitations of our study merit consideration. Firstly, we evaluated the analytical performance of plasma proteins using Sigma metric which followed previous criteria for TEa. No universally accepted quality goals (TEa) exist, and thus harmonization is needed, as even the performance specification of the Milan Consensus simply represents the opinion of its authors, and there is only one ‘consensus’ paper from the conference.14,15 Secondly, bias can significantly impact the Sigma metric, although bias is generally more difficult to estimate. In this study, using EQA specimens provided by China National Center for Clinical Laboratories (NCCL), we obtained group means from the EQA data with the same instruments and methods as the target to calculate the per cent difference, which is used to represent bias. The most recommended method is to use reference materials to calculate bias. Therefore, the observed bias is only ‘arbitrary’ instead of ‘true’ in this study. Thirdly, this study only evaluated the performance of each analyte once. As the analytical performance of each analyte is constantly changing, we need to re-evaluate the analytical performance periodically (in intervals of six months or one year) and carry out the proper actions to promote the continuous improvement of laboratory testing capabilities.
In conclusion, different quality goals for assessing analytical performance often lead to different Sigma metric, which constantly change with analytical performance of the analytes. As the lowest acceptable standard in clinical practice, the EQA standard of China can guide laboratories to formulate reasonable quality improvement programmes.
Footnotes
Acknowledgements
We would like to thank Liang Yan and Bei Sun for their technical assistance.
Declaration of conflicting interests
The author(s) declared no potential conflicts of interest with respect to the study, authorship, and/or publication of this article.
Funding
The author(s) disclosed receipt of the following financial support for the research, authorship, and/or publication of this article: This work was supported by the Health Scientific Research Project in Lianyungang (201721 and 201817); Young and Middle-aged Talents Growth Foundation of the Second People's Hospital of Lianyungang (TQ201709) and research projects of Bengbu Medical College (BYKY17184 and BYKY18178).
Ethical approval
The study protocol conforms to the ethical guidelines of the 1975 Declaration of Helsinki as reflected in a priori approval by the Ethics Committee of the Second People's Hospital of Lianyungang (reference number: 2016–039-01).
Guarantor
QL.
Contributorship
FMY and WJW researched literature and conceived the experiments. XZW, GRB, SJT and WL were involved in protocol development, gaining ethical approval, patient recruitment and data analysis. FMY, WJW and QL wrote the first draft of the article. All authors reviewed and edited the article and approved the final version of the article.