
Abstract
Background
In vitro haemolysis is a major operational challenge for medical laboratories. A new experimental design was used to investigate under what conditions algorithms could be designed to report either quantitative or qualitative aspartate aminotransferase and lactate dehydrogenase results outside the manufacturer’s haemolysis specifications. Quantitative corrections were required to meet prespecified quality specifications.
Methods
Twenty-five patient samples were used to design reporting algorithms and another 41 patient samples were used to validate the algorithms. Aspartate aminotransferase, lactate dehydrogenase and haemolysis index were determined using a Cobas 6000 analyser (Roche diagnostics, Mannheim, Germany). Correction factors were determined, and the accuracy of the correction was investigated. Reporting algorithms were designed based on (i) the manufacturer’s cut-off for the haemolysis index, (ii) corrections within the total allowable error specification and (iii) qualitative reporting based on obtained results. The impact of the reporting algorithms was retrospectively determined by recalculating six months of aspartate aminotransferase and lactate dehydrogenase results.
Results
No correction for aspartate aminotransferase/lactate dehydrogenase was possible for results below the upper reference interval limit, while results equal to or greater than the upper reference interval limit could, up to mild haemolysis, be corrected within the total error criterion. All samples generated from the validated patient cohort fulfilled the set criteria. The algorithms allowed reporting 88.5% and 85.9% of otherwise unreported aspartate aminotransferase and lactate dehydrogenase results, respectively.
Conclusions
An approach is presented that allows to generate and validate reporting algorithms for aspartate aminotransferase and lactate dehydrogenase compatible with prespecified quality specifications. The designed algorithms resulted in a significant reduction of otherwise unreported aspartate aminotransferase and lactate dehydrogenase results.
Introduction
Laboratory test results have a major impact on clinical decision-making; therefore, they need to be accurate, reliable and available.1,2 Any error in laboratory testing can potentially lead to inappropriate care and jeopardize patient safety.3–5 Most laboratory errors originate from the preanalytical phase, where in vitro haemolysis accounts for the majority of errors and is responsible for a large proportion of rejected assay results. 3 These rejected tests can lead to (unnecessary) delays, additional blood collections and/or clinical risks.
In vitro haemolysis is mainly a preanalytical issue that can be triggered by several causes such as inappropriate use of collection devices, excessive shaking, as well as inappropriate time, temperature and humidity conditions during transport or storage of the blood specimen. 6 Despite its preanalytical origin, efforts have been made to manage haemolysed specimens in a postanalytical setting by the correcting test results using the haemolysis index (HI).7–9 This approach has been examined for tests sensitive to in vitro haemolysis including potassium, lactate dehydrogenase (LDH) and aspartate aminotransferase (AST).7,8,10 However, because these correction methods have been criticized for their inaccuracy especially for reasons of interindividual variation, in their recent recommendations, the European Federation of Clinical Chemistry and Laboratory Medicine (EFLM) working group for preanalytical phases strongly discouraged these practices.7,11–13
In our medical lab located in The Netherlands Cancer Institute, samples rejected due to haemolysis mainly concern AST and LDH results. Since AST (as a measure for liver toxicity and pathology) is an important test necessary to decide whether it is feasible to continue cancer treatment 14 and LDH is (among others) an important tumour biomarker for many cancers (including melanoma, ovarian, renal and testicular cancers),15,16 absence of results due to haemolysis frequently constitutes a relevant clinical issue. Therefore, we considered the option to design evidence-based reporting algorithms for these haemolysed samples that allow safe and reliable reporting of otherwise rejected AST and LDH results. This included the postanalytical correction using the HI. When critically reviewing the literature supporting the EFLM statement, it was noted that the recommendations were mainly based on studies related to potassium corrections, 7 which is known to have its own specific limitations.12,17 Furthermore, when a study did concern AST and LDH, it was based on a limited number of observations that covered a large range of haemolysis. 13
Therefore, using a new experimental design, the present study investigated under what AST, LDH and HI (μmol/L) conditions and limitations, correction was possible as long as all corrected results reliably fell within predefined quality specifications.
Material and methods
Study design
AST- and LDH-reporting algorithms for haemolysed specimens were designed using a training cohort based on leftover material from 25 patient samples, on which AST and/or LDH had been requested. For each sample, an individual haemolysis dilution series was prepared (using material from the same patient sample) to examine the effect of haemolysis on AST and LDH using prespecified quality specifications. A reporting algorithm was developed, and this was validated using an independent validation cohort. As for the training cohort, individual haemolysis series were prepared from the same patient’s sample. Finally, the impact of the algorithm was investigated by retrospective application of the algorithm on six months of historical AST and LDH results.
Materials
For this study, leftover materials from the routine clinical care were used. Lab requests constituting at least one haematology and one chemistry test, the HI for the latter being 0 or 1 as determined on a Cobas 6000 (Roche diagnostics, Mannheim, Germany) system, were used. Furthermore, samples were selected in order to include both elevated and normal AST/LDH results. Whole blood for haematology was collected using K2 EDTA anticoagulated tubes (Becton Dickinson, NJ, USA); the collection tubes used for chemistry tests were rapid serum tube (RST) (Becton Dickinson, NJ, USA) that were centrifuged (10 min, 2500 g, room temperature [RT]) to obtain serum.
Preparation and analysis of haemolysed specimens
EDTA-anticoagulated whole blood was centrifuged (10 min, 1700 g, RT) after which the supernatant was removed, 3 mL of NaCl 0.9% solution was added followed by gently mixing, centrifugation; the process was repeated for one further cycle. Next, the washed erythrocytes were haemolysed by adding an aliquot of double distilled water and briefly mixing the samples before freezing at –20°C for at least 2 h. After thawing, the samples were centrifuged (20 min, 1700 g, RT), and the supernatant was transferred to another plain tube, in which a haemoglobin concentration measurement was performed using an Xn2000 analyser (Sysmex Corporation, Kobe, Japan).
For each patient sample, a haemolysate dilution series was made using 0.9% NaCl as diluent including a 0.9% NaCl blank. Final haemolysed samples were made by adding 100 μL of the haemolysate dilution stock to 300 μL of serum obtained from the same blood drawn to obtain the final HI of approximately 0, 10, 20, 40, 60 and 100.
Next, HI, AST and LDH activities were determined on a Cobas 6000 system (Roche diagnostics, Mannheim, Germany). AST measurement was performed using P5P addition and was traceable to IFCC reference method (supplier code: ASTLP); LDH was performed according to IFCC reference method (supplier code: LDHI2). The HI was determined based on calculations of absorbance measurements of diluted samples according to the manufacturer’s protocol (supplier code: SI2). Although the HI was considered a unitless entity, in our setup, an HI unit corresponds to a haemoglobin concentration of approximately 1 μmol/L, as stated by the manufacturer. The manufacturer’s HI cut-off for haemolysis were 12 and 10 for AST and LDH, respectively, both based on the requirement for a recovery of ±10% of the initial value. The applied upper reference interval limit (URL) were based on recommended female Caucasian reference interval values of 31 U/L and 247 U/L for AST and LDH, respectively.18,19
Data analysis
To investigate the effect of haemolysis on AST and LDH increments, we first determined the relation between the HI and the absolute increase in AST and LDH by subtracting the blank result from the haemolysed results. Next, linear regression (Microsoft Excel, Microsoft, Redmond, Washington) was performed with a set intercept of 0. The reliability of the correction was investigated by calculating the haemolysis-free AST and LDH of the haemolysed samples using the obtained correction factor, the measured AST and LDH values and the measured HI. The observed difference between the calculated and measured AST and LDH values in the blanks was expressed relative to the blank measurement. These relative differences, also referred to as error in correction, were plotted against the HI which was performed separately for the AST and LDH results both below and above the URL.
Design and validation of reporting algorithms
The desirable bias and error criteria based on biological variation were used as prespecified quality specifications. The values obtained from the Ricos table available on the Westgard website were 6.54% and 4.3% for total allowable bias, and 16.69% and 11.4% for the total allowable error for AST and LDH, respectively. 20 As criteria for the reporting algorithm, all quantitative results needed to be within the total allowable error criterion and, preferably, within the total allowable bias criterion. Also, all qualitative result claims, such as higher or lower than a certain value, needed to be experimentally demonstrated. If these two criteria could not be met, the results were reported as being ‘sample haemolysed’.
To validate the performance of the reporting algorithms, an independent validation cohort comprising at least 31 samples/observations for every category of the reporting algorithm was used. The samples for which according to the algorithm, (i) a quantitative correction was performed and the results were within the total allowable error (TEa) criterion and (ii) samples that were reported in a qualitative manner for which the result was ≥the haemolysis-free result, were counted and expressed as fraction of all samples that were included in the algorithm. The sample size of 31 observations per category was chosen in order to guarantee that when all analysed samples fulfil the criteria (100% concordance), the 95% one-sided Pearson-Clopper confidence interval (CI) around the observed concordance lies entirely above 90%. Final obtained 95% CI were also calculated using a one-sided Pearson Clopper interval.
In order to investigate the impact of the reporting algorithms, they were compared with our current practice. All laboratory results from the six-month period of January–June 2018 for AST, LDH and HI were extracted. Next, we retrospectively recalculated the results by applying the algorithm for all AST and LDH test requests and compared these recalculated results with the standard practice of rejecting all results.
Results
Determination of AST and LDH correction factors
The ranges of the non-haemolysed AST and LDH results were 5–542 U/L for AST and 56–851 U/L for LDH. Final HI values were: target HI (range of measured HI) for HI 10 (10–15); for HI 20 (21–30); for HI 40 (42–48); for HI 60 (63–73) and for HI 100 (106–119). The effect of haemolysis on the absolute increase in AST and LDH activities, together with the results of the linear regression analysis, is shown (Figure 1). The correlation coefficients (R2) were 0.72 for AST and 0.86 for LDH.
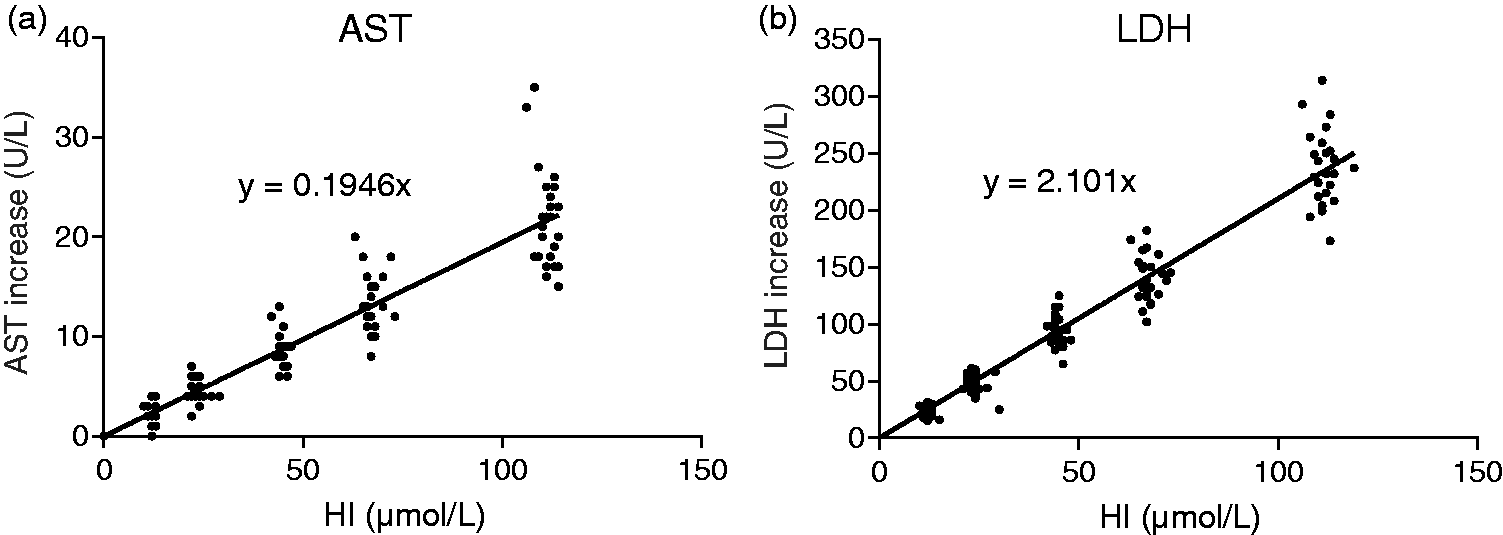
Increases in AST and LDH in haemolytic samples. Presented is the observed absolute increase in AST (a) and LDH (b) for generated haemolysed samples. The line represents the obtained regression line and the obtained slopes are further investigated as corrective factor.
Accuracy of correcting haemolysed specimens
The accuracy of correcting haemolysed specimens using the correction factors is presented (Figure 2) for results both below and above the URL. For AST, 27 of the 28 values that were above the URL and with an HI of ≤45 could be corrected within the total allowable bias specifications (Figure 2(a)). The sample outside the total allowable bias criteria differed by 9.3% and had a concentration of 48 U/L with a corrected calculated concentration of 52.4 U/L. All these were within the total allowable error specification. However, for the AST results below the URL, correction at any HI led to results outside the quality specifications (Figure 2(b)).
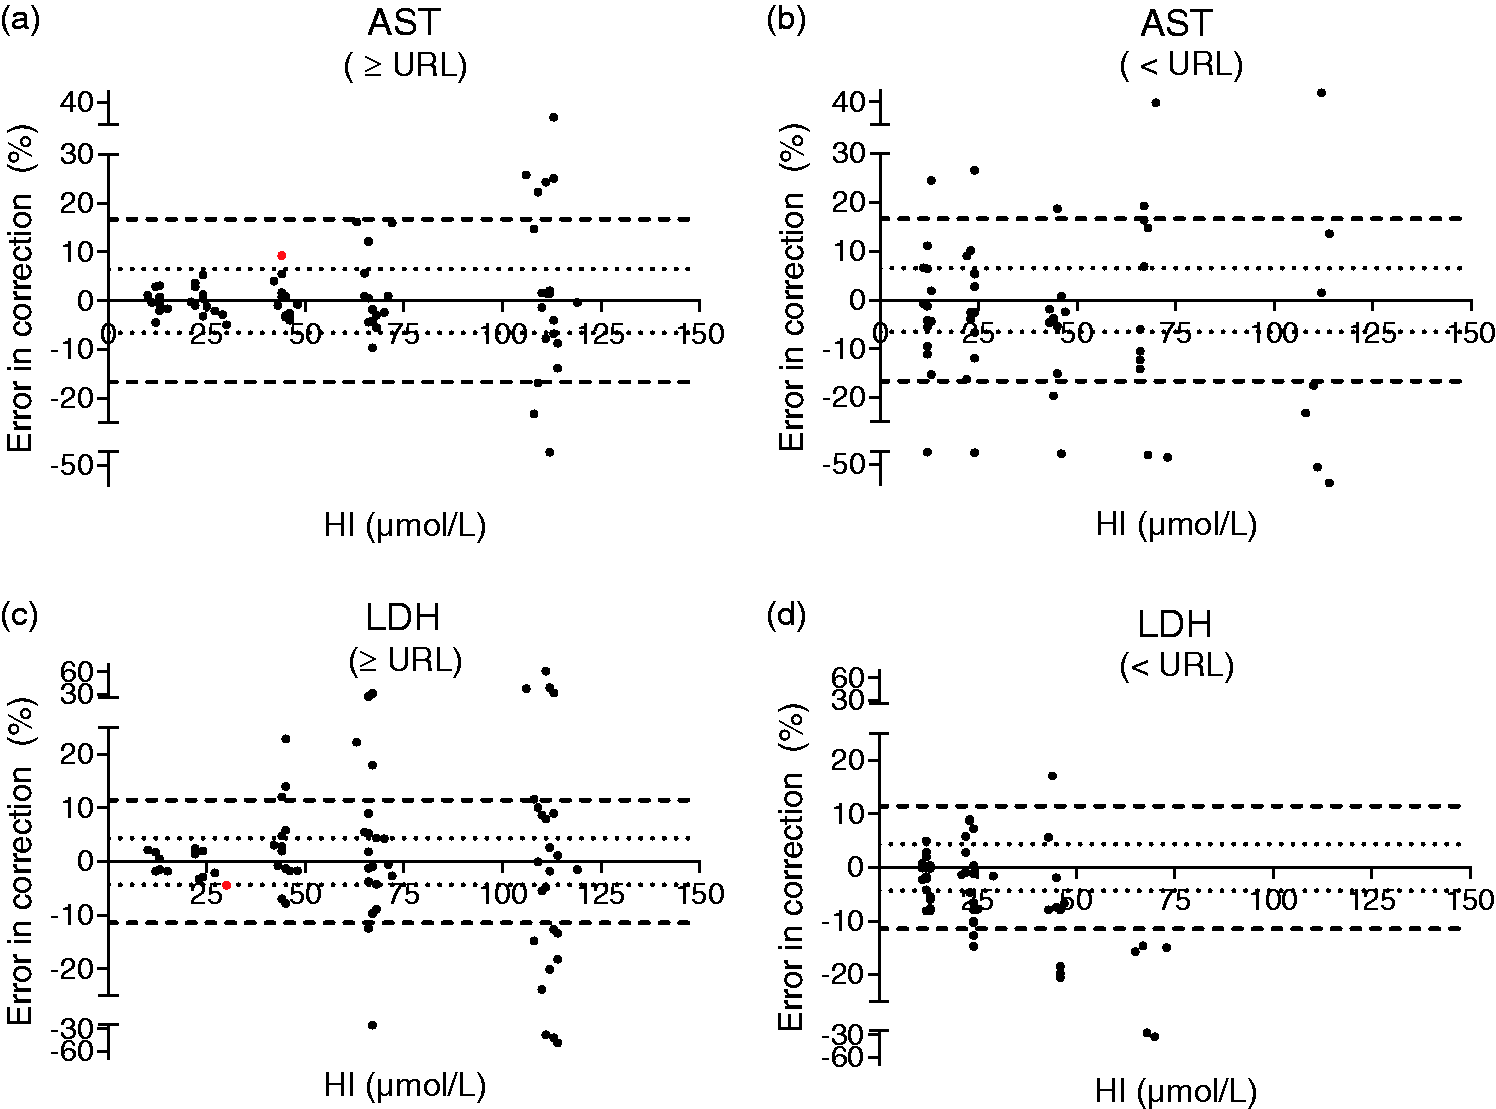
Accuracy of AST and LDH correction using HI. Presented are data on the accuracy of AST and LDH corrections below and above the URL. The dotted inner line represents the total allowable bias criterion and the outer dashed line represents the total allowable error criterion for either AST (a and b) or LDH (c and d). The dots represent all experimental observations. The two red dots (in a and c) represent the observations that are included in the reporting algorithm but are outside the total allowable bias criterion.
For the LDH results above the URL and with an HI ≤25, all 11 samples were within the allowable bias specification and all were within the total allowable error specification (Figure 2(c)). One sample that aimed to obtain an HI of 20 had an HI of 30 and was outside the total allowable bias specification of 4.3%; this particular sample had an error of 4.5% and a concentration of 851 U/L with a corrected concentration of 813 U/L. For LDH results below the URL for any HI, several corrected results were obtained outside the desirable bias quality specification (Figure 2(d)).
Design of reporting algorithms
Designing new reporting algorithms started with the haemolysis criterion used by the manufacturer as described in the method sheet. Next, additional decision rules outside these criteria were generated based on the results presented here and, more specifically, on: (1) the range of HI results included in this study, (2) for the HI cut-off per HI category (10, 20, 40, etc.), we used the middle numerical value of the range of observed HI targeting the same HI, (3) the observation that all haemolysed samples for both AST and LDH were higher than the corresponding blanks and (4) the correction of haemolysed samples within the allowable error specification as discussed above. Taking all of these into account, the reporting algorithms for AST and LDH (Table 1) were obtained.
Reporting algorithms obtained for AST and LDH.
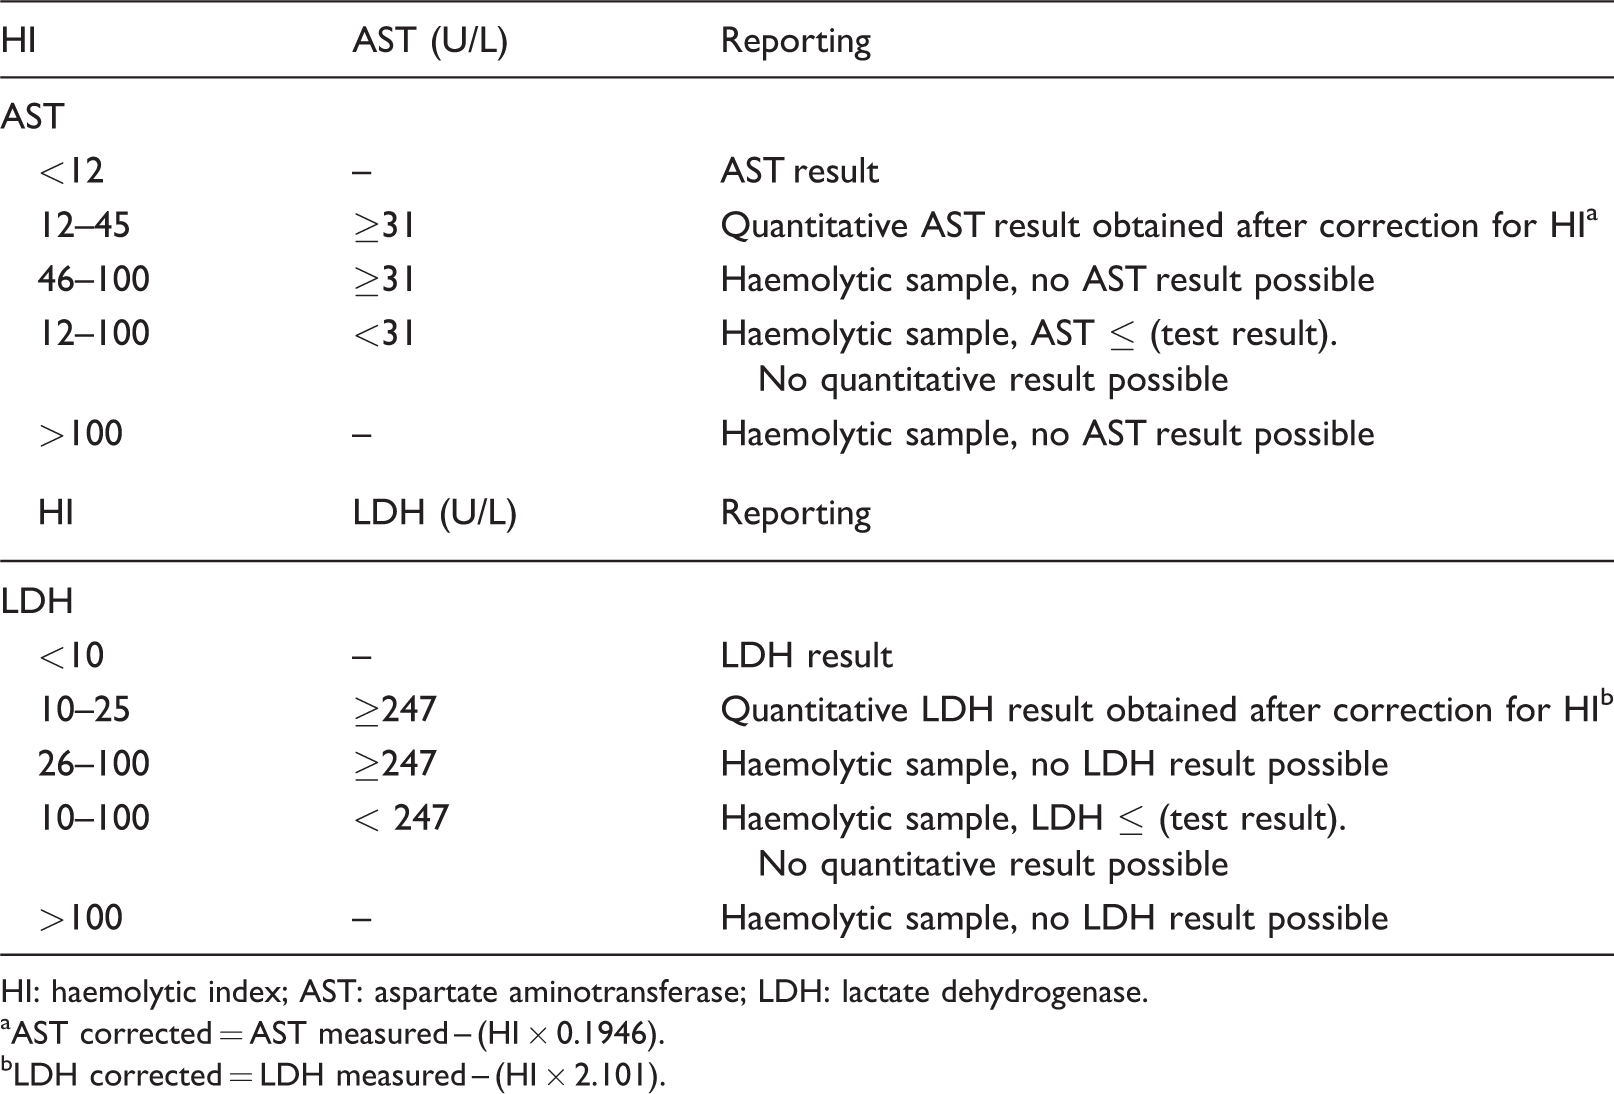
HI: haemolytic index; AST: aspartate aminotransferase; LDH: lactate dehydrogenase.
aAST corrected = AST measured – (HI × 0.1946).
bLDH corrected = LDH measured – (HI × 2.101).
Validation of obtained reporting algorithms
For validation of the reporting algorithms, another 41 patient samples were required to obtain at least 31 observations for each part of the AST and LDH algorithm (quantitative correction within TEa and qualitative reporting below the URL). Since prior to working up a series, it was unknown how many samples could be included in which category, variations in sample sizes were obtained. The results are presented in Table 2. All results based on the HI and AST or LDH values included in the reporting algorithms fulfilled the prespecified criteria.
Validation of reporting algorithm using an independent validation cohort.
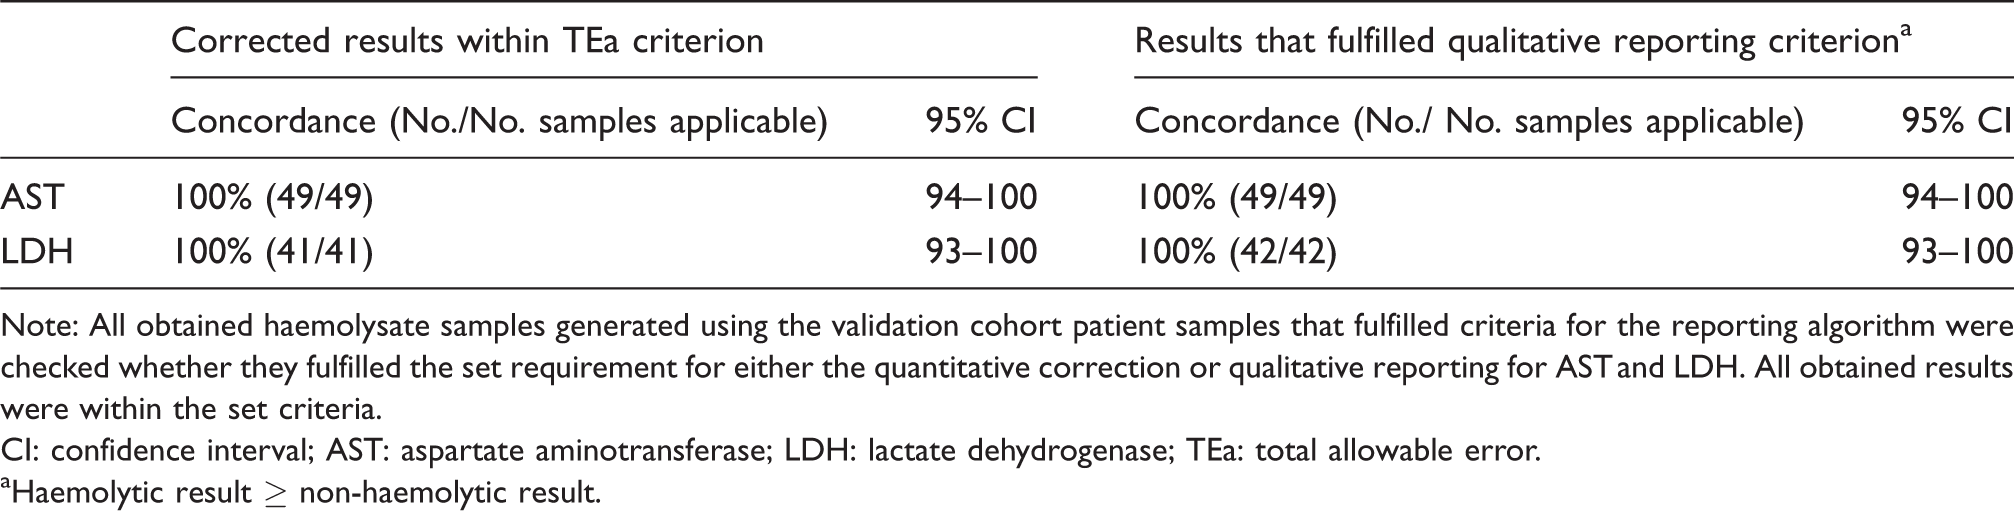
Note: All obtained haemolysate samples generated using the validation cohort patient samples that fulfilled criteria for the reporting algorithm were checked whether they fulfilled the set requirement for either the quantitative correction or qualitative reporting for AST and LDH. All obtained results were within the set criteria.
CI: confidence interval; AST: aspartate aminotransferase; LDH: lactate dehydrogenase; TEa: total allowable error.
aHaemolytic result ≥ non-haemolytic result.
Impact of designed reporting algorithms
The results of the retrospective comparison of reporting AST and LDH results over the period January–June 2018 using the manufacturer’s cut-offs and the new reporting algorithms are presented (Table 3). It can be observed that, had the reporting algorithm been applied for AST, the number of rejected results due to haemolysis would have dropped from 6.6% to 0.8% of all test results, and for LDH, the number of rejected results would have dropped from 9.8% to 1.4% of all test results. The reporting algorithms allowed reporting 88.5% and 85.9% of otherwise unreported AST and LDH results, respectively.
Retrospective analysis of reporting algorithm performance.
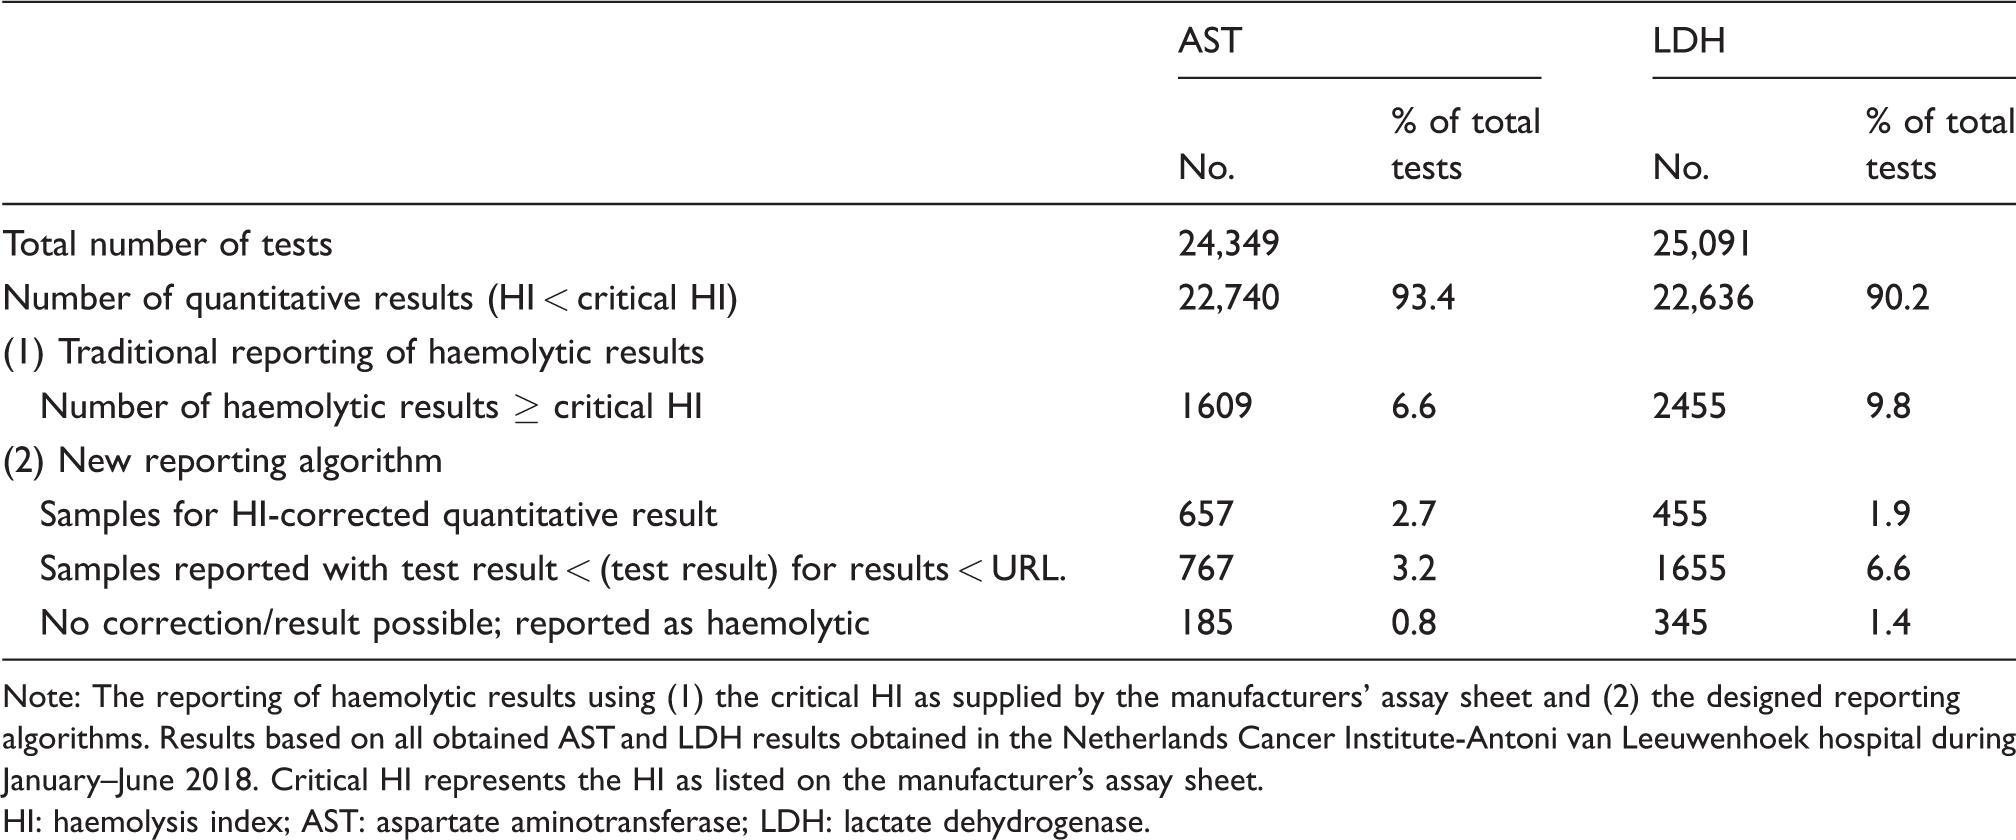
Note: The reporting of haemolytic results using (1) the critical HI as supplied by the manufacturers’ assay sheet and (2) the designed reporting algorithms. Results based on all obtained AST and LDH results obtained in the Netherlands Cancer Institute-Antoni van Leeuwenhoek hospital during January–June 2018. Critical HI represents the HI as listed on the manufacturer’s assay sheet.
HI: haemolysis index; AST: aspartate aminotransferase; LDH: lactate dehydrogenase.
Discussion
An experimental approach is presented to develop reporting algorithms and correction within quality specifications for haemolysed specimens using leftover materials from multiple patients. When applied on AST and LDH, reporting algorithms for haemolysed results beyond the manufacturer’s criteria could be obtained. When retrospectively applied on AST/LDH test results over a six-month period, a substantial potential reduction of rejected assay results for AST and LDH due to haemolysis was demonstrated.
To investigate the effect of in vitro haemolysis on AST and LDH results, a different approach was used than that documented in the CLSI guideline. 21 We used leftover patient material and aimed to include the interpatient variation in our experimental design by performing a haemolysate addition experiment per patient sample for 25 patients. Previously, large interpatient variation in the relation between HI and change in (among others) AST and LDH was reported, which was the rationale to advise against corrective approaches for haemolysed specimens.11,13 Some of the concerns raised were specifically related to potassium and not to AST or LDH.7,17 Using our experimental approach and acknowledging the issue of interindividual variation, it was shown that, although there is interindividual variation in AST and LDH increases for similar HIs, for both these biomarkers, correlations of ≥0.85 were obtained (Figure 1). However, absolute interindividual variations in AST and LDH increases did increase with a higher HI, i.e. the variation in AST increase was 0–4 U/L at an HI of 12 and 15–35 U/L at an HI of around 100; whereas for LDH, the variation in increase was 18–30 U/L at an HI of around 12 and 173–314 U/L at an HI of around 100 (Figure 1). Possible causes for these variations include variation in red blood haemoglobin and analyte content, and (at least for potassium) preanalysis delays.12,17
Subsequently, we used the slope obtained from the linear regression to correct haemolysed specimens using the HI. To evaluate the result obtained, we used the total allowable error and total allowable bias based on biological variation as absolute and preferred criteria, respectively. 20 The rationale for this criterion was that not only the bias, but also the total error criteria, were relatively stringent compared with the criteria used by others, e.g. the reference change value;11,22 this allowed us to be ‘on the safe side’. In our experimental setup, the obtained results not only contained a bias component based on patient/sample characteristics but also an analytical imprecision component since we performed all experiments only once, i.e. we preferred to include more patients, rather than performing the experiments in duplicate or triplicate. However, this approach limits the exclusion of potential outliers and complicates the ability to identify experimental failures. We did, however, use an independent validation cohort that was statistically powered to confirm the performance of the developed reporting algorithms. To evaluate the corrected results, we expressed the observed correction error as percentage of the original non-haemolytic result and presented them in difference plots. Since the quality criterion used is expressed as a relative unit (%) and the effect we studied mainly concerns absolute increments, the data were separated into two populations, i.e. a population with high AST/LDH results (above the URL) and a population with low AST/LDH results (below the URL). In the low AST/LDH population, an absolute increase would earlier result in an unacceptable percentage change, whereas in the high AST/LDH population, the same deviation in absolute units would still generate acceptable percentage changes. To distinguish between these populations, the URL was used; for the examined AST/LDH parameters, this is an important limit for clinical decision-making. Generally, results higher than the reference range might be of clinical importance, and (in oncology) toxicity scores are usually based on the degree of increment of the URL. 14 Figure 2 shows that for the AST/LDH results below the URL, no HI-based correction could reliably be performed, whereas for the AST/LDH results above the URL (up to some HI), correction was possible within the prespecified quality specifications.
The final step was to use the obtained results to design experimentally based reporting algorithms that met the quality specification requirements. As a starting point, we used the HI limits as specified by the manufacturer. For results outside these HI criteria, we first investigated under which conditions HI-based correction was possible within the quality specification used. Only results above or equal to the URL for both AST and LDH could meet these criteria; for AST, this was possible for HI of 12–45 and for LDH for HI of 10–25. Next, for haemolysed specimens that could not reliably be corrected, alternative reporting of the haemolysed results was considered. One observation was that all generated haemolytic samples had AST/LDH results above or equal to the AST/LDH results in the non-haemolytic sample. This would allow qualitative reporting of haemolysed AST/LDH results as lower or equal than the obtained haemolysed AST/LDH result. We decided to use this way of reporting only for the AST/LDH results that were below the URL. The rationale for this is that, for both AST and LDH, generally elevated (and not lowered) results are of clinical importance and the URL is often used as an important level for clinical decisions. For AST/LDH values below the URL, despite not knowing the actual AST/LDH value, this information is often sufficient for the clinician to decide upon. However, we decided not to use this type of reporting for results above or equal to the URL because: (i) mildly haemolytic samples were already corrected and reported and (ii) we feared that reporting AST/LDH results above or equal to the URL as less than the obtained haemolytic AST/LDH result, might cause confusion and lead to misinterpretation. Therefore, these latter results were still reported as haemolytic. All results that were outside the scope of the experiment (i.e. HI >100) were also reported as being haemolytic.
When we retrospectively applied the reporting algorithms on six months of laboratory results, 2.7% of the AST and 1.9% of the LDH results were corrected; this corresponded to 40.8% and 19.1% of the previously reported haemolytic results for AST and LDH, respectively. Furthermore, reporting results below the URL only as lower or equal than the observed haemolysed AST/LDH already resulted in an additional reporting of 3.2% and 6.6% of the AST and LDH samples; this corresponded to 47.7% and 67.4% of the previously rejected haemolytic samples, respectively. Altogether, using the designed algorithm, the number of samples for which no result or information regarding the AST/LDH result could be reported decreased from 6.6% to 0.8% for AST and from 9.8% to 1.4% for LDH, i.e. reductions of 88.5% and 85.9%, respectively. To our knowledge, this is the first study to investigate the impact of (corrective) reporting algorithms for haemolytic samples.
Some limitations of this study need to be addressed. First, all results were obtained in a hospital specialized and dedicated to cancer care, and therefore the results obtained using leftover materials and interpretation of the results should be considered within this context. It would, however, be relevant to investigate the appropriateness of the obtained reporting algorithms for other clinical settings to see if they can be applied in a more universal manner. Second, until now, the occurrence of in vivo haemolysis has been largely ignored. When haemolysed specimens originate from patients with in vivo haemolysis, correcting the AST/LDH results as part of the reporting algorithm generates false results. Acknowledging this, when correcting the AST/LDH results, the reporting comment should always include a remark referring to invalidity in case of in vivo haemolysis. 8 Thirdly, the results and conclusions are based on simulation of in vitro haemolysis. We used an osmotic shock and freezing procedure, similar to the procedure recommended by the CLSI and used by manufacturers to obtain cut-offs for HIL indices. 21 However, this approach might not optimally mimic all mechanisms of ex vivo haemolysis. 23 Fourth, we decided not to include potassium in this study because we used K2 EDTA containing leftover materials not compatible with potassium analysis of the patient specimen. Another reason is that potassium is associated with more mechanisms that are responsible for discrepancies with HI and potassium increases, e.g. leaking of erythrocytes.12,17 Other limitations are that the HI used was measured on a Cobas 6000 system and, therefore the results are not directly transferable to HI determined on other systems; also, the HI measurement itself is not immune to interference.23,24 Furthermore, when using HI as a measure for correction of AST/LDH and to determine whether they are reported or rejected in any way, requires assuring the analytical quality of the HI, which is not generally applied. However, these latter concerns are more general issues associated with the application of HIL indices.25,26
Despite these limitations, we have experimentally demonstrated that designing reporting algorithms to reliably report either quantitative or qualitative AST/LDH results outside the manufacturer’s haemolysis specifications is possible. The experimental design to include multiple patient samples acknowledges, but also overcomes, several of the limitations raised by others. The validity of the presented approach is also strengthened by using the same in vitro setup as recommended by the CLSI and used by manufacturers to determine haemolysis cut-offs, as well as using widely accepted quality specifications as criteria.
In conclusion, a method has been presented to design reporting algorithms for haemolysed specimens based on experimentally obtained results, including investigating correction within prespecified quality specifications. We used this approach for AST and LDH and obtained reporting algorithms that, when retrospectively applied, would have resulted in a reduction of 88.5% and 85.9% of unreported AST and LDH results, respectively.
Footnotes
Declaration of conflicting interests
The author(s) declared no potential conflicts of interest with respect to the research, authorship, and/or publication of this article.
Funding
The author(s) received no financial support for the research, authorship, and/or publication of this article.
Ethical approval
Not applicable.
Guarantor
HHvR.
Contributorship
SC and HHvR wrote the article, OT and MvdS performed research, FO and DvdB performed expert review, VvdN, statistical support. All authors have read and approved the final version of the article.