
Abstract
Background
In a medical laboratory, changes may be made to the analytical phase of diagnostic testing whenever a new test or the issue of a ‘new generation’ kit or new diagnostic system is required. In such cases, ISO 15189:2012 accreditation can assist laboratory professionals. The aim of the present study was to propose a working pathway for introducing new examination procedures into clinical practice in accordance with the ISO 15189:2012 standard, through the exemplars of 17-hydroxy progesterone, dehydroepiandrosterone sulphate and vitamin D.
Methods
The working pathway includes the following steps: (i) analysing examination procedures under evaluation, (ii) analysing examination procedures currently in use, (iii) verifying metrological traceability, (iv) verifying examination procedures and (v) evaluating comparability of results.
Results
The analysis of instructions for use issued by manufacturers revealed that metrological traceability was reported only for vitamin D. The imprecision verification was satisfactory, the imprecision obtained by the laboratory in terms of total imprecision always being less than the specified total imprecision. In only one case (IQC level 1, 17-hydroxy progesterone), the total upper verification limit was calculated. The trueness verification was satisfactory for all examination procedures, except for 17-hydroxy progesterone (second material). Passing–Bablok regression analyses in the comparability study demonstrated significant differences for all the examination procedures.
Conclusions
The working pathway described for examination procedures in routine practice is in accordance with the requirements of ISO 15189:2012 accreditation and takes feasibility into account (as its main goal), based on the cost/patient benefit ratio.
Keywords
Introduction
Medical laboratories, especially those in academic centres, undergo constant change. It is the duty of each and every clinical laboratory to meet clinical demand in order to guarantee the provision of the best possible healthcare. As recently reported, diagnostic stewardship calls for modifications in the processes of ordering, performing and reporting diagnostic tests in order to effectively diagnose and treat human disease by acting on preanalytic, analytic and postanalytic processes. 1 In a clinical laboratory, changes may be made to the analytical phase if a new test is to be introduced in order to meet a new clinical request. In the last few years, novel, increasingly complex tests, such as glycosylated ferritin and angiogenetic factors (sFlt-1/PIGF ratio), have been introduced into routine practice due to their documented clinical utility in cases of acquired haemophagocytic lymphohistiocytosis and preeclampsia, respectively.2,3 Moreover, technological innovation, the release of ‘new generation’ kits and/or new diagnostic systems by manufacturers often calls for the replacement of a system in use. For example, Roche recently produced the third generation of free thyroxine with an improvement in the limit of quantitation (from 3 to 1.3 pmol/L). 4
However, whenever a change is made, patient safety must be guaranteed: ISO 15189:2012 accreditation is a valid tool in assisting laboratory professionals in this. 5 As recently highlighted by Schneider et al., in an ISO 15189-accredited laboratory, the goal is continual improvement. To this end, staff members must know exactly what to do, how to do it, who is in charge of a process and where to find all the information required in order to perform their task effectively and reliably. 6 In order to guarantee that the performance characteristics claimed by the manufacturer are achieved when the system is introduced into laboratory routine, a verification or validation process must be undertaken according to ISO 15189:2012 requirements (sections 5.5.1.2 and 5.5.1.3). 7 The laboratory verifies the examination procedure (EP), if it has already been validated (CE-IVD tests). The goal of verification is to ensure that the performance claimed by the manufacturer is achieved. EPs are to be validated if they are non-standard, ‘home-made’ and validated methods that have been modified or are being used outside their intended scope. Validation aims to guarantee that the specific performances are adequate for their intended use.8,9
Another requirement of the standard that should be evaluated when a test is introduced in routine practice is metrological traceability (section 5.3.1.4): ‘Metrological traceability shall be to a reference material or reference procedure of the higher metrological order available’. This requirement is assessed in detail by Thelen et al. in the position statement of the European Federation of Clinical Chemistry and Laboratory Medicine. 10 Moreover, when a new EP replaces an existing one, the comparability of results must be defined (section 5.6.4) together with the biological reference intervals or clinical decision values (section 5.5.2): in particular ‘when the laboratory changes an examination procedure or pre-examination procedure, the laboratory shall review associated reference intervals and clinical decision values, as applicable’. 5
The aim of the present study was to propose an exemplar pathway for the introduction of new EPs (replacing existing EPs) into clinical practice in accordance with the ISO 15189:2012 standard, through the examples of 17-hydroxy progesterone (17OHP), dehydroepiandrosterone sulphate (DHEA-S) and vitamin D (vit.D). These tests have obtained ISO 15189:2012 accreditation since 2016 using different analytical systems. The evaluation simulated the approach that should be followed if these assays are to replace existing assays, while maintaining ISO 15189 accreditation.
Materials and methods
The working pathway includes the following steps.
Description of EPs under evaluation
The newly introduced EPs were carried out on the MAGLUMI 2000 plus platform (Snibe, Shenzen, China) following the manufacturer’s instructions. This continuous random access chemiluminescence immunoassay (CLIA) automated system uses nano-magnetic microbeads separation high throughput (180 tests/h) technology, the luminescence substrate being N-(aminobutil)-N-(ethyl)-isoluminol (ABEI). The instructions for use (IFU) document versions utilized were: for 17OHP (new-17OHP) 120 17-OH progesterone–V9.0-en-EU 2017–12, for DHEA-S (new-DHEA-S) 097 DHEA-S-V8.0-en-EU 2017–12 and for vitamin D (new-vit.D) 103 25-OH Vitamin D-V8.0-en-EU 2017–12.
Serum new-17OHP concentrations were measured using two-step competitive CLIA, with a monoclonal antibody anti 17α-OHP conjugated to ABEI, the microbeads being coated with the antigen. Serum new-DHEA-S concentrations were quantified using a one-step competitive CLIA, the magnetic microbeads being coated with sheep polyclonal antifluorescein isothiocyanate (FITC), FITC-labelled monoclonal antibodies anti-DHEAS and antigen conjugated to ABEI. Serum new-vit.D concentrations were determined using two-step competitive CLIA, magnetic microbeads being coated with monoclonal antibodies anti-vit.D and antigen labelled to ABEI. The manufacturer reported the concentrations of new-17OHP in nmol/L, new-DHEA-S in μg/dL and new-vit.D in ng/mL. The required sample volumes, the analytical measurement ranges and the declared sensitivities are reported in Table 1.
Analytical characteristic declared by manufacturers for the examination procedures in evaluation and for examination procedures in use.
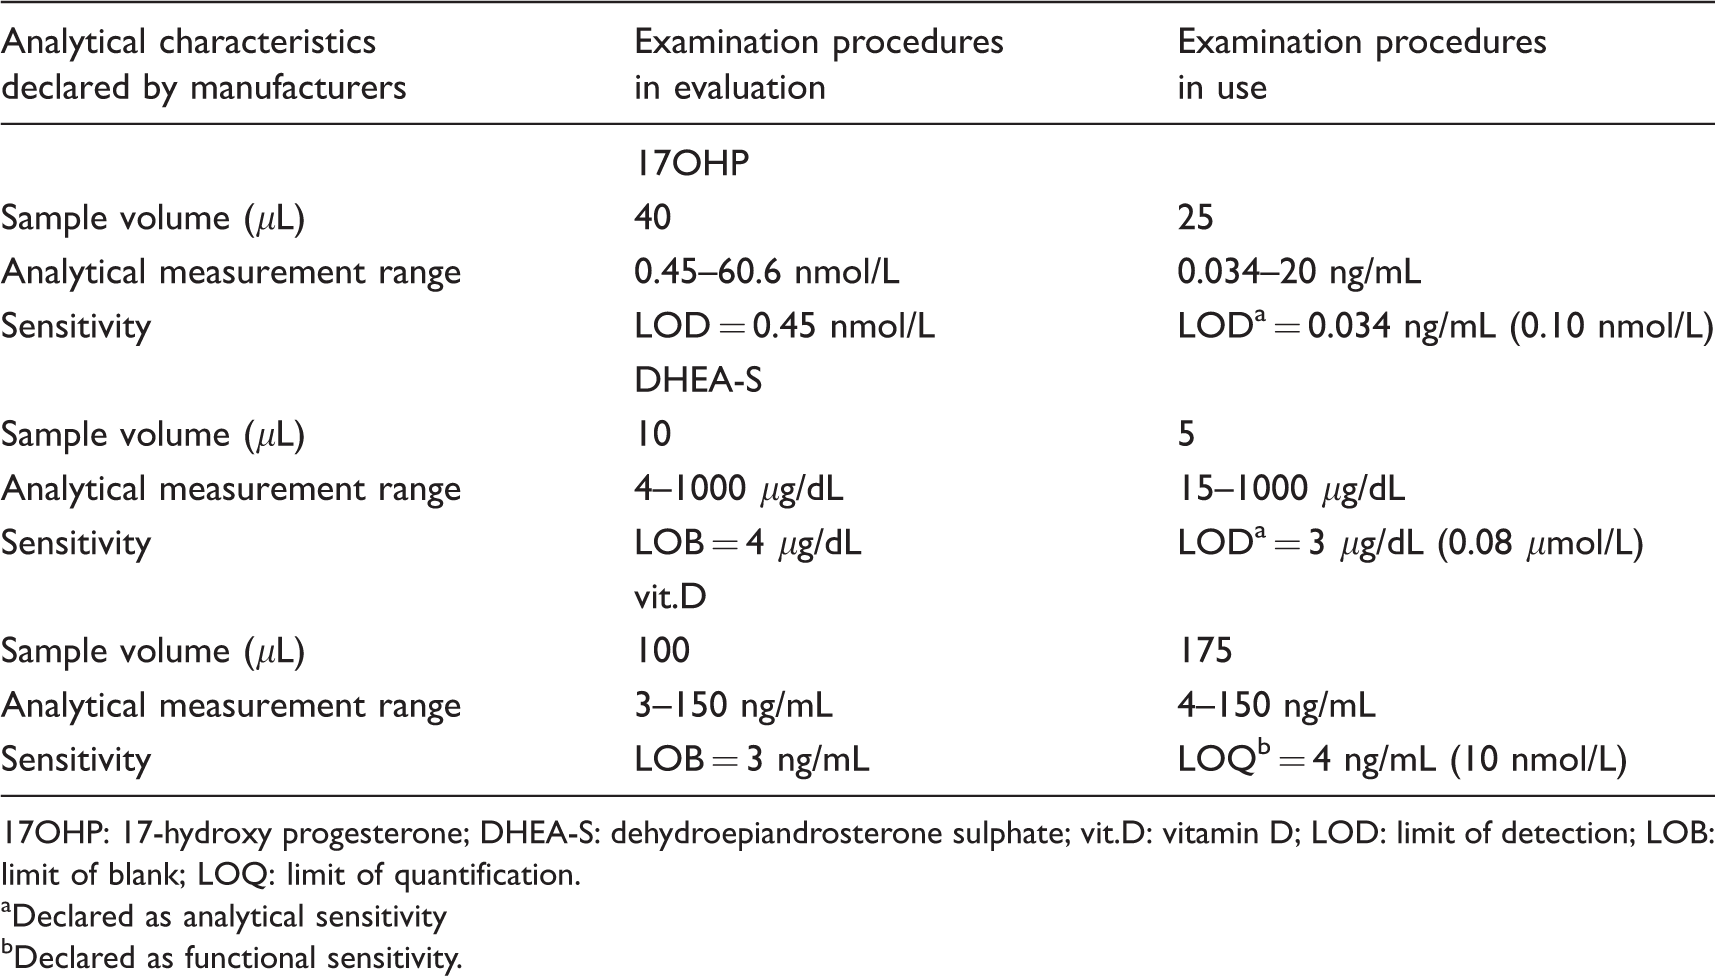
17OHP: 17-hydroxy progesterone; DHEA-S: dehydroepiandrosterone sulphate; vit.D: vitamin D; LOD: limit of detection; LOB: limit of blank; LOQ: limit of quantification.
aDeclared as analytical sensitivity
bDeclared as functional sensitivity.
Description of EPs in use
Serum 17α-OHP, DHEA-S and vit.D concentrations were measured using CE-IVD commercial kits: a competitive enzyme immunoassay (r-17OHP, ref. EIA-1292, DRG Instruments GmbH, Marburg, Germany), a competitive CLIA (r-DHEA-S, Immulite 2000, Siemens, Gwynedd, UK) and a direct competitive CLIA (r-vit.D, ref. 310600, Diasorin, Stillwater, USA), respectively. Manufacturers reported the concentrations for r-17OHP in ng/mL, r-DHEA-S in μg/dL and r-vit.D in ng/mL. The concentrations of these analytes are converted and reported in SI units: r-17OHP in nmol/L, r-DHEA-S in μmol/L and r-vit.D in nmol/L. The required sample volumes, the analytical measurement ranges and the declared sensitivities are reported in Table 1. For r-17OHP, the imprecision monitored with two internal quality control samples (IQCs) in our routine practice showed a coefficient of variation (CV) of 7.8% at 2.06 nmol/L (n = 137) and 8.9% at 7.2 nmol/L (n = 136). For r-DHEA-S, the procedure had a coefficient of variation of 12.9%, 10.6% and 8.2% at 1.47 (n = 256), 3.01 (n = 246) and 13.9 (n = 241) μmol/L, respectively. The imprecision, measured with three IQCs, demonstrated a CV of 14.2% at 48.6 nmol/L (n = 497), 13.3% at 106.7 nmol/L (n = 483) and 12.6% at 286.7 nmol/L (n = 489) for r-vit.D. The declared analytical sensitivity was 0.034 ng/mL (0.10 nmol/L) for r-17OHP and 3 μg/dL (0.08 μmol/L) for r-DHEA-S. The declared functional sensitivity for r-vit.D was 4.0 ng/mL (10 nmol/L).
Verification of metrological traceability
The IFU for each newly introduced EP were carefully reviewed in order to ascertain the metrological traceability, and the metrological chain was verified using JCTLM database. 10
Verification of EPs
The procedure followed in order to verify a newly introduced EP is described in detail elsewhere. 7 Briefly, as a minimum, imprecision and trueness must be verified in terms of CV% and bias%. The imprecision verification study consisted of three parts: (i) three replicates per run, for five runs of at least two patients’ samples/pool/IQC; (ii) calculations of within-laboratory imprecision (SWL) and laboratory repeatability (intra-assay-SR); (iii) assessment of uniformity with claims (σWL and σR for manufacturer total imprecision and repeatability, respectively) and acceptability of test results. Three levels of IQC materials (low, medium and high) were used for this study in order to cover the entire analytical measurement range: Lyphochek immunoassay plus control (Lot 40340, Bio-Rad Laboratories, Irvine, USA) for new-17OHP and new-DHEA-S and Liquichek specialty immunoassay control (Lot 60220, Bio-Rad Laboratories, Irvine, USA) for new-vit.D. The manufacturers’ imprecision were calculated at the concentrations of the IQC interpolating the data reported in the IFU using the following equation: y=(y2–y1) × (x–x1)/(x2–x1) + y1, where y=CV to interpolate, x=IQC concentration and y1 and y2 are the CVs reported by the manufacturer at x1 and x2 concentrations, respectively.
Trueness was estimated by analysing materials with known concentrations (survey materials from PT/EQA programmes), comparing results with target values and establishing the verification interval (VI): the mean value obtained in these studies should be included in the VI. 7 Two materials from EQAS-CNR (Immunocheck-Qualimedlab, Pisa, Italy) for new-17OHP and new-DHEA-S and from UK NEQAS (Birmingham Quality for vitamin D) for new-vit.D were used.
Evaluation of results comparability
For results comparability, the document CLSI EP09C-ED3 12 was analysed to establish the most suitable workflow. At least 40 patient samples were selected to cover the analytical measurement interval. De-identified residual serum specimens submitted for routine testing were measured in duplicate using the new EPs, 61, 68 and 42 patient samples being analysed for 17OHP, DHEA-S and vit.D, respectively. The analyses were carried out in two separate batches for new-17OHP and new-vit.D and three (non-consecutive) days for new-DHEA-S.
Data analysis
Analyse-it version 2.07 (Analyse-it Software Ltd, Leeds, UK) was used for data analysis. For each assay, comparability was assessed through Passing–Bablok regression analysis. Samples with analyte concentrations below the sensitivity of the assay were excluded from the analysis.
Results
A template for the record of the verification study results is presented (Figure 1): the first part relates to the manufacturer’s data, while in the second part, the laboratory’s verification results are summarized.
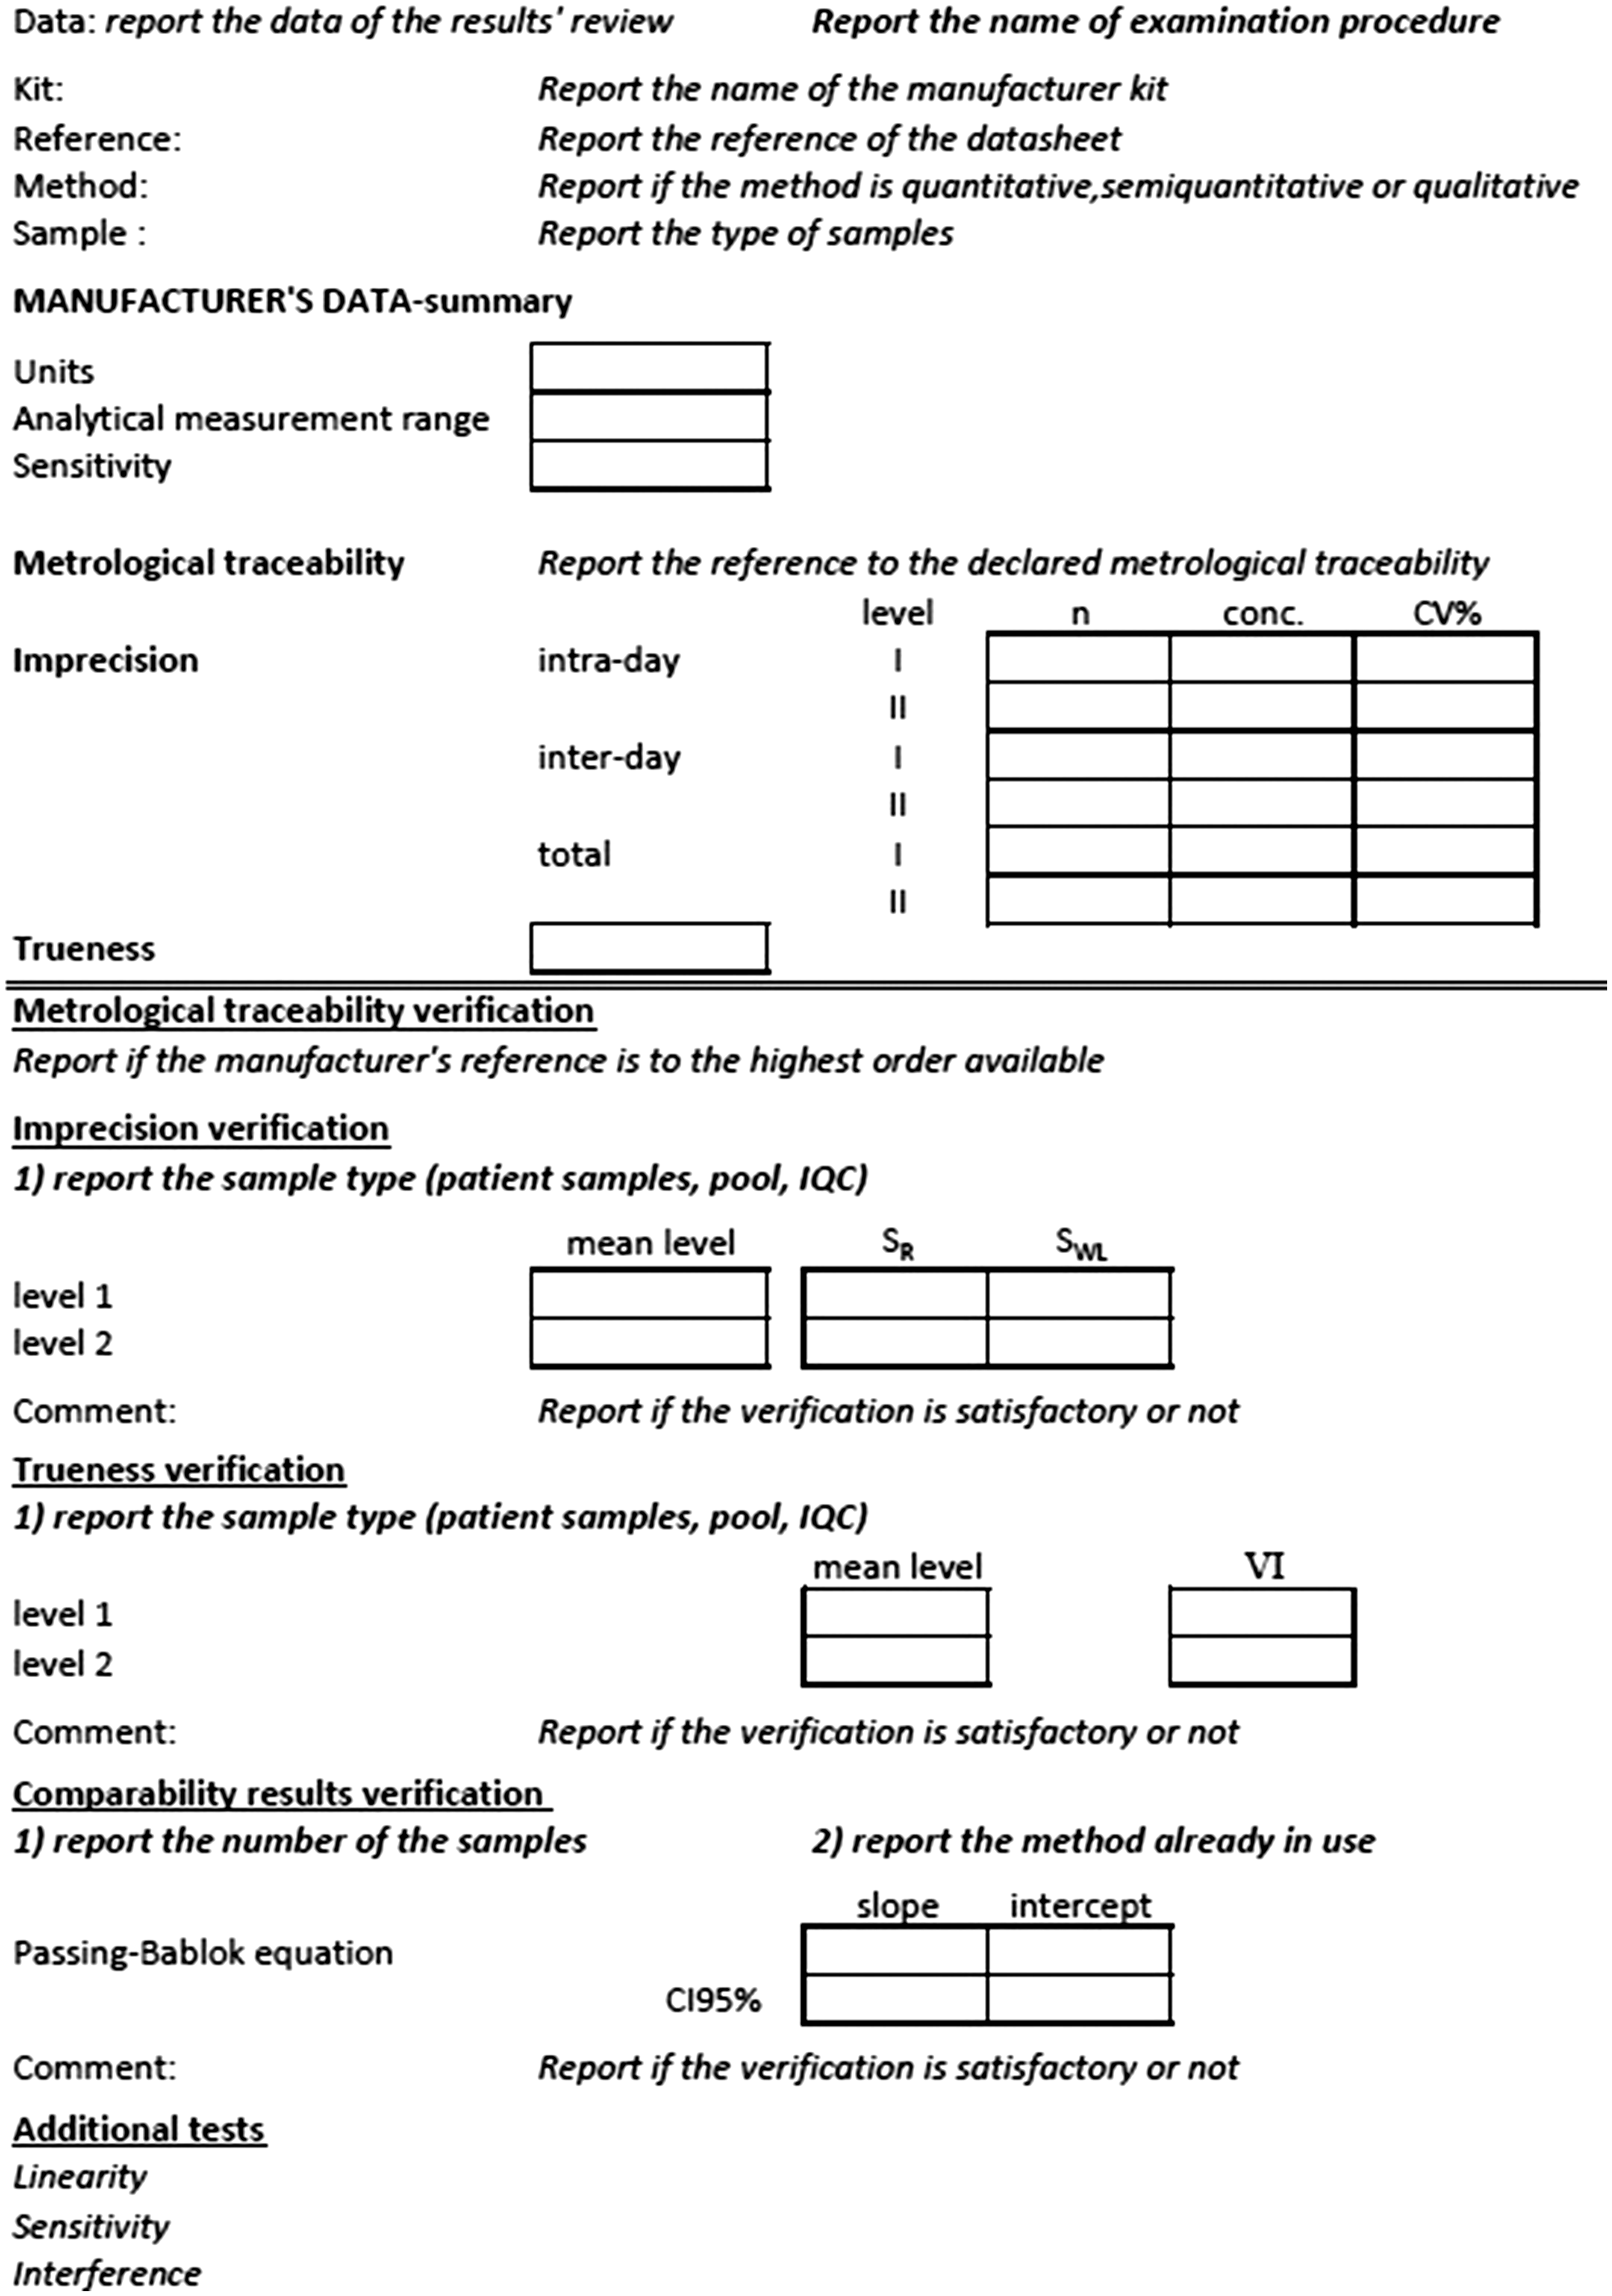
Template to record the data.
Verification of metrological traceability
According to the manufacturer’s IFUs, the new-vit.D method was standardized against the certified reference material (CRM), NIST SRM 972A; new the 17OHP was traceable to the SNIBE internal reference substance, and new-DHEA-S was standardized against the SNIBE internal reference substance. On searching the JCTLM database, the certified material NIST SRM 972A was the available higher order of metrological chain for vit.D, and no CRMs or reference measurement procedures were available for the other two analytes.
Verification of EPs
Imprecision verification
For new-17OHP, the intra-laboratory CVs obtained were 8.9%, 6.1% and 5.3% at 2.22, 4.75 and 13.81 nmol/L, respectively. The interpolated CVs specified by the manufacturer were 7.2%, 7.1% and 5.9% for these three concentrations, respectively. For levels 2 and 3, the laboratory data were satisfactory. The upper verification limit (UVLWL) for level 1 was calculated as described elsewhere 7 : UVLWL was 10.3%. For new-DHEA-S, the intra-laboratory CVs obtained were 2.7%, 3.5% and 3.4% at 2.03, 4.67 and 15.60 μmol/L, respectively. The interpolated CVs declared by the manufacturer were 6.4%, 4.2% and 4.0% for these three concentrations, respectively. For new-vit.D, the intra-laboratory CVs obtained were 5.9%, 3.1% and 2.3% at 52.6, 97.2 and 236.9 nmol/L, respectively. The interpolated CVs specified by the manufacturer were 6.1%, 5.1% and 4.0% for these three concentrations, respectively.
Trueness verification
The mean concentrations for the two EQA materials obtained with new-17OHP were 2.68 and 9.22 nmol/L, and the VIs were in the range of 1.36–3.31 (target value, 2.33 nmol/L) and 20.12–24.06 nmol/L (target value, 22.09 nmol/L), respectively. For new-DHEA-S, the mean concentration for the first EQA material was 3.96 μmol/L and the VI was 1.67–4.14 μmol/L (target value, 2.90 μmol/L); the second concentration was 14.66 μmol/L and the VI was 7.50–26.15 μmol/L (target value 16.83 μmol/L). The mean concentrations for the EQA materials obtained with new-vit.D were 48.7 and 142.5 nmol/L, and the VI were 35.5–49.2 (target value, 42.5 nmol/L) and 125.2–143 (target value 134 nmol/L) nmol/L, respectively.
Evaluation of results comparability
The Passing–Bablok regression analysis obtained for 17OHP was new-17OHP = 0.61x r-17OHP + 0.71 with 95% confidence intervals (CIs) for the slope from 0.56 to 0.67 and for the intercept, from 0.51 to 0.89. For DHEA-S, the equation was new-DHEA-S = 1.44x r-DHEA-S + 0.25 with the 95% CI for the slope from 1.36 to 1.52, and 0.06 to 0.51 for the intercept. Regression for vit.D was new-vit.D = 0.99x r-vit.D + 12.17, with the 95% CI for the slope ranging from 0.89 to 1.12, and for the intercept, from 8.31 to 17.36.
Discussion
The medical laboratory introduces new or replacement EPs relatively frequently. Laboratory staff are frequently presented with new clinical demands for the introduction of new tests. Manufacturers regularly release new versions of kits when analytical improvements are made or when a new technology becomes available. An ISO 15189-accredited laboratory is responsible for documenting and recording any changes, with the main purpose of guaranteeing patient safety. Any changes made must have a positive rather than a negative impact on the patient’s outcome.
The working approach for implementing or replacing an EP described in the present study involves the evaluation of three CE-IVD EPs. 17OHP, DHEA-S and vit.D on an automated CLIA instrument were evaluated and compared with EPs already in use in our laboratory. First, on scrutinizing the IFUs issued by manufacturers, we found that metrological traceability was reported only for vit.D. The verification made using the JCTLM database 11 to investigate the availability of CRMs or certified reference procedures demonstrated that manufacturers report the metrological traceability for the measurand for which it was available. Indeed, as in the case of 17OHP and DHEA-S, metrological traceability is unavailable for numerous measurands. 13 Second, assay verification was undertaken in order to continue the evaluation. The ISO 15189 standard requires the laboratory to verify already validated methods (CE-IVD EPs), demonstrating that performance requirements are met. As stated by Scheneider et al., the goal of accreditation is to ensure that staff members know exactly what to do and how to do it 6 : currently, laboratories are required to verify performances, but each laboratory is responsible for defining internal procedures in order to establish how to conduct the verification study. The purpose of the verification study, described in detail elsewhere, 7 is to verify that the EPs used reflect the performance characteristics declared by the manufacturer, or are in line with the state of the art, and that they are always appropriate for their intended use, balancing technological possibilities, risks and costs. For quantitative methods, the internal procedure allows for the verification at least of imprecision and trueness. At the discretion of laboratory management, additional assessments (such sensitivity, linearity, interference) of specific relevance to a particular EP may be undertaken. CLSI EP15 was used as guideline for this study and for data elaboration. 14 For new-17OHP, new-DHEA-S and new-vit.D, the imprecision verification was satisfactory, the imprecision obtained by the laboratory in terms of total imprecision always being less than the claimed total imprecision. In only one case, total UVL was calculated (IQC level 1 of new-17OHP), and UVLWL (10.3%) was less than the total CV% of the laboratory (8.9%). The trueness verification was satisfactory for all the EPs, with the exception of the second material for new-17OHP, since the means obtained by the laboratory were included in the VI. The VI is calculated by taking into account the target value, the number of laboratories contributing to defining the target value and the standard deviation associated with the target value. For the unsatisfactory result (new-17OHP level 9.22 nmol/L, VI from 20.12 to 24.06 nmol/L; target value, 22.09 nmol/L), the EQA provider’s report was reviewed in detail: we observed that all the results obtained with immunoassays (IAs) were lower than those obtained with liquid chromatography coupled with tandem mass spectrometry (LC-MS/MS). This is a well-known problem; steroid measurement by IA suffers from numerous cross-reactivities and false-positives and also incurs a risk of false-negative results. 15 Therefore, following the approach described in detail elsewhere,7,9 the laboratory result was in line with the state of the art.
In order to guarantee that laboratory information was correctly interpreted, a verification was made of the comparability between the results obtained on two different EPs (i.e. those already in use and those newly introduced). The internal procedure describes the procedure used for conducting this study according to CLSI EP09. 12 In order to include and to control the inter-day variability, the test was carried out by splitting and measuring patient samples in at least two non-consecutive days (two for new-17OHP and new-vit.D and three for DHEA-S). The Passing–Bablok regression analyses demonstrated significant proportional and constant differences for 17OHP and DHEA-S and only a constant difference for vit.D. For vit.D, an acceptability criterion should be specified, taking into account the clinical decision limits stated in the report. Our clinical decision limits are defined following the recent position statement of the Italian Association of Clinical Endocrinologists and the Italian Chapter of the American Association of Clinical Endocrinologists, and also to the Endocrine Society Clinical Practice Guideline.16,17
Non-comparability was found for the other two EPs. This finding was expected, given the high variability in the IAs results in steroid determination. 18 Therefore, the introduction of new EPs into routine clinical medicine calls for a revision of reference intervals, while taking into account the procedure reported in the CLSI EP28-A3C-ED3, 19 in particular the section dedicated to the transference of the reference intervals. The reference intervals already in use could be re-calculated using the Passing–Bablok regression obtained or the reference interval established by the manufacturer could be used. The acceptability of the transference may be assessed by examining a small number of reference individuals (n = 20): if two or fewer test results fall outside the reference intervals, the transference can be considered acceptable. Certainly, especially in the case of 17OHP, for which the reference intervals are classified in many subgroups (i.e. new-borns, children, adolescents, adult males, adult females in various phases of the menstrual cycle), it may prove difficult to recruit 20 individuals. A close collaboration between the laboratory professional and the clinician is necessary in such cases to evaluate clinical needs and to organize the recruitment of the individuals for the verification of reference intervals.
The application of this operating flow highlighted that IFUs are often inadequate: data reported are not exhaustive; the manufacturers specify few performance characteristics or provide no useful data. For example, although the limit of quantification should be reported, as explained in the CLSI EP17-A2, 20 the manufacturer reported sensitivity as limit of detection for new-17OHP and as limit of blank for the other two EPs (new-DHEA-S and new-vit.D).
Greater collaboration between laboratory professionals and manufacturers would lead to improvement in information provided in datasheets, thus facilitating achievement of the verification procedure according to the ISO 15189:2012.
Importantly, we found a lack of harmonization among measurement units used with kit manufacturers and EQA providers reporting concentrations in a variety of units. Even in the case of vit.D, for which harmonization has been achieved, 21 concentrations were expressed in SI units (nmol/L) or not (ng/mL). On evaluating DHEA-S, three different units (μmol/L, μg/dL, mg/L) were used to report concentrations, thus obfuscating assessment of data. Harmonization of SI units must therefore be considered mandatory.
The working approach proposed by us calls for expert skills in biostatistics, in particular for the calculation of the UVL (imprecision verification study) and the VI (trueness verification study). The laboratory staff should be provided with spreadsheets designed to introduce the raw data of each procedure with all preset calculations and automated final results. The last step of this operative approach is to record all data obtained, together with the review of results by appropriately qualified staff. 5 In order to harmonize the recording of the data, a template for the record of the verification study results is available for all the laboratory staff.
In conclusion, a working pathway is presented to implement examination procedures in routine clinical practice according to ISO 15189:2012 accreditation. The procedures needed to meet the technical requirements of metrological traceability, verification, results comparability and reference intervals definition are specified, while taking into account feasibility, by balancing available resources and patient safety. Considering that the approaches proposed have been recognized to comply with ISO 15189 requirements during the accreditation visits, this pathway should assist clinical laboratories in qualifying for adhering to the accreditation process.
Footnotes
Acknowledgements
The authors thank Miss Severina Rocco for her excellent technical assistance in the laboratory analyses, and Medical Systems for kindly providing the reagents used to perform the evaluation.
Declaration of conflicting interests
The author(s) declared no potential conflicts of interest with respect to the research, authorship, and/or publication of this article.
Funding
The author(s) received no financial support for the research, authorship, and/or publication of this article.
Ethical approval
Not applicable.
Guarantor
GA.
Contributorship
GA was involved in the conception and design of the study and performed the data collection. All authors were involved in interpreting the data. GA drafted the article, and all authors contributed in critically reviewing the article. All authors read and approved the final version of the article.