
Abstract
Background
The misnamed ‘vitamin’ D is actually the hormone calcitriol (1,25 dihydroxyhydroxyvitamin D). It has a central regulatory role in calcium metabolism, and more widely in the immune system. The prohormone calcifediol (25 hydroxyvitamin D) is more easily measured in the laboratory and is the analyte used in reference interval formulation. Being highly lipid soluble, both calcifediol and calcitriol travel in the bloodstream on carriage proteins, principally on vitamin D-binding protein.
Summary
This review reports our current understanding of vitamin D-binding protein. Its genetic determinants and their effect on it and secondarily on calcifediol concentrations and assays are described. Its complex interplay with parathyroid hormone is considered. The analytical state of the art is translated into the challenge it imposes clinically, in the formulation of reference intervals and in their use in advising and managing patients. Several recent challenges thrown up to laboratories by percipient clinicians highlight the dilemma vitamin D-binding protein poses. A way forward is suggested.
Introduction
‘Vitamin D’ is arguably one of Earth’s five most well-known vitamins, along with A, B, C and K, and although vital to life, it is actually not a vitamin but, rather, is the hormone calcitriol, 1,25(OH)2D. Although scientific purists might suggest otherwise, we will probably continue to speak indiscriminately of both calcitriol and its precursor calcifediol (25OHD), as well as the parent compound calciferol, as ‘vitamin D’, and in this report, where other authorities persist with the term ‘vitamin’, one cannot but quote their usage.
Calcitriol has a central regulatory role in calcium metabolism and more widely in the immune system. Links for it with the cardiovascular system, in glucose metabolism and with cancer susceptibility have all been posited but proof of causation is as yet weak or absent. 1 Calcitriol’s molecular structure was determined nearly 90 years ago by Adolf Windaus, 1928 Nobel laureate in chemistry. 2 In 2016, its in vivo chemistry, its complex, multiorgan sited, synthetic pathway and its physiological control framework are all now established and described in definitive texts such as that of Feldman et al. 3 A recent review focusing on fetal, and then newly neonate, calcitriol and mineral dynamics has been published by Kovacs. 4
Calcitriol and its precursor prohomone, calcifediol, are both highly lipid soluble and thus predominantly travel in the blood stream attached to one of two carriage proteins – approximately 90% bound tightly to vitamin D-binding protein (DBP) and some 10% more loosely on albumin. Only 0.04% of the total calcifediol and 0.4% of calcitriol are present in the free form in the human blood stream. 5 Calcifediol, though still at prohormone stage, is measured more easily and accurately in the laboratory than is calcitriol and is the assay of choice. Calcifediol is present in nanomolar quantities with a half-life of 15 days. Calcitriol circulates at lower, picomolar concentrations and has a half-life of 15 h. 6 Ambient calcitriol concentrations are also driven acutely by parathyroid hormone (PTH) and may not accurately reflect the contemporary true availability of calcifediol in the given human.
Biochemical testing for the D ‘vitamins’ has mostly moved on from the earlier protein-binding assays, 7 through high-performance liquid chromatography (HPLC) 8 to a variety of LC combinations linked with tandem mass spectrometry, LC MS/MS, (MS/MS), three of which are reference measurement procedures (RMPs).9–11 The International Organization for Standardization (ISO) lists the requirements for RMPs for clinical diagnostic markers in ISO 15193 12 and in turn the Joint Committee for Traceability in Laboratory Medicine (JCTLM) reviews potential RMPs and lists those that meet the ISO 15193 requirements; 13 thus, the LC MS/MS ‘25-hydroxyvitamin D3’ procedure of the National Institute of Standards and Technology in the USA, NIST, is a JCTLM database listed with identification number C7RMP17, as is, in Europe, the Ghent procedure, C8RMP3. Their D2 procedures are assigned C7RMP16 and C8RMP4, respectively. More recently in the USA, the Centers for Disease Control and Prevention (CDC) had its assay accepted and assigned C12RMP2 for D3 and C12RMP3 for D2. 14
Further, many commercial immunoassays are also used to measure calcifediol in clinical laboratories. NIST has also produced a certified standard reference material (SRM) for 25(OH)D, SRM972a. Certified values for calcifediol in its levels 1, 2 and 3 range from 45.1 ± 1.1 to 71.8 ± 2.7 nmol/L 15 and it also specifies values for 25(OH)D2, 3-epi-25(OH)D3 and 24,25(OH)2D, values which are of use where MS/MS platforms are deployed. Though now devoid of the horse serum which had rendered its predecessor SRM972, 16 immunoassay incompatible SRM972a still might be seen as partially incomplete because it lacks a level that descends in to the purported human calcifediol deficiency zone, somewhere below 30 nmol/L, and it is generally accepted that calibrators and controls should cover the entire range which is sought to be assayed. Nonetheless, it functions as the chain linking the RMP anchor to the less rigorous analytical platforms.
In 2013, the United Kingdom, (UK), National Osteoporosis Society published a practical clinical guideline (the Guideline) on the management of vitamin D deficiency in adult patients with, or at risk of developing, bone disease.
17
The guideline uses ‘25OHD’ and ‘vitamin D’ as synonyms. In contrast with other such published recommendations,18–20 which warn of problems in general but remain silent as to detail,18,21 it is uniquely realistic in both acknowledging that problems here pervade the link between the biochemistry laboratory and the clinician and in also actually listing several such matters. Amongst others, it thus cites:
issues with immunoassays: calibration and standardization, and the concentration of DBP in the plasma.
A detailed discussion concerning the commercially deployed calcifediol immunoassays and the relative accuracy and precision they achieve, their calibration and standardization vis à vis RMPs is beyond the scope of this review but must be considered by laboratorians. It should be noted, briefly, that as well as the array of interferences common to all immunoassays, concerning which see the review by Tate and Ward, 22 calcifediol immunoassays suffer from the cross-reactivity of other hydroxylated D metabolites and they rarely achieve equimolar recognition between cholecalciferol (D3) and ergocalciferol (D2) often ignoring much D2. In practice this is only of concern where D2 is used therapeutically such as in the USA. Laboratorians have a duty of care to act wisely when choosing instrumental platforms and should thence also advise their client clinicians the precision limits of the published results. However, unfortunately, inaccuracy and imprecision abound. Details are tabulated in Tables S1 and S2.
Laboratorians will be guided by pertinent studies23,24 and can access quality assurance (QA) schemes, one of which is DEQAS, the Vitamin D External Quality Assessment Scheme based in London, UK. 25 Its target values (TV) are assigned by an NIST RMP grade analyser. The performance target is set at TV ± 25%. Failure to meet that target in > 25% of the assessed samples is regarded as ‘unsatisfactory’. These are very wide tolerance limits. In the USA, in 2010, the CDC also set up a Vitamin D Standardization-Certification Program (VDSCP) with the aim of harmonizing total 25(OH)D procedures. In contrast with DEQAS, it requires assay manufacturers and laboratories to achieve performance criteria of within ± 5% mean bias to (i.e. inaccuracy from) the CDC and Ghent RMPs and an overall imprecision of < 10% over the concentration range of 22 to 275 nmol/L for total 25(OH)D. 26 Its work is discussed further below.
DBP may be a key with which to examine many of these issues which do continue to challenge the reliability of workaday calcifediol laboratory results. The import of some of these issues has only been realized in this millennium and is still being worked through by clinical chemists. They are reviewed here.
DBP and its critically interacting issues
DBP
DBP’s history is neatly encapsulated at the Online Mendelian Inheritance in Man, the OMIM, website,
27
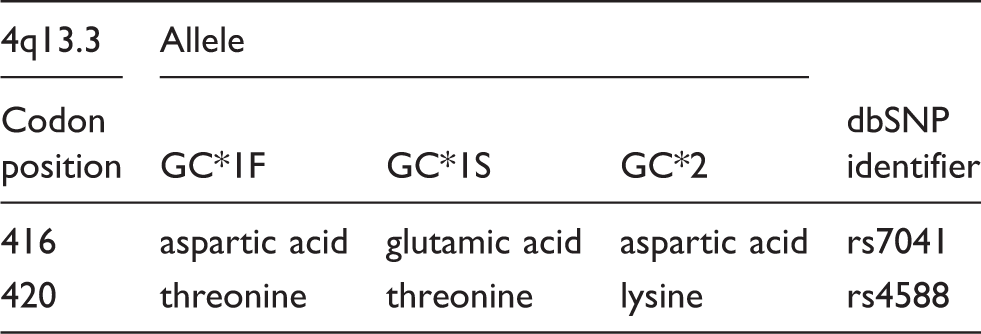
where further detailed references are available; thus GROUP-SPECIFIC COMPONENT; GC Alternative titles; symbols: VITAMIN D-BINDING PROTEIN; DBP; HGNC Approved Gene Symbol: GC Cytogenetic location: 4q13.3
28
Polymorphism of the serum alpha-2-globulin then called Gc, group-specific component, was discovered with immunoelectrophoresis in 1959, with Gc1-1, Gc2-2, and Gc2-1 phenotypes distinguished also by starch or agar electrophoresis. In 1959 another human plasma protein, vitamin D-binding alpha-globulin (VDBG) was also described, and in 1975, it was demonstrated that Gc and VDBG are identical, i.e. DBP. Finally, in 1985, GC cDNA was cloned from an adult liver library. GC is a 458 amino acid protein with a single polypeptide chain and a molecular mass of some 52,000 Da. That mass will vary, very slightly, predictably by genotype, and unpredictably by isotopic content. It shares 25% and 19% sequence identity with albumin and alpha-fetoprotein, respectively. The pattern of disulphide bridges that contribute to the double loops forming the three domains in each of the three proteins is highly conserved. DBP mutates slowly; it evolved into being some 600 ± 60 Mybp and is conserved in the descendants of our ancestral fish. 29
Viewed from the level of molecular genetics, more than 120 rare variant alleles of GC have been identified in addition to the three common alleles, GC*1F, GC*1S and GC*2. These three alleles exhibit a discernibly distinct geographical distribution. The GC*1F-allele frequency is markedly higher among sub-Saharan Africans. Populations with a ‘pale’ skin have a relatively lower frequency of the GC*1F allele and a higher frequency (up to 60%) of the GC*1S. The GC*1F and GC*1S allele frequencies display a typical geographical cline from Southeast Asia, through Europe and the Middle East, towards Africa. A common feature of all populations is the lesser predominance of the GC*2 allele, although Europids do have a markedly higher GC*2 allele frequency than do other ancestral groups.30,31
DBP genetic variation and amino acid outcomes.
Ancestry’s effects in DBP, in vivo and as interpreted ex vivo in the laboratory
The proteins that human DBP’s three common alleles encode are so sufficiently different as to have produced noticeably different outcomes physiologically, differences that unfortunately can confuse those who attempt to measure them and confound assays.
Several studies of DBP over several decades have used immunochemistry-based methods and, since 2015, HPLC-MS/MS studies also have been deployed to examine the consequences for the human ‘vitamin D’ metabolism from DBP’s genetic variants; most of the studies, tabulated below, are of Europids.33–39 The mass spectrometry work also performed concomitant ‘genotyping’, utilizing the mass and charge pattern of protein fragments derived from the pertinent mutation zones to determine protein haplotypes. The k coefficient (with 95% CI) for agreement of the genotype for each individual studied as between MS/MS and SNP genotyping arrays was 0.97 (0.95–1.00). 40 This adaption of mass spectrometry to assay proteins has unequivocally succeeded with DBP,41,42 confirming the outcomes of prior studies which used polyclonal antibodies, but not any with a monoclonal antibody. Monoclonal antibodies must be avoided here although, unfortunately, peer-reviewed literature based on them already exists.40,43
Vitamin D binding protein, effect of genetic variation on DBP and vitamin D concentrations, arrayed by method and study.
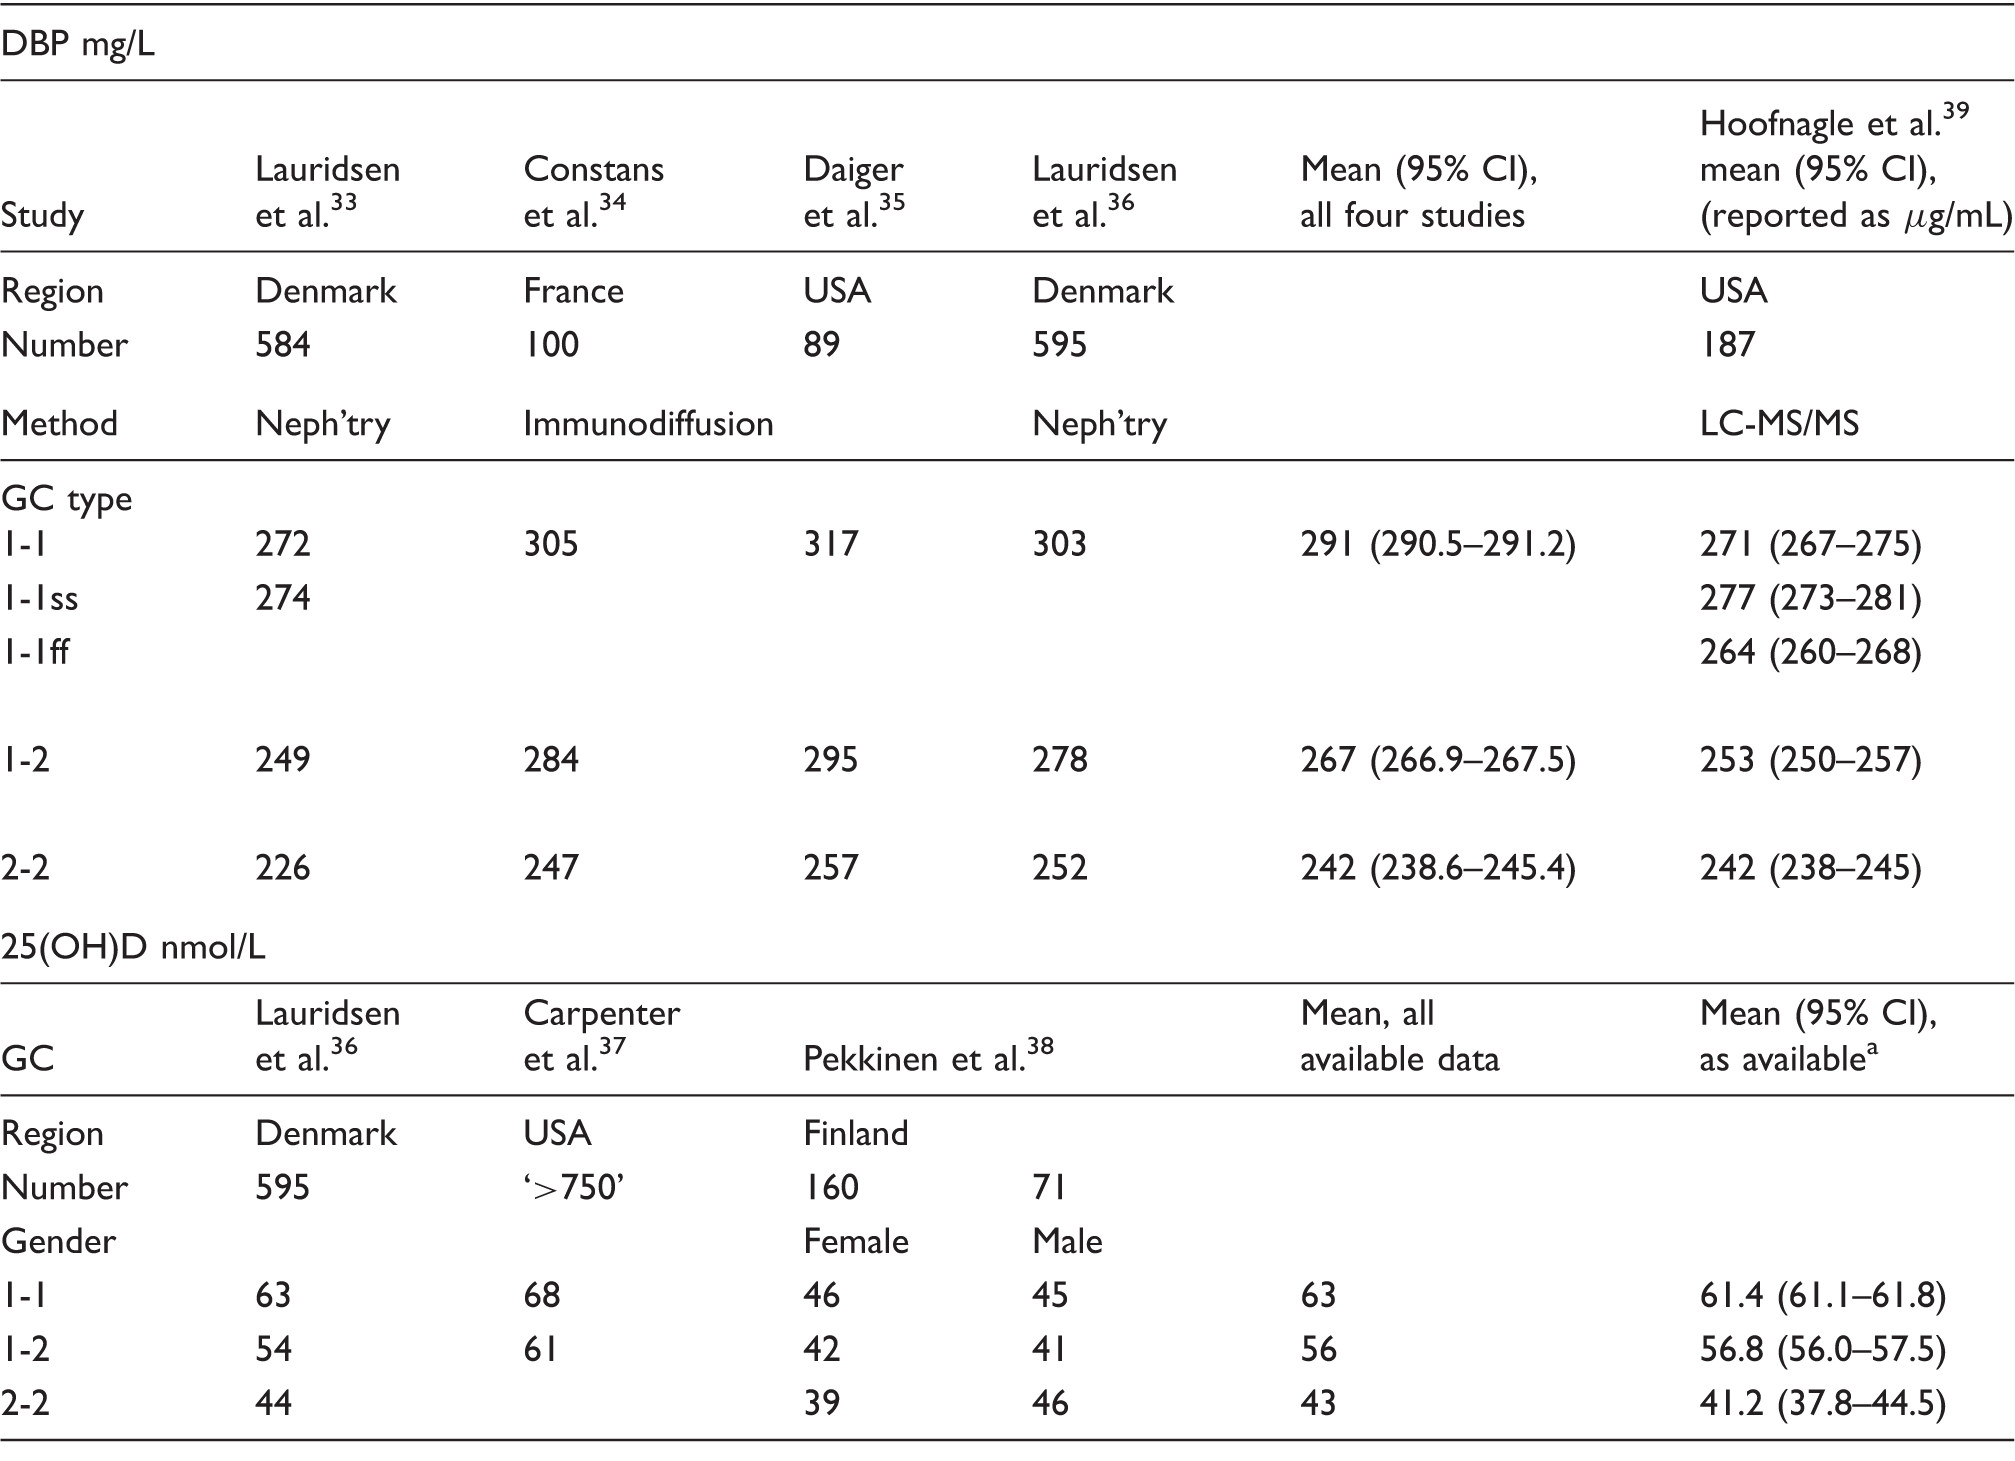
Neph’try: nephelometry.
Note: The correlation coefficients, R, between prevalent blood stream concentrations of DBP by genotype, and total calcifediol concentrations are 0.987 for the immunoassay mean and 0.952 for the MS/MS assay.
The data would seem to support the proposition that ancestry, seen in one’s DBP genetic status, predicts both DBP and, thence, calcifediol concentrations. At the two extremes, in the MS/MS data, people with GC 1-1ss have mean DBP (95% CI), 277 (273–281) mg/L, while those with GC 2-2 have 242 (238–245) mg/L, P for the difference, < 0.0001. Prevalent blood stream concentrations of DBP by genotype and total concurrent calcifediol concentrations also correlate tightly across the full haplotype range with R coefficients 0.987 for the DBP immunoassay mean and 0.952 for the DBP MS/MS assay.
Affinity constants (Ka) of the major DBP isoforms for calcifediol, as D3, have been known for over two decades. Constans and Arnaud
45
published well-founded values for homozygous subjects ± SD, as they were then known, Gc1F, KDBP = 1.12 ± 0.13 × 10⁹ M−1, Gc1S, KDBP = 0.60 ± 0.15 × 10⁹ M−1, Gc2, KDBP = 0.36 ±0.10 × 10⁹ M−1.
Since DBPs with a higher affinity constant are found in higher concentrations and are also accompanied by higher calcifediol concentrations by comparison with those with lower constants and lower concentrations, it can be suggested that they therefore permit a probably similar concentration of free hormone to be available to the body’s target cells. Pekkinen et al.
38
have demonstrated that the physiology actually found confirms the accuracy of this inference. Further to the work just described, they also examined the relationship between DBP genotypes and PTH in their Finlandish cohorts. Across the whole population, PTH concentration correlated negatively with calcifediol, as would be expected. Perhaps, initially paradoxically, however, within the genotype groups, GC 2/2, with the lowest calcifediol concentrations also had the lowest PTH concentration, and conversely GC 1/1, with the highest calcifediol concentrations, had the highest PTH concentration.
38
These PTH results reconstructed, aggregating both genders from his published data are thus, (mean, [95% CI]): GC 1/1, 4.587 (4.583-4.593); GC 1/2, 4.338 (4.325-4.352); and GC 2/2, 3.667 (3.547-3.786), all pmol/L.
DBP’s effects, as they affect the ability of the laboratory and the clinician to interpret D status
When one turns to applying the insights sketched above to the task of interpreting peoples’ calcitriol concentrations, several further critically important and inter-related issues arise. Being thus inter-related a little repetition is inevitable in the following commentary. Not all of these matters are necessarily either well known, accepted as a challenge, or both, by pathologists and by other clinicians.
Biochemical testing
As noted above, the pathology industry now benefits from the existence of an array of platforms on which to assay calcifediol. At the pyramid’s peak, there are JCTLM listed RMPs, LC MS/MS analysers, and at its base, commercially produced immunoassays which populate workaday clinical laboratories and are linked to the RMP by SRM972a. One critically important procedural difference distinguishes the LC MS/MS systems (and the less used RIA, radioimmunoassay) from the immunoassay instruments. The MS/MS procedures, and the RIA, first strip the analyte from its carriage proteins with a hexane derivative, or a similar fluid and process, and thereby effect close to complete extraction of the calcifediol. The assay follows with the analyte dissolved in, e.g. methanol, rather than aqueous fluid. None of the automated immunoassay techniques deploy any such stripping step though they attempt to dislodge the calcifediol from the protein using aqueous fluids that are compatible with plasma and serum. This, however, leads to undesirable consequences.
Firstly, although the MS/MS methods accurately establish the total calcifediol in a sample, they cannot, on their own, estimate the contemporaneously ‘bio-available’ prohormone that consists of the free, un-protein-bound, component which is poorly, but actually, in solution in plasma and, as noted above, also the albumin-bound component. Together, these constitute the active pool of prohormone, and hormone, the latter operating ultimately within cells and interacting in the pertinent control cascades with PTH, and calcitonin, though calcitonin probably plays the lesser role in humans. Immunoassays are even further from being able to estimate bio-available prohormone because they can neither guarantee that they are assaying all the analyte in the given sample, nor report what fraction they are actually assaying.
That this differential detrimentally affects immunoassays has been proven by Heijboer et al.’s group.
46
She reports that there is ‘an inverse relationship between DBP concentrations and deviations of measured 25(OH)D concentrations from ID-XLC-MS/MS results for all 4 fully automated immunoassays tested’, the Architect with P = 0.004, and the Centaur, iSYS, and Liaison analysers, all three with P ≤ 0.0001. She continues in these … assays not all 25(OH)D is extracted from the DBP in sera that have a relatively high DBP concentration. Such incomplete extraction leads to falsely low 25(OH)D concentration results … [and] points to the importance of the 25(OH)D assay when choosing a cutoff for deficiency or insufficiency, as the percentage of vitamin D-sufficient and -insufficient people is critically dependent on the assay.
46
Although Heijboer et al.’s findings are completely consistent with the physiology summarized above – i.e. the DBP forms that have higher avidity for the prohormone are also present in higher concentrations than the converse scenario – she describes just the beginning of the problem. Any regression formulae could only be indicative of the extent of the problem, because they would be derived from assay comparisons of the calcifediol in the set of samples used with the DBP of those studied humans, each with his or her particular and specific, Ka value. That avidity will determine the extent to which a given immunoassay will access the calcifediol sought in the given human’s blood sample, and hence the true, total prohormone value. As another commentator has written, the ‘greatest single issue [here] is … now … the sample to sample variability of bias’, meaning, one presumes, the extent of this inter-individual variability. He continues, ‘it could be that these assays have reached a performance “ceiling” beyond which they cannot improve, without the introduction of a solvent extraction step which would defeat their purpose.’ (Anonymous, personal communication, July 2016.)
The VDSCP, cited above, as at June 2016 has issued certificates of compliance for all four commonly used calcifediol immunoassays and a newer platform from Japan – the Advia Centaur, the Architect, the IDS-Isys, the Liaison, and Fujirebio’s Lumipulse G – thus declaring that the values they report are within ± 5% of an RMP assay of the same sample, but it must be noted that these results are from assays performed in the manufacturers’ own laboratories. 47 To raise the level of credibility of such certification, we need the outcome replicated in workaday laboratories with real patients’ samples.
A true estimate of one’s total prohormone value could be postulated if that person’s DBP genotype was known, but it is unlikely that we will routinely undertake that investigation along with the person’s calcifediol, the first time it is ever assayed. With that in hand, and with an albumin result, an attempt could be made further to estimate a bio-available figure. Attempts are underway to establish just such valid workaday laboratory calculated ‘free vitamin D’ assays, but as yet, results are variable, as for instance from Schwartz’ group in San Francisco. Her statement that ‘Current algorithms to calculate free 25(OH)D may not be accurate’ 48 encapsulates the status quo. Her accompanying comment, ‘Unfortunately, current equations for calculation of free 25(OH)D assume 1 DBP binding affinity constant (7 × 10⁸ M−1)’ explains why. That ‘one size fits all’ constant is mythical, as shown above, although the number cited does look like a median selected from among Constans and Arnaud’s data.
Another approach that could be taken would be to attempt to assay the free prohormone itself in solution in the blood stream. One such recently introduced assay is the free 25OHD procedure from Future Diagnostics in which during the first incubation step, free 25(OH)D, both D2 and D3, is bound to an ‘anti-Vitamin D antibody’ coated on the wall of the operative microtitre plate. The in vivo equilibrium between free and bound 25OHD is said to be minimally disturbed. The rationale underlying the technology is sensible: it obviates the need for any DBP genetic analysis, but the assay is very labour intensive and with so many steps that it may leave itself open to poor performance. The reference range will be in picomoles. 49
The effects of these findings in establishing reference intervals must be considered.
Reference intervals
Since calcifediol is a prohormone, reference intervals should be able to be established for it using classical methods, though we would need multiple ancestrally rooted intervals to take account of DBP genetics and their effect on DBP and on calcifediol concentrations, and latitude would also need to be acknowledged. In practice, the world’s endocrinologists have stayed with the ‘vitamin’ myth and opted for ‘sufficiency target’ concentrations, based in one, (or both), of bone health and PTH dynamics, the outcome targets being, respectively, healthy bones and maximal PTH suppression. The former largely rules in the eastern, European, hemisphere; the latter might mainly dominate in the Americas and a few other places.
In agreement with the UK Institute of Medicine, the UK Guideline proposes that the following ‘vitamin D thresholds’ in respect to bone health apply in that realm:
serum 25OHD < 30 nmol/L is deficient serum 25OHD of 30–50 nmol/L may be inadequate in some people serum 25OHD > 50 nmol/L is sufficient for almost the whole population.
17
The 50 nmol/L sufficiency target is ubiquitous; the choice of 30 nmol/L for onset of deficiency may be closer to unique, but again, that figure is from a commonly used zone.
At the same time, however, it is clear that any reference intervals that have been established with HPLC or MS/MS methods unequivocally cannot be used uncritically in interpreting results generated by immunoanalysers without prior assay ‘harmonization’ and here presently such resolution is still being sought, as noted above. The UK Guideline is not immune. Worldwide, the Heijboer dilemma persists unanswered.
Irrespective of the assay platform their utilized laboratory deploys, clinicians have used, and presently most do continue to use, the reference intervals and sufficiency targets that have been derived from total prohormone concentrations assayed by mass spectrophotometric analysers. Some challenges have begun to emerge and are summarized below.
Outcomes: Clinicians challenging the laboratory
Calcifediol concentrations found in studies that compared analysis by immunoassays with spectrophotometric techniques and attendant concentrations of deficiency diagnosis misclassification.
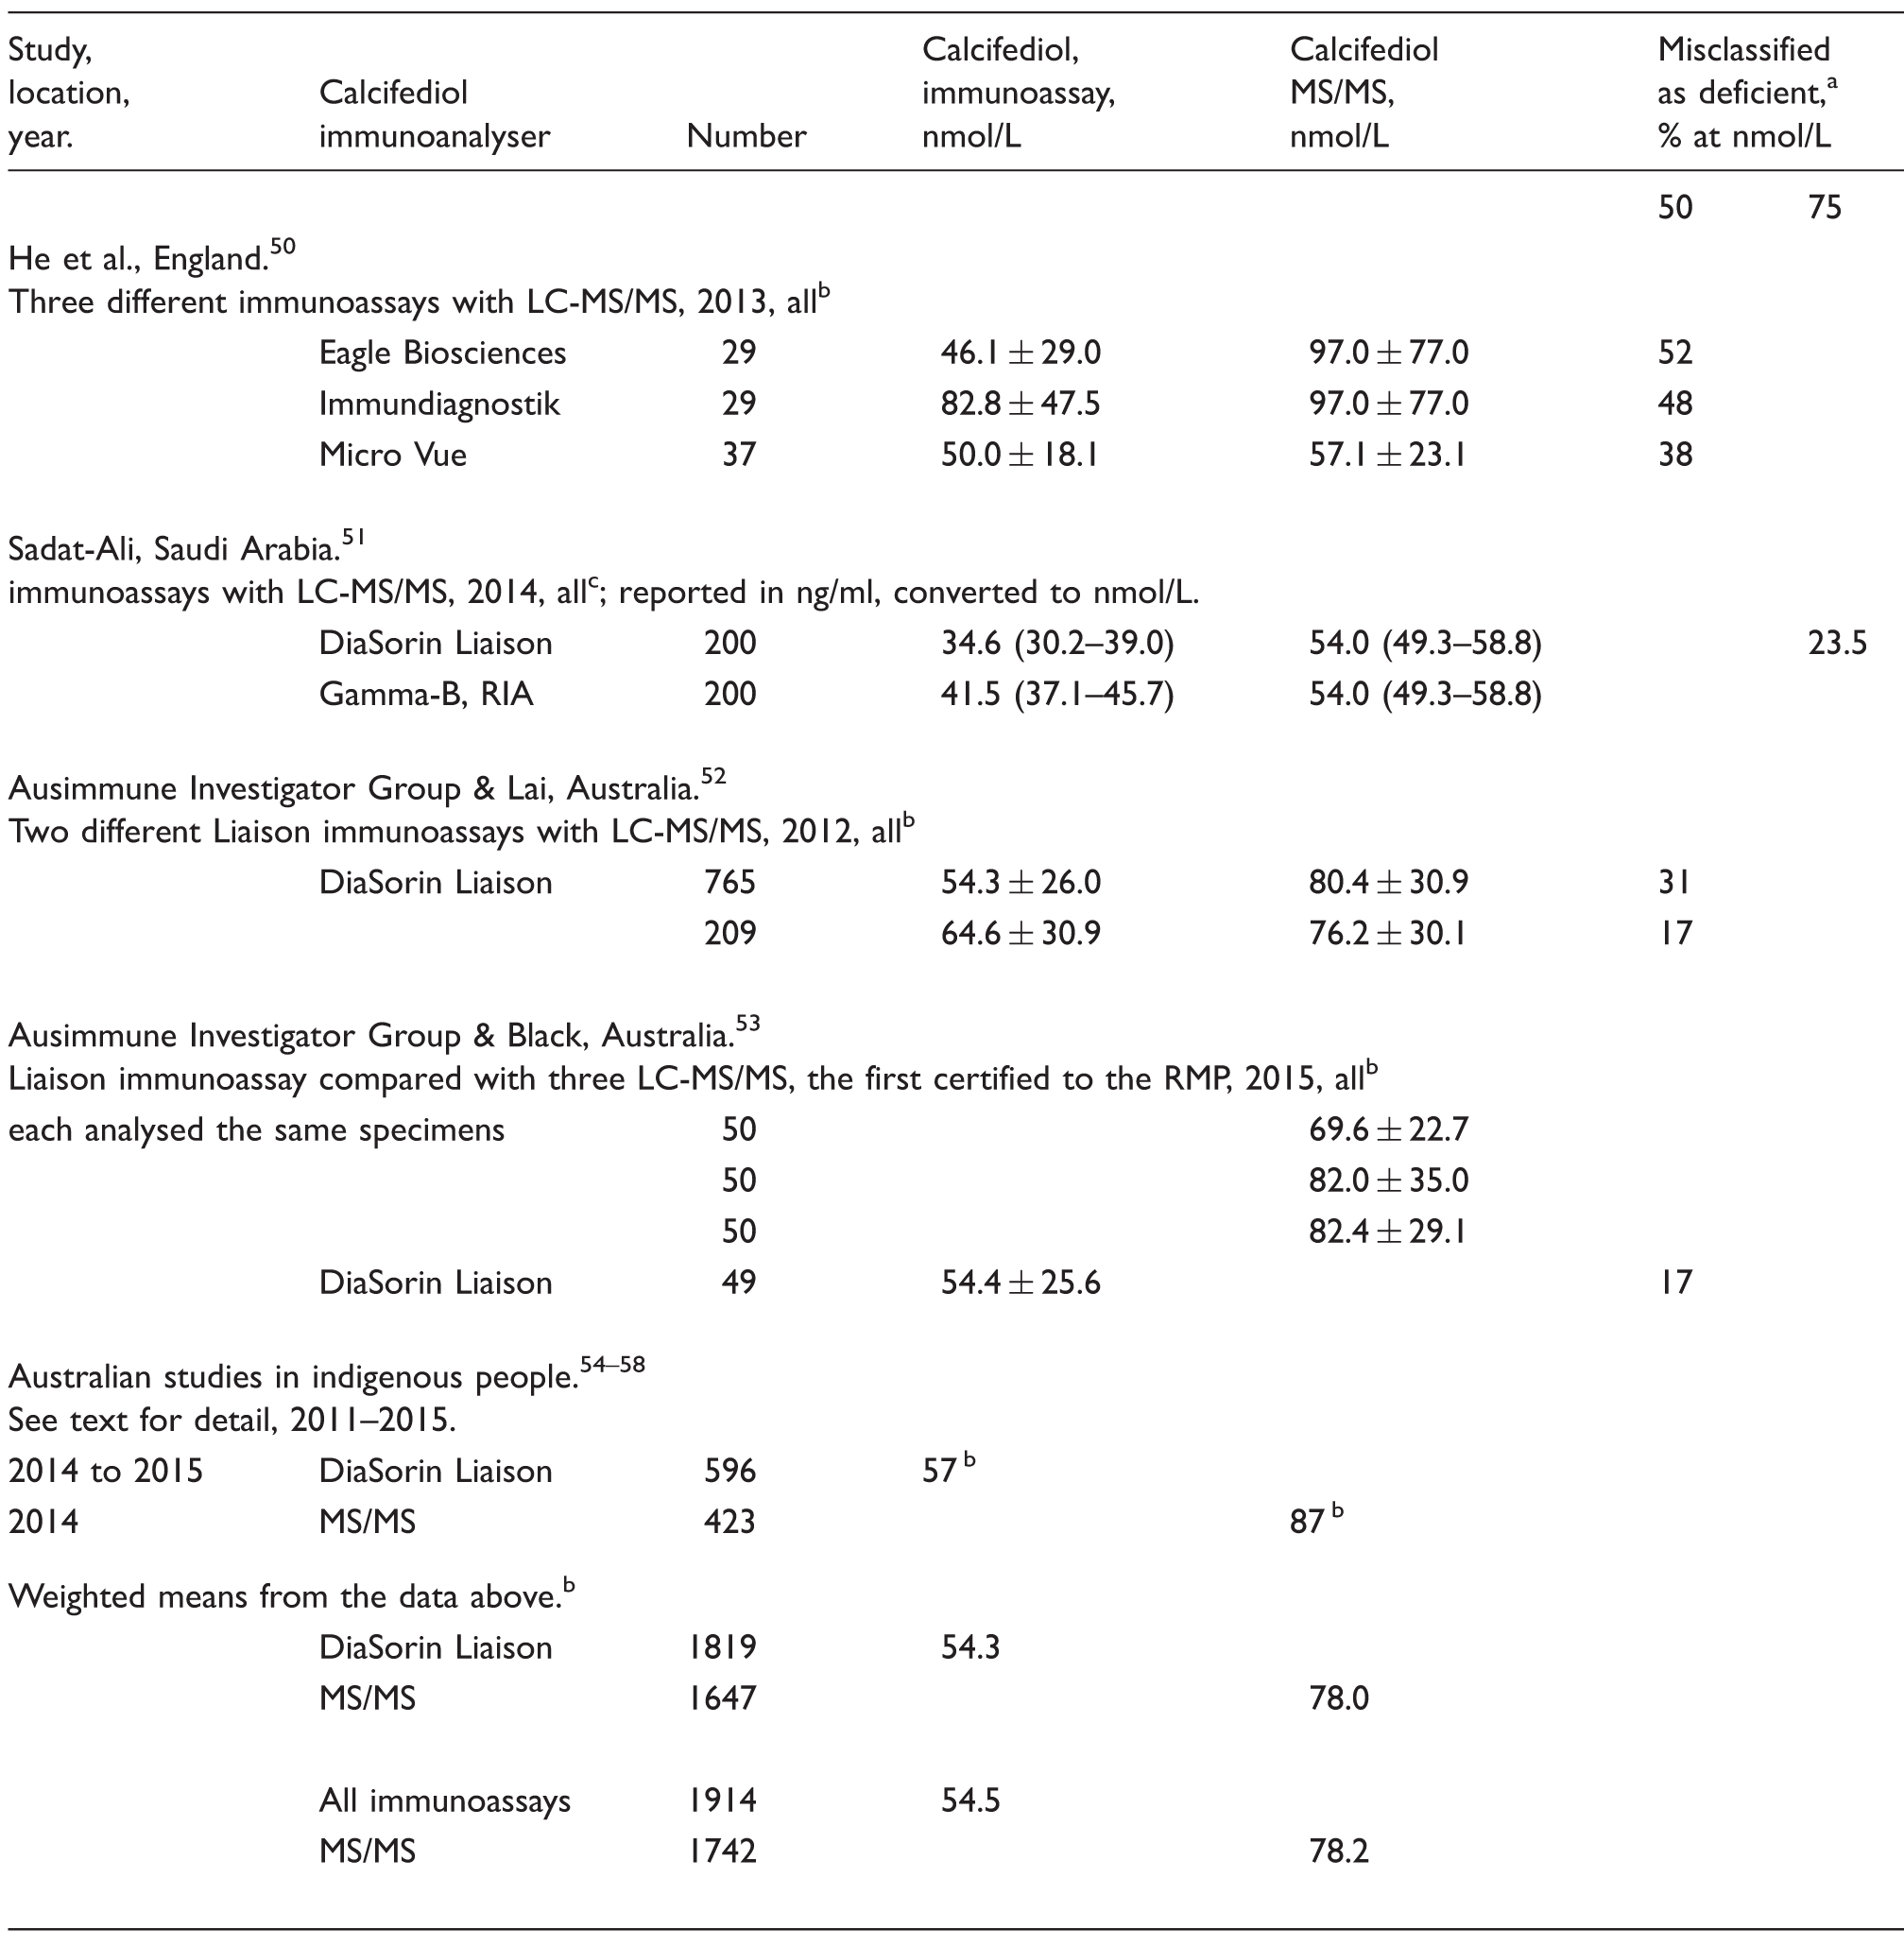
MS/MS is the criterion standard.
Mean alone, or ( ± SD).
Mean with (95% CI).
In the deliberately comparative studies, the weighted mean of all calcifediol immunoassay results was 54.5 nmol/L and in the MS/MS assays of aliquots of the same specimens, 78.2 nmol/L. In the Australian indigenous studies, keeping in mind the beneficial effect of periequitorial latitude, the independently found means were closely similar, though both a little higher: 57 vs. 87 nmol/L, respectively. All four deliberately comparative studies also reported the percentage of patients who were misclassified as deficient in calcifediol, ‘vitamin D’, by the immunoassay result by comparison with the spectrophotometer: median 35% (total range 17 to 52%). The outcome of these very recent studies, 95% comparing a Liaison assay with MS/MS, must reinforce both one’s scepticism concerning the current efficacy of VDSCP certification and the urgency of the need for ongoing realtime studies comparing immunoassay testing with MS/MS.
Few clinicians seem to know why the problem exists. The immunoassay trusting Australians seem to be unaware of it. Sadat-Ali simply prevaricates. 51 He alone closes on the target, but ultimately he vacillates, thus ‘a confounding factor for the variable results might be due to the strong binding of 25(OH)D to VDBP’. 50 Black et al. describe concerns that while not irrelevant, do miss the target. ‘Clinicians[’] … decisions should be made by taking the vitamin D result within the context of the patient’s history of time outdoors, the location, skin type and any co-morbidities.’ All of these matters need consideration, but the critically operative item is ignored, and that in spite of the cited clues to it: location, skin type, ancestry. DBP genetics is not mentioned. Nonetheless, her focused assessment is ruthlessly accurate. ‘The clinical implication of using a method that is not certified to the RMP … is the misdiagnosis of vitamin D deficiency.’ 53
Outcomes: Whence and how?
The inescapable conclusion is that any attempt to create one universally applicable reference interval for calcifediol is impractical. Ancestry, DBP and latitude customized reference intervals, ‘harmonized’ across analytical platforms, must remain the ideal to be sought but will be difficult to achieve at least for the foreseeable future. Target values need not be latitude specific, since the minimum calcifediol concentration needed for health does not vary across Earth in the way that the intensity of sunlight does. Clinicians do prefer certainty but sometimes, as here, they might need to accept an element of uncertainty. 59
Clinicians, and patients, will continue to want to know their own specific ‘vitamin D’ concentrations, both accurately and precisely. Unlike the several brave investigators described just above, it seems unlikely that clinicians will refuse to assess calcifediol deficiency by rejecting results from methods that are not certified to an RMP. It is more likely that in both laboratory and clinic, in the immediate future, we will continue to make judgements using the calcifediol cut-off point concentrations that have been found, with spectrophotometers, to correlate with an acceptable total ‘vitamin D’-driven skeletal scenario even though the patients’ numbers on view have emerged from immunoassay platforms reporting their perceived estimate of total calcifediol. Similar comments would apply in the broader pituitary axis with PTH. One clinical consolation is that in most cases, the bias is to under-reporting by immunoassays and thus in favour of fortifying therapy being suggested, instituted, rather than the converse, which might have led clinicians to falsely reassure patients that their D picture is acceptable.
We will also probably continue to use as a sufficiency target not just for the UK but for a large part of Earth’s ‘almost … whole population’ that sacrosanct 50 nmol/L which was surely found first in Europids, with Europid DBP dynamics. 17 It is also far more likely, presently, that one’s PTH would be assayed, than one’s DBP genotyped. This need not necessarily be seen as a problem because in order to refine the understanding of his or her ‘vitamin D’ status where necessary we will measure precisely this hormone, the patient’s PTH. PTH paradoxically secure within its reference interval, especially if also with a healthy accompanying bone scan result, will trump an otherwise apparently low calcifediol. Such a set of data would constitute a clinical trial with an ‘n of one’. The data above suggest the need might arise in between one in five and one in two cases.
Thacher’s and Clarke’s pertinent remark resonates wondrously here. Definitions, reference intervals, such as these all represent but an average value at a population level and do not account for the wide variation in calcifediol that describes adequacy at an individual level. 1
Vitamin D remains a work in progress: caveat emptor!
Footnotes
Acknowledgments
I acknowledge the sources used and cited and thank the Journal’s Editors and the two Reviewers they selected, all of whom have been generous and very helpful; one reviewer is cited, anonymously.
Declaration of conflicting interests
The author(s) declared no potential conflicts of interest with respect to the research, authorship, and/or publication of this article.
Funding
The author(s) received no financial support for the research, authorship, and/or publication of this article.
Ethical approval
Not applicable.
Guarantor
RXD.
Contributorship
RXD is the sole author.
References
Supplementary Material
Please find the following supplemental material available below.
For Open Access articles published under a Creative Commons License, all supplemental material carries the same license as the article it is associated with.
For non-Open Access articles published, all supplemental material carries a non-exclusive license, and permission requests for re-use of supplemental material or any part of supplemental material shall be sent directly to the copyright owner as specified in the copyright notice associated with the article.