
Abstract
Background
The glycerol-3-phosphate (GPO)-peroxidase (POD) chromogenic method is one of the most widely used methods to assay triglycerides. However, it is well known that peroxidase is affected by reducing agents, and recently, it has been reported that some materials affect its activity. Moreover, there is a high possibility of non-specific reaction, as the method uses many enzymes. Against this background, we developed a simpler assay method for triglycerides without using peroxidase.
Methods
Triglycerides were hydrolysed to glycerol and fatty acids by lipoprotein lipase followed by the oxidation of glycerol to dihydroxyacetone with simultaneous production of NADH by glycerol dehydrogenase. To overcome incomplete conversion of glycerol to dihydroxyacetone by glycerol dehydrogenase at equilibrium, we added 2-(2-methoxy-4-nitrophenyl)-3–(4-nitrophenyl)-5–(2,4-disulfophenyl)-2H-tetrazolium monosodium salt (WST-8) to the reaction mixture to remove NADH, allowing the reaction to complete while showing stoichiometric production of reduced WST-8.
Results
The reaction was linear up to 6.4 mmol/L. The mean intra-assay (n = 20) and inter-assay (n = 20) imprecision, as determined by replicate analysis of three pooled human serum samples with different triglyceride concentrations, were 1.1–2.3% and 1.1–1.5% coefficient of variation (%CV), respectively. No interference by 2.5 g/L haemoglobin, 65 μmol/L free bilirubin and 359 μmol/L conjugated bilirubin was observed. The equation obtained in comparison with that by the GPO-POD method including endogenous glycerol-eliminating step was: y = 1.0002x + 0.0395 mmol/L; r = 0.999; Sy/x = 0.049 mmol/L; n = 97.
Conclusion
Our method is an accurate, yet simpler and more sensitive for the quantitative analysis of triglycerides.
Introduction
Assays to determine the concentration of triglycerides (TGs) in serum samples are important clinical diagnostic tools, particularly as TGs have been identified as an independent risk factor in coronary artery disease.1,2 To date, several TG assay methods have been reported. 3 Early methods for assaying TGs were called ‘chemical’ methods. TGs were extracted from samples using chemical agents and then assayed by titrimetric or colorimetric methods.4,5 Advancements in technology have led to the supply of good-quality enzymes, and thus many assay methods completely using enzymes in their processes have been reported. In these methods, TGs were hydrolysed by lipoprotein lipase (LPL, EC 3.1.3.34) to glycerol and fatty acids, and the substances subsequently derived from glycerol were modified by various dyes and assayed by colorimetric methods (enzymatic colorimetric method).6,7 Moreover, with the progression of scientific technologies, other assay methods have been reported, including those using chromatography, nuclear magnetic resonance, mass spectrometry and bio-sensors.8–11 All these methods have a high accuracy and sensitivity; however, because special instruments and trained personnel are required for their execution, the introduction of these methods into the clinical setting has not been smooth. As a result, enzymatic colorimetric methods are still the main assay methods for serum TGs.
Enzymatic colorimetric methods are divided into two groups: (1) hydrogen peroxide-POD chromogen method, which uses the following principles: first, TGs are hydrolysed by LPL to glycerol and fatty acids. Then, glycerol reacts with oxidase to produce hydrogen peroxide. Finally, hydrogen peroxide and hydrogen donor are converted to chromogen by peroxidase (POD). The concentration of TGs is then determined indirectly by measuring the absorbance of chromogen and (2) NADH (chromogen) method, which uses the following principles: the first step is the same as that in the previous method. Then, glycerol reacts with dehydrogenase in the presence of a co-factor, NAD+, to produce NADH. The concentration of TGs is then determined indirectly by measuring the absorbance of NADH or by reacting chromogen with NADH and then measuring the absorbance of chromogen. Generally, the hydrogen peroxide-POD chromogen method is affected by reducing agents in the samples since the substrate specificity of POD is low, whereas the NADH method has a high accuracy.
Glycerol dehydrogenase (GDH, EC 1.1.1.6) is used in the NADH method. As mentioned above, the method using this enzyme has a higher accuracy than the hydrogen-peroxide-POD method; however, since this enzyme has a high Michaelis constant (Km) value for glycerol and an unfavourable reaction equilibrium for the conversion of glycerol to dihydroxyacetone, it is difficult to assay samples with high concentrations of TGs with the NADH method. 12 To solve this problem, various chromogens (formazan dyes and fluorescent dyes) have been used;13,14 however, contamination of the cells and the tubes resulting from the use of these agents (formazan dyes) and the need of special instruments (fluorescent dyes) have hindered the spread of these methods. Currently, the hydrogen peroxide-POD method is the most widely used.
Among the hydrogen peroxide-POD chromogen methods, the glycerol-3-phosphate (GPO)-POD chromogen method is one of the most widely used methods. It involves a series of coupled enzymatic reactions catalysed by LPL, glycerol kinase (GK, EC 2.7.1.30), GPO (GPO, EC 1.1.3.21) and POD (EC 1.11.1.7). With this method, we can assay high concentration of TGs; however, as described above, the susceptibility of the hydrogen peroxide-POD reaction to reducing agents is a significant drawback. Recently, owing to the availability of new information on lipid metabolism, various studies on TGs have been conducted, both in vivo and in vitro. These studies have provided new information on the GPO-POD assay method. Hoek-van den Hil et al. reported that some flavonoids affect the activity of POD, 15 and Guo et al. reported that dobesilate, an adrenergic drug, affects the Trinder’s reagent. 16 Currently, remnant-like lipoprotein particle-triglyceride (RLP-TG) and very low-density lipoprotein triglyceride (VLDL TG) are often measured. However, the measured values of these are generally lower than those of serum TGs; their most frequent values are lower than 0.1 mmol/L, and it has been reported that their concentrations are not detectable when using the conventional GPO-POD method. 17 Moreover, in addition to the reported effects of flavonoids and dobesilate, susceptibility to other non-specific reactions are high, as these methods use many enzymes.
In this report, we describe a new TG-measuring method using GDH, which requires only three enzymes, including a glycerol elimination step. The principle of this reaction is based on the fact that the amount of formazan dye is proportional to NADH produced by the degradation of TGs. As mentioned above, GDH has some disadvantages in measuring TGs. 12 To overcome these disadvantages, we used a water-soluble formazan dye, WST-8. 18 Using WST-8 and its electron-carrier, 1-methoxy-5-methylphenazinium methylsulphate (1-methoxy PMS), NADH produced by the degradation of glycerol was removed from the reaction mixture as an indicator of formazan dye, making the reaction equilibrium favourable for the conversion of glycerol to dihydroxyacetone. Since WST-8 has a high molar extinction coefficient, we were able to improve the reaction precision to achieve a high sensitivity. Further, since WST-8 is a water-soluble dye, the reaction cells and tubes of the automated laboratory instrument are free of contamination. We therefore further investigated this assay’s characteristics and suitability for use in routine laboratory tests.
Methods
Reaction principle
The reaction (illustrated in Figure 1) consisted of removing endogenous glycerol in the first step and measuring TGs in the second. First, endogenous glycerol was deleted by GK in the presence of ATP and Mg2+. Next, GK activity was stopped by EDTA-2K with Mg2+ as the chelating agent. TGs were hydrolysed by LPL to produce glycerol and fatty acids, followed by degradation of glycerol to dihydroxyacetone and NADH by the use of GDH. A two-electron reduction of WST-8 with NADH was mediated by 1-methoxy PMS, an electron-carrier. TG assay with WST-8 was based on the principle that the amount of formazan (WST-8 formazan dye) produced is proportional to NADH produced by the degradation of TGs. The reduced yellow-coloured WST-8 formazan dye showed peak absorbance at 460 nm.
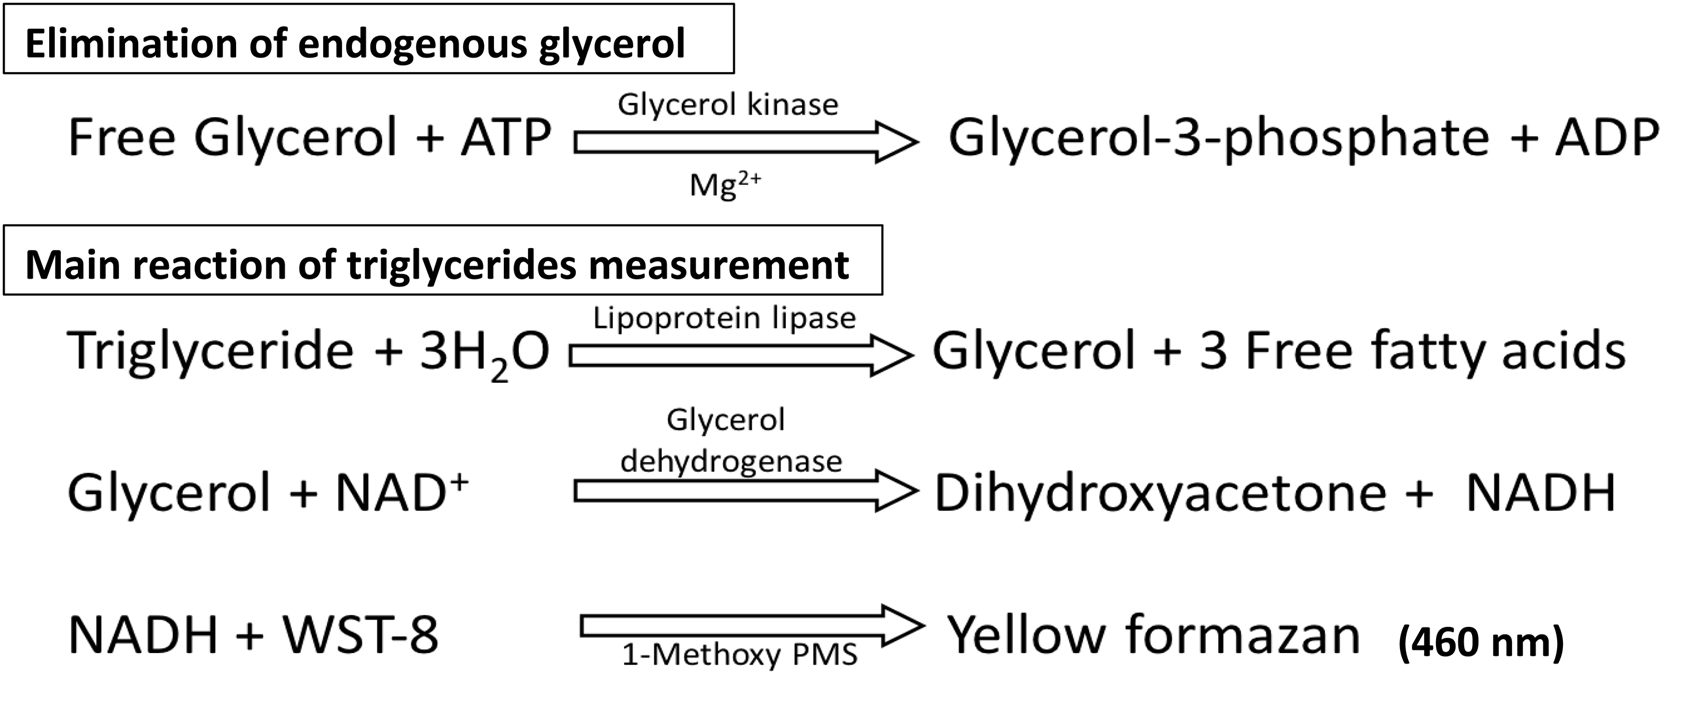
Schematic representation of the reaction sequence.
Instrument and reagents
All assays were performed using a Hitachi 7180 automated analyser (Hitachi High-Technologies Co., Tokyo, Japan). N-cyclohexyl-2-animoethanesulphonic acid (CHES); 2-morpholinoethanesulphonic acid, monohydrate (MES); WST-8; 1-methoxy PMS, and EDTA-2K were from Dojindo Labs., Kumamoto, Japan. GK (EC 2.7.1.30; Cellulomonas sp.), GDH (EC 1.1.1.6; Cellulomonas sp.) and LPL (EC 3.1.1.34; Pseudomonas sp.) were from TOYOBO, Osaka, Japan. Ascorbate oxidase (ASOM; EC 1.10.3.3, Acremonium sp.) was obtained from Asahi Kasei Pharma Co., Tokyo, Japan. ATP and β-NAD+ were from Oriental Yeast, Tokyo, Japan. Magnesium chloride, potassium chloride, ammonium chloride and glycerol were obtained from FUJIFILM Wako Pure Chemical Corporation, Osaka, Japan. Polyoxyethylene (40) isooctylphenyl ether (Triton™ X-405) was obtained from MP Biomedicals, Santa Ana, United States of America. Bovine serum albumin (BSA) was obtained from Sigma Aldrich Japan, Tokyo, Japan. The lyophilized serum ‘High Level Check’ used for linearity and limit of quantitation tests and ‘Interference Check A Plus’ were obtained from Sysmex, Kobe, Japan. Primary standard controls for LDL-cholesterol, HDL-cholesterol and TG (JCCRM 224–11) were obtained from ReCCS, Kanagawa, Japan. Reagent kit ‘Quick auto neo TG II’ used for comparative studies was obtained from Shino-test Co., Tokyo, Japan.
Samples
Blood samples were collected without anticoagulant from hospitalized patients. This study was approved by the committee for ethical standards of both Kumamoto University (no. 1188) and Kyushu University (no. 28–113).
Procedure
Reagent composition
Conditions favouring zero-order reaction kinetics, broad linearity, the greatest sensitivity, least drift in the reagent blank value and stable working solutions were considered optimal. In the assay, we used a two-reagent system: reagent 1 consisted of 150 mmol/L CHES (pH 9.0), 0.2 kU/L GK, 30 kU/L GDH, 5.0 kU/L ascorbate oxidase, 0.2 mmol/L ATP, 2.0 mmol/L magnesium chloride, 5.0 mmol/L potassium chloride and 2.0 mmol/L ammonium chloride; reagent 2 consisted of 20 mmol/L MES (pH 5.5), 10 kU/L LPL, 2.0 mmol/L β-NAD+, 0.2 mmol/L WST-8, 20 µmol/L 1-methoxy PMS, 3.0 mmol/L EDTA-2K, 0.07% (w/v) Triton™ X-405 and 0.03% (w/v) BSA.
Analytical conditions
In the automated assay for TGs, 1.5 μL of serum sample was incubated with reagent 1 (188 μL) for 5 min at 37°C, and the absorbance was measured at 600 nm/480 nm (secondary/primary). The reaction was started immediately by the addition of reagent 2 (94 μL). After 5 min, the absorbance at 600/480 nm was measured again. The TG concentration of samples was determined from a calibration curve of the pooled human serum samples. We adjusted the concentration to approximately 2.0 mmol/L and determined the value based on a primary standard (JCCRM 224–11).
Statistical analysis
The upper limit of linearity was evaluated by ANOVA with P < 0.001 considered to indicate statistically significant differences. The limit of quantitation (LoQ) was evaluated by %CV. Sample concentrations were measured 10 times, independently (set at %CV = 20). Regression curves were generated from mean values of samples and %CV. Both linearity and LoQ were validated using Validation-Support/Excel V3.5 guaranteed by the Japan Society of Clinical Chemistry. The correlation between GPO-POD and our method was calculated using Microsoft Excel®. The regression equation was calculated from the Passing-Bablok regression. The 95% confidence interval (CI) of the regression coefficients and Sy/x were calculated by bootstrap method (number of replications was 2000).
Results
Linearity
The linearity of the assay was evaluated by preparing sequential dilutions of High Level Check Lipid (25.6 mmol/L TG) in saline buffer to produce two different ranges of TG concentrations (normal and high). Both normal and high TG concentration yielded linear responses. Linearity of normal and high level was up to 2.6 and 6.4 mmol/L of TG, respectively (Figure 2), as confirmed by ANOVA.
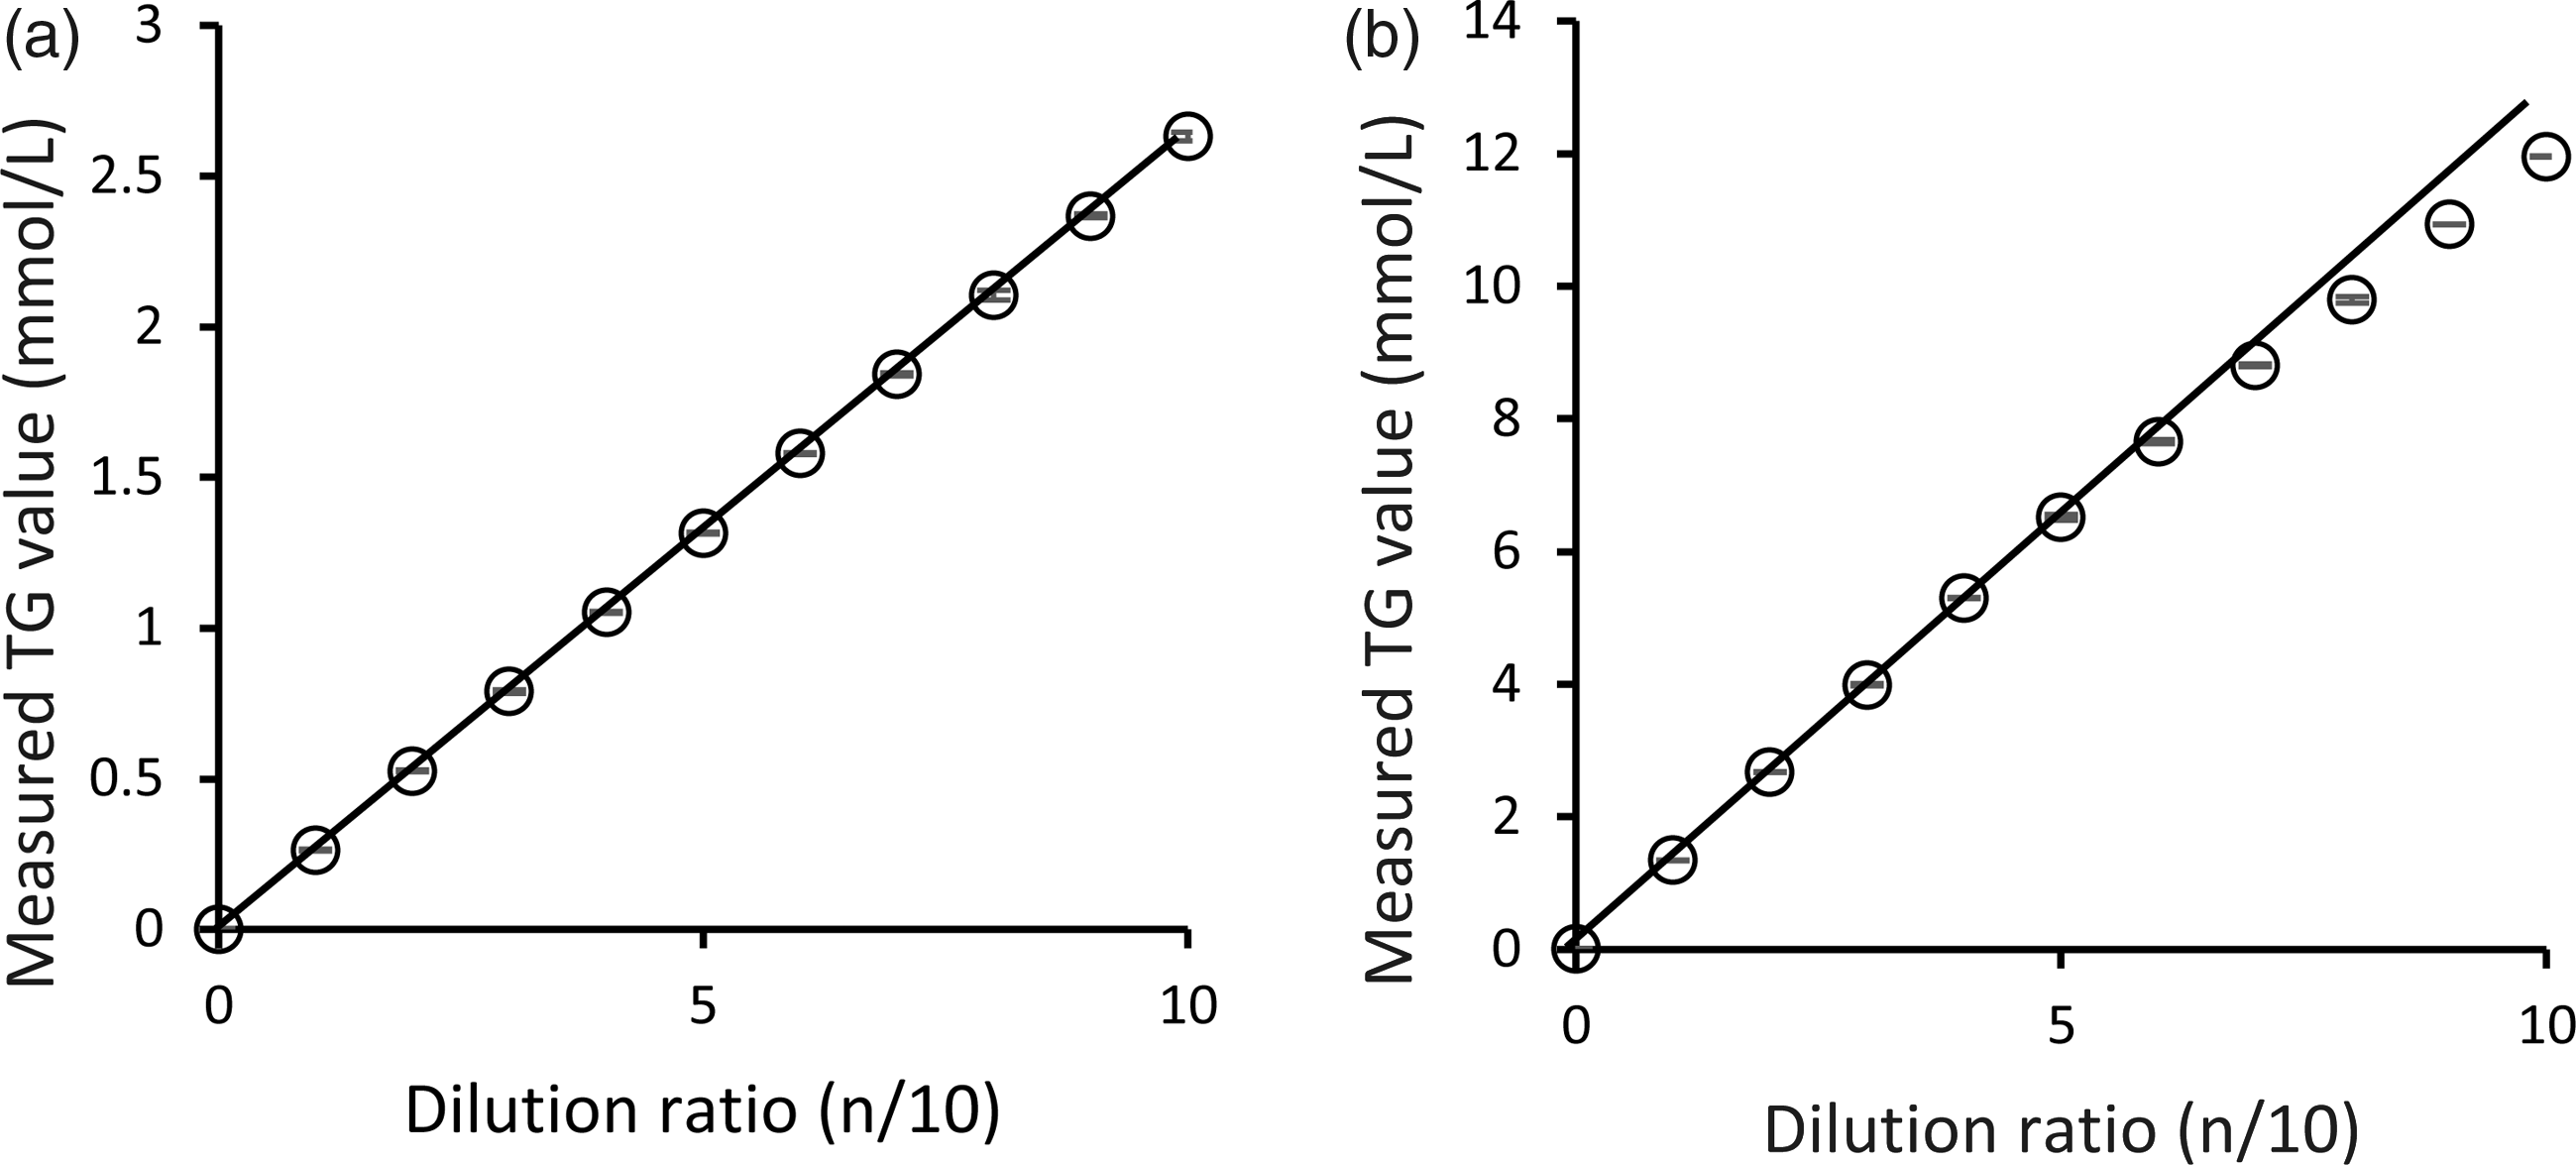
Linearity curve of our TG assay method.
Interfering substances
We evaluated the effect of several potential interfering substances in this method. The interference by haemoglobin and bilirubin was evaluated with the samples, using ‘Interference Check A Plus’ (Sysmex) according to the manufacturer’s instructions. We assumed the reaction rates to be ‘negatively affected’ in case of less than 95% and ‘positively affected’ in case of more than 105%. Using the above criteria, we confirmed that our reaction components were not affected, as confirmed by the concentrations of 2.5 g/L of haemoglobin, 65 μmol/L of free bilirubin and 359 μmol/L of conjugated bilirubin (Figure 3).
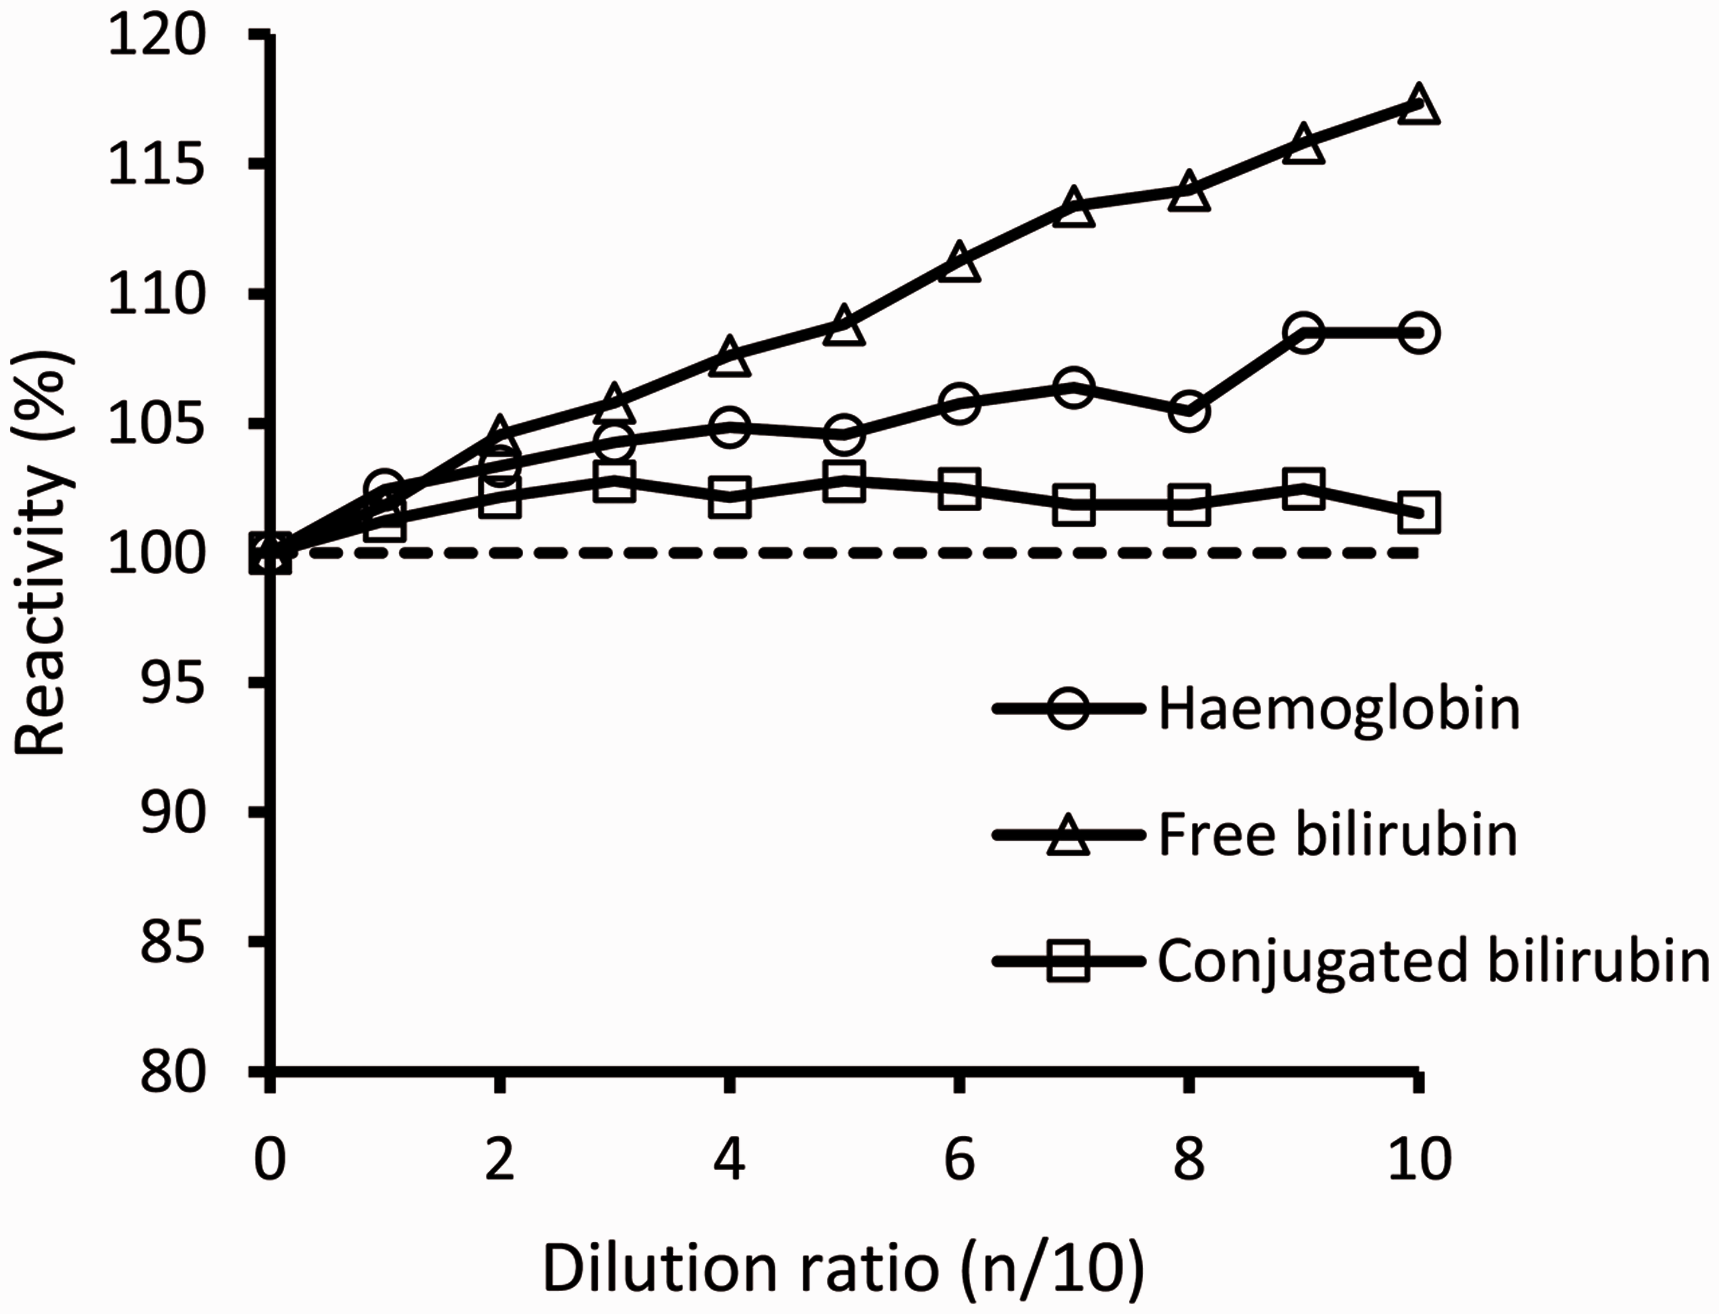
Interferences of haemoglobin, free bilirubin and conjugated bilirubin.
Elimination of endogenous glycerol
Glycerol was added to the pooled serum samples (1:9, by volume) and the mixture used as sample for experiments evaluating its elimination from the reaction system. Our method could eliminate glycerol up to 10 mmol/L (data not shown).
Imprecision
Intra- and inter-assay imprecision were determined by performing measurements on three pooled serum samples. The inter-assay testing was carried out for 20 days over a three-week period. Calibration was performed on each test day. The intra- and inter-assay imprecision, as determined by replicate analyses of the three pooled serum samples (n = 20) with different TG concentrations, were 1.1–2.3%CV and 1.1–1.5%CV, respectively (Table 1).
Imprecision.
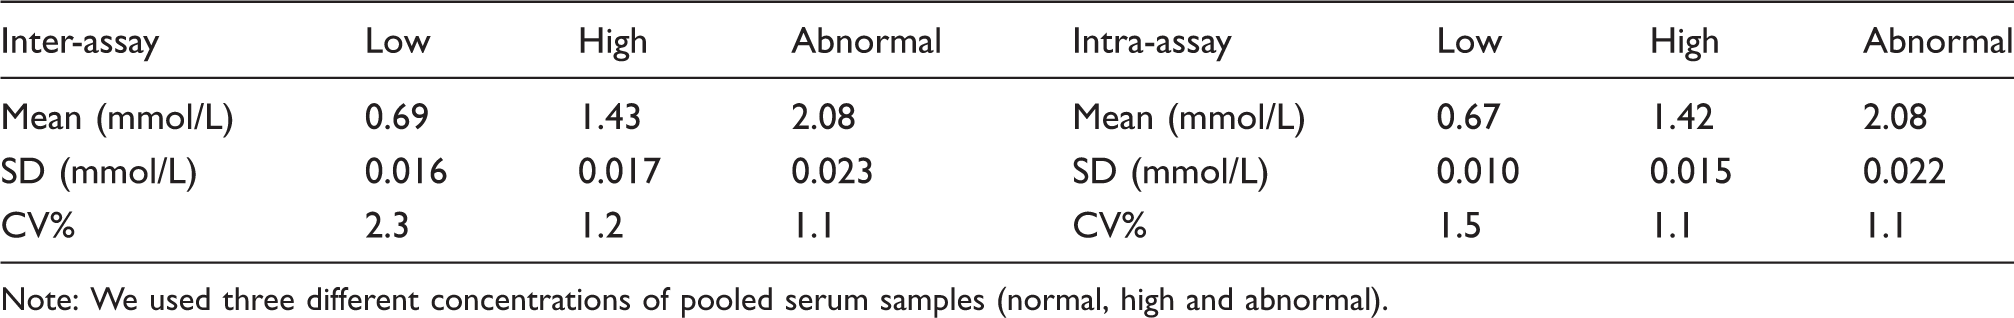
Note: We used three different concentrations of pooled serum samples (normal, high and abnormal).
Correlation between GPO-POD method and our method
Ninety-seven samples were assayed by either method (Figure 4(a)). The equation for our method compared with that for the GPO-POD method by Passing-Bablok method was y = 1.0002x + 0.0395, where mean (±SD) of X-axis (GPO-POD method) was 2.10 (1.24) mmol/L; r = 0.999; Sy/x = 0.0491 mmol/L; slope = 1.0002 (95% CI, 0.9919–1.0100); intercept = 0.0395 (95% CI, 0.0236–0.0550). In this comparison, mean (±SD) of Y-axis (present method) was 2.14 (1.24) mmol/L. There was a good agreement between the results from the GPO-POD method and those from our method. To further analyse the agreement between the two assays, we used a Bland-Altman (difference) plot (Figure 4(b)). It showed that almost all plots spread equally around the broken line (y = −0.0395 mmol/L) in the concentration range of 0–3 mmol/L. Very few plots scattered wider in the concentration range above 3 mmol/L.
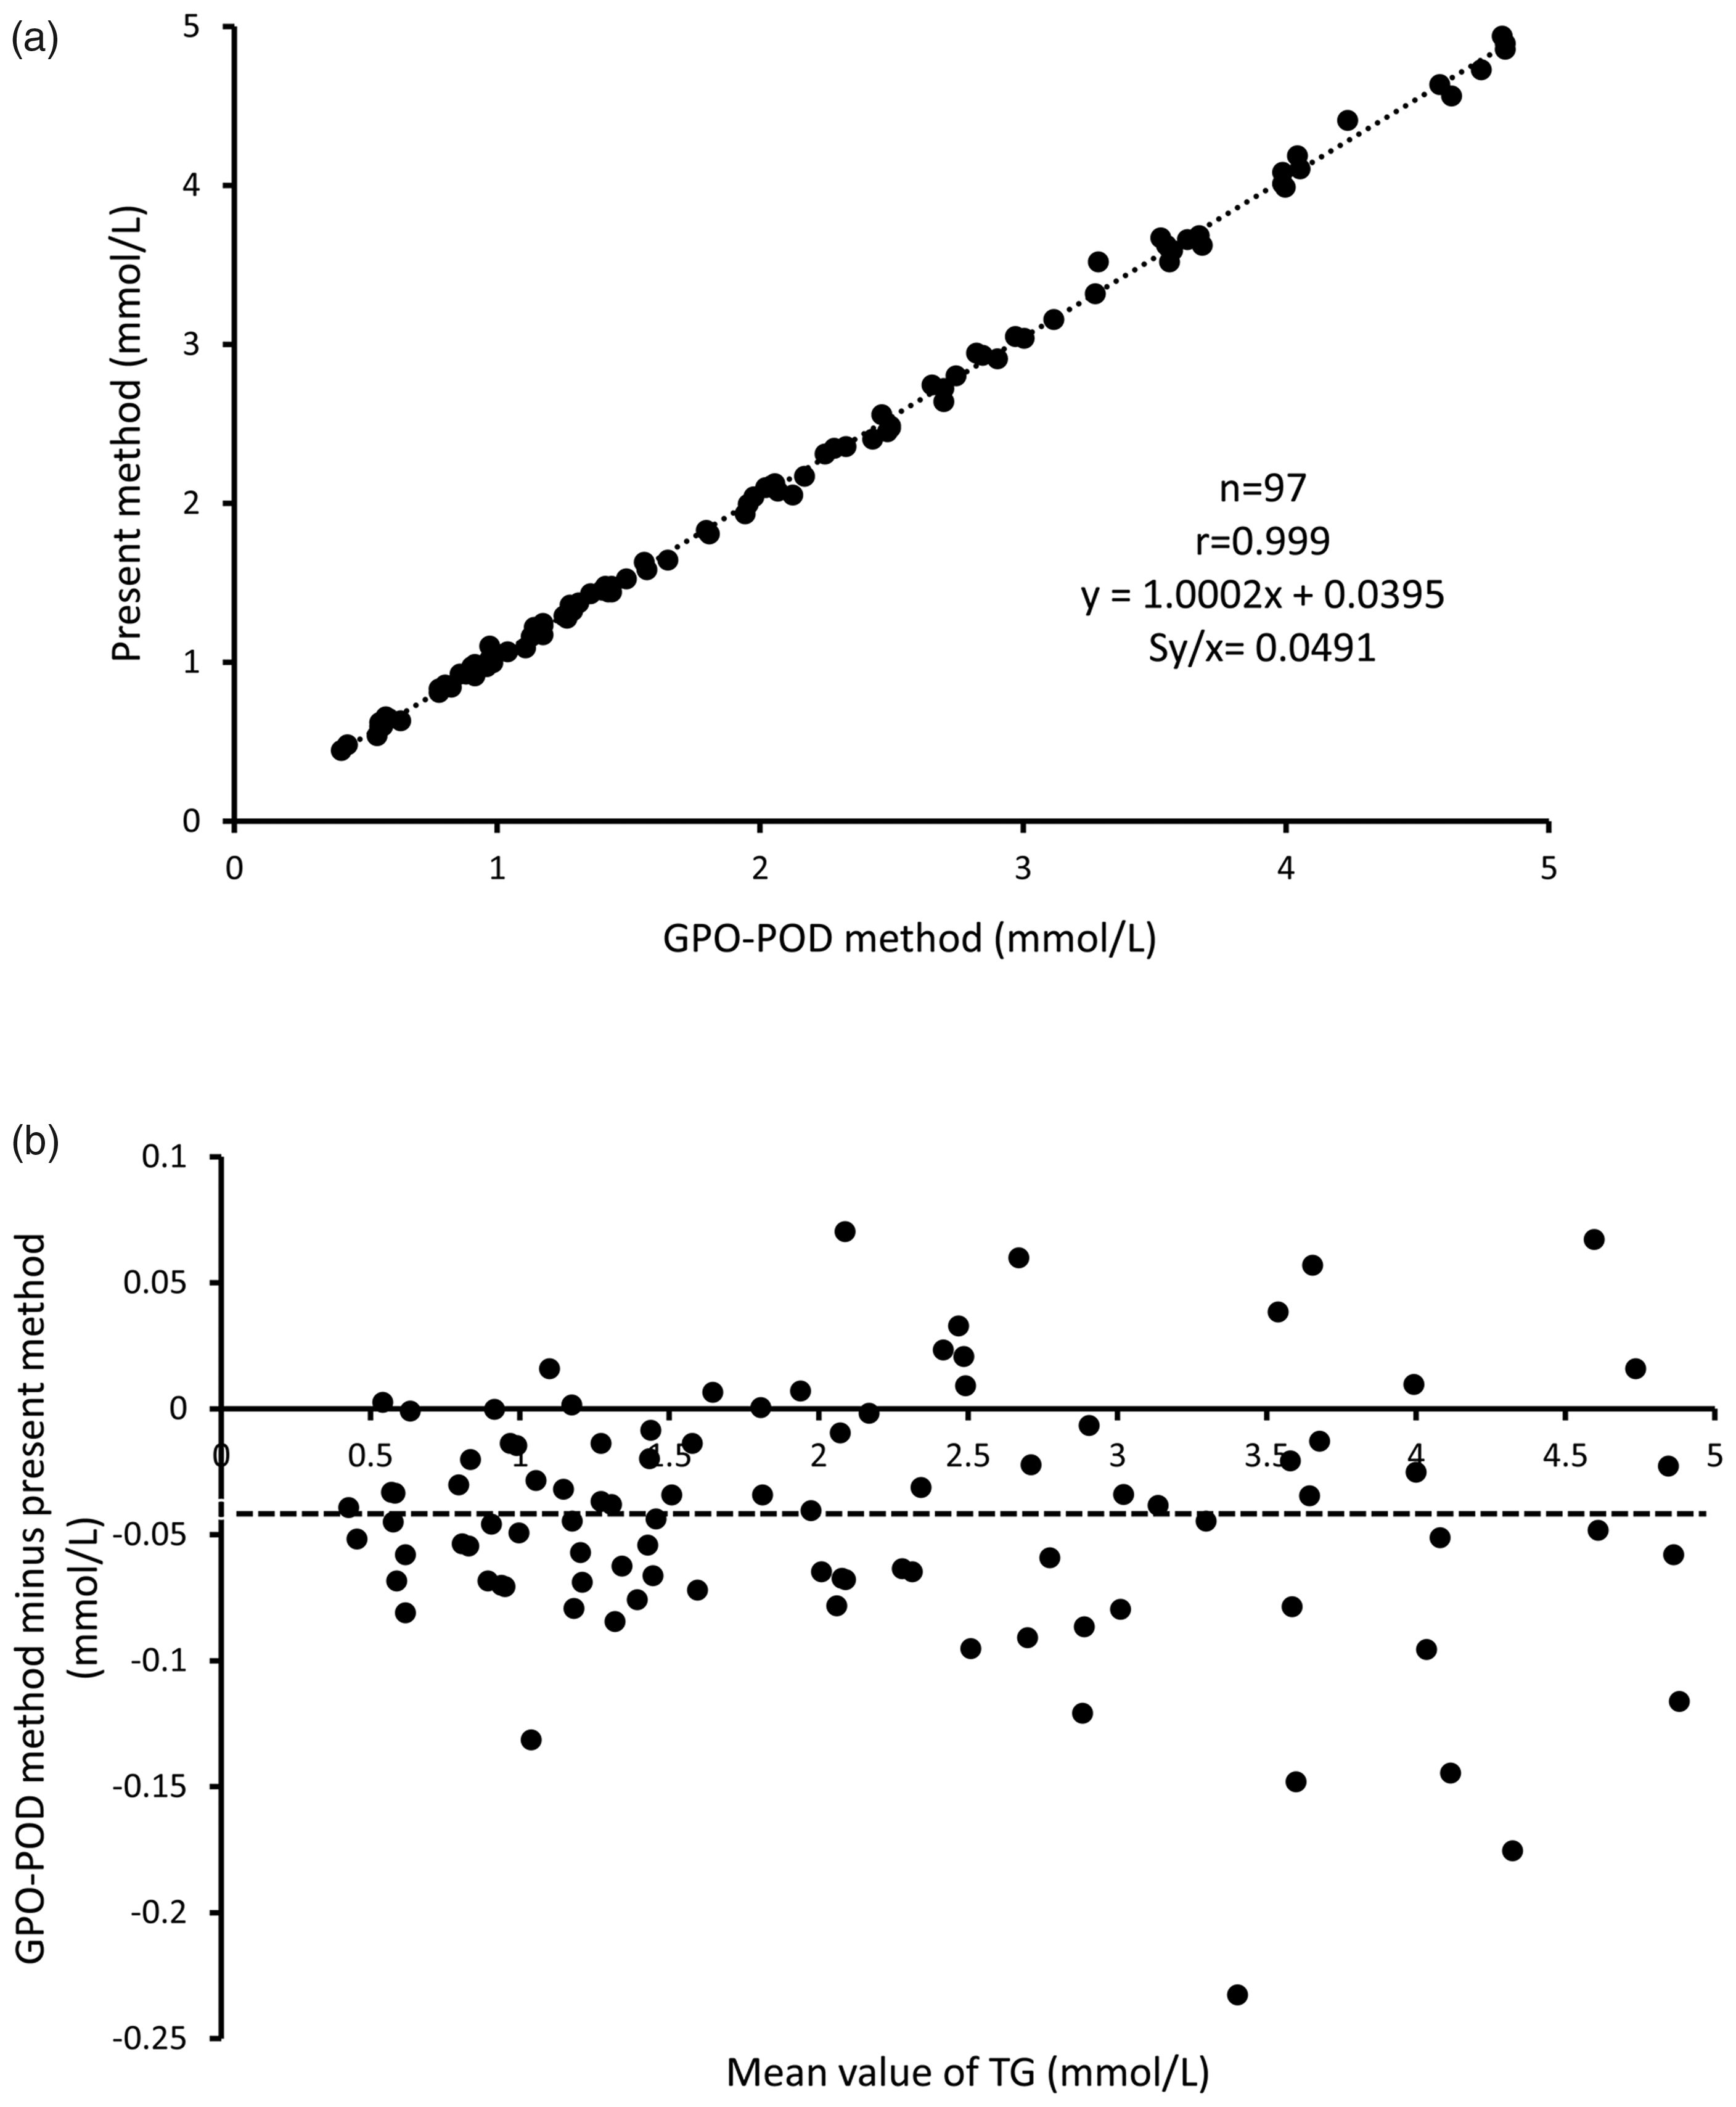
(a) Passing-Bablok method comparison between the GPO-POD method and our TG assay method.
Discussion
We report here a novel method for TG determination coupled with water-soluble formazan dye, using GDH from Cellulomonas sp. The characteristics of the enzyme used have been reported previously. 4 The optimal pH for GDH is 10.0, while the Km values for glycerol and NAD+ are 1.10 and 0.089 mmol/L, respectively, and the reaction is reversible. 6 For this reason, a simple endpoint assay for TGs using GDH is not a practical strategy. Many research groups have reported assaying TGs using GDH until now.13,14,19 The final step in these methods leads to the formation of either a water-insoluble formazan dye, fluorescent dye or an ultraviolet light-absorbing chemical whose concentration could be measured spectrophotometrically to measure NADH production in the reaction system, thereby relating it to the concentration of TGs in the specimen. However, these methods have several drawbacks. In the method using dyes, the residual water-insoluble formazan dye leads to contamination of the reaction cell (water-insoluble formazan dye); moreover, a special instrument is needed (fluorescent dye). In the ultraviolet light-absorption method, the equilibrium of the GDH reaction favoured the reverse reaction and hydrazine could not efficiently trap dihydroxyacetone to change the equilibrium of the reaction. 3 The linearity of high concentration range was also not satisfactory. To overcome these issues, we used a water-soluble formazan dye, WST-8, 18 which produces a yellow formazan dye when reduced by NADH in the presence of the electron-carrier, 1-methoxy PMS. 18 We attempted to remove NADH from the reaction, using WST-8 and pushed the equilibrium of the reaction to favour the conversion of glycerol to dihydroxyacetone, resulting in a quantifiable progression of the reaction in the desired direction. The linearity and sensitivity of the reaction for assaying serum TGs improved vastly as a result of the above strategy.
The TG assay method described in this paper displayed good linearity of up to 6.4 mmol/L, although the GPO-POD method has a higher linearity (around 11.3 mmol/L). Recommendations by the National Cholesterol Education Program and Treatment of High Cholesterol in Adults 20 indicate fasting serum TG concentrations below 200 mg/dL (2.3 mmol/L) to be desirable; concentration between 200 and 400 mg/dL (2.3 and 4.6 mmol/L) to be borderline high and fasting concentrations above 400 mg/dL (4.6 mmo/L) to be elevated. Although we can achieve a higher linearity to increase WST-8 concentration in the reagent, based on the recommendations, we believe that our method has sufficient linearity to detect serum TGs values that indicate the risk of the coronary disease. Generally, TGs have clinical significance when the concentrations are high. Therefore, only few studies have reported its LoQ. One study reported that the LoQ of the reagent was 0.1 mmol/L, which is higher than that of our reagent (0.027 mmol/L). This means that our method has sufficient ability to measure low concentrations of TGs, including RLP-TG and VLDL TG.
Our interference results of haemoglobin and bilirubin showed that our TG assay method was positively affected by haemoglobin (≥2.5 g/L) and free bilirubin (≥65 μmol/L). It has been reported that 1-methoxy PMS and WST-1 react with haemoglobin to produce methaemoglobin. 21 Since the structure of WST-8 is similar to that of WST-1, we presumed that a similar reaction occurred in the present method. We incubated haemoglobin with 1-methoxy PMS and WST-8, respectively, and observed the temporal spectrum to be similar to that in the reaction with WST-1 at 480 nm (all data not shown). These results showed that the non-specific reaction with WST-8 was due to interference by haemoglobin. Although this interference was not negligible, haemoglobin rarely occurs at over 2.5 g/L concentrations in physiological samples.
There are two possible causes of the bilirubin interference: spectral and reduction interferences. For spectral interference, we thought that the possibility was low because of the following reasons. Since our method is a two-point end method, the spectral change caused by the sample is initially cancelled. Furthermore, if the spectral change was the cause of the interference, both conjugated and free bilirubin would have caused interference as both of them had their peak wavelength around 450 nm. For reduction interference, we thought that the possibility was higher. The structure of bilirubin is composed of four pyrroles that are lined by a methylene group. We thought that this methylene group had reducing power, and thus reduced WST-8 non-specifically. Both conjugated bilirubin and free bilirubin have this methylene group; however, our method was only affected by free bilirubin, possibly due to the differences in the side chains of conjugated bilirubin and free bilirubin. Since conjugated bilirubin has glucuronic acids in its structure, we presumed that the reducing power of the methylene group is weak. We tried to incubate free bilirubin with 1-methoxy PMS and WST-8, but observed no spectrum change. This result seemed inconsistent with our supposition and indicated that other factors in the reagent might be associated with the spectral change observed in our method; however, we do not know the detailed mechanisms. Further investigation is required to elucidate this phenomenon.
Although CDC has declared that the assay of total glycerides (TGs, diglycerides, monoglycerides and endogenous glycerol) using isotope dilution gas chromatography mass spectrometry (ID/GC/MS method) is the standard assay method for serum TGs, the necessity to use the glycerol blank in TG assays is controversial.22,23 We believe that assaying TGs, diglycerides, as well as monoglycerides would be more appropriate. We incorporated a glycerol elimination step in our assay method, since we believe additional investigations are necessary to completely rule out the use of glycerol control. Actually, Maruyama et al. reported that alcoholic groups show higher serum glycerol concentrations than controls. 24 Therefore, we think that the clinical relevance of glycerol remains to be fully revealed. Our method could eliminate endogenous glycerol up to 10 mmol/L from the reaction system, much greater than concentrations encountered in practical examinations (<0.28 mmol/L). 22
Our TG assay method also revealed good reproducibility in both intra- and inter-assays.
It had good correlation with the GPO-POD method, although it showed a slightly higher value (0.0395 mmol/L). The POD, used in the GPO-POD method, has low substrate specificity. Therefore, it might react with reducing agents in serum to show a value lower than its intrinsic value. According to a previous study, the GPO-POD method showed a lower TGs value than the NADH method. 25 In that previous study, the authors suggested that the turbidity of the samples increased the absorbance of the NADH method. However, this suggestion is suspicious since the values obtained with the NADH method were also higher in samples with lower TGs concentrations (the possibility that the samples were turbid is very low). From the above, we thought that our method showed a higher TGs value than the GPO-POD method. This difference will not be a problem when comparing the assay values obtained with the two methods to assess the risk of artery disease; however, in terms of assessing TGs such as RLP-TG or VLDL TG, the values obtained with the two assays are not comparable, as the difference was quite high (approximately 40%). We did not measure samples with high turbidity; however, when we measured the sample with low turbidity, the measured values showed a similar scatter deviation to samples with no turbidity. In the residue plot, the scatter plots seemed to be broad in the high concentration samples; however, practically, the rate of the difference between the two methods in terms of the measured values was not different in all concentration regions. From the above, we presumed that our method was not affected by lipid turbidity.
In conclusion, we believe that our TG assay method is a simpler technique that has excellent sensitivity and consistency while eliminating glycerol and may be considered a novel alternative assay to measure serum TGs. With this method, we can estimate not only the risk of coronary artery disease but also the concentrations of TGs with lower concentration such as RLP-TG or VLDL TG. Furthermore, since this method involves simple reactions in assaying ‘new’ samples, the possibility of non-specific reactions is low. For these reasons, we thought that this method can be reliably used to assay TGs.
Footnotes
Acknowledgements
The authors are grateful to TOYOBO and Asahi Kasei Pharma, Co., for offering the enzymes used in this project.
Declaration of conflicting interests
The author(s) declared no potential conflicts of interest with respect to the research, authorship, and/or publication of this article.
Funding
The author(s) received no financial support for the research, authorship, and/or publication of this article.
Ethical approval
The ethics committee at Kumamoto University (no. 1188) and Kyushu University (no. 28–113) approved this study.
Guarantor
YK.
Contributorship
MK wrote the manuscript, and acquired and analysed the data; TT and SO contributed to the design of this study; SS contributed to the statistical analysis; MM and HM contributed to serum sample collection; EH and YK supervised the study process.