
Abstract
Background
Prostate-specific antigen is the biochemical gold standard for the (early) detection and monitoring of prostate cancer. Interpretation of prostate-specific antigen is both dependent on the method and cut-off. The aim of this study was to examine the effect of method-specific differences and cut-off values in a national external quality assessment scheme (EQAS).
Methods
The Dutch EQAS for prostate-specific antigen comprised an annual distribution of 12 control materials. The results of two distributions were combined with the corresponding cut-off value. Differences between methods were quantified by simple linear regression based on the all laboratory trimmed mean. To assess the clinical consequence of method-specific differences and cut-off values, a clinical data-set of 1040 patients with an initial prostate-specific antigen measurement and concomitant conclusive prostate biopsy was retrospectively collected. Sensitivity and specificity for prostate cancer were calculated for all EQAS participants individually.
Results
In the Netherlands, seven different prostate-specific antigen methods are used. Interestingly, 67% of these laboratories apply age-specific cut-off values. Methods showed a maximal relative difference of 26%, which were not reflected in the cut-off values. The largest differences were caused by the type of cut-off, for example in the Roche group the cut-off value differed maximal 217%. Clinically, a fixed prostate-specific antigen cut-off has a higher sensitivity than an age-specific cut-off (mean 89% range 86–93% versus 79% range 63–95%, respectively).
Conclusions
This study shows that the differences in cut-off values exceed the method-specific differences. These results emphasize the need for (inter)national harmonization/standardization programmes including cut-off values to allow for laboratory-independent clinical decision-making.
Introduction
Serum prostate-specific antigen (PSA) is the biochemical gold standard for the (early) detection and monitoring of prostate cancer (PCa). 1 Although increased PSA values are directly associated with a higher probability of having PCa, 2 PSA elevations are also observed with benign prostate hyperplasia and prostatitis. 3 Due to a lack of sensitivity and specificity, the use of PSA alone as a screening tool for PCa remains an active topic of discussion.4,5 Recent evidence from a large primary care-based cluster randomized clinical trial indicates that screening results in an increased detection of PCa, but no difference in PCa mortality after a median follow-up of 10 years. 6 Furthermore, a PSA value larger than 3 μg/L in men aged 50 years and older is considered indicative for a prostate biopsy, based on the European Randomized Study of Screening for Prostate Cancer. 7
To date, PSA assays from various manufacturers are available. It has been clear that this wide variety of assays results in differences in PSA values. 8 Although a WHO 96/670 reference standard for assay calibration has been developed, 9 still major differences between methods exist. Unfortunately, this reference material is not fully commutable and applying it might even increase the method differences up to 20%.8,10–12 Therefore, interchangeability of assays has not been achieved.
When method differences are that large, method-specific reference values or cut-off values should be used to avoid discrepancies in clinical decision-making. Since the introduction of PSA, a fixed threshold value (e.g. 3 or 4 μg/L) has been recommended as threshold for a prostate biopsy.2,7 However, several publications have reported significant associations between age and PSA value, suggesting the use of age-specific cut-off values.13–16 Therefore, multiple types and sets of cut-off values are available, but the consequences on clinical decision-making has not been examined in a national external quality assessment scheme (EQAS).
This study has addressed these issues and gives a detailed overview of PSA methods and applied cut-off values in the Netherlands. In addition, the clinical implications of these differences were investigated in a clinical data-set of males with a conclusive prostate biopsy.
Material and methods
PSA data from Dutch national EQAS
For this study, data from a regular PSA proficiency-testing programme (2015–2016) were used, which comprise an annual laboratory comparison based on six sets of two quality controls each. Generally, the EQAS samples are human-based serum samples, spiked with PSA from patients with excessive high PSA concentrations. Two samples out of these 24 samples consisted of human-based pooled (male and female) serum samples. All EQAS samples were stored at –80°C and transported frozen to the participants. Furthermore, in November 2016, participants were kindly asked to voluntary report their actual PSA cut-off values for males of 35, 45, 55, 65 and 75 years. The results of both data-sets were used anonymously and linked based on the participant number and the method used during the last survey of 2016. After removal of outliers (more than four standard deviations from the mean), mean PSA concentrations were calculated for all methods. Furthermore, an all laboratory trimmed mean (ALTM) was defined as the average of these method means. Differences between methods/platforms were analysed according to simple linear regression analysis based on the ALTM (Figure 1). The formulas of these regression curves were used to correct PSA cut-off values for method-specific differences.
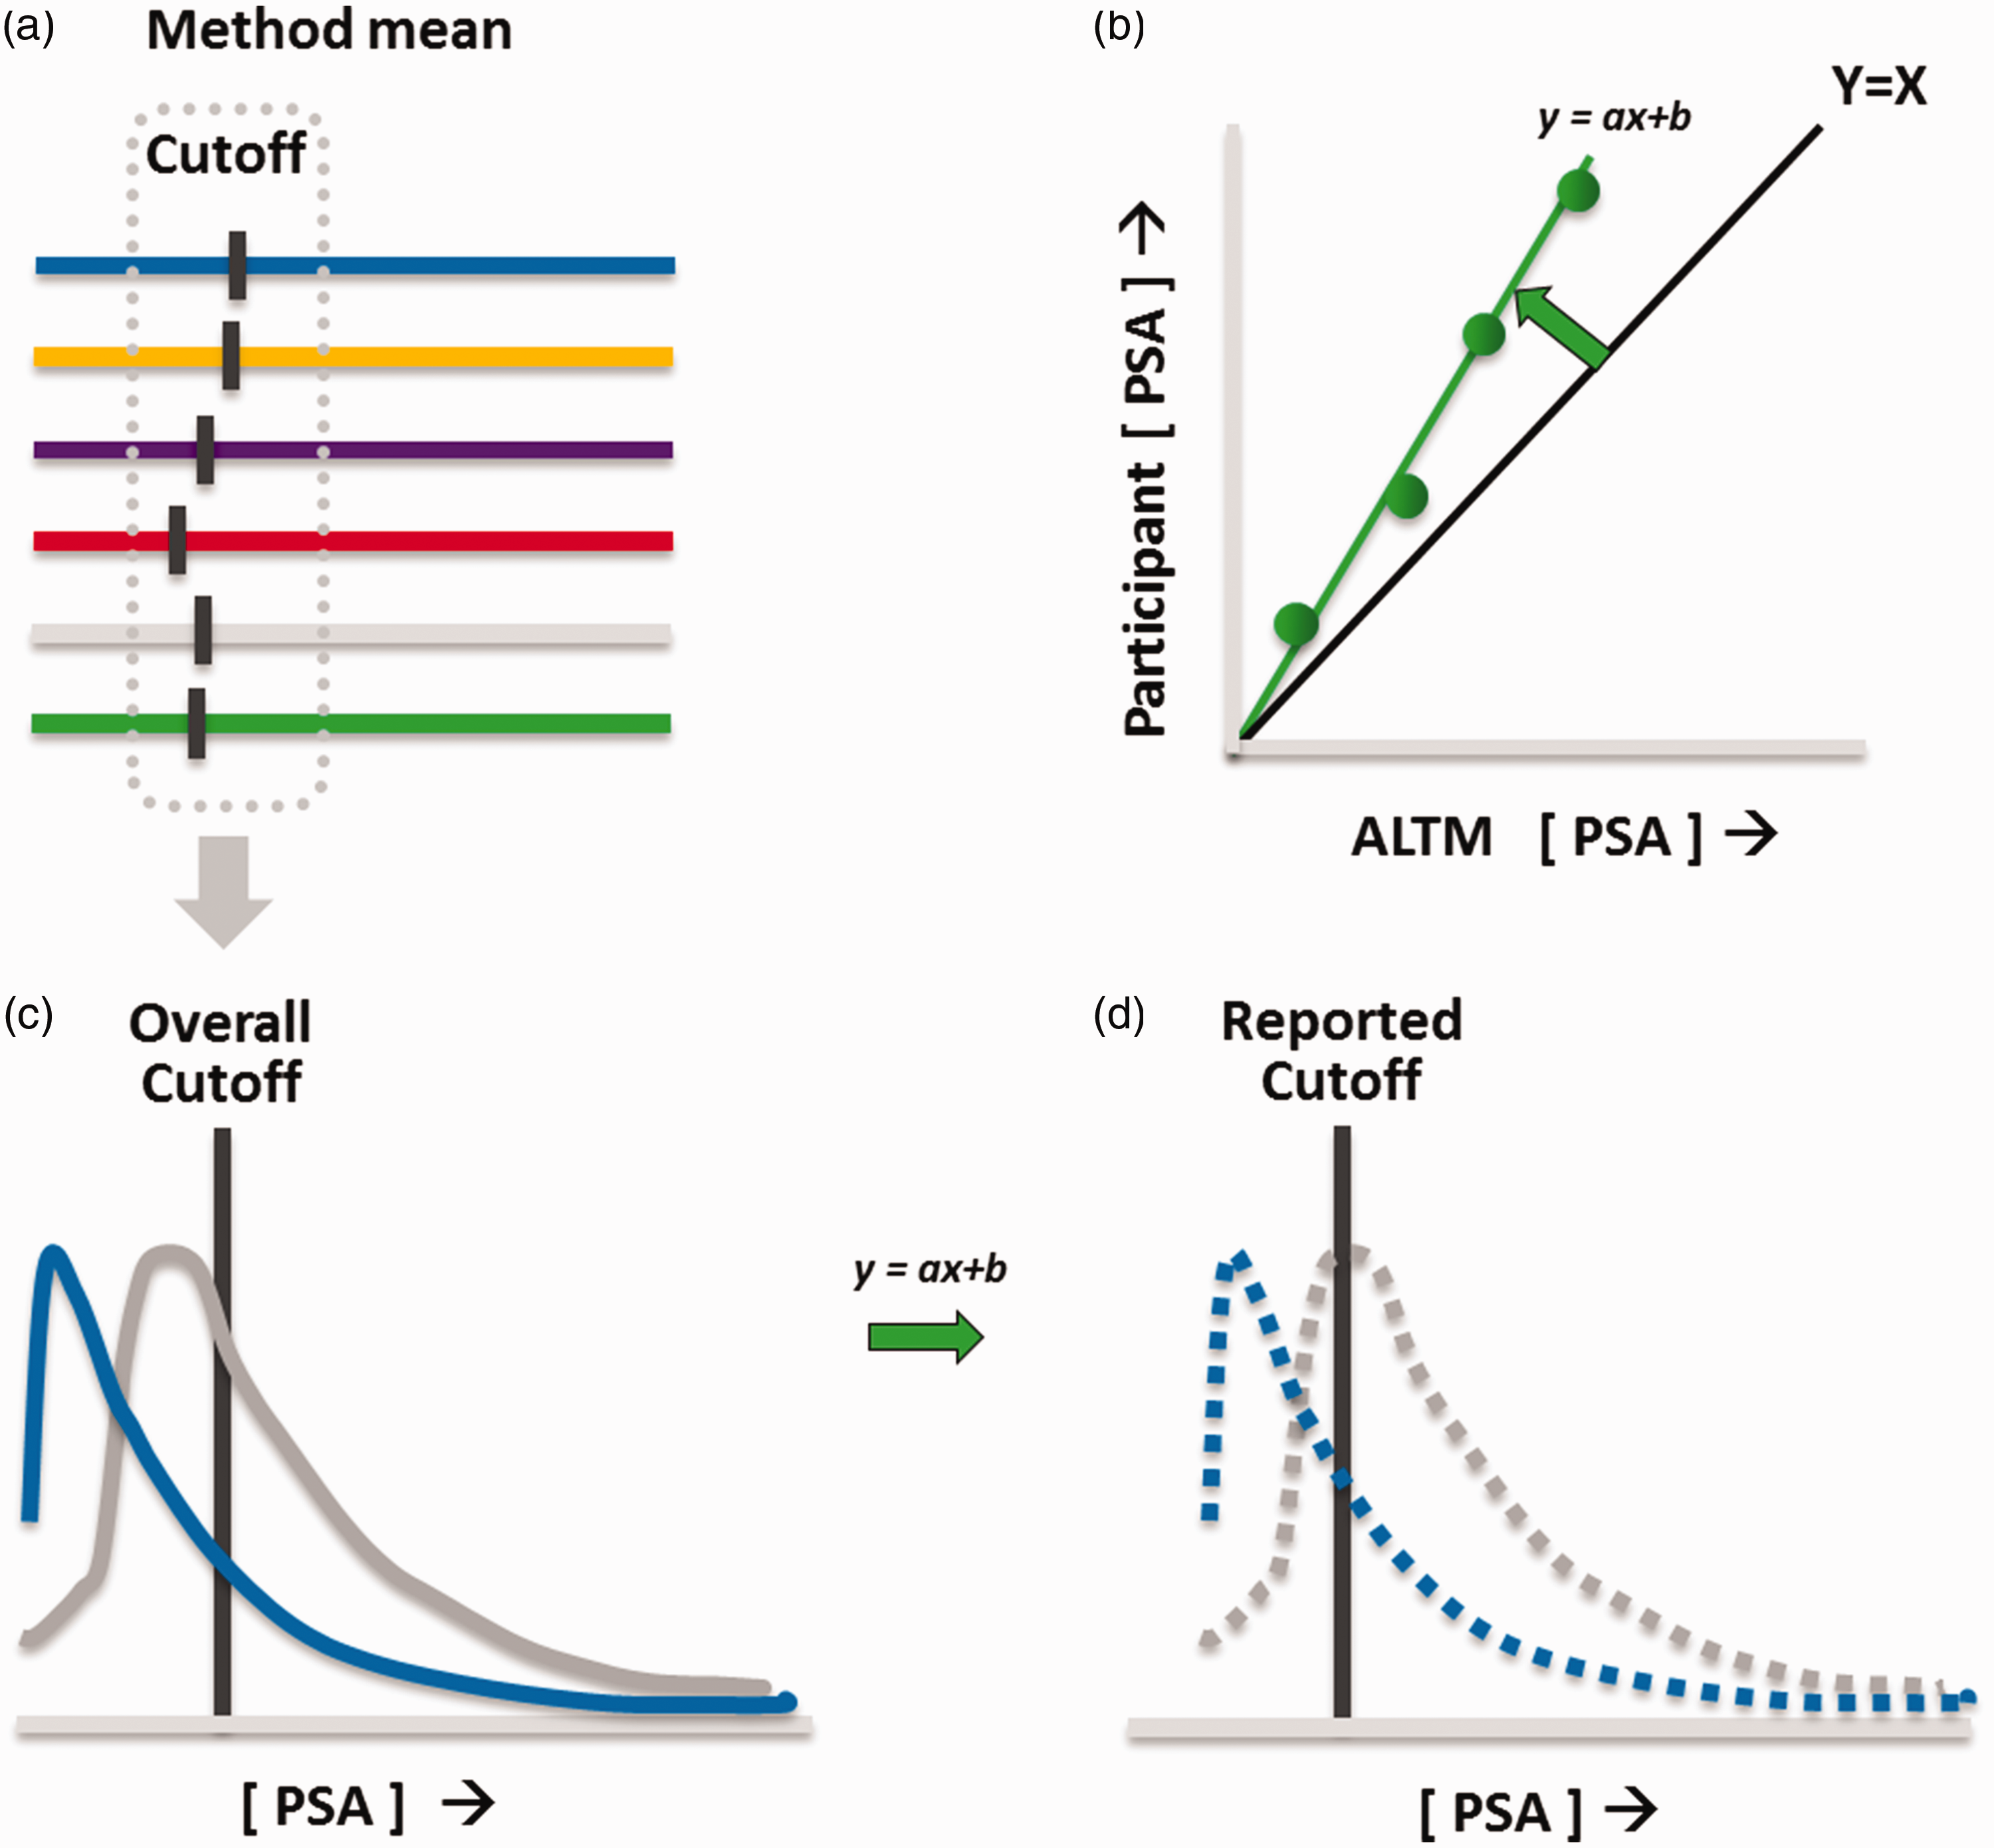
Schematic representation of diagnosis-based external quality assessment of PSA. Participants were asked to provide the cut-off values, as they report with their PSA results. (a) Based on these cut-off values, method-specific values were calculated. (b) For each participant, the EQAS results were compared with the all laboratory trimmed mean (ALTM), and the regression line was calculated (equation y = ax + b). (c) PSA from patients with a positive and negative prostate biopsy was retrospectively sampled from Catharina Hospital Eindhoven. (d) For each participant, these populations were adjusted according to the regression line found in (b). Subsequently, the sensitivity, specificity, positive predictive value and negative predictive value were calculated for the different methods, as well as the type of cut-off applied (fixed versus age dependent).
Clinical data-set
In order to examine the clinical effect of participant-specific concentration differences and reported cut-off values, a clinical data-set was retrospectively sampled from Catharina Hospital Eindhoven. All 1040 patients referred for the first time to the Urology Department of the Catharina Hospital Eindhoven in the period 2011–2016 with a baseline PSA measurement (maximal 30 days prior or after referral) and a conclusive prostate biopsy (30 days prior till 90 days after PSA measurement) were included. The age range was 40–80 years. In total, 439 and 601 patients were categorized as positive and negative for PCa, respectively (Supplemental Figure 1). Subsequently, for each participant, the distribution of PSA values was shifted in accordance with its linear regression fit of the proficiency testing (Figure 1). Individual patients were analysed according to their method-adjusted PSA value, age and the laboratory-specific cut-off value. Based on the participant-specific cut-off value, the sensitivity, specificity, positive predictive value and negative predictive value were calculated for the different methods, as well as the type of cut-off applied (fixed versus age dependent).
Results
Method-specific differences in PSA according to the Dutch EQAS 2015–2016
As shown in Supplemental Table 1, a total of 101 laboratories participated in the regular proficiency testing for PSA. Of these laboratories, 57 participants also provided their cut-off values, whereby 19 laboratories apply a cut-off value fixed for all ages. The following method/platforms were used in the Netherlands in 2015–2016: Access Hybritech calibrated (Beckman Coulter, Brea, California), Access WHO calibrated (Beckman Coulter), Advia/Centaur (Siemens, Munich, Germany), Architect (Abbott Diagnostics, Lake Forest, Illinois), Dimension Vista (Siemens), Elecsys/Cobas (Roche Diagnostics, Basel, Switzerland), Immulite (Siemens). Approximately 60% of the laboratories in the Netherlands use the Cobas/Elecsys method (Roche) to measure PSA. The PSA concentrations of the 24 Dutch EQAS samples in 2015–2016 ranged between 0.4 μg/L and 5.3 μg/L. The method mean of all samples ranged between 1.7 μg/L (Access WHO) and 2.5 μg/L (Dimension Vista). The mean PSA values of these 24 samples according to the method/platform versus the ALTM are depicted in Figure 2. Linear regression modelling was applied for each method/platform group to describe the relationship between the ALTM and the measured PSA values (Figure 2 and Supplemental Figure 2). A substantial method-specific bias was observed with the highest PSA concentrations by Dimension Vista users and the lowest values by Access (WHO) users. According to the linear regression curves of both users (Supplemental Figure 2), the mean difference was 26%.
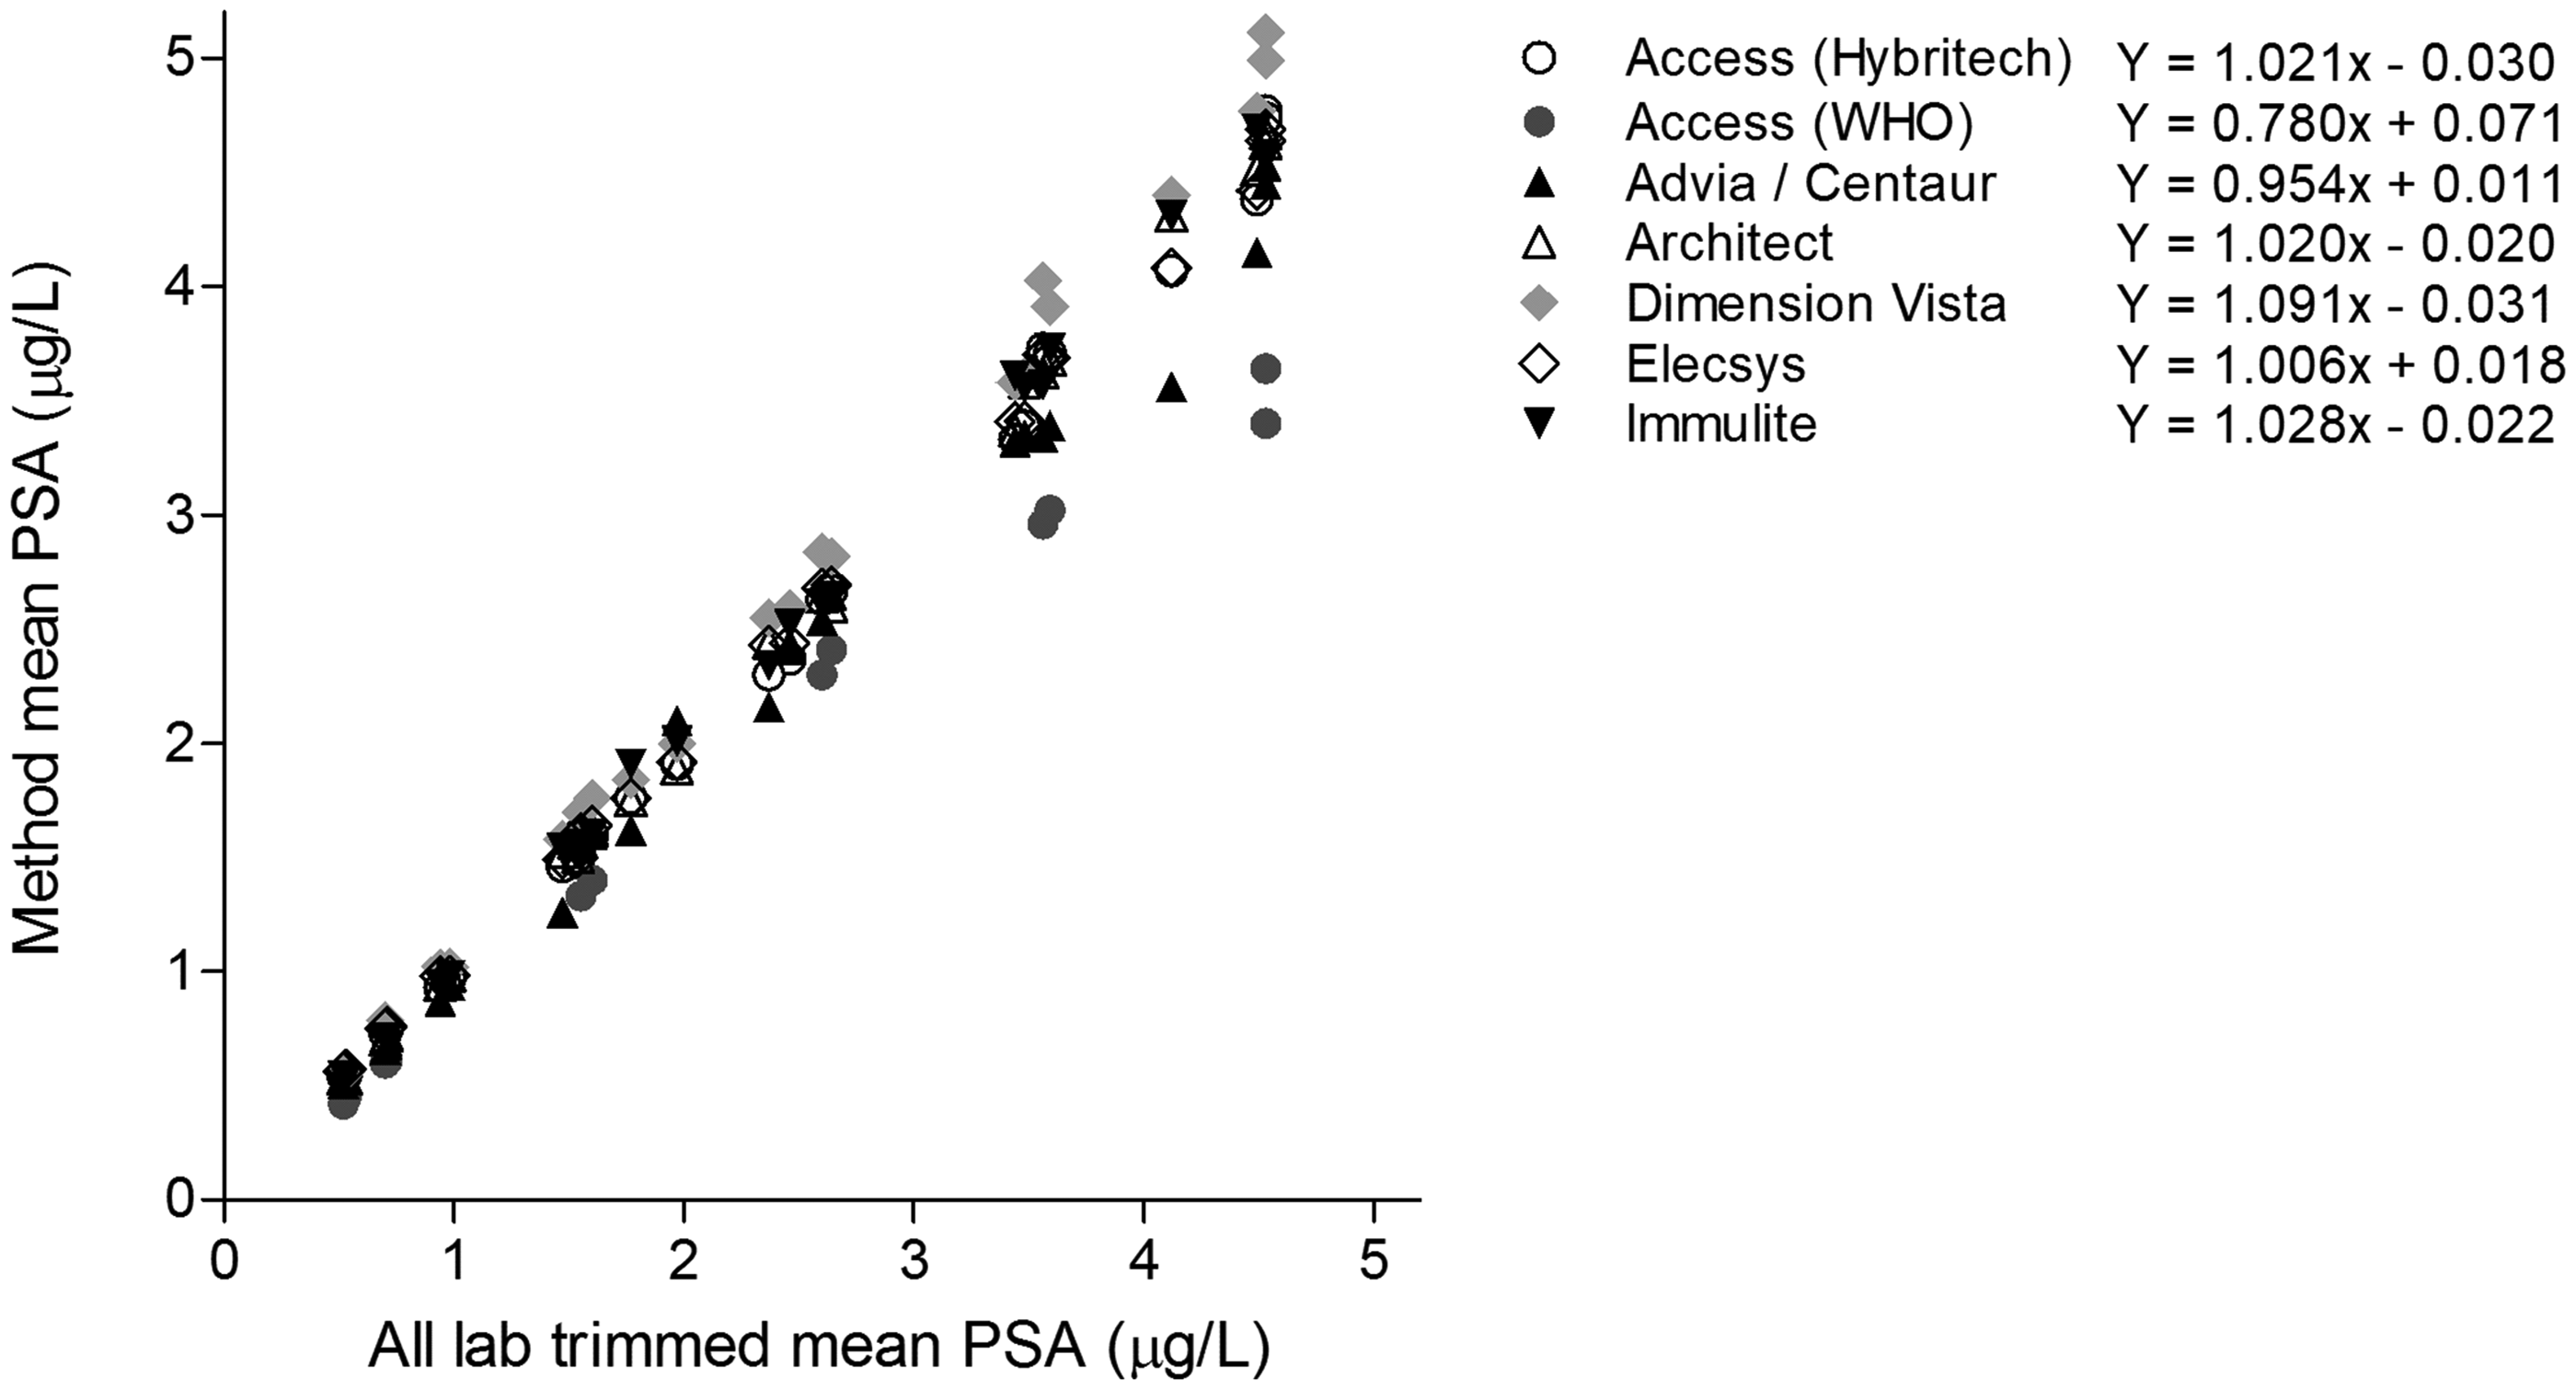
PSA method comparison in the Dutch national quality assessment of PSA. In 2015–2016, 24 samples have been distributed to the participating laboratories. Shown are the method mean PSA concentrations according to the all trimmed lab mean. The formulas of the linear regression analyses are also depicted (Supplemental Figure 1).
Method-specific differences in PSA are not reflected in the applied cut-off values
Method-dependent differences up to 26% do not necessarily imply that the number of prostate biopsies increase or decrease accordingly. The grey bars in Figure 3 represent the theoretical method-specific cut-off values that should be used to avoid method-dependent differences in decision-making. These grey bars are calibrated on the age-specific overall mean applied cut-off values. The overall mean cut-off was 3.5 μg/L and 5.2 μg/L for a male of 55 and 75 years, respectively. On top of the grey bars, the actual applied cut-off values of the individual laboratories are plotted. Surprisingly, the method-specific differences observed in the Dutch EQAS were not reflected in the applied cut-off. For example, the Dimension Vista method resulting in the highest PSA concentrations is frequently used with the lowest cut-off values in the field. Conversely, the WHO-calibrated Access method resulting in the lowest PSA concentrations is used with relatively high cut-off values (Figure 3). Therefore, this shows that the cut-off values of the laboratories do not correlate with the pattern of the method-specific differences. Furthermore, differences in cut-off values within the same method group exist up to 260% (Dimension Vista and Architect, 75 years).
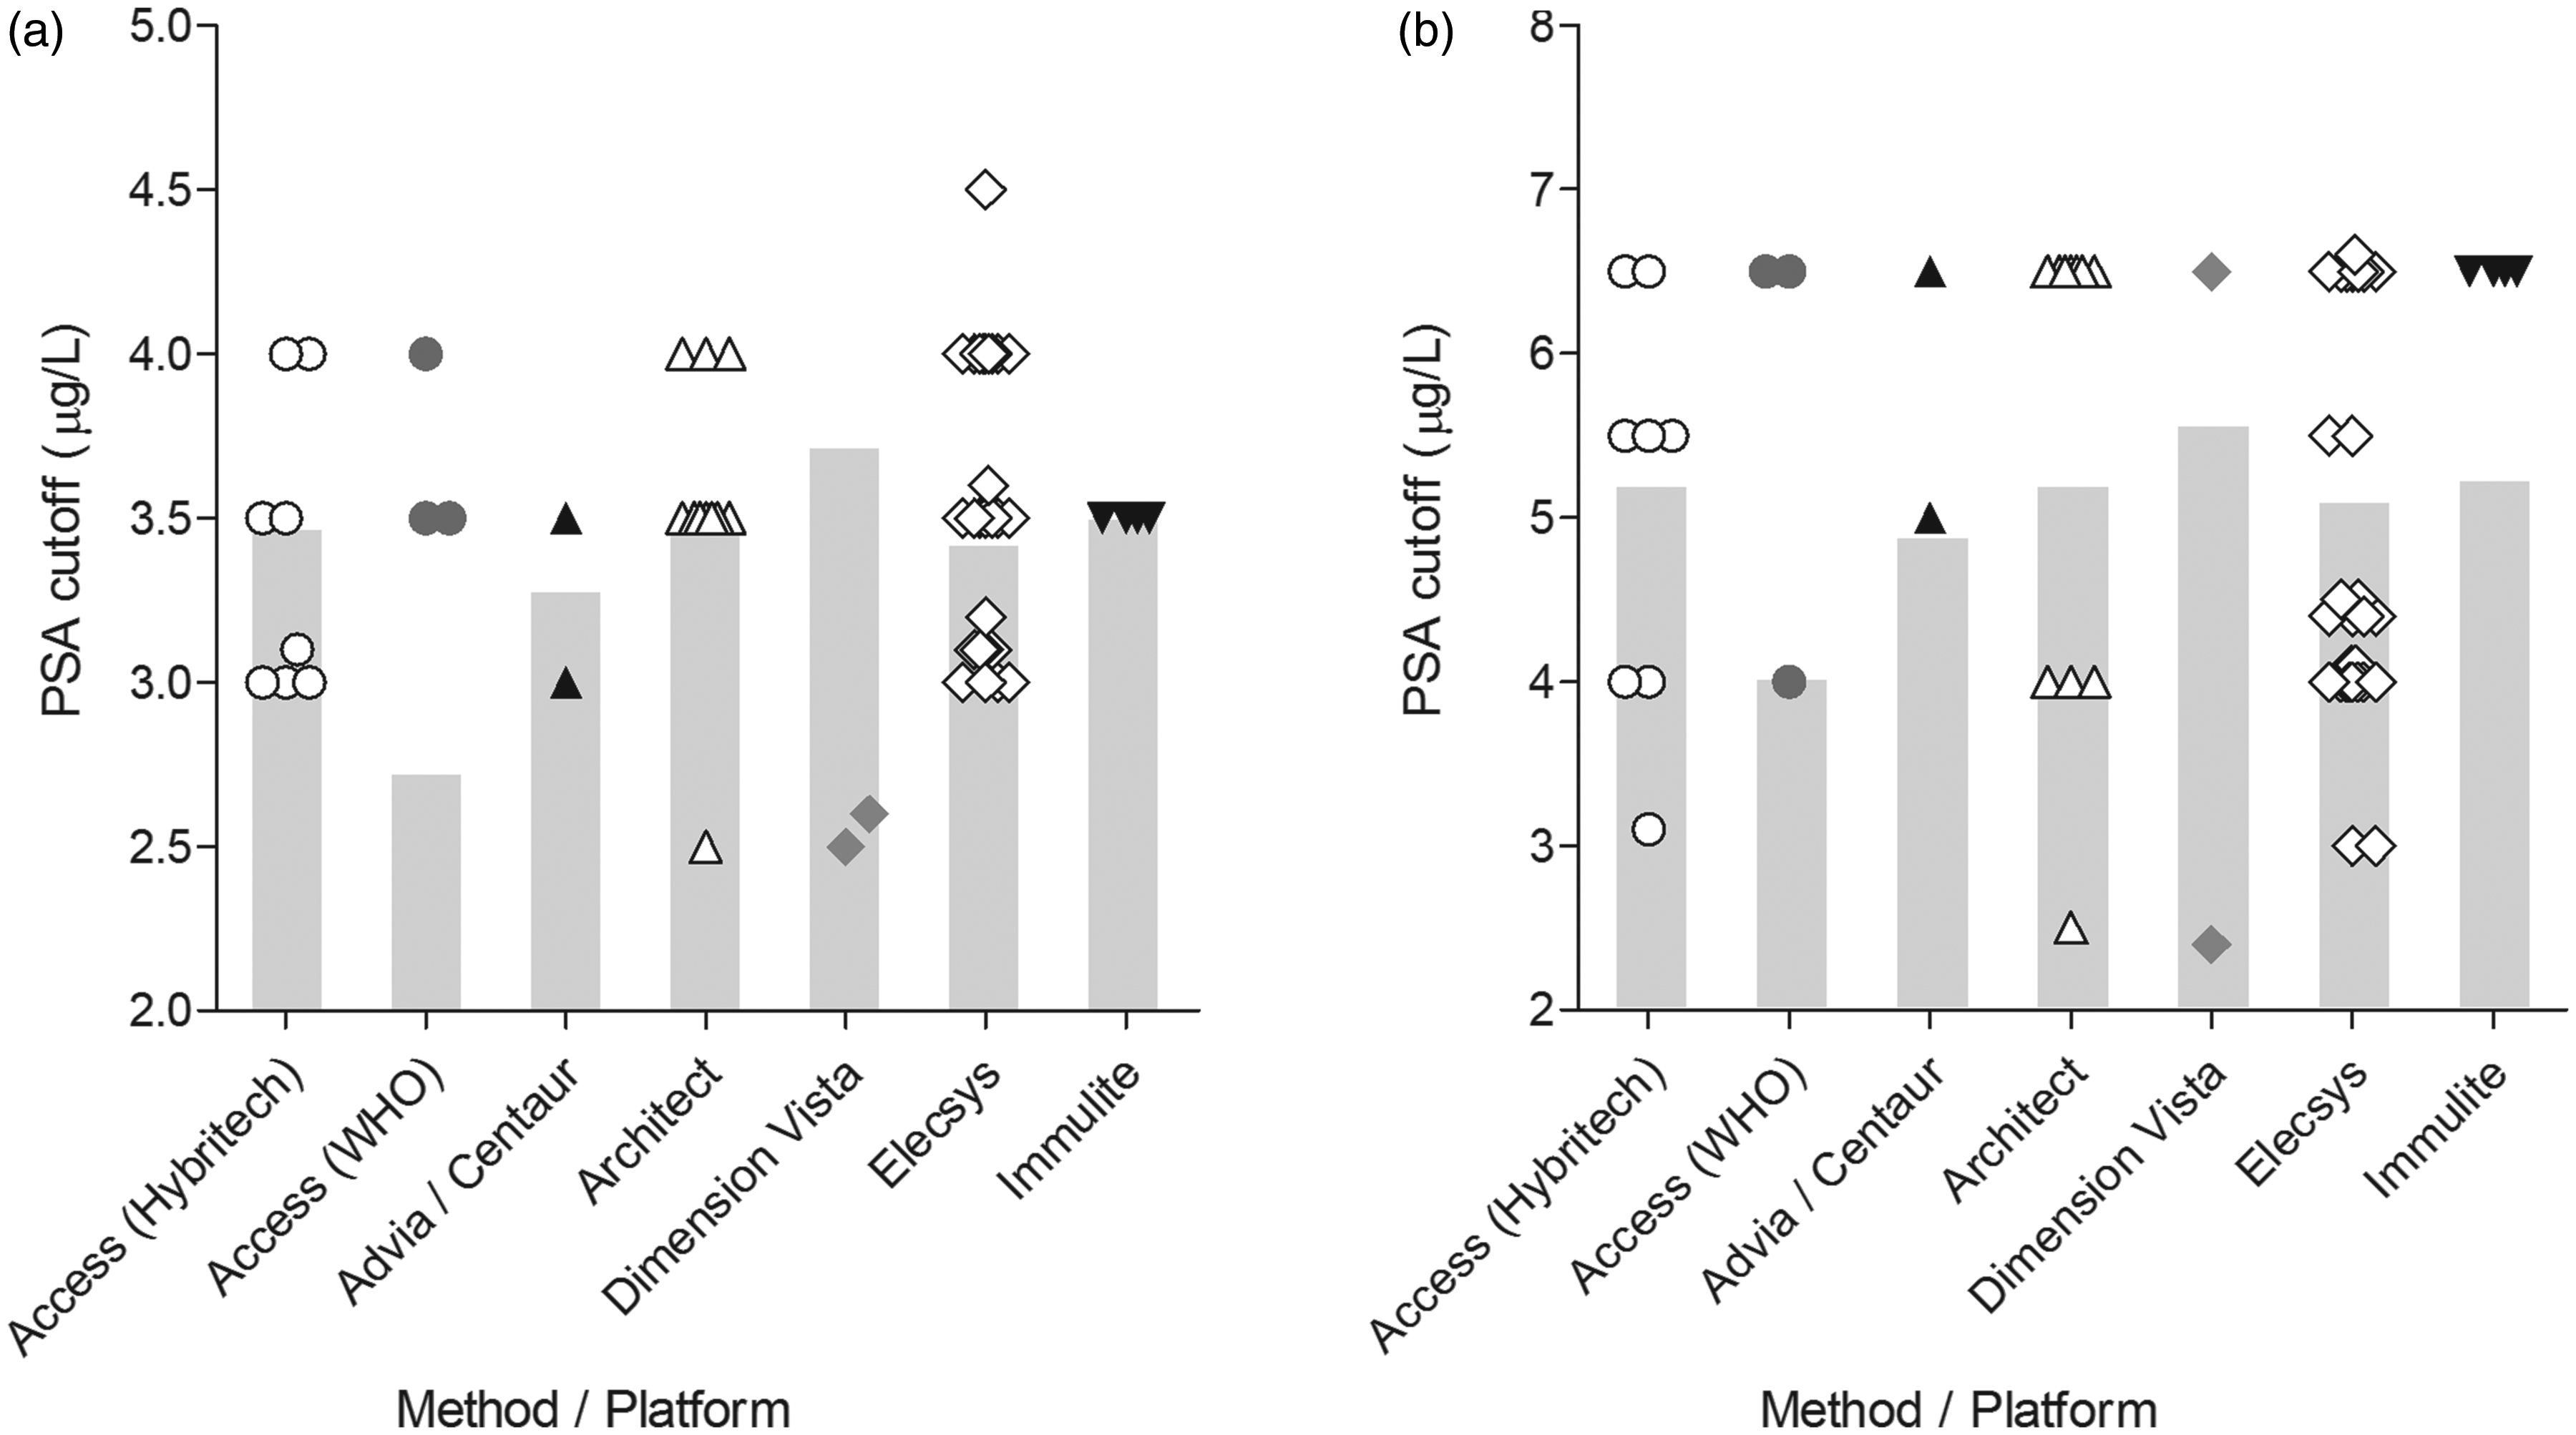
Method-specific PSA cut-off values. Depicted are the PSA cut-off values for a male of (a) 55 years and (b) 75 years, grouped by method. The symbols depict the individual applied cut-off values. The mean PSA cut-off adjusted for the method-specific differences found in Figure 2 is indicated by the grey bar.
Clinical interpretation of PSA is substantially affected by the type of PSA cut-off value
The method differences up to 26% are not compensated by similar differences in cut-off values. On the contrary, the applied cut-off values increase the differences in clinical decision. In order to quantify the overall effect on clinical interpretation, a patient cohort of 1040 patients was used. These men were referred to the Urology Department for the first time and had both an initial PSA measurement and a concomitant conclusive prostate biopsy. Since 47% of these men had PCa on referral, this data-set could be used to estimate participant-specific sensitivity, specificity, positive and negative predicting value for PCa. Assuming that the EQAS more or less reflect PSA concentrations found in patients, the PSA concentrations of the cohort was recalculated based on the EQAS findings. As expected, large differences in sensitivity and specificity are found between participants. Even within the same method group 2–3-fold differences exist (Supplemental Figure 3). However, a subanalysis on the type of cut-off values (fixed versus age dependent) showed that the largest differences were caused by the type of cut-off values, regardless of the method (Supplemental Figure 3). Fixed cut-off values resulted consequently in higher sensitivities and lower specificities than age-dependent cut-off values. Since the type of cut-off value outweighs the method differences, all users of age-dependent and fixed cut-off values were grouped. As depicted in Figure 4, a fixed PSA cut-off has a 10% higher mean sensitivity (89% range 86–93% versus 79% range 63–95%) with a concomitant 6% higher negative predictive value (84% range 82–87% versus 78% range 70–88%). On the other hand, the mean specificity was 10% lower for fixed cut-off values (43% range 34–46% versus 53% range 27–65%), while the positive predictive value was only 2% lower (54% range 52–55% versus 56% range 50–57%). Concomitantly, the mean percentage false negatives were higher for age-specific cut-offs (9% range 2–16% for age-specific cut-off values versus 5% 2–6% for fixed cut-off values). Together, these results indicate that applied reference intervals exceed method-specific differences as the major source of variation in the clinical interpretation of PSA. Furthermore, fixed cut-off values detected PCa with the highest sensitivity.
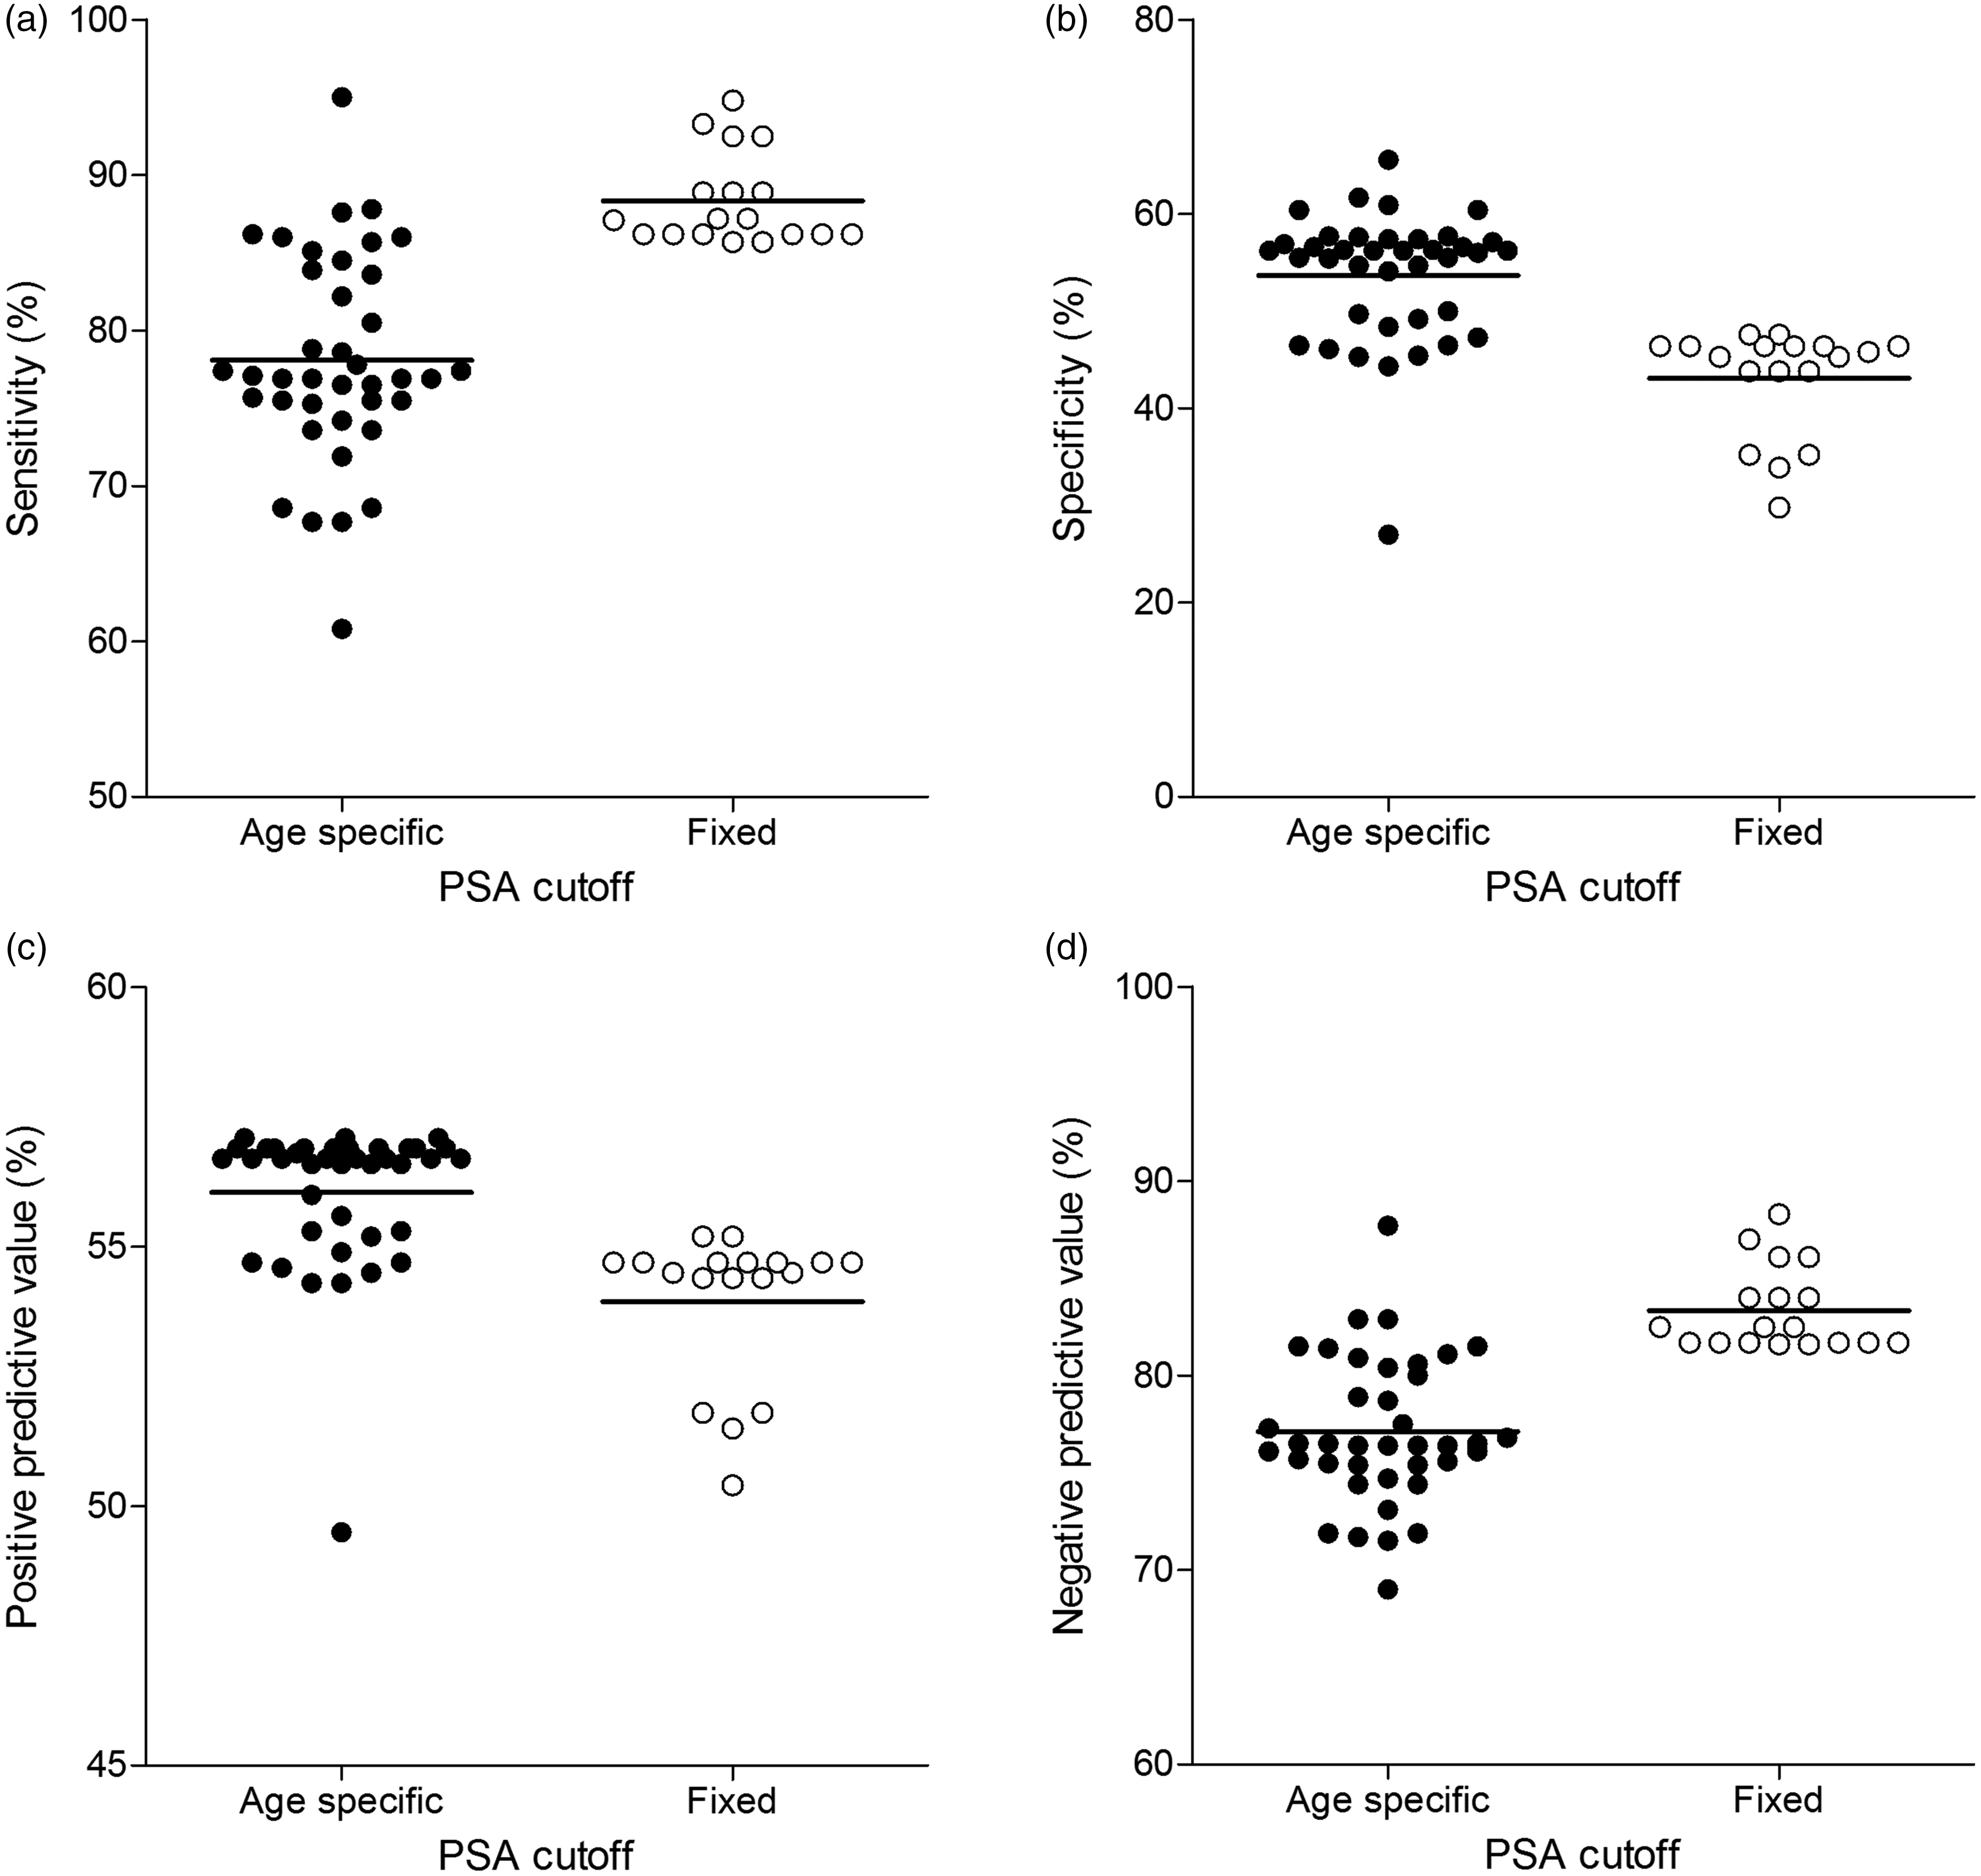
Clinical interpretation of PSA grouped by type of cut-off value. For each participant, the distribution of PSA values from a clinical data-set with a conclusive prostate biopsy was shifted in accordance with its linear regression fit of the proficiency testing. According to the age of the patient, the conclusion of the prostate biopsy, the corrected PSA value and the participant-reported cut-off value, the sensitivity (a), specificity (b), positive predictive value (c) and negative predictive value (d) were calculated for each participant. Participants are grouped by the type of cut-off. Fixed cut-off values are depicted by the open circles, whereas age-specific cut-off values are indicated by the filled circles.
Discussion
In this study, we aimed to gain more insight on the current situation regarding the clinical interpretation of PSA values among different laboratories in the Netherlands. Our data indicate that there is large variation among laboratories. Several factors attribute to this variation.
First, our data show that PSA values differ substantially between methods/platforms, with a maximal observed difference of 26%. This difference can be largely contributed to the type of calibration of the Beckman Access method, as WHO calibrated instruments reports 20% lower concentrations than Hybritech calibrated instruments.10,11 However, when excluding Access users, we still observe a maximal difference in PSA values of 13%, with the highest values Dimension Vista and the lowest values by Advia/Centaur users. Possible underlying differences for this variation are differences in assay design, such as the non-equimolarity of PSA measurements and differential epitope recognition.11,17
Second, different laboratories, even those using the same method/platform, apply different PSA cut-off values. In the Elecsys method group for example, PSA cut-off values of 3.0, 4.0, 4.1, 4.4, 4.5, 5.5 and 6.5 μg/L are applied for a male patient of 75 years. The suggested cut-off value by the manufacturer of the Elecsys method is 4 μg/L, which is applied by only 30% of the laboratories with an Elecsys method. Similar findings are observed in the Architect, Access (WHO) and Access (Hybritech) group. The suggested cut-off values by the manufacturers are 4.0, 4.0 and 3.1 μg/L, respectively, which are applied by only 25%, 33%, 28% of the users, respectively. This suggests that other sources like clinical guidelines and literature might contribute to the variation. Furthermore, the applied cut-off values do not compensate for the method-dependent differences in PSA concentrations. Large differences between laboratories in the analyses of PSA values and their clinical interpretation are also reflected in recent guidelines. 18 They advocate that a limited PSA elevation alone should be verified after a few weeks, in the same laboratory, using the same assay under standardized conditions before considering a prostate biopsy.
Third, when visualizing both the method-specific and cut-off-specific differences in a clinical data-set of males with a conclusive prostate biopsy, we observed that differences in applied cut-off values result in more variability than the differences between the PSA methods. Fixed PSA cut-off values have a higher sensitivity and lower specificity compared with age-specific cut-off values independent of the method. Age-specific cut-off values were introduced based on the evidence that the prostate enlarges during aging and contains more PSA-producing tissue. 16
Reference intervals or cut-off values used for clinical interpretation are generally not included in external quality assessment programmes. Our study demonstrates a tool to compare the performance of laboratories with respect to the interpretation of the results for clinical use. Nevertheless, the assumption must hold that the EQAS programme reflects actual patient concentrations. For PSA, this is valid for endogenous PSA concentrations, but PCa-related PSA might behave differently in multiple methods. Therefore, converting PSA concentrations in the data-set of primary referred urology patient might not necessarily result in the same PSA concentrations as when the samples were actually measured with the other method. Nevertheless, the method-dependent effects (and possible non-commutability) are secondary to the type of cut-off values.
The decision process of clinical practice does not solely rely on the interpretation of a single PSA value and cut-off value. Therefore, the clinical interpretation of PSA value should take into account the biological variation of PSA, which constitutes 20% in the concentration range of 0.1–20 μg/L for men aged 50 years and older. 19 This study provides a tool to quantify the maximal potential differences between laboratory methods and their cut-off values. The effect for the individual patient will probably be less pronounced.
To conclude, this study confirms the variation in PSA values among method/platforms. However, the differences in applied cut-off values result in more variability than the differences between PSA analytical values. These results emphasize the need for (inter)national harmonization/standardization programmes including cut-off values. This process will require the involvement of all stakeholders, including IVD manufacturers, to allow for laboratory-independent clinical decision-making.
Supplemental Material
Supplemental material for Clinical interpretation of prostate-specific antigen values: Type of applied cut-off value exceeds methods bias as the major source of variation
Supplemental Material for Clinical interpretation of prostate-specific antigen values: Type of applied cut-off value exceeds methods bias as the major source of variation by Lieke JJ Klinkenberg, Eef GWM Lentjes and Arjen-Kars Boer in Annals of Clinical Biochemistry
Footnotes
Acknowledgements
We are grateful to the Dutch Foundation for Quality Assessment in Medical Laboratories (SKML) and to all laboratories that provided their PSA cut-off values.
Declaration of conflicting interests
The author(s) declared no potential conflicts of interest with respect to the research, authorship, and/or publication of this article.
Funding
The author(s) received no financial support for the research, authorship, and/or publication of this article.
Ethical approval
Not applicable.
Guarantor
AKB.
Contributorship
LJJK analysed the data and wrote the first draft of the article. EGWML was involved in the concept of the study and the interpretation of the data. A-KB contributed to the concept of the study, the acquisition and the analysis of the data. All authors reviewed and edited the article and approved the final version of the article.
References
Supplementary Material
Please find the following supplemental material available below.
For Open Access articles published under a Creative Commons License, all supplemental material carries the same license as the article it is associated with.
For non-Open Access articles published, all supplemental material carries a non-exclusive license, and permission requests for re-use of supplemental material or any part of supplemental material shall be sent directly to the copyright owner as specified in the copyright notice associated with the article.