
Abstract
Background
Circulating asymmetric dimethylarginine and symmetric dimethylarginine are increased in patients with kidney disease. Symmetric dimethylarginine is considered a good marker of glomerular filtration rate, while asymmetric dimethylarginine is a marker of cardiovascular risk. However, a link between symmetric dimethylarginine and all-cause mortality has been reported. In the present study, we evaluated both dimethylarginines as risk and glomerular filtration rate markers in a cohort of elderly white individuals, both with and without chronic kidney disease.
Methods
Glomerular filtration rate was measured in 394 individuals aged >74 years using an iohexol clearance method. Plasma asymmetric dimethylarginine, symmetric dimethylarginine and iohexol were measured simultaneously using isotope dilution tandem mass spectrometry.
Results
Plasma asymmetric dimethylarginine concentrations were increased (P < 0.01) in people with glomerular filtration rate <60 mL/min/1.73 m2 compared with those with glomerular filtration rate ≥60 mL/min/1.73 m2, but did not differ (P > 0.05) between those with glomerular filtration rate 30–59 mL/min/1.73 m2 and <30 mL/min/1.73 m2. Plasma symmetric dimethylarginine increased consistently across declining glomerular filtration rate categories (P < 0.0001). Glomerular filtration rate had an independent effect on plasma asymmetric dimethylarginine concentration, while glomerular filtration rate, gender, body mass index and haemoglobin had independent effects on plasma symmetric dimethylarginine concentration. Participants were followed up for a median of 33 months. There were 65 deaths. High plasma asymmetric dimethylarginine (P = 0.0412) and symmetric dimethylarginine (P < 0.0001) concentrations were independently associated with reduced survival.
Conclusions
Among elderly white individuals with a range of kidney function, symmetric dimethylarginine was a better marker of glomerular filtration rate and a stronger predictor of outcome than asymmetric dimethylarginine. Future studies should further evaluate the role of symmetric dimethylarginine as a marker of outcome and assess its potential value as a marker of glomerular filtration rate.
Keywords
Introduction
Dimethylarginines are produced in all nucleated cells as a result of methylation of arginine residues in proteins and subsequent release of free methylarginines following proteolysis. 1 It is known that both asymmetric dimethylarginine (ADMA) and symmetric dimethylarginine (SDMA) are increased in the blood of patients with kidney failure.2,3 ADMA has structural similarity to the amino acid L-arginine and acts as an endogenous inhibitor of nitric oxide synthesis: SDMA does not have this property. 2 Consequently, increased concentrations of ADMA have been associated with oxidative stress, inflammation, fibrogenesis and endothelial dysfunction and may contribute to both cardiovascular risk4,5 and chronic kidney disease (CKD) progression.6–10 Given the strong association between cardiovascular disease and CKD,11–13 there is interest in the use of ADMA as both a risk marker and promoter of cardiovascular disease progression in this setting. It is generally held that SDMA, which is mainly eliminated from the body by renal excretion, 14 is a good marker of glomerular filtration rate (GFR), while ADMA is a good marker of cardiovascular risk. However, studies have also shown a strong and independent link between SDMA, all-cause mortality, and cardiovascular events. 15 In the present study, we have evaluated both dimethylarginines as risk and GFR markers in a large cohort of elderly white individuals, both with and without CKD, and in whom GFR has been characterized using a reference technique.
Materials and methods
The study included a cohort of 394 white people aged 74 years and above as previously described. 16 All subjects gave informed consent. The study took place in East Kent, a semi-rural area of Southern England.
GFR was measured using an iohexol clearance method as previously described. 16 Briefly, following intravenous injection of a 5 mL bolus of Omnipaque 240 (518 g/L iohexol corresponding to 240 g/L of iodine, GE Healthcare, www.gelifesciences.com) lithium heparin blood samples were taken before and at 5, 120, 180 and 240 min after injection.
Iohexol GFR was calculated using a single compartment model
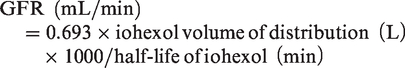
The GFR (mL/min) was corrected for body surface area and the Brochner-Mortensen correction applied. 17
Plasma ADMA, SDMA, creatinine and iohexol were measured simultaneously in lithium heparin plasma using a modified stable isotope dilution electrospray tandem mass spectrometric method reported for creatinine 18 with minor modification. 16 ADMA and SDMA concentrations reported here were measured in blood obtained immediately prior to iohexol injection. Samples were thawed and mixed well, 50 μL of plasma was mixed with 50 μL of deionized water containing 50 pmoL of [2H6] ADMA and 50 pmoL of [2H6] SDMA and precipitated with 200 μL of acetonitrile. The stable isotopes for [2H6] ADMA and [2H6] SDMA were synthesized by the Department of Chemistry, King's College London, London, UK. Following mixing and centrifugation for 3 min at 21,800 × g, the supernatants were transferred to a 96-deep well plate. Supernatant (5 μL) was pipetted using an HTSPAL autosampler into a 250 μL/min mobile-phase stream of acetonitrile/water (50:50; v/v) with 0.025% (v/v) formic acid. Chromatography was done on a Chirobiotic T 100 mm × 2.1 mm column with a 2 cm × 4 mm guard column (Advanced Separation Technologies), and precursor/product ion pairs (m/z 203.1/46.2 and 209.1/52.2 for ADMA and m/z 203.1/172.2 and 209.1/175.1 for SDMA) were obtained in positive-ion multiple reaction monitoring method using a Sciex API4000 (Applied Biosystems, ThermoFisher Scientific, Waltham MA, USA). Assay standardization was based on aqueous standards at 0.25, 1.0 and 5.0 μmol/L ADMA/SDMA stored at −80°C. For the internal quality control, pooled and spiked plasma samples were used. Intra-assay coefficients of variation were 2.1% at a concentration of 370 nmol/L for plasma ADMA and 3.5% at a concentration of 440 nmol/L for plasma SDMA. Results were calculated using Analyst version 1.4.1. 19
Statistical analysis was performed using Analyse-it™ (Analyse-it™ Software, Ltd, Leeds, UK), InStat® (GraphPad® Software Inc., San Diego, USA) and StatsDirect (StatsDirect Ltd, Cheshire, UK). A P value of <0.05 was considered statistically significant. Most data, except haemoglobin, were not normally distributed (P < 0.001, Shapiro-Wilk test), and all concentrations were expressed as median and interquartile range. Data were studied across GFR groups defined as ≥60, 30–59 and <30 mL/min/1.73 m2. The Mann-Whitney U-test was used to compare data between two groups and the Kruskal-Wallis test (non-parametric analysis of variance [ANOVA]) to detect trends across more than two groups. Dunn's multiple comparison test was used to undertake pairwise comparisons if a significant effect was observed. Categorical variables were analysed using chi-squared test for trend.
Spearman rank analysis was used to test for univariate relationships between plasma ADMA and SDMA concentrations and other clinical variables including age, body mass index (BMI), mean arterial blood pressure (MABP), haemoglobin, GFR and plasma creatinine. Multiple linear regression analysis was used to assess the independent effect of clinical variables (age, gender, BMI, MABP, GFR, number of medications, haemoglobin, presence of vascular disease, hypertension and smoking status) on plasma ADMA and SDMA concentrations. Manual backward elimination was performed; clinical variables that were not significant (P > 0.05) were eliminated from the analysis. Multicollinearity was not detected in any models used.
Survival analysis (all-cause mortality) was studied using the Kaplan-Meier method. Significance between risk stratification groups (plasma ADMA and SDMA concentration above and below the median value) was determined using the Wilcoxon log-rank statistical test. Cox proportional hazard ratio was used to determine the association of variables with the risk of all-cause death. Unadjusted hazard ratios (HRs) and the 95% confidence interval were calculated for plasma ADMA and SDMA concentration, age, gender, BMI, MABP, GFR, number of medications, haemoglobin concentration, diabetes mellitus, smoking status and hypertension. HRs and 95% confidence intervals were expressed per 1–SD higher value of each variable for continuous variables. Cox regression analysis was performed with adjustment for the significant variables. Manual backward elimination was performed; clinical variables that were not significant (P > 0.05) were excluded from the analysis. Multicollinearity was not detected in any models used.
Results
The East Kent cohort has been described previously. 16 Briefly, subjects ranged in age from 74 to 97 years and were exclusively white. Approximately equal numbers of men and women were included. Characteristics overall and by GFR category are summarized in Table 1. Age and number of medications increased and haemoglobin concentration decreased with declining GFR. The prevalence of vascular disease, diabetes mellitus and hypertension increased with declining GFR.
Subject characteristics by GFR category.
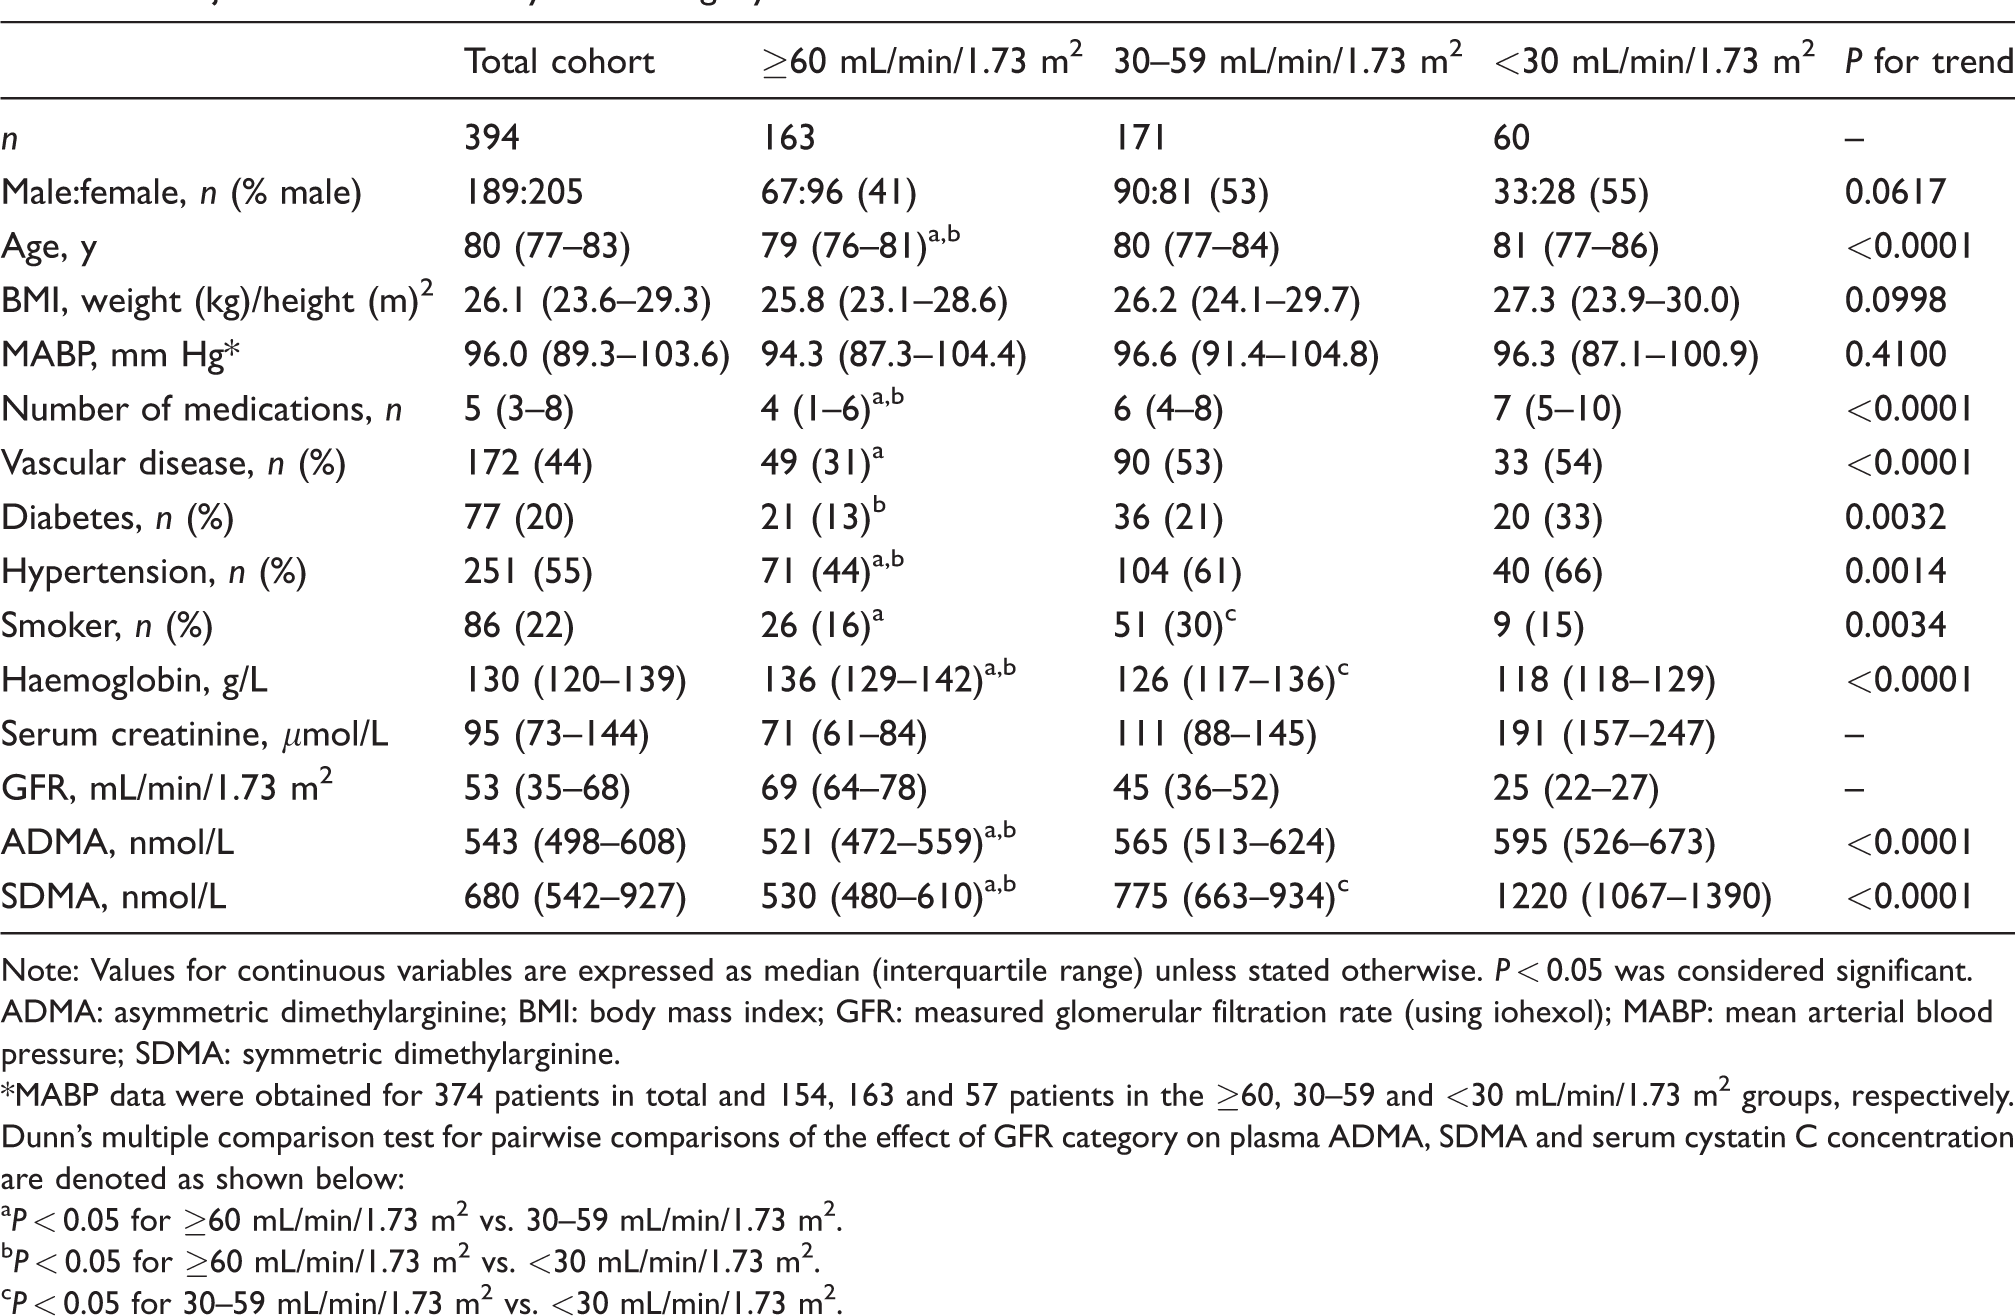
Note: Values for continuous variables are expressed as median (interquartile range) unless stated otherwise. P < 0.05 was considered significant.
ADMA: asymmetric dimethylarginine; BMI: body mass index; GFR: measured glomerular filtration rate (using iohexol); MABP: mean arterial blood pressure; SDMA: symmetric dimethylarginine.
*MABP data were obtained for 374 patients in total and 154, 163 and 57 patients in the ≥60, 30–59 and <30 mL/min/1.73 m2 groups, respectively.
Dunn's multiple comparison test for pairwise comparisons of the effect of GFR category on plasma ADMA, SDMA and serum cystatin C concentration are denoted as shown below:
aP < 0.05 for ≥60 mL/min/1.73 m2 vs. 30–59 mL/min/1.73 m2.
bP < 0.05 for ≥60 mL/min/1.73 m2 vs. <30 mL/min/1.73 m2.
cP < 0.05 for 30–59 mL/min/1.73 m2 vs. <30 mL/min/1.73 m2.
Plasma ADMA concentrations were increased (P < 0.01) in people with GFR <60 mL/min/1.73 m2 compared with those with GFR ≥60 mL/min/1.73 m2, but did not differ (P > 0.05) between GFR category 30–59 mL/min/1.73 m2 and <30 mL/min/1.73 m2. Conversely, plasma SDMA increased consistently across declining GFR categories (P < 0.0001, Table 1). In univariate analyses, both plasma ADMA and SDMA concentrations increased with declining GFR (Table 2, Figure 1). Plasma SDMA but not ADMA concentration was positively correlated (P < 0.0001) with age (Table 2). Plasma SDMA concentration (median, interquartile range) was significantly higher (P < 0.0001) in males (762, 627 to 1033 nmol/L) than in females (617, 513 to 823 nmol/L): plasma ADMA concentration did not differ between genders (P > 0.05).
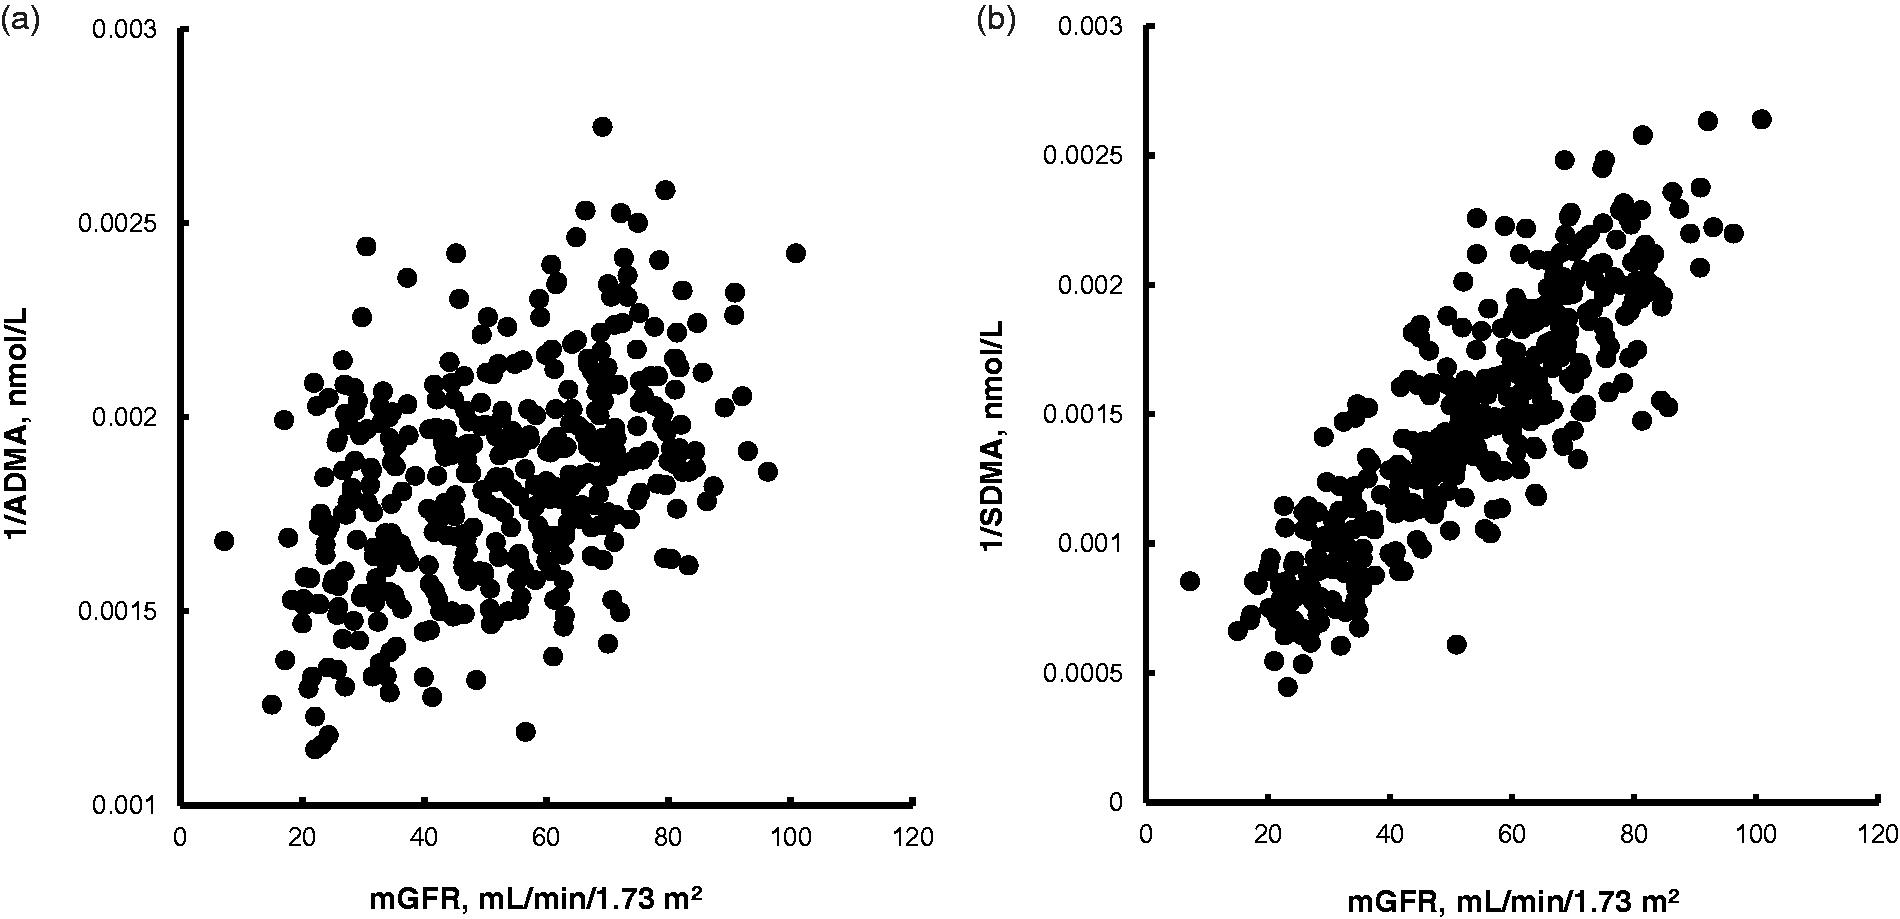
(a) Scatter plot of 1/plasma ADMA in association with measured glomerular filtration rate (mGFR). rs = 0.42, P < 0.0001. (b) Scatter plot of 1/plasma SDMA in association with measured glomerular filtration rate (mGFR). rs = 0.87, P < 0.0001.
Correlation (rs) between plasma ADMA and SDMA concentrations and clinical variables.
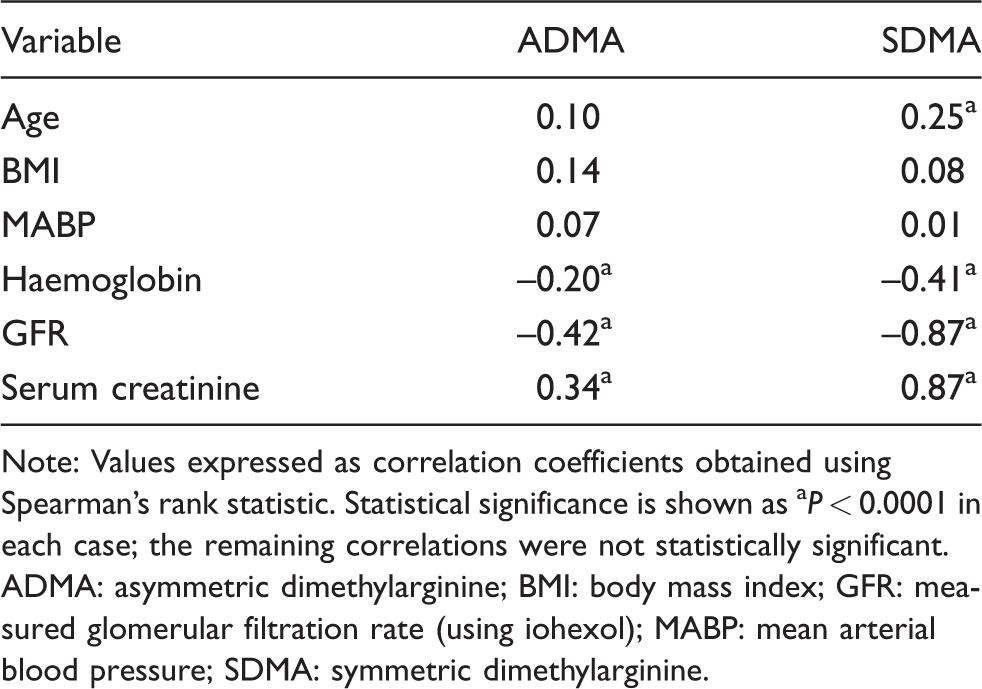
Note: Values expressed as correlation coefficients obtained using Spearman’s rank statistic. Statistical significance is shown as aP < 0.0001 in each case; the remaining correlations were not statistically significant. ADMA: asymmetric dimethylarginine; BMI: body mass index; GFR: measured glomerular filtration rate (using iohexol); MABP: mean arterial blood pressure; SDMA: symmetric dimethylarginine.
GFR was the only variable which had an independent effect on plasma ADMA concentration. The fit (R2) of the model including GFR as a variable was 0.20. GFR, gender, BMI and haemoglobin had independent effects on plasma SDMA concentration. The overall fit (R2) of the model including these three variables was 0.69 (P < 0.0001, Table 3).
Effect of clinical variables on plasma ADMA and SDMA concentrations.
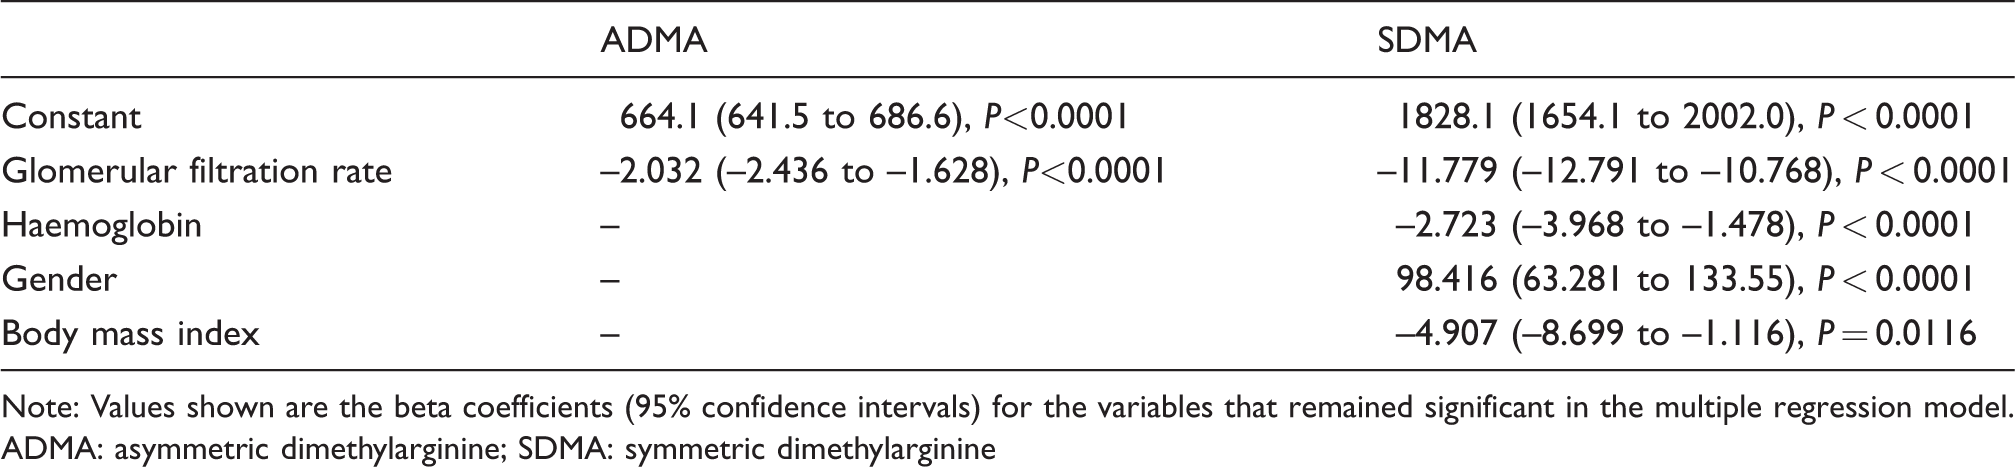
Note: Values shown are the beta coefficients (95% confidence intervals) for the variables that remained significant in the multiple regression model.
ADMA: asymmetric dimethylarginine; SDMA: symmetric dimethylarginine
All participants were followed up for a median (interquartile range) period of 33 (26–43) months. During the follow-up period, 65 people died. Seventy-two per cent of the individuals that died had plasma ADMA concentrations greater than or equal to the median plasma ADMA concentration (≥543 nmol/L). When the end point of the follow-up period was considered as 48 months, the survival chances for people with plasma ADMA concentrations ≥543 nmol/L compared with <543 nmol/L were 68% and 89%, respectively (P = 0.0009, Figure 2). The median plasma SDMA concentration was 680 nmol/L: 83% of the individuals that died had plasma SDMA concentrations ≥680 nmol/L. When the end point of the follow-up period was considered as 48 months, the survival chances for people with plasma SDMA concentrations ≥680 nmol/L compared with <680 nmol/L were 65% and 93%, respectively (P < 0.0001, Figure 2).
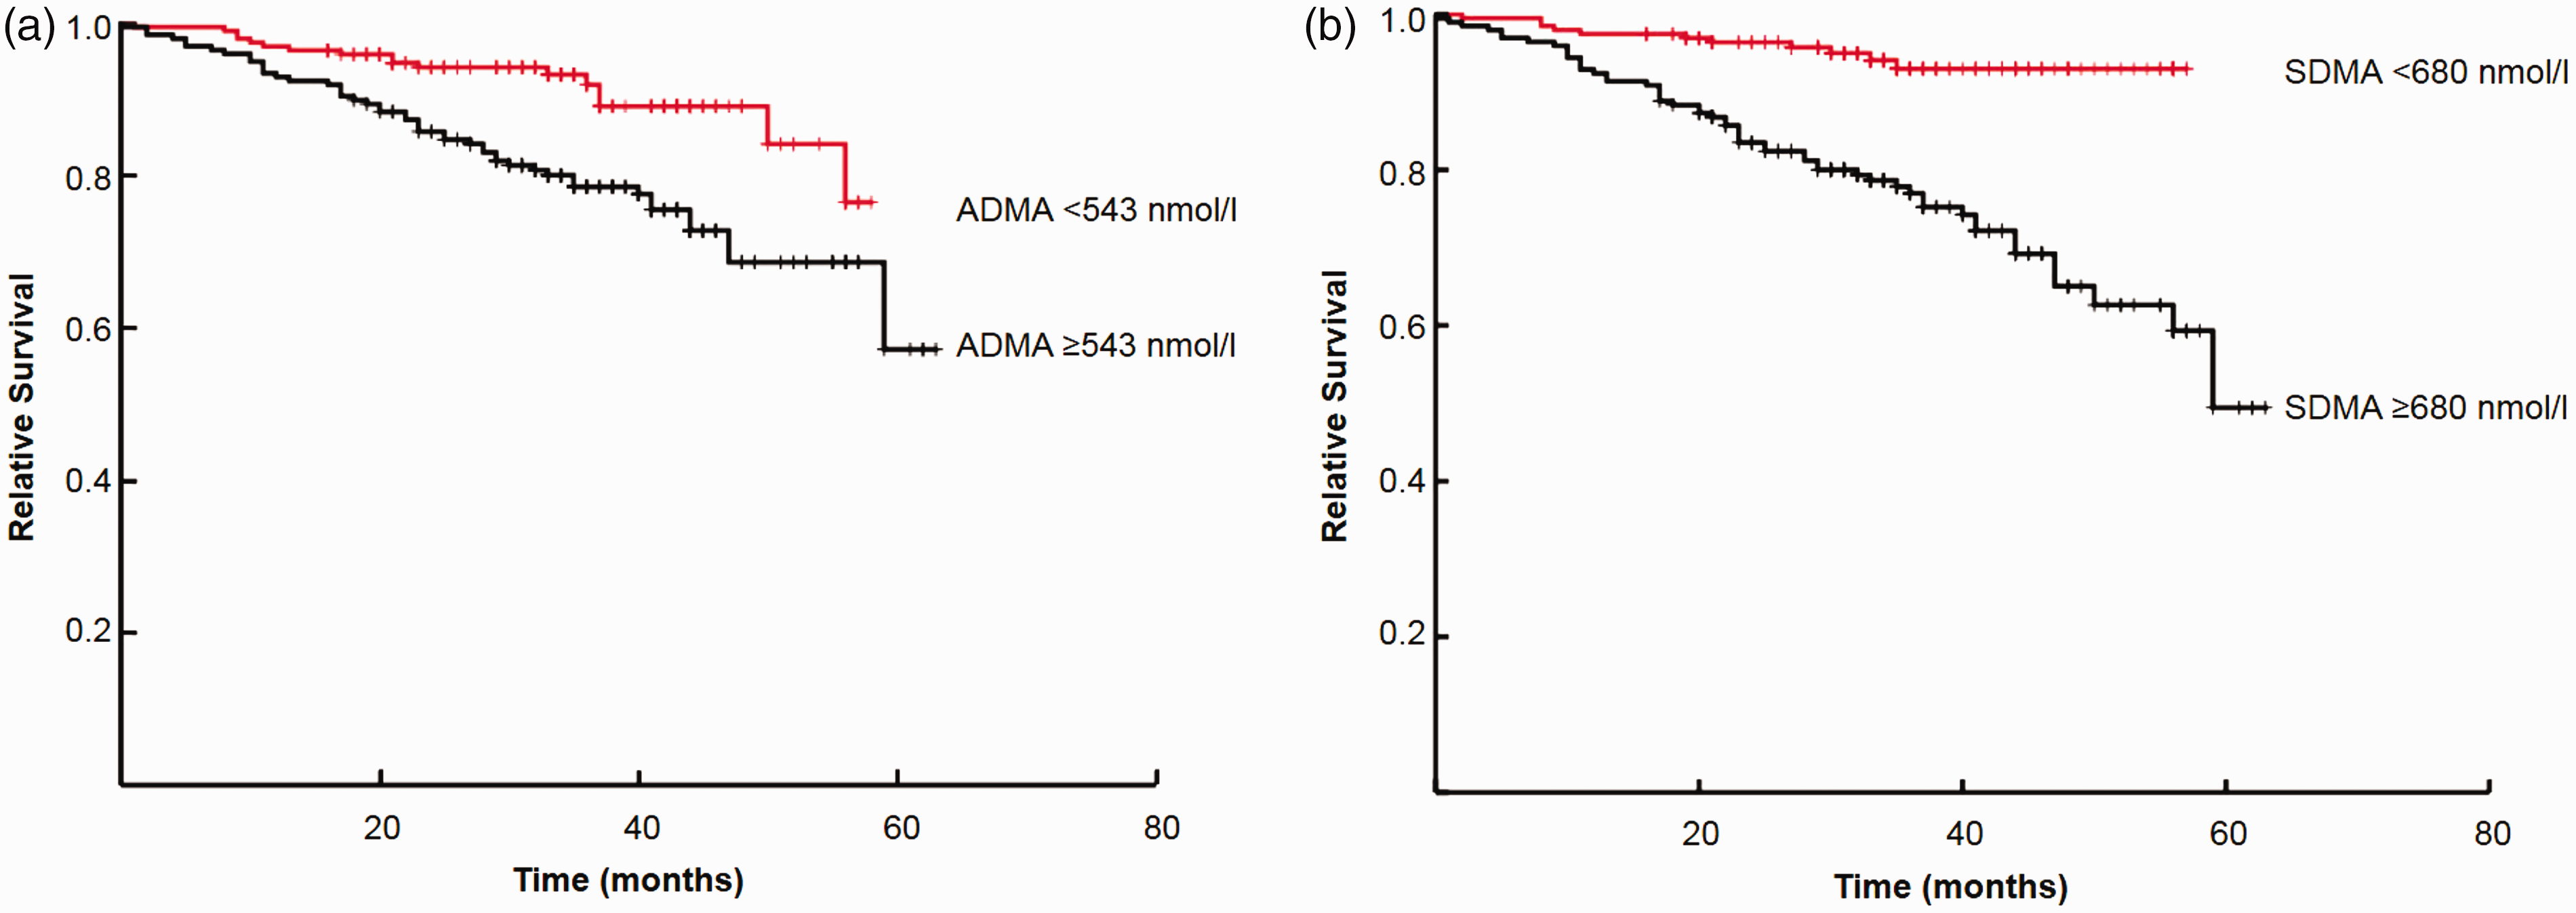
(a) Kaplan-Meier survival curve by median ADMA concentration (543 nmol/L); P = 0.0009. (b) Kaplan-Meier survival curve by median SDMA concentration (680 nmol/L); P < 0.0001.
Cox proportional hazard ratios were calculated to determine the significance of variables as predictors of all-cause death. In unadjusted analyses, ADMA, SDMA, age, GFR, number of medications, haemoglobin, presence of vascular disease and smoking status were significant predictors (Table 4). Manual backward elimination with stepwise elimination of insignificant variables was undertaken in two separate models including ADMA or SDMA. In the final ADMA model, age, GFR, presence of vascular disease and smoking status in addition to plasma ADMA concentration remained significant independent predictors of all-cause death. In the final SDMA model, age and smoking status in addition to plasma SDMA concentration remained significant (Table 4).
Unadjusted and adjusted hazard ratios for death.
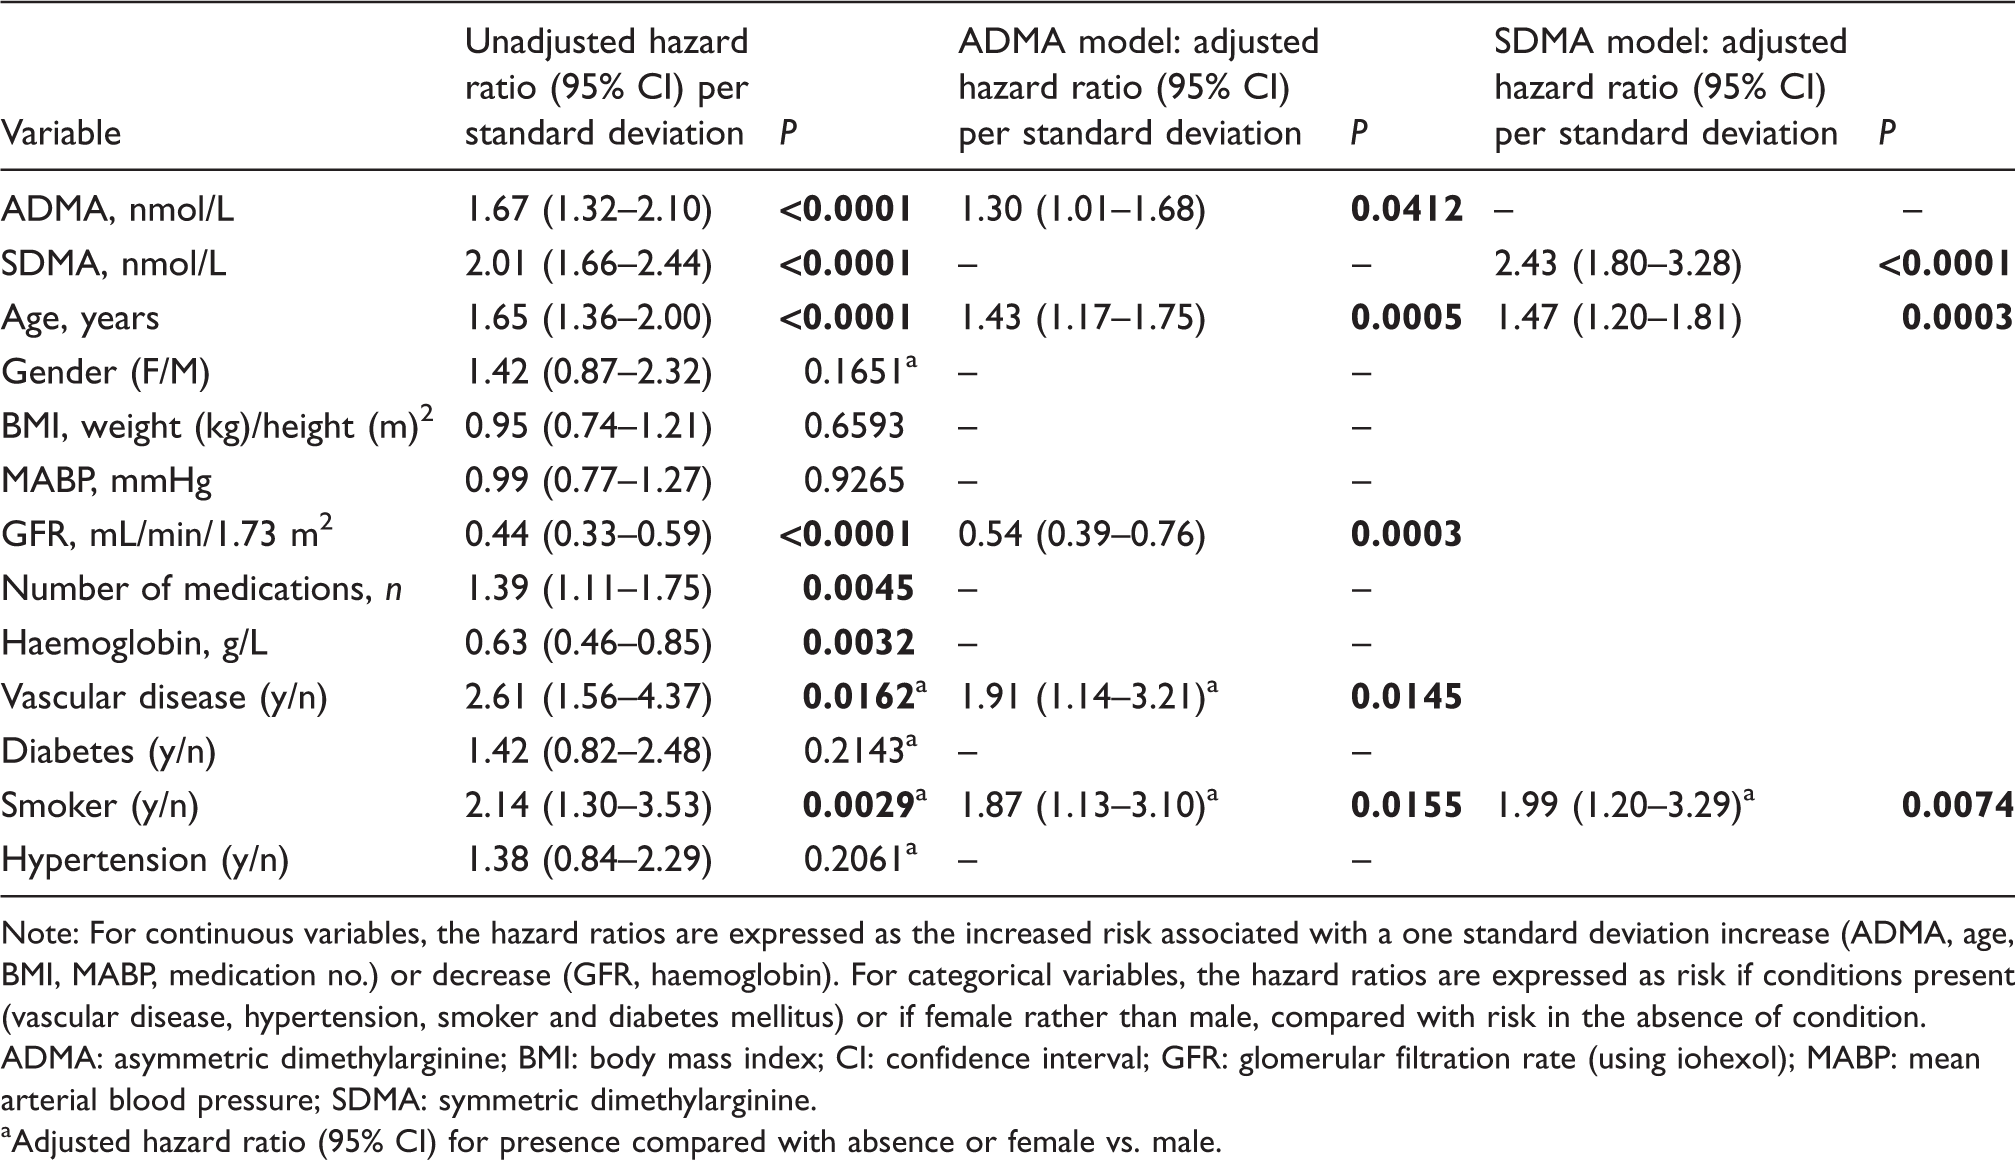
Note: For continuous variables, the hazard ratios are expressed as the increased risk associated with a one standard deviation increase (ADMA, age, BMI, MABP, medication no.) or decrease (GFR, haemoglobin). For categorical variables, the hazard ratios are expressed as risk if conditions present (vascular disease, hypertension, smoker and diabetes mellitus) or if female rather than male, compared with risk in the absence of condition.
ADMA: asymmetric dimethylarginine; BMI: body mass index; CI: confidence interval; GFR: glomerular filtration rate (using iohexol); MABP: mean arterial blood pressure; SDMA: symmetric dimethylarginine.
aAdjusted hazard ratio (95% CI) for presence compared with absence or female vs. male.
Discussion
To our knowledge, this is the first study to evaluate ADMA and SDMA as markers of both GFR and outcome in an exclusively elderly cohort across a range of kidney function in conjunction with a reference GFR measurement. In this study, both ADMA and SDMA were inversely related to GFR. This relationship was stronger for SDMA than ADMA. While ADMA concentration was influenced by GFR only, SDMA concentration was also affected by gender, BMI and haemoglobin concentration. ADMA predicted mortality risk, but this effect only just achieved significance with age, GFR, presence of vascular disease and smoking history all contributing strongly and independently to risk. Conversely, SDMA was a highly significant predictor of death in this cohort, with age and smoking history but not GFR contributing to risk in this model.
The strength of the relationship we observed between GFR and ADMA (rs –0.42) is broadly similar to that observed in other cohorts (r –0.24, 9 r –0.29, 5 r –0.26 20 ), and not of sufficient strength to suggest that ADMA could be a useful marker on its own of GFR. While SDMA is mainly eliminated through the kidneys, 14 ADMA is mainly metabolized through enzymatic degradation in both the liver and kidney involving dimethylarginine dimethylaminohydrolase (DDAH). Consequently, the relationship between ADMA and GFR may be confounded by hepatic function.21–23 In a retrospective analysis of participants in the Modification of Diet in Renal Disease Study, Young et al. also found GFR to be the only variable tested to be significantly associated with ADMA concentration, but their model only explained 5% of the variability in ADMA concentration. 24
There has been extensive study of the relationship between SDMA and GFR. 25 SDMA shows some of the properties of an ideal glomerular filtration marker, including being produced at a constant rate and being almost completely eliminated from the body by renal excretion. 14 The strong relationship we have observed between SDMA and GFR (rs –0.87) is consistent with that from other studies,20,25,26 particularly those that also used a reference GFR technique where observed correlation coefficients ranged from 0.78 to 0.90. 25 The SDMA–GFR relationship was also similar to that we observed between serum creatinine and GFR (rs –0.87) and for the proposed GFR marker cystatin C (rs –0.90, data not shown) in this group. SDMA has also been shown to be an early and sensitive marker of abrupt change in kidney function following kidney donation. 27 In addition to being related to GFR, plasma SDMA concentration is also strongly affected by gender, raising the possibility that GFR prediction from SDMA could be improved by models that also take gender into account.
Given the clear pathophysiological construct linking ADMA and vascular dysfunction, many studies have addressed the relationship between increased circulating ADMA concentration and mortality risk across a variety of populations,22,28–30 including amongst older people. 31 In the setting of kidney disease, an early study in dialysis patients showed that ADMA, but not SDMA, predicted mortality. 32 In several cohorts of CKD patients, and among renal transplant recipients, 33 high ADMA concentration was an independent predictor of all-cause mortality.5,9 Conversely, in the study of Young et al., among patients with moderate to severe CKD, ADMA did not reach significance as an independent predictor of all-cause mortality, although it was a significant predictor of cardiovascular mortality. 24
Fewer studies have explored the relationship between SDMA and mortality risk, but increasing evidence suggests a role. In a German study of individuals receiving coronary angiography following an ischaemic event, SDMA demonstrated a J-shaped relationship with all-cause and cardiovascular mortality, whereas the ADMA-mortality relationship was more linear. 26 SDMA, but not ADMA, was independently associated with survival after stroke, 34 non-ST elevation myocardial infarction 20 and among individuals admitted to an intensive care unit. 35
Part of the association between SDMA and risk of mortality may reflect the strong relationship between GFR itself and risk. Indeed, the strong relationship between SDMA and GFR probably explains why only one of these factors remained significant in our adjusted model. A relationship between SDMA and mortality independent of GFR has also been reported in renal transplant recipients. 36 Recent evidence suggests potential direct pathophysiological links between SDMA and cardiovascular disease through indirect inhibition of nitric oxide synthesis. 15 The proposed mechanism is through competition with L-arginine for transport, thereby limiting the availability of L-arginine to nitric oxide synthase. 37 In turn, reactive oxygen species may further promote intracellular ADMA formation. 38 Dose-dependent inhibition of nitric oxide synthesis by SDMA has been observed in cultured endothelial cells, coupled with increased production of reactive oxygen species. 15 In vitro SDMA, but not ADMA, was shown to cause release of proinflammatory cytokines (interleukin-6, IL-6; tumour necrosis factor-a, TNF-alpha) from monocytes: release of cytokines was linked to activation of nuclear factor-Kappa B. 39 In vivo, plasma SDMA concentration was correlated to IL-6 and TNF-a concentrations among patients with CKD, with much weaker relationships observed for ADMA and cytokine concentrations. 39 SDMA, but not ADMA, concentrations have previously been observed to be independently increased in patients with coronary vascular disease and related to extent of such disease. 15 There is therefore increasing evidence suggesting that SDMA could contribute to endothelial dysfunction and the chronic inflammatory state characteristic of CKD, with attendant increase in cardiovascular risk.
The strengths of this study include the simultaneous measurement of ADMA and SDMA across a well-characterized, large number of subjects covering a spectrum of kidney disease assessed using a reference GFR technique. The study has some limitations. Only single baseline measures of the dimethylarginines were available. Only all-cause mortality data were collected: pathophysiologically one would anticipate the role of dimethylarginines to be more closely linked to cardiovascular mortality. However, although cardiovascular disease is the major cause of mortality among people with CKD, 12 other pathology including malignancy and infection 40 could be contributing to the relationship between mortality and SDMA due to increased SDMA production as a result of increased cell turnover. The study was exclusively white and findings may therefore not hold in other ethnic groups. 41 In common with most studies in this field, plasma concentrations of dimethylarginines were measured. Any effects in vivo are likely to be related to intracellular dimethylarginine concentrations. Plasma concentrations of dimethylarginines may not reflect their intracellular concentration, potentially obscuring their true relationship with mortality. 42
In conclusion, we have shown that among elderly white individuals and across a range of kidney function, SDMA appears to be both a better marker of GFR and a stronger predictor of outcome than ADMA. The prognostic power of SDMA may be related to its more recently described roles in stimulating the pro-inflammatory state. Future studies should further evaluate the role of SDMA as a marker of outcome and assess its potential value as a marker of GFR.
Footnotes
Acknowledgements
We are grateful to the staff of Clinical Biochemistry and The Kent Kidney Care Centre, East Kent Hospitals University NHS Foundation Trust for their co-operation and help. Dr S O’Riordan helped with recruitment to the study and Ms J Irving helped with data analysis. The study received statistical advice from Mr Paul Bassett, Statsconsultancy Ltd, Amersham, Buckinghamshire, UK.
Declaration of conflicting interests
The author(s) declared no potential conflicts of interest with respect to the research, authorship, and/or publication of this article.
Funding
The author(s) disclosed receipt of the following financial support for the research, authorship, and/or publication of this article: This paper presents independent research related to a separate study16 commissioned by the National Institute for Health Research (NIHR) under the Research for Patient Benefit Programme (reference PB-PG-0107–12073). The views expressed are those of the authors and not necessarily those of the NHS, the NIHR or the Department of Health.
Ethical approval
The study had full ethical approval from the East Kent Research Ethics Committee (07/Q1803/37).
Guarantor
EJL.
Contributorship
All authors participated sufficiently in the work to take public responsibility for the content as described in the Journal’s instructions to authors.