
Abstract
Objective
Adropin, a newly identified regulatory protein encoded by Enho gene, is correlated with insulin sensitivity and diabetes. The aim of this study is to determine whether serum and vitreous adropin concentrations are correlated with the presence of diabetic retinopathy.
Methods
A population of 165 patients with type 2 diabetes mellitus (52 without diabetic retinopathy, 69 with non-proliferative diabetic retinopathy and 44 patients with proliferative diabetic retinopathy) was enrolled in this study. The control group enrolled 68 healthy subjects who had underwent vitrectomy for retinal detachment. Serum and vitreous adropin concentrations were examined using enzyme-linked immunosorbent assay method.
Results
Control subjects had significantly higher serum and vitreous adropin concentrations compared with diabetic patients. Serum and vitreous adropin concentrations in proliferative diabetic retinopathy patients were significantly reduced compared with those in non-proliferative diabetic retinopathy patients and type 2 diabetes mellitus patients without diabetic retinopathy. In addition, there were lower serum and vitreous adropin concentrations in non-proliferative diabetic retinopathy patients compared with type 2 diabetes mellitus patients without diabetic retinopathy. Logistic regression analysis revealed that serum and vitreous adropin were associated with a decreased risk of type 2 diabetes mellitus and diabetic retinopathy.
Conclusion
Serum and vitreous adropin concentrations are negatively associated with the presence of diabetic retinopathy.
Introduction
Diabetic retinopathy (DR), a serious complication of diabetes mellitus, is one of the leading causes of decreased vision and blindness in developed countries. 1 It is estimated that DR accounts for approximately 5% of blindness over the world. 2 DR is characterized by gradually progressive alterations in the retinal microvasculature, leading to areas of retinal non-perfusion, increased vasopermeability and pathologic intraocular proliferation of retinal vessels. 3 The pathogenesis of DR still remains unknown. An emerging issue has focused on the important role of inflammation and angiogenesis in DR. 4
Adropin, a newly found regulatory protein, is encoded by Enho gene (energy homeostasis associated) in the brain and liver of mice. 5 Adropin plays an important role in adiposity, insulin resistance, glucose and lipid metabolism. 6 Type 2 diabetes mellitus (T2DM) patients showed significantly lower plasma adropin concentrations than non-diabetic patients. 7 Adropin treatment contributed to improved blood glucose and reduced insulin resistance in streoptozotocin-induced diabetic rats. 8 Lower serum adropin was associated with coronary atherosclerosis in type 2 diabetic and non-diabetic patients. 7 This indicates that adropin is correlated with the macrovascular complication of T2DM. However, no study has focused on the association of serum and vitreous adropin concentrations with the presence of microvascular complication of T2DM.
DR is an important microvascular complication of T2DM. This study aims to determine the association of serum and vitreous adropin with the presence of DR.
Materials and methods
Patients and controls
This study consisted of 165 patients with T2DM. They were all diagnosed with T2DM according to the American Diabetic Association criteria. T2DM patients were then divided into three groups according to the International Clinical Classification of Diabetic Retinopathy 9 : 44 with proliferative diabetic retinopathy (PDR), 69 with non-proliferative diabetic retinopathy (NPDR) and 52 without DR. Subjects were excluded if they had previous vitrectomy, other ocular disorders such as uveitis, glaucoma and corneal neovascularization, photocoagulation and intravitreal haemorrhages during the past three months. The control group enrolled 68 subjects who had underwent vitrectomy for retinal detachment with no systemic disease.
This study was approved by the research ethics committee of Qilu Hospital of Shandong University and was conducted in agreement with the Declaration of Helsinki. Written informed consent was obtained from the patients and healthy volunteers prior to their participation in this study.
Measurements
Serum was obtained from blood samples by centrifugation. Vitrectomy samples (approximately 0.3 mL) were obtained using a standardized vitrectomy technique with manual suction before opening the infusion set. Serum and vitrectomy samples were both stored at −80°C until analysis as long as three months. Repeated freeze–thaw was strictly avoided. Serum and vitreous adropin concentrations were measured using an enzyme-linked immunosorbent assay (Phoenix Pharmaceuticals, Inc., USA) (sensitivity: 0.3 ng/mL; assay range: 0.3–8.2 ng/mL; coefficients of variation [CVs] of intra-assay: 4.5%–6%; CVs of inter-assay: 8.4%–9.4%). In addition, each assay was repeated to confirm the consistency and accuracy of the measurements.
Statistical analysis
Data are displayed as means ±SD or median (interquartile range). Chi-square tests, one-way ANOVA, or Kruskal-Wallis test were used to compare the differences of characteristics between different groups. Logistic regression analysis was used to determine the risk factors for T2DM and DR. All analyses reported significance at the P < 0.05 level.
Results
Baseline clinical characteristics of patients and controls
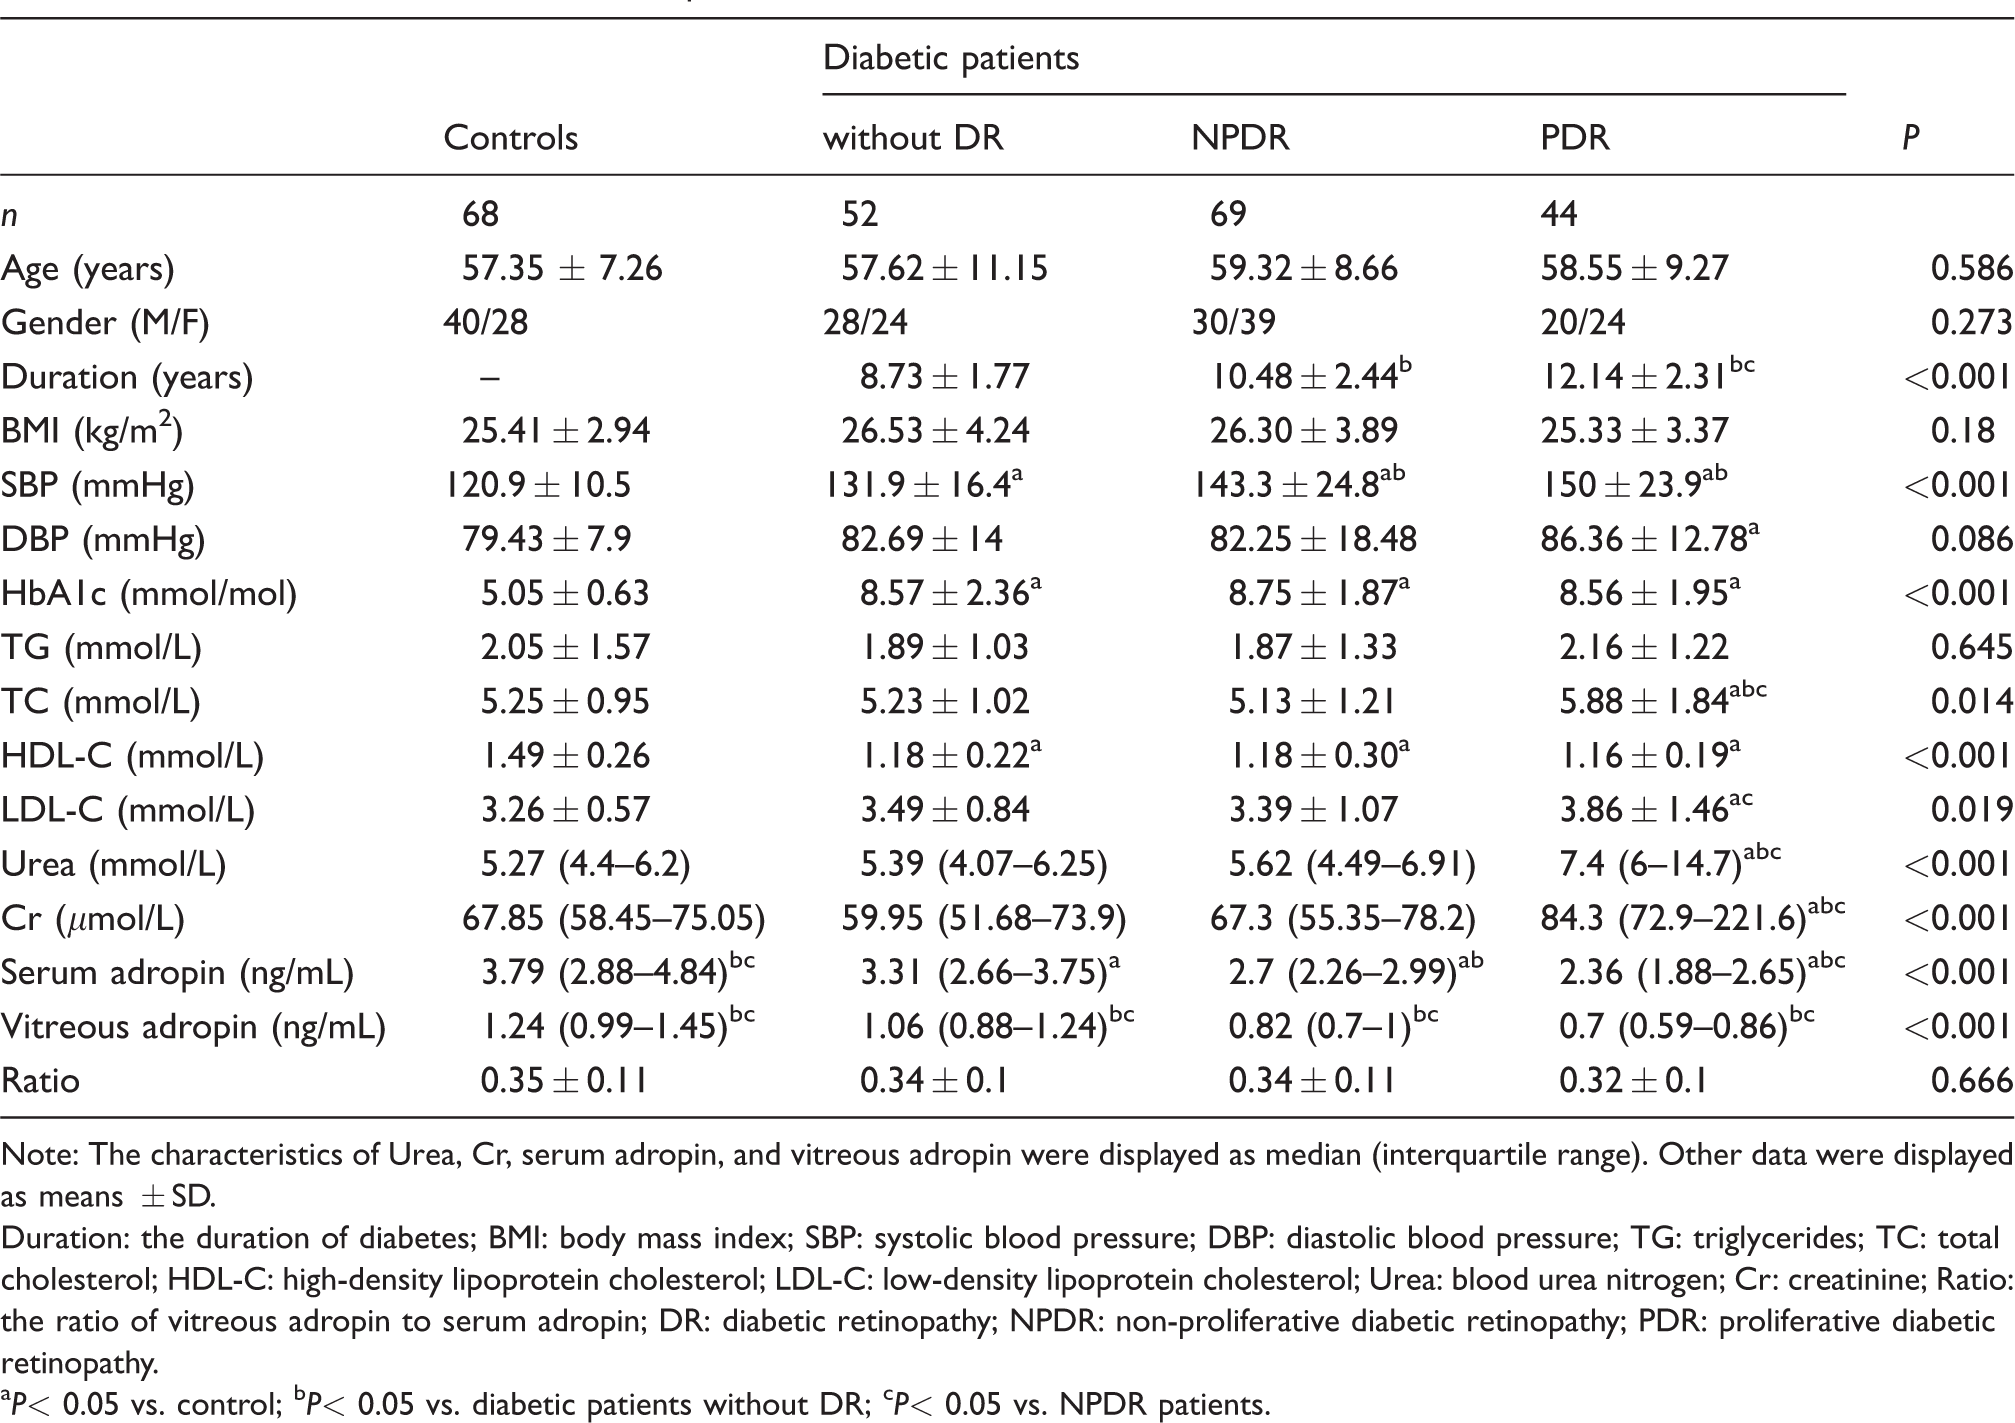
The clinical characteristics of the four groups are presented in Table 1. T2DM patients showed elevated systolic blood pressure (SBP), HbA1c and decreased high-density lipoprotein cholesterol (HDL-C) compared with the controls. Furthermore, PDR patients exhibited higher total cholesterol, Urea and creatinine (Cr) than the other three groups. PDR groups also showed longer duration of diabetes compared with NPDR patients and T2DM patients without DR.
Various characteristics of diabetic patients and controls.
Note: The characteristics of Urea, Cr, serum adropin, and vitreous adropin were displayed as median (interquartile range). Other data were displayed as means ± SD.
Duration: the duration of diabetes; BMI: body mass index; SBP: systolic blood pressure; DBP: diastolic blood pressure; TG: triglycerides; TC: total cholesterol; HDL-C: high-density lipoprotein cholesterol; LDL-C: low-density lipoprotein cholesterol; Urea: blood urea nitrogen; Cr: creatinine; Ratio: the ratio of vitreous adropin to serum adropin; DR: diabetic retinopathy; NPDR: non-proliferative diabetic retinopathy; PDR: proliferative diabetic retinopathy.
P< 0.05 vs. control; bP< 0.05 vs. diabetic patients without DR; cP< 0.05 vs. NPDR patients.
Serum and vitreous adropin concentrations
As shown in Table 1, T2DM patients showed decreased serum and vitreous adropin concentrations compared with the controls. Significantly lower serum and vitreous adropin concentrations were found in PDR patients compared with NPDR patients and T2DM patients without DR. Serum and vitreous adropin concentrations were found to be significantly lower in NPDR patients compared with those in T2DM patients without DR.
Logistic regression analysis for determining the risk factors of developing T2DM.
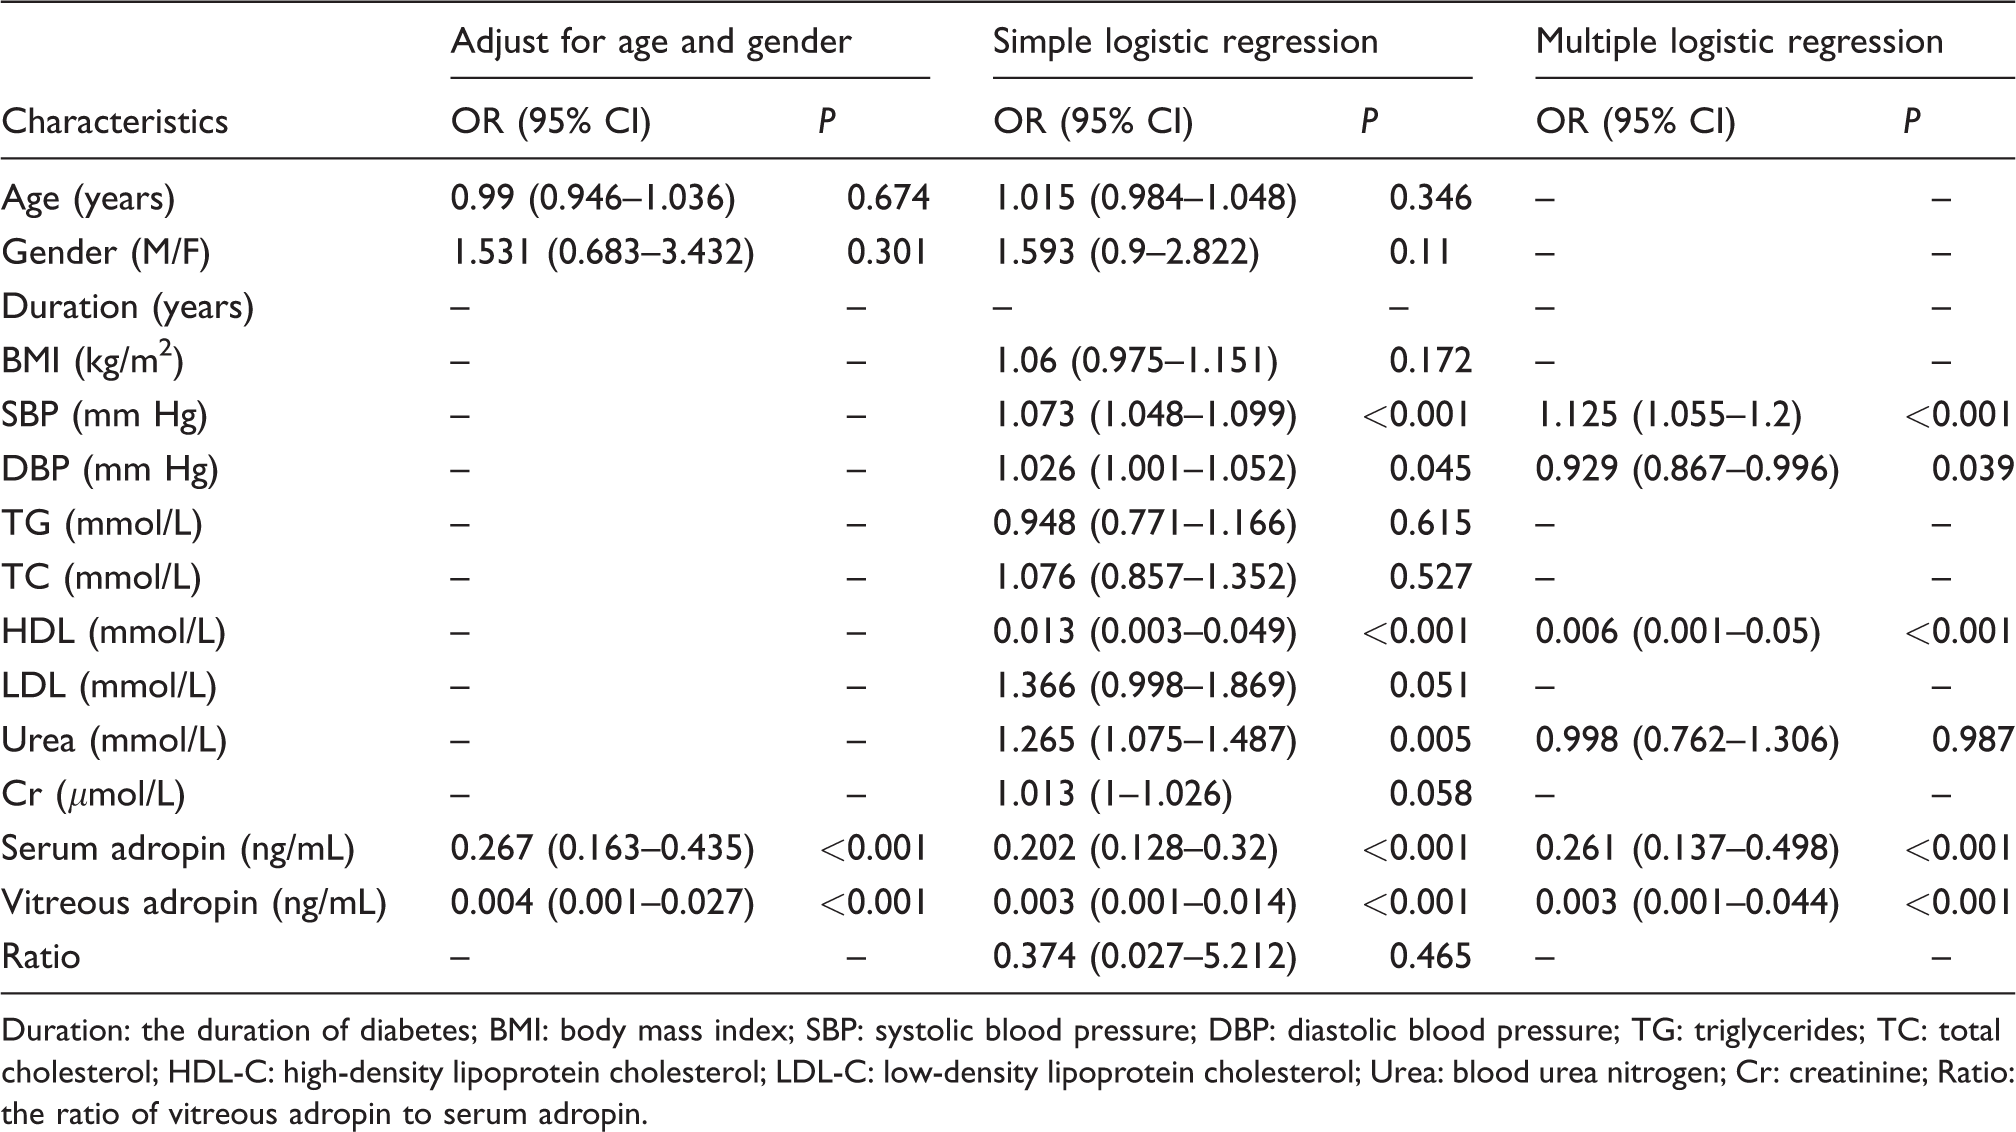
Duration: the duration of diabetes; BMI: body mass index; SBP: systolic blood pressure; DBP: diastolic blood pressure; TG: triglycerides; TC: total cholesterol; HDL-C: high-density lipoprotein cholesterol; LDL-C: low-density lipoprotein cholesterol; Urea: blood urea nitrogen; Cr: creatinine; Ratio: the ratio of vitreous adropin to serum adropin.
The association of serum and vitreous adropin concentrations with T2DM
T2DM patients showed decreased serum and vitreous adropin concentrations compared with healthy controls (2.7 [2.31–3.14] ng/mL vs. 3.79 [2.88–4.84] ng/mL, P < 0.001 and 0.87 [0.71–1.04] ng/mL vs. 1.24 [0.99–1.45] ng/mL, P < 0.001, respectively). As shown in Table 2, logistic regression analysis showed that serum and vitreous adropin were negatively correlated with T2DM (OR 0.202, 95% CI 0.128 to 0.32, P < 0.001 and OR 0.003, 95% CI 0.001 to 0.014, P < 0.001, respectively). After adjusting for age and gender, serum and vitreous adropin were associated with a decreased risk of T2DM (OR 0.267, 95% CI 0.163 to 0.435, P < 0.001 and OR 0.004, 95% CI 0.001 to 0.027, P < 0.001, respectively). Simple logistic regression analysis showed that SBP, diastolic blood pressure (DBP), HDL-C, Urea, serum and vitreous adropin showed a trend (P < 0.05) toward an association with T2DM. All of these variables were then entered into a backward stepwise multivariate logistic regression model. Multivariate logistic regression analysis revealed that serum and vitreous adropin remained a significant predictor of T2DM (OR 0.261, 95% CI 0.137 to 0.498, P < 0.001 and OR 0.003, 95% CI 0.001 to 0.044, P < 0.001, respectively).
The association of serum and vitreous adropin concentrations with DR
Decreased serum and vitreous adropin concentrations were found in T2DM patients with DR showed compared with those without DR (2.58 [2.08–2.93] ng/mL vs. 3.31 [2.66–3.75] ng/mL, P < 0.001 and 0.77 [0.66–0.95] ng/mL vs. 1.06 [0.88–1.24] ng/mL, P < 0.001). As shown in Table 3, logistic regression analysis showed that serum and vitreous adropin were correlated with a decreased risk of the presence of DR (OR 0.087, 95% CI 0.038 to 0.199, P < 0.001 and OR 0.001, 95% CI 0.000 to 0.013, P < 0.001, respectively). After adjusting for age and gender, serum and vitreous adropin were associated with a decreased risk of the presence of DR (OR 0.053, 95% CI 0.016 to 0.176, P < 0.001 and OR 0.001, 95% CI 0.000 to 0.01, P < 0.001, respectively). Simple logistic regression analysis showed that the duration of diabetes, SBP, Urea, Cr, serum and vitreous adropin showed a trend (P < 0.05) toward an association with T2DM. Multivariate logistic regression revealed that serum and vitreous adropin remained correlated with the presence of DR (OR 0.046, 95% CI 0.011 to 0.197, P < 0.001 and OR 0.001, 95% CI 0.000 to 0.008, P < 0.001, respectively).
Logistic regression analysis for determining the risk factors of developing DR.
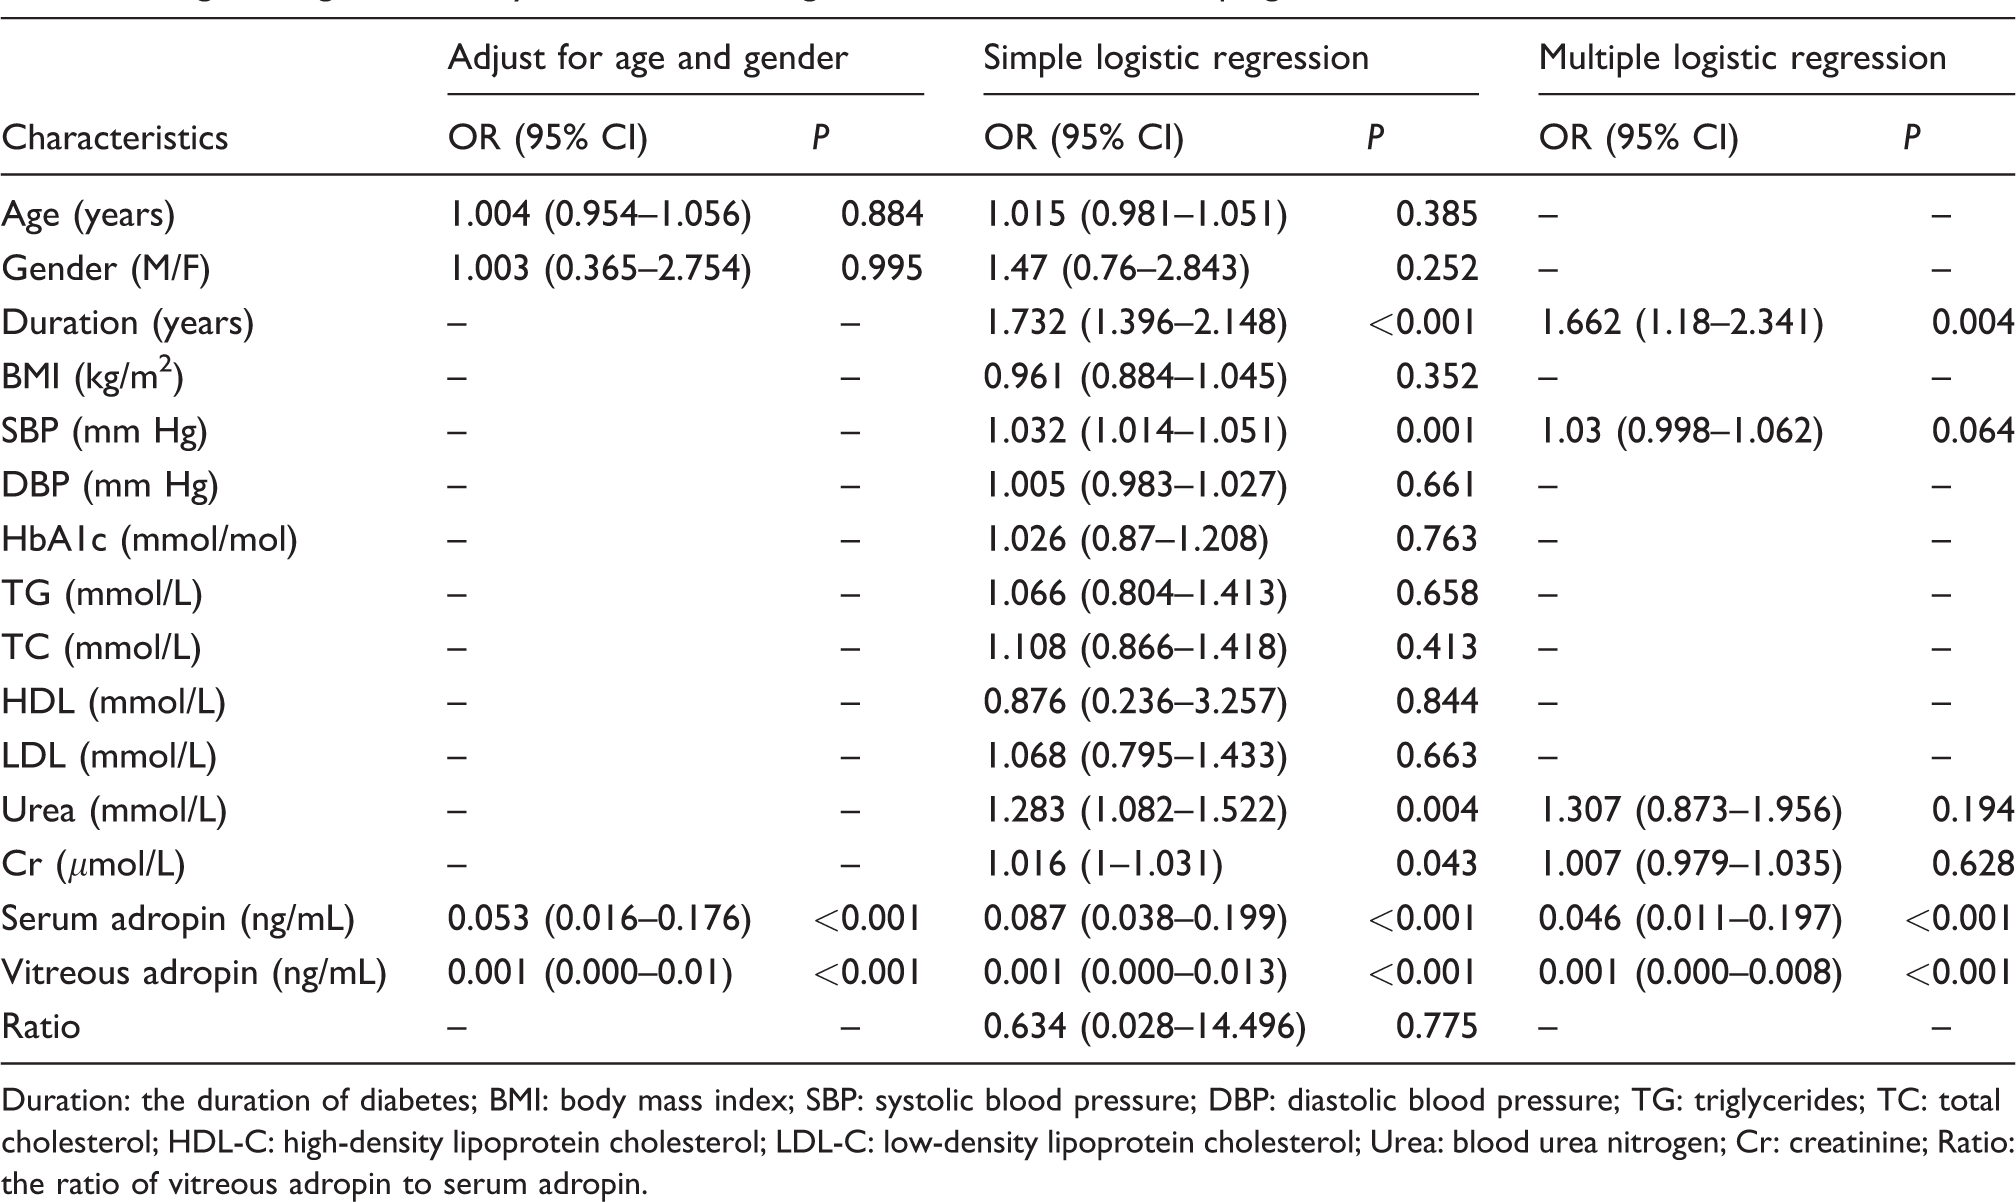
Duration: the duration of diabetes; BMI: body mass index; SBP: systolic blood pressure; DBP: diastolic blood pressure; TG: triglycerides; TC: total cholesterol; HDL-C: high-density lipoprotein cholesterol; LDL-C: low-density lipoprotein cholesterol; Urea: blood urea nitrogen; Cr: creatinine; Ratio: the ratio of vitreous adropin to serum adropin.
The gender differences of adropin concentrations
There were no differences in serum and vitreous adropin concentrations between male and female patients in T2DM patients (2.81 [2.33–3.16] ng/mL vs. 2.65 [2.22–3.12] ng/mL, P = 0.236 and 0.87 [0.71–1.04] ng/mL vs. 0.87 [0.7–1.04] ng/mL, P = 0.821, respectively). In addition, no significant serum and vitreous adropin concentrations were found between male and female subjects in the control group (3.81 [2.88–4.58] ng/mL vs. 3.76 [2.87–5.07] ng/mL, P = 0.571 and 1.27 [1.05–1.49] ng/mL vs. 1.23 [0.96–1.43] ng/mL, P = 0.313, respectively).
Discussion
Adropin, a newly discovered peptide, is involved in glucose metabolism and diabetes. Adropin treatment contributed to reduced blood glucose and improved insulin resistance in a rat model of T2DM. 8 Adropin-knockout mice showed increased adiposity, dyslipidaemia and aggravated insulin resistance compared with the controls. 6 Adropin treatment enhances glucose tolerance, ameliorate insulin resistance and promote preferential use of carbohydrate over fat in diet-induced obese mice. 10 In addition, serum adropin is found to be negatively correlated with diabetes. Maternal and cord adropin concentrations in the gestational diabetes mellitus (GDM) group were significantly lower than those of the control women. 11 GDM patients showed significantly decreased serum adropin concentrations compared with healthy controls. 12 Lower adropin concentrations were found in T2DM patients compared with non-diabetic patients. 7 Our study demonstrated that serum and vitreous adropin concentrations were correlated with a decreased risk of T2DM. This indicates that adropin may be involved in diabetes pathogenesis.
Adropin is found to be correlated with macrovascular disease. Adropin was found to protect endothelial function by the upregulation of endothelial nitric oxide synthase expression. 13 Serum adropin was significantly changed in patients with stable coronary artery disease, 14 acute myocardial infarction 15 and heart failure. 16 In addition, adropin was correlated with macrovascular complication of diabetes. Plasma adropin concentrations were significantly decreased in T2DM patients with endothelial dysfunction compared with those with non-endothelial dysfunction. 17 Lower serum adropin was associated with coronary atherosclerosis in T2DM patients. 7
However, no investigation was performed to determine the association of serum adropin concentrations with microvascular complication of T2DM. Then, we performed the current study and found that serum and vitreous adropin concentrations were inversely correlated with the presence of DR. Furthermore, logistic regression analysis demonstrated that serum and vitreous adropin concentrations were inversely correlated with the risk of DR. This indicates that adropin could be used as a biomarker for assessing the risk of the presence of DR.
The exact role of adropin involved in DR mechanism is unclear. Inflammation plays an important role in the development of DR. Adropin significantly decreased the mRNA expression concentrations of tumor necrosis factor-alpha (TNF-α) and interleukin 6 in pancreas tissue of diabetic rats. 8 In addition, circulating adropin concentration was found to be negatively correlated with TNF-α concentration in women with polycystic ovary syndrome. 18 Therefore, it is hypothesized that adropin may play a protective role against DR development through anti-inflammatory effects.
Our study determined the gender differences of adropin concentrations. We found that there were no differences in serum and vitreous adropin concentrations between male and female subjects. 19 However, Butler et al. reported that adropin concentrations were higher in males than females. The explanation for these conflicting data is unclear but may be attributable to differences in different disease, racial differences or assays applied.
We also investigated the ratio of vitreous to serum adropin concentrations. The ratio is similar between the four studies groups. And no significant difference in the ratio of vitreous to serum adropin concentrations was found between the four studies groups. Logistic regression analysis revealed that the ratio was not associated with a decreased risk of T2DM or DR. This indicates that the ratio of vitreous to serum adropin concentrations is not a risk factor for T2DM or DR.
This study has several potential limitations. First, the sample size was not large enough to reach definitive conclusions. Further studies with great numbers are warranted. Second, our study is of cross-sectional design, and the causative relation must be confirmed by future longitudinal studies.
In conclusion, serum and vitreous adropin concentrations are negatively associated with the presence of DR.
Footnotes
Declaration of conflicting interests
The author(s) declared no potential conflicts of interest with respect to the research, authorship, and/or publication of this article.
Funding
The author(s) disclosed receipt of the following financial support for the research, authorship, and/or publication of this article: This study was funded by the Doctoral Program of Natural Science Foundation of Shandong Province (ZR2016HB34).
Ethical approval
The ethics committee of Qilu Hospital of Shandong University (Qingdao) (2017QLHSD0102) approved the study.
Guarantor
FL.
Contributorship
HD and FL researched literature and conceived the study. SL, JS, YL and DL were involved in protocol development, gaining ethical approval, patient recruitment and data analysis. SL and JS wrote the first draft of the article. WH helped to answer the reviewer's question and write the revised article. All authors reviewed and edited the article and approved the final version of the article.