
Abstract
Background
Classical galactosaemia (OMIM #230400) is a rare disorder of carbohydrate metabolism caused by deficiency of the galactose-1-phosphate uridyltransferase enzyme. The pathophysiology of the long-term complications, mainly cognitive, neurological and female fertility problems, remains poorly understood. Current clinical methods of biochemical monitoring lack precision and individualization with an identified need for improved biomarkers for this condition.
Methods
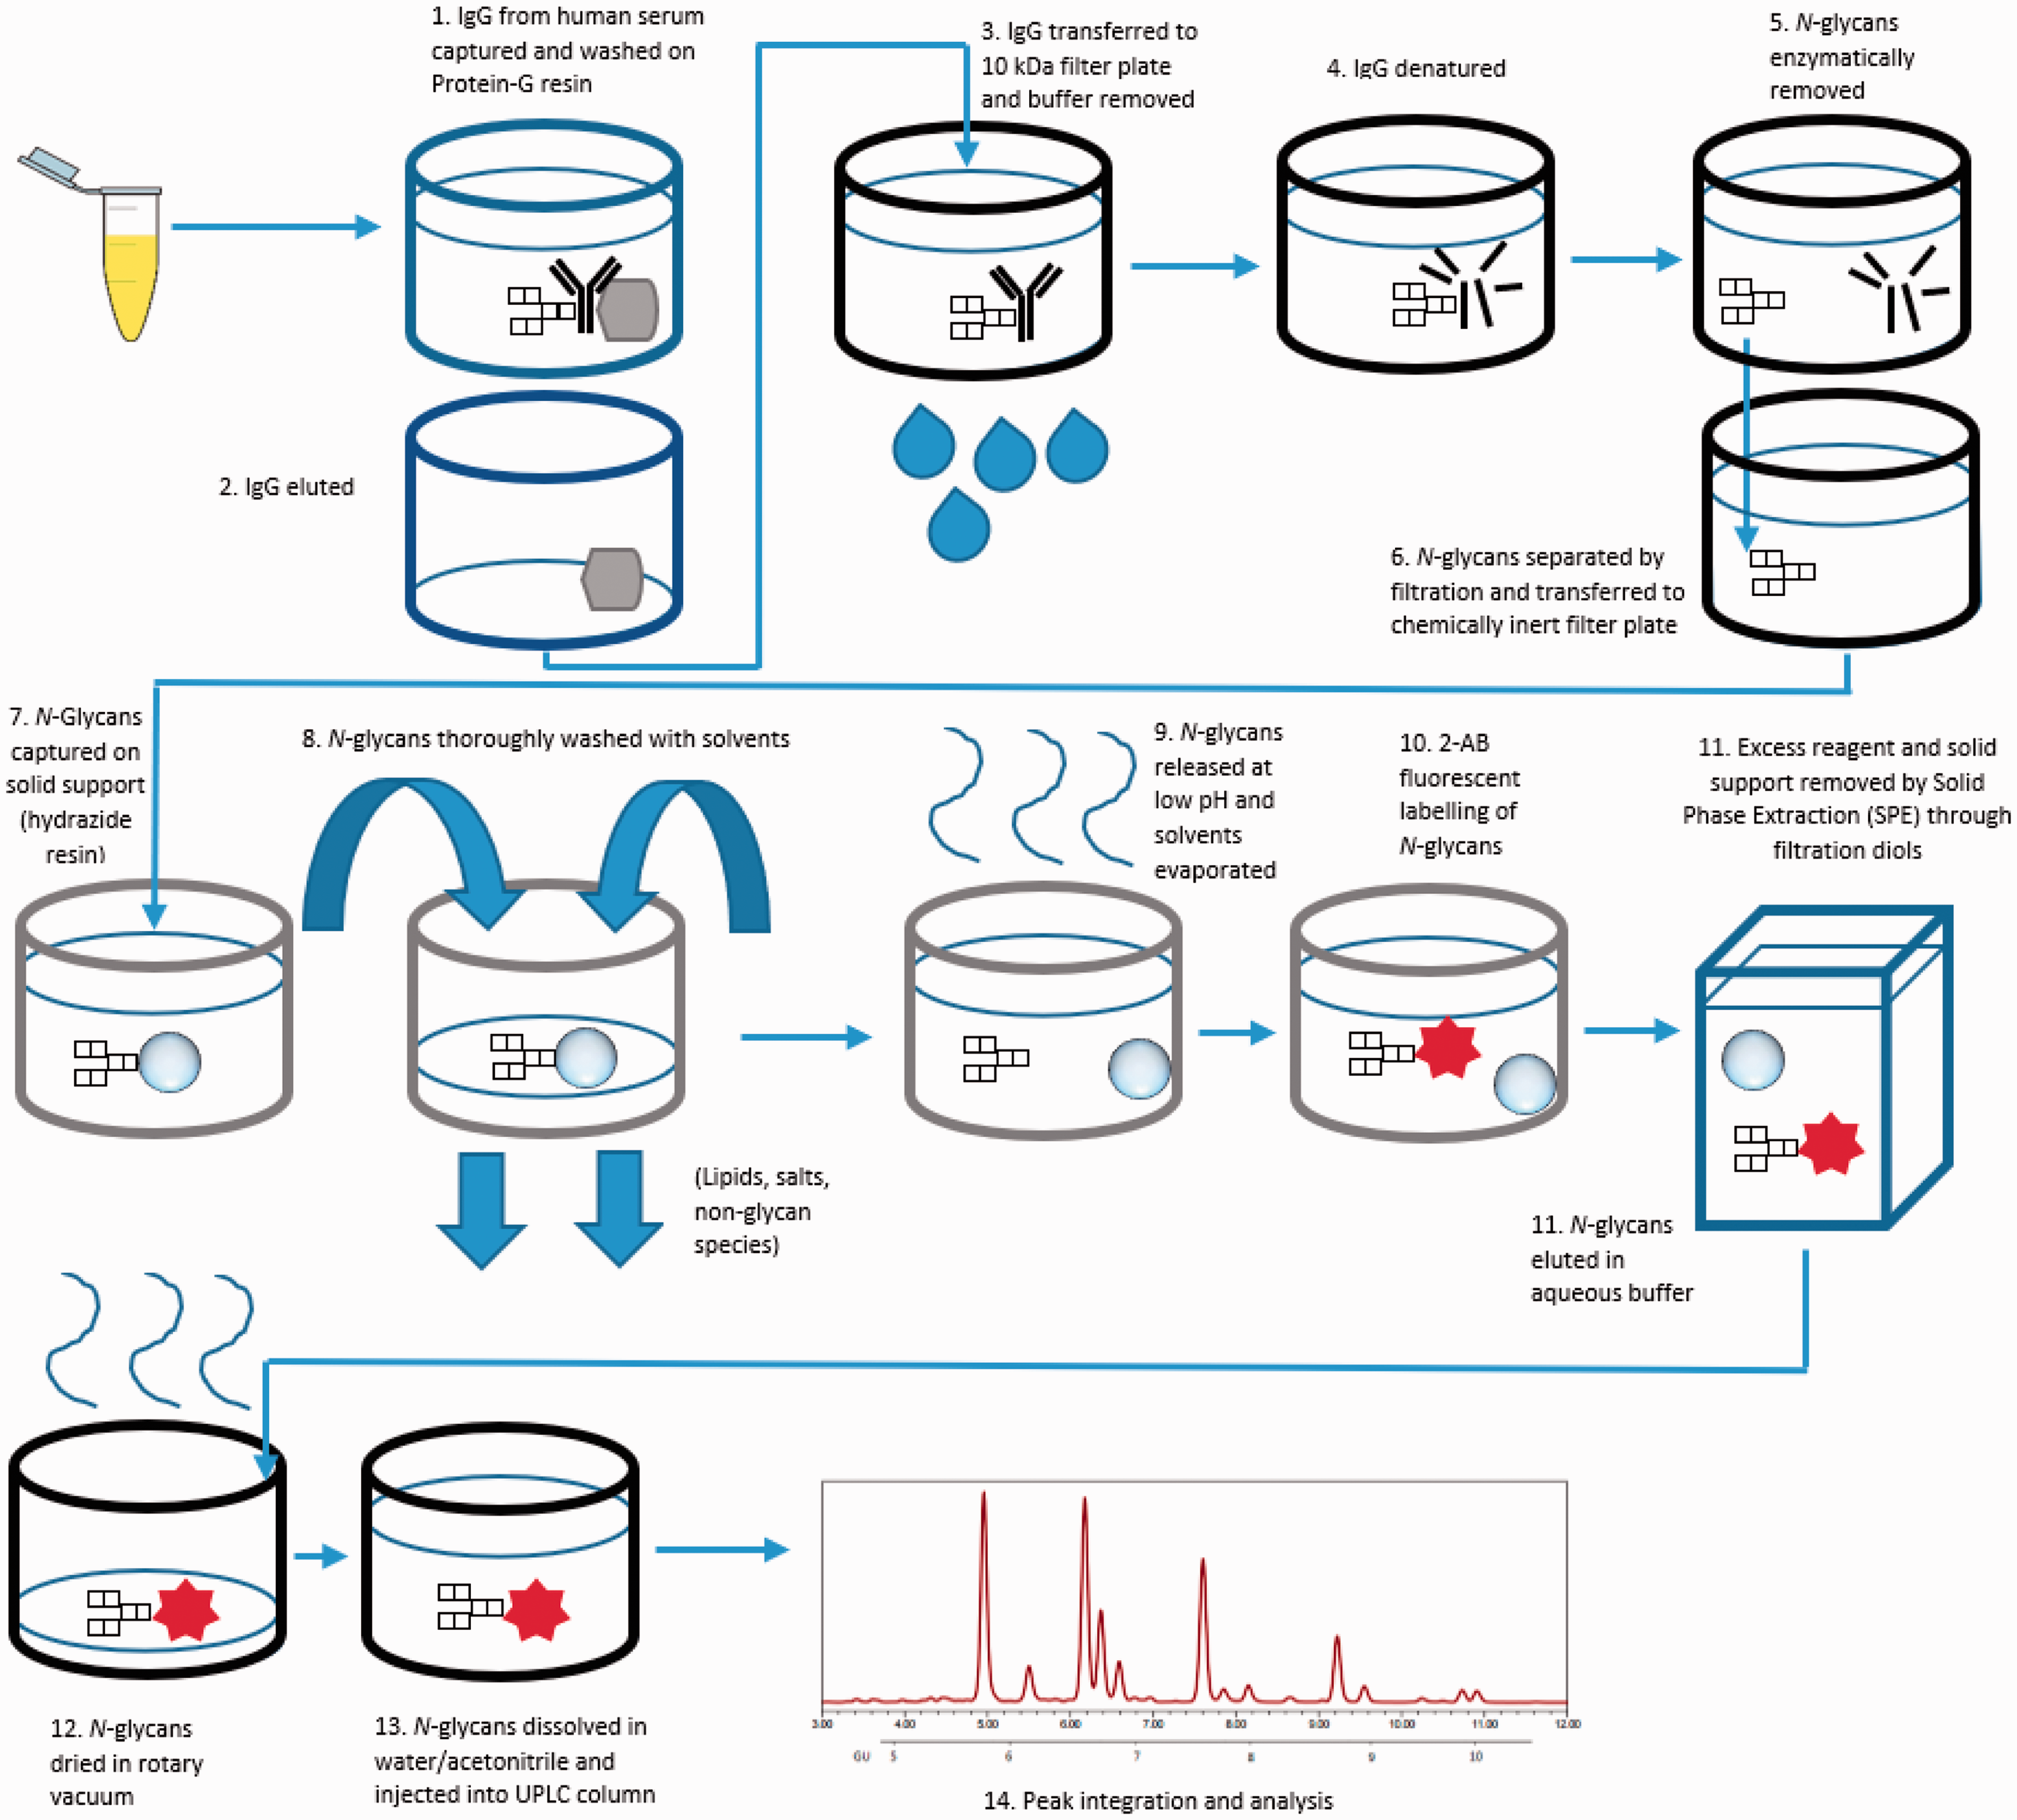
We report the development and detailed validation of an automated ultraperformance liquid chromatography N-glycan analytical method of high peak resolution applied to galactose incorporation into human serum IgG. Samples are prepared on 96-well plates and the workflow features rapid glycoprotein denaturation, enzymatic glycan release, glycan purification on solid-supported hydrazide, fluorescent labelling and post-labelling clean-up with solid-phase extraction.
Results
This method is shown to be accurate and precise with repeatability (cumulative coefficients of variation) of 2.0 and 8.5%, respectively, for G0/G1 and G0/G2 ratios. Both serum and processed N-glycan samples were found to be stable at room temperature and in freeze–thaw experiments.
Conclusions
This high-throughput method of IgG galactose incorporation is robust, affordable and simple. This method is validated with the potential to apply as a biomarker for treatment outcomes for galactosaemia.
Introduction
Classical galactosaemia (OMIM 230400) is a rare disorder of carbohydrate metabolism caused by galactose-1-phosphate uridyltransferase (GALT) deficiency (EC 2.7.7.12). 1 Deficiency of GALT results in toxic build-up of intermediates of the galactose metabolism (Leroir) pathway, such as galactose-1-phosphate (Gal-1-P) and galactitol. 1 The only available treatment option is a long-term galactose-restricted diet. Dietary intervention can be lifesaving in the neonate; however, long-term complications persist in treated adult patients to include significant cognitive impairment, decreased bone mineral density and infertility in females. These complications are regardless of genotype or age at the onset of treatment.1–5
Recently, a European Consortium (GalNet) developed new consensus clinical guidelines for the management of classical galactosaemia. 6 It was identified in the development of these guidelines that there is a great need for improved biomarkers to assess the effective treatment of galactosaemia and for follow-up monitoring. The current tests for measuring RBC Gal-1-P and urinary galactitol concentrations, apart from predicting gross deviations from diet and monitoring initial decreases of RBC Gal-1-P in the neonate, do not reveal milder deviations or correlate with clinical outcome.7–11 High intraindividual variability of urinary galactitol and RBC Gal-1-P concentrations limits their reliability as a monitoring test. 12
The presence of profound N-glycan assembly defects in the intoxicated galactosaemia neonate has been well characterized using the study of transferrin.13–15 Our group has identified similar N-glycan assembly defects in neonates using serum immunoglobulin G (IgG) and has identified ongoing significant N-glycan-processing defects in treated young children and adults with galactosaemia.11,16–18 The accumulation of toxic galactose intermediates coupled with deficiency of pathway product is proposed to contribute to the development of these complications proposed to be a result of competitive inhibition of glycosyltransferases 19 and a shortage of end-product UDP-hexose sugars. 20 These abnormalities lead to disruption of glycosylation in the post-translational modification of protein and lipids.21–23
Human serum IgG is the most abundant circulating N-glycan glycoprotein. 24 The use of glycan profiling is now increasingly used as a prognostic and diagnostic biomarker in a number of diseases, including cancer, diabetes and rheumatoid arthritis.25–27
The development and analytical validation steps of an automated, high-throughput IgG sample preparation platform with hydrophilic interaction ultraperformance liquid chromatography (HILIC-UPLC) detection has been well developed by our research group and applied to the study of cancer, diabetes and rheumatoid arthritis.28–30 In our studies in galactosaemia, we have developed a method to study the incorporation of galactose residues into the N-glycome of patients with galactosaemia.
The heterogeneous total glycan pool incorporated into the IgG molecule can be classified into three sets (G0, G1 and G2), depending on the number of galactose residues in the outer arms of the biantennary glycans. In our earlier studies, we documented an increase in non-galactosylated (G0) and monogalactosylated (G1) N-glycan structures with decreased digalactosylated structures (G2) in diet-restricted galactosaemia patients (children and adults), which indicates continued N-glycan-processing defects despite dietary galactose restriction in these patients.11,17,18,31,32 Furthermore, we noted improvement in glycosylation with moderate galactose diet liberalization in a subset of adults and children.11,33
We previously reported an improved automated robotic HILIC-UPLC N-glycan analysis applied to the measurement of IgG N-glycan galactose incorporation ratios (G0/G1 and G0/G2 incorporation ratios) and identified statistically significant differences between 40 classical galactosaemia adults and 81 matched healthy controls.31,34
This paper now outlines the further development and analytical validation steps of this automated, high-throughput IgG sample preparation platform with HILIC-UPLC detection for the measurement of IgG N-glycan galactose incorporation, which we propose may now be applicable to clinical monitoring of galactosaemia.
Materials and methods
Reagents
The reagents and buffers used in this method are as follows.
Binding buffer: 0.1 mol/L sodium phosphate buffer (PBS), 0.15 mol/L NaCl, pH 7.4. Washing buffer: binding buffer containing 1% triton-X, pH 7.4. Elution buffer: 0.2 mol/L Glycine–HCl, pH 2.5. Regeneration buffer: Elution buffer containing 1% triton-X. Neutralization buffer: 1 mol/L tris-HCL buffer pH 9.0. Denaturation buffer: 100 mmol/L ammonium bicarbonate, 50 mmol/L dithiothreitol, 0.1% sodium dodecyl sulphate. Iodacetamide solution: 100 mmol/L IAA. PNGase solution: PNGase (Prozyme glyco N-glycanase) in 1 mol/L ammonium bicarbonate, pH 8.0. 2-AB Labelling mix: 350 mmol/L anthranilamide, 1 M sodium cyanoborohydride in acetic acid/dimethyl sulfoxide (30:70 v/v). Guanidine: 2 mol/L guanidine hydrochloride. Triethylamine (TEA): 2% TEA in methanol (MeOH). 2% Acetic acid solution: 2% acetic acid in acetonitrile (MeCN). Ammonium formate: 50 mmol/L in water. Reagent grade MeOH and MeCN and ultrapure water type 1 (18.2 MΩ.cm at 25°C).
Quality control samples and calibrating materials
The following samples were used for experimentation:
Normal human serum (NHS, Merck Millipore, Temcula, CA), a filtered human serum pool collected from the clot of normal healthy humans, was used as the analyte-containing matrix across all experiments and general quality control across the study. For the purpose of this project, it was named ‘control sample’.
2-AB labelled Mannose-3 (Man3-2AB) glycan (Carbosynth Ltd, Berkshire, UK) was used as an internal standard (IS) for the UPLC linearity experiment.
2-AB labelled dextran (Waters, Massachusetts, USA) was used as an external standard to identify peaks using glucose units (GUs).
Patient and control samples
The patient samples were obtained from a cohort of five classical galactosaemia Irish adults (three males, two females), all homozygous for the c.563A > G (p.Q188R) mutation. These patient samples were used for the repeatability, stability and biological replicate studies. Ethical approval for this study was obtained from the Ethics Committee of the Mater Misericordiae University Hospital, Dublin, Ireland. The samples were non-fasting, taken during normal clinical visits. The control samples were obtained from a pool of healthy adult volunteers.
Sample preparation and UPLC analysis
Processing of human serum IgG for N-glycan analysis.
Apart from centrifugation steps, the following was carried out on a Starlet Microlab robotic liquid handling platform (Hamilton, Bonaduz, Switzerland) equipped with eight pipetting channels, a heated orbital shaker and vacuum manifold. Protein G plate wells (Thermo Scientific, Massachusetts, USA) were prewashed with 500 μL of binding buffer. The buffer was removed by vacuum and 50 μL of serum samples were diluted in 50 μL of binding buffer (1:1 ratio), added to the protein G plate and incubated at room temperature (RT) for 30 min at 700 r/min on the orbital shaker. The buffer was removed and the IgG washed five times with 475 μL of washing buffer. The wash sequence was repeated with five washes of binding buffer. A 2 mL collection block (CB) containing 50 μL of neutralization buffer was then inserted into the vacuum manifold. Elution buffer (200 μL) was added to the protein G wells and incubated at RT for 2 min without agitation. The IgG-rich flow-through was captured in the CB under vacuum. An additional 200 μL of elution buffer was added to the resins and the cycle repeated. The CB was briefly centrifuged to remove bubbles and the filtrate was transferred to an Acroprep Advance 10 kDa filter plate (AAFP) (Pall, New York, USA). The elution buffer was removed from the AAFP by centrifugation at 3700 × g for 15 min at RT. The AAFP was then spun at 3700 × g for 30 min leaving IgG as the retentate. Denaturation buffer (40 μL) was added to each well and the AAFP was incubated at 70°C for 20 min at 700 r/min under an antievaporation lid. After cooling, 10 μL of iodoacetamide solution was immediately added to the wells and the AAFP incubated at RT for 30 min at 700 r/min. The solvents were removed by centrifugation at 3700 × g for 10 min. Water (50 μL) and peptide: N-glycosidase F (10 μL) (PNGase, New England Biolabs, Massachusetts, USA) were added and the AAFP was incubated at 37°C for 2 h at 700 r/min. In the meantime, resins may be regenerated with six washes of regeneration buffer, five washes of elution buffer and four washes of binding buffer with intermittent agitations of 1 min at 700 r/min. The AAFP was centrifuged at 3700 × g for 15 min and released N-glycans were collected in a Greiner plate (Greiner Bio-One, Kremsmünster, Austria). An additional 20 μL of water was added to the AAFP with 5 min incubation at RT and the flow through centrifuged into the same Greiner plate at 3700 × g for 20 min.
N-glycan clean up and labelling
Wells of a Solvinert™ chemically inert filter plate (Millipore, Massachusetts, USA) were washed with 100 μL of MeOH and vacuumed. A solution of Ultralink hydrazide resin beads in water (Thermo Scientific, Massachusetts, USA) was agitated at RT for 5 min at 400 r/min. Agitating solution (40 μL) was transferred to each well and the solvent was removed under vacuum. The beads were washed with 200 μL of MeOH, 200 μL of water and 200 μL of 95% MeCN. The Solvinert™ membranes were sealed by evaporating solvent at 80°C for 8 min. The plate was then blotted on filter paper and the plate cooled for 1 min. One hundred and eighty microlitres of 2% acetic acid (AcOH) in MeCN were added to the Solvinert™ plate followed by 20 μL of glycan solution from part 1 (Greiner plate solution). The N-glycans were captured on the solid support by incubation at 80°C for 1 h at 700 r/min. The beads were wetted with another 100 μL of 2% AcOH solution and the incubation continued for 10 min. The solvents were removed under vacuum, and the supported glycans were washed twice with 300 μL of MeOH, twice with 200 μL of guanidine HCL), twice with 200 μL of water, and twice with 200 μL of MeOH. The plate was blotted again. MeOH (180 μL) and acetic anhydride (20 μL) (reagent grade) were then added to the wells which were incubated at RT for 30 min at 600 r/min. The solvent was removed under vacuum and the supported glycans were washed twice with 200 μL of MeOH, twice with 200 μL of water and twice with 200 μL of 95% MeCN. After vacuuming out the liquid, the remaining solvent was evaporated off at RT for 5 min. The glycans were released from solid support with 175 μL of 2% AcOH solution and 25 μL of 20% MeCN in water, at 60°C for 30 min at 700 r/min followed by another hour of incubation at 60°C at 400 r/min. After cooling for 5 min, 50 μL of 2-AB labelling mix was added to the mixture which was incubated at 65°C for 2 h at 800 r/min. The solution was then transferred to a 2 mL CB containing 1 mL of 95% MeCN per well.
Hypersep™ Diol Cartridges (Thermo Fisher Scientific, Massachusetts, USA) were pre-equilibrated with 1 mL water and vacuumed followed by 1 mL of MeCN which was vacuumed through. The glycans and separated beads were transferred from the CB to the cartridges which were washed three times with 750 μL of MeCN. The purified glycans were eluted from the cartridges into a CB under vacuum with two rounds of 200 μL of 20% MeCN solution which was incubated for 5 min before each elution.
Ultraperformance liquid chromatography
The N-glycan solution was either stored (at 4°C or −40°C) or dried in a rotary vacuum at 37°C. The glycans were re-dissolved in 6 μL of water and 14 μL of MeCN (30/70% solution) giving a 20 μL solution. Of this, 19 μL was injected onto the column for a 20 min runtime. The HILIC-UPLC was carried out on a BEH Glycan column on an Acquity UPLC (Waters, Massachusetts, USA) equipped with a fluorescence detector. Solvent A used was 50 mM ammonium formate solution, pH 4.4. Solvent B was acetonitrile (HPLC grade). The column temperature was set to 40°C. The following conditions were used: 20 min method using a linear increasing gradient of 30–70% solvent A and a linear decreasing gradient of solvent B at 0.561 mL/min. The samples were injected in 70% acetonitrile and 30% water. The fluorescence was measured at 420 nm with excitation at 330 nm and all analytical peaks resolved within 12 min. The system was calibrated using an external standard of hydrolysed, 2-AB-labelled glucose oligomers (Waters, Massachusetts, USA) to create a dextran ladder with retention times of all identified peaks expressed as GU.30,34
Peak integration
Twenty-eight N-glycan peaks (GP), previously characterized by UPLC and mass spectrometry, 35 were identified and grouped according to galactose content. The peak % areas of agalactosylated (G0), monogalactosylated (G1) and digalactosylated (G2) structures were determined and the specific G-ratios (G0/G1) and (G0/G2) were calculated (Figure 2). This provided a qualitative measurement of the incorporation of galactose into IgG N-glycans.18,31 The G-ratios were interpreted for clinical evaluation as specific quantitative values of patient IgG N-glycan galactose incorporation compared with control G-ratios.11,18
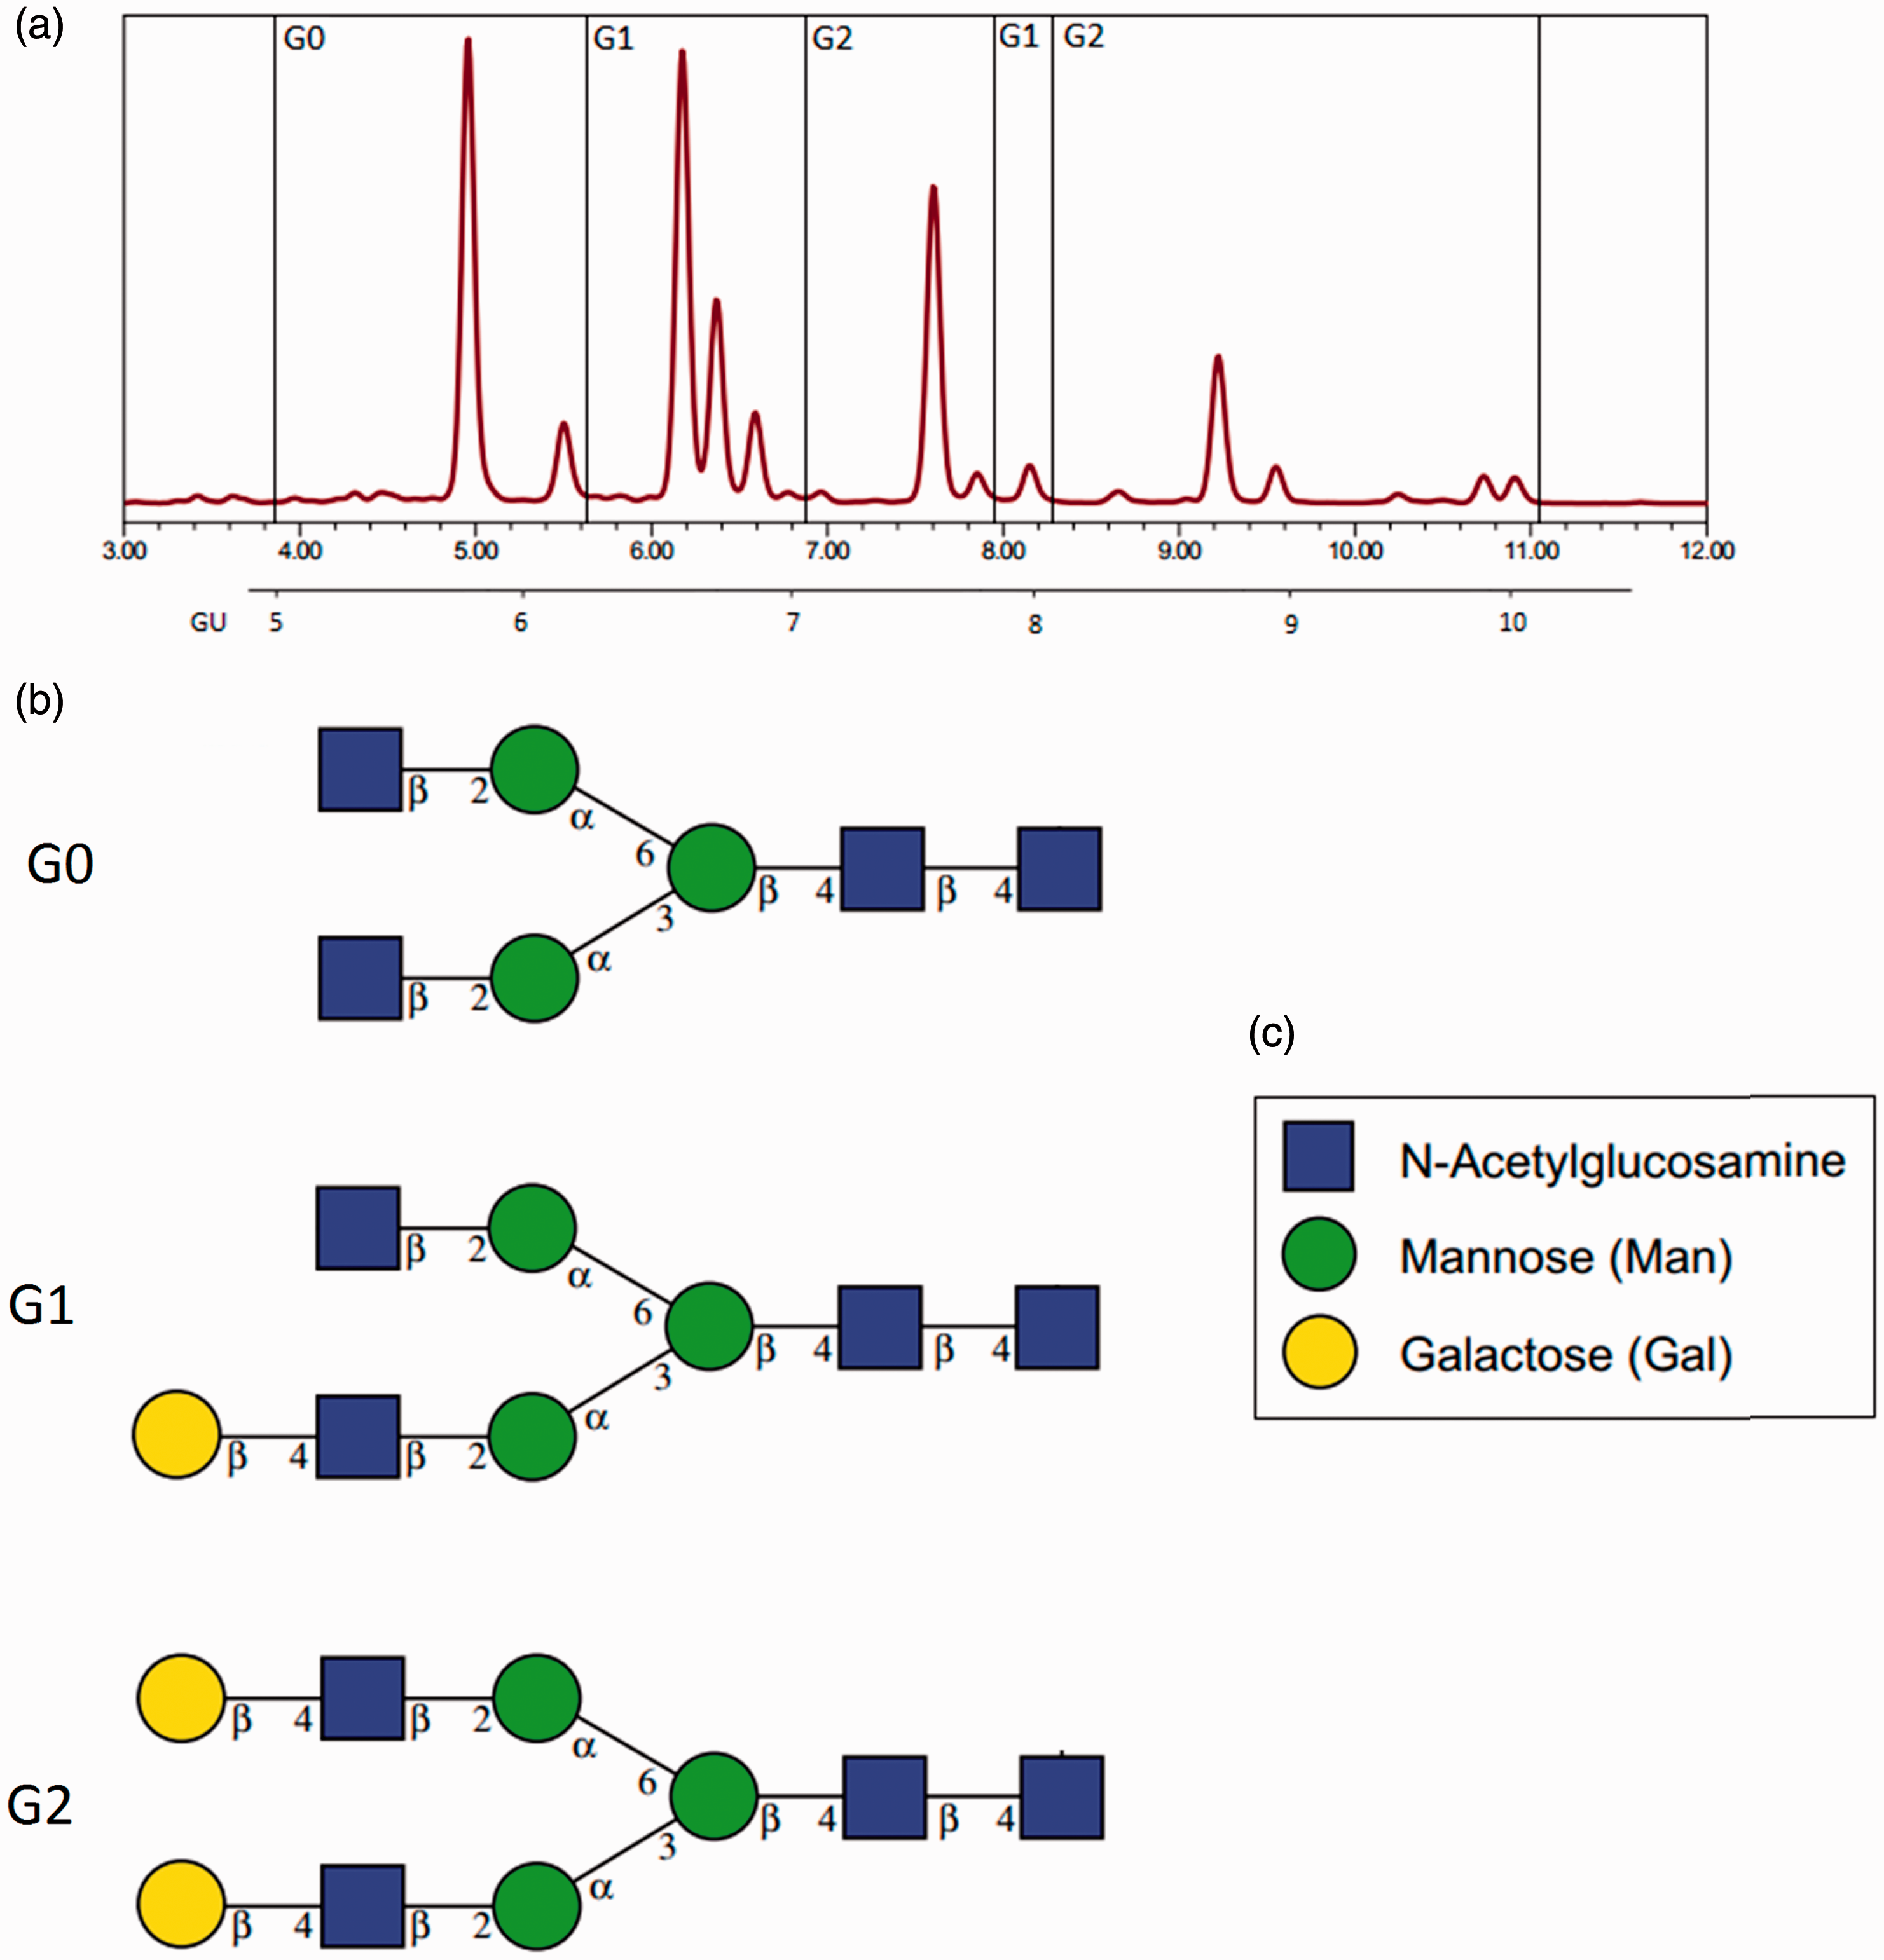
Grouping of peaks for G-ratio assignment. (a) UPLC IgG N-glycan chromatograph: G0 = Sum of peak areas in G0 region (glycan peaks [GP] 1–6). G1 = Sum of peak areas in G1 regions (GP 7–12 and 18–19). G2 = Sum of peak areas in G2 regions (GP 13–17 and 20–28, excluding GP 24 at approx. 10 min). For GX, X = number of galactose moieties. (b) Examples of N-glycan species within each region. Galactose sugars represented by gold circles according to legend (c). 36
The data analysis was completed using Empower 3 Software, and the results were compared to Glycobase using the dextran ladder and GU values (http://glycobase.nibrt.ie) that allows computer-assisted preliminary structural assignments.37,38
Repeatability
Control samples at volumes of 12.5, 50.0 and 100.0 μL (lower limit of quantification [LLOQ], clinical decision point and upper limit of quantification [ULOQ], respectively) were analysed in quintuplets, five times over five separate time periods. For this method, 50 μL was found to be sufficient to overcome the signal to noise ratios during UPLC detection and sufficient flow rates through the ultrafiltration plate under vacuum/centrifugation as demonstrated previously. 34 Thus, 50 μL was determined to be the clinical decision point. The patient sample was run at one volume (50.0 μL) in quintuplets five times over five separate periods.
Linearity of the waters acquity H-class UPLC system
Man3–2-AB (0.83 ng/μL) was spiked at five quantities ranging from 1 to 5 μL (0.83–4.17 ng) into 2-AB labelled dried glycans extracted from 50 μL of patient serum samples, bringing the water volume to 6 μL. Fourteen microlitres of MeCN were added to give a 20 μL of injection mixture. The samples were analysed in duplicate. The peak area versus concentration data treated by least square linear regression analysis was performed on the Man3–2-AB peaks to check for a linear response in fluorescence of the UPLC apparatus.
Linearity of the automated IgG N-glycan purification and labelling platform
Five control serum concentrations running from LLOQ up to the ULOQ were tested in triplicate to give the reportable range of the method.
Limit of quantification
The limit of quantification was defined as the serum volume where the smallest peak had an EP s/n <10 and coefficient of variation (CV) < 20% of three samples. Blank segments of each chromatogram between 14 and 15 min were used as the blank. The lowest volume tested was 12.5 μL (25% of clinical decision point) and 100.0 μL was the highest volume tested (maximum specified capacity of protein G plate). For the LLOQ and ULOQ, 12.5, 37.5, 50.0, 62.5, 70.0 and 100.0 μL control samples were tested in triplicate.
Stability and freeze–thaw cycles
Stability at 4°C
A control sample and one patient sample were stored in 4°C for up to 40 days. They were analysed in duplicate at five different time points.
Freeze/thaw stability
A freeze–thaw experiment was performed on control and on one patient sample. The samples were thawed for 2 h at RT and refrozen at −40°C. Four cycles were repeated. The samples were analysed in duplicate.
Stability between steps
The samples were tested for stability at 4°C and −40°C up to one week following glycan release from IgG and tested in similar conditions after glycan dry down (pre-UPLC). This was necessary for managing day to day hardware availability in a busy lab.
Cross-column stability
The sample sets were run on three different BEH Glycan 1.7 μM 2.1 × 150 mm columns to test for repeatability (the column serial numbers were: 01243327416632, 01573611818047 and 01623635718339).
UPLC dock preinjection stability
The samples were tested for preinjection incubation periods up to a runtime of 45.5 h.
Crossover
Sample crossover of the UPLC needle was checked by processing three water blanks alongside three high concentration control samples (100 μL). Crossover of re-used protein G plates, regenerated once as per manual and crossover of cleaned and reused Hypersep diols cartridges was checked with analysis of three PBS blanks each.
Accuracy (method comparison)
A manual method was performed to recapitulate the automated method of sample preparation, including IgG isolation from whole serum, removal of N-linked glycans from IgG and 2-AB labelling of N-glycans. The G-ratios of three control concentrations were compared with those of the automated method via UPLC.
Recovery of IgG from protein G spin plate
Human serum may typically contain 1118 mg/dL IgG 39 or 559 μg per 50 μL. Recovery of washed and eluted human serum IgG was plotted in duplicate against a bovine serum albumin standard curve in a Bradford assay. Three patient samples (two males, one female) were also tested (Figure 3(f)).
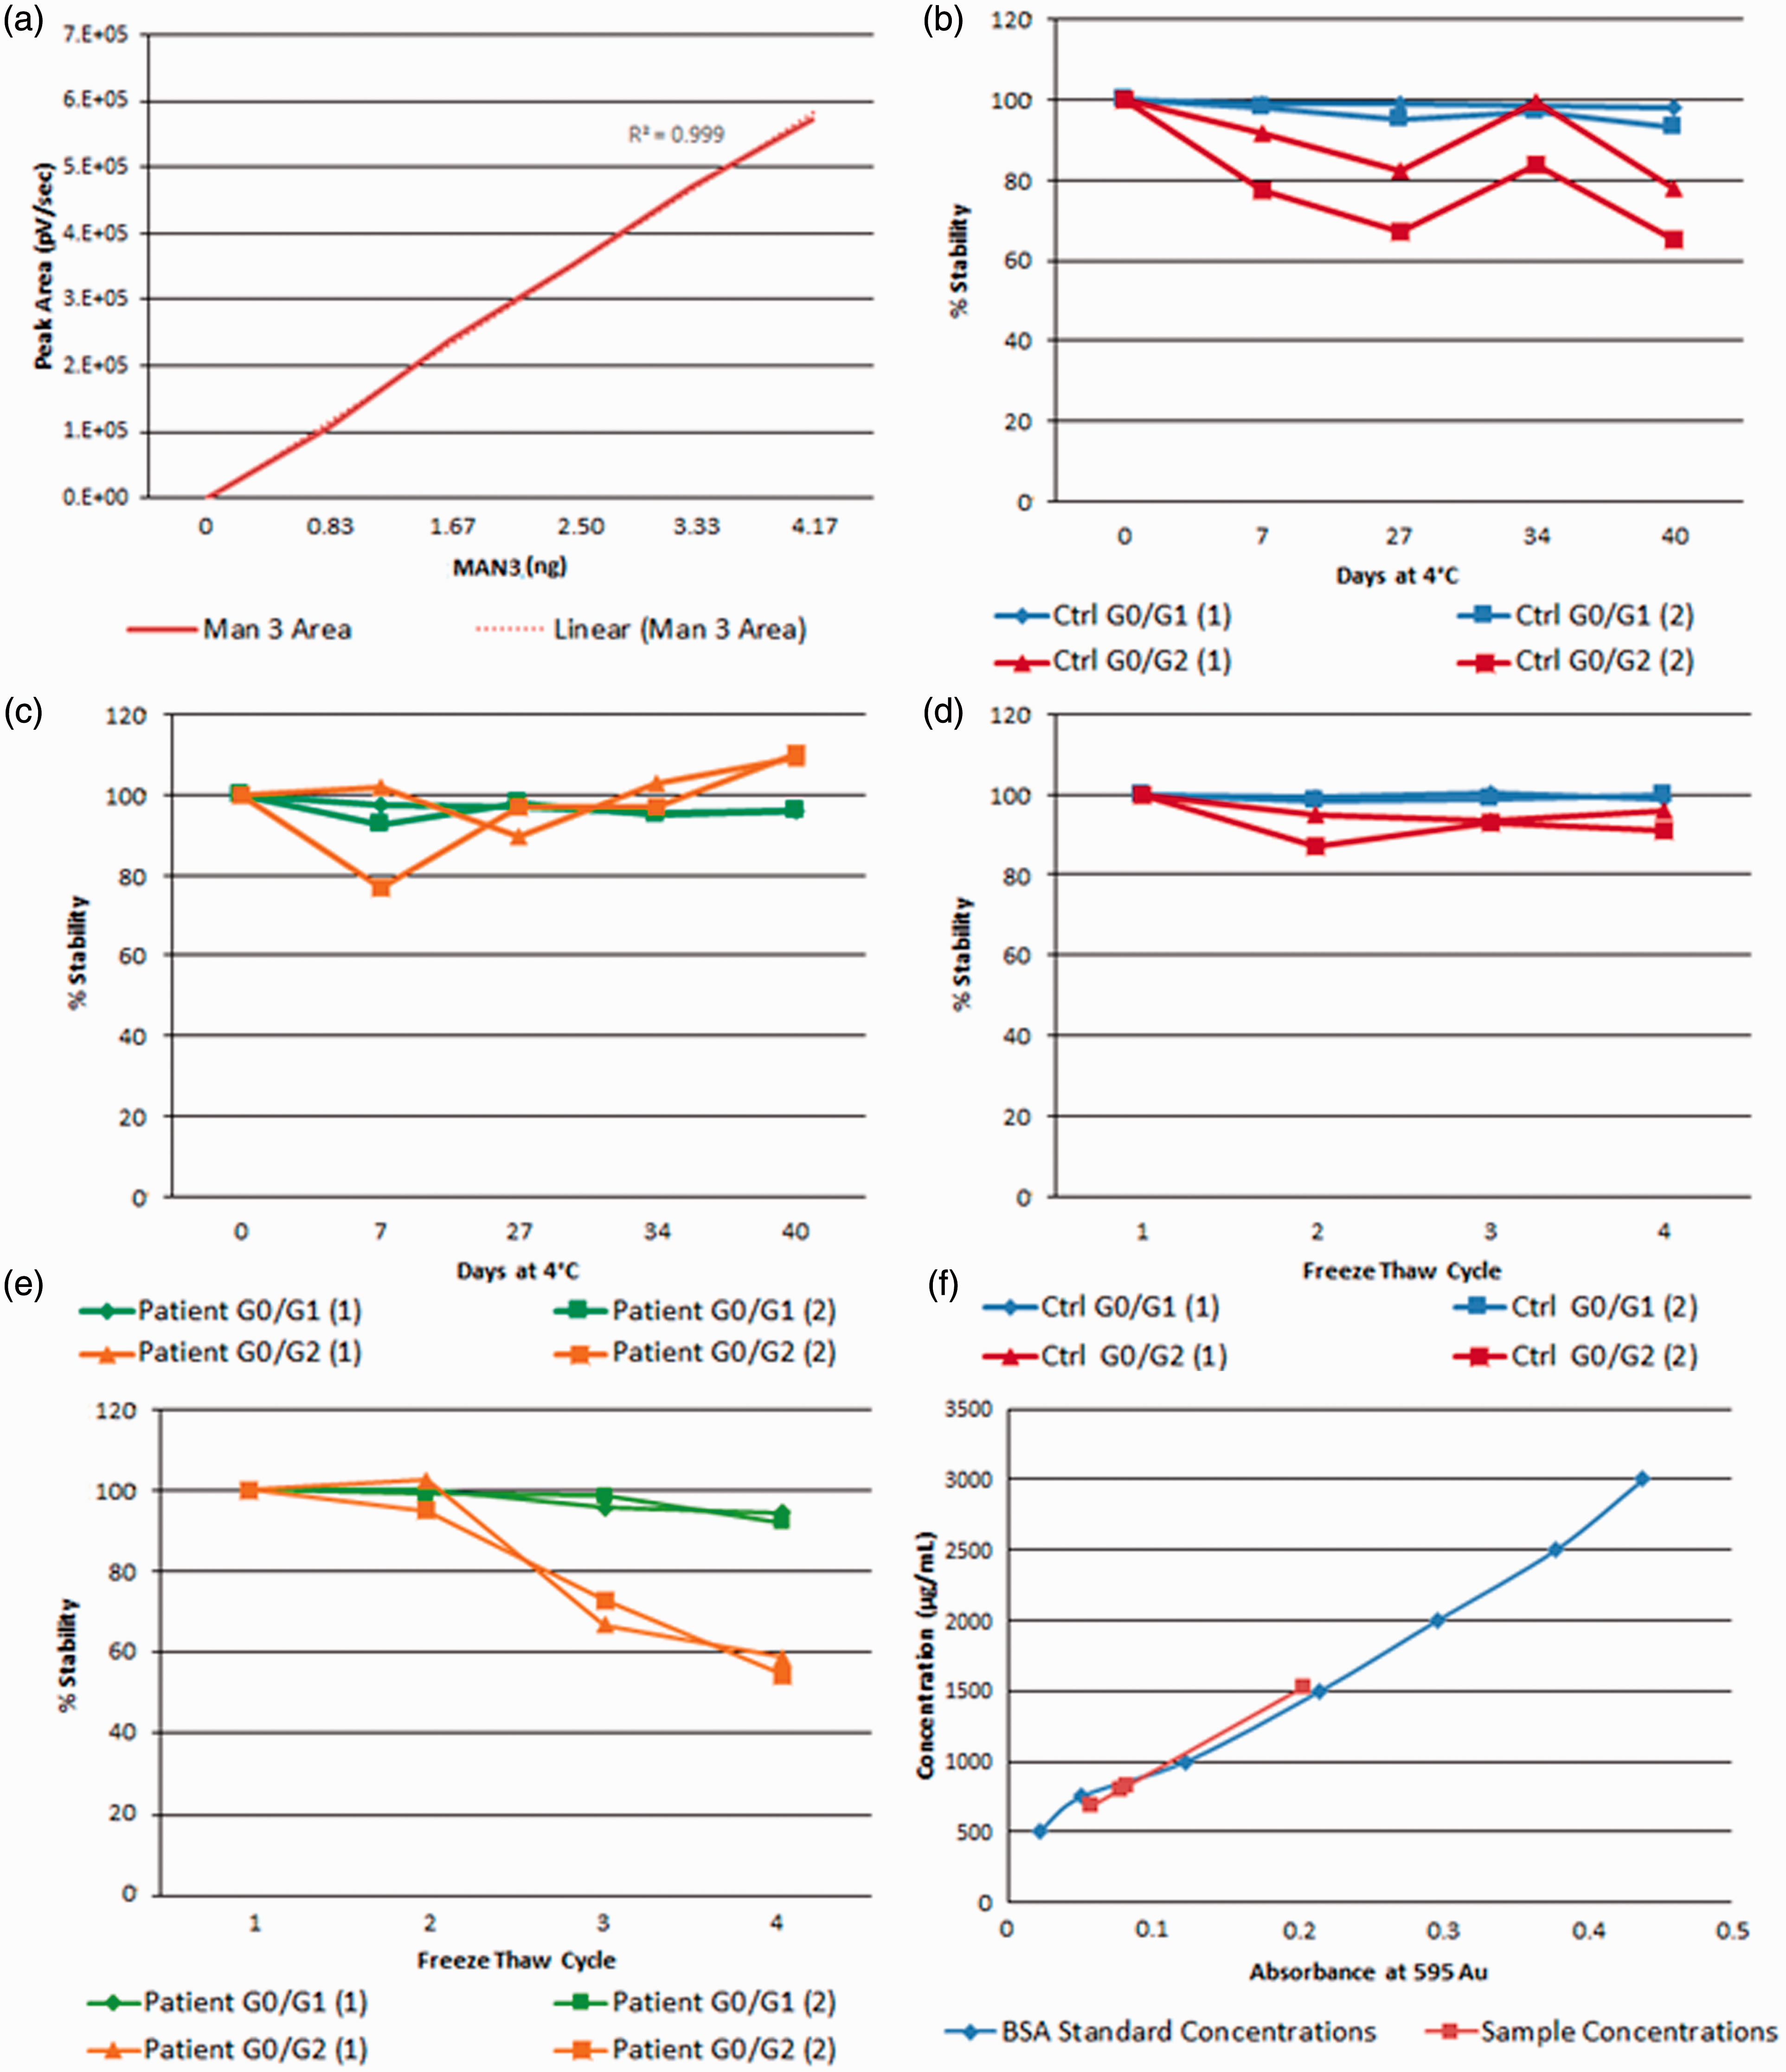
(a) Linearity of five concentrations of MAN3–2AB vs. peak area over separate runs. (b) Percentage refrigeration stability of the control sample over 40 days. (c) Percentage refrigeration stability of a patient sample over 40 days. (d) Stability of the control sample over four freeze/thaw cycles. (e) Stability of the patient sample over four freeze/thaw cycles. (f) Recovery of IgG from human serum samples as measured from a bovine serum albumin (BSA) standard curve.
Interference
Lithium heparin and high bilirubin
A 50 μL control sample was spiked with 30 μL of each of three high bilirubin samples extracted from plasma with lithium heparin tubes. Bilirubin concentrations were 72, 305 and 392 μmol/L. Duplicate G-ratios were checked for reproducibility.
Haemolysis
A 50 μL control sample was spiked with 30 μL of plasma (lithium heparin) containing haemolysed erythrocytes and G-ratios were compared with 50 μL of control samples spiked with 30 μL of non-haemolysed serum from the same patient. The samples were tested in duplicate.
Highly lipaemic
A 50 μL control sample was spiked with 30 μL of highly lipaemic plasma (lithium heparin). Duplicate G-ratios were checked for reproducibility.
High bilirubin plasma vs. serum
G-ratios from 50 μL of plasma (Lithium heparin) from a patient with 72 μmol/L of bilirubin and 50 μL of serum from the same patient were compared for reproducibility.
Results
The CVs for G0/G1 and G0/G2 were <10% within-runs (intra-assay) and between-runs (inter-assay) for both control and patient samples at all concentrations (Table 1). The combined cumulative CV% of the 100 μL and 50 μL control sample sets was <10%. The combined cumulative CV of the 100, 50 and 12.5 μL control sample sets was less than 20%, a slightly higher CV as 12.5 μL is the LLOQ where congruency of the G-ratios with higher concentrations begins to wane.
Repeatability experiment.
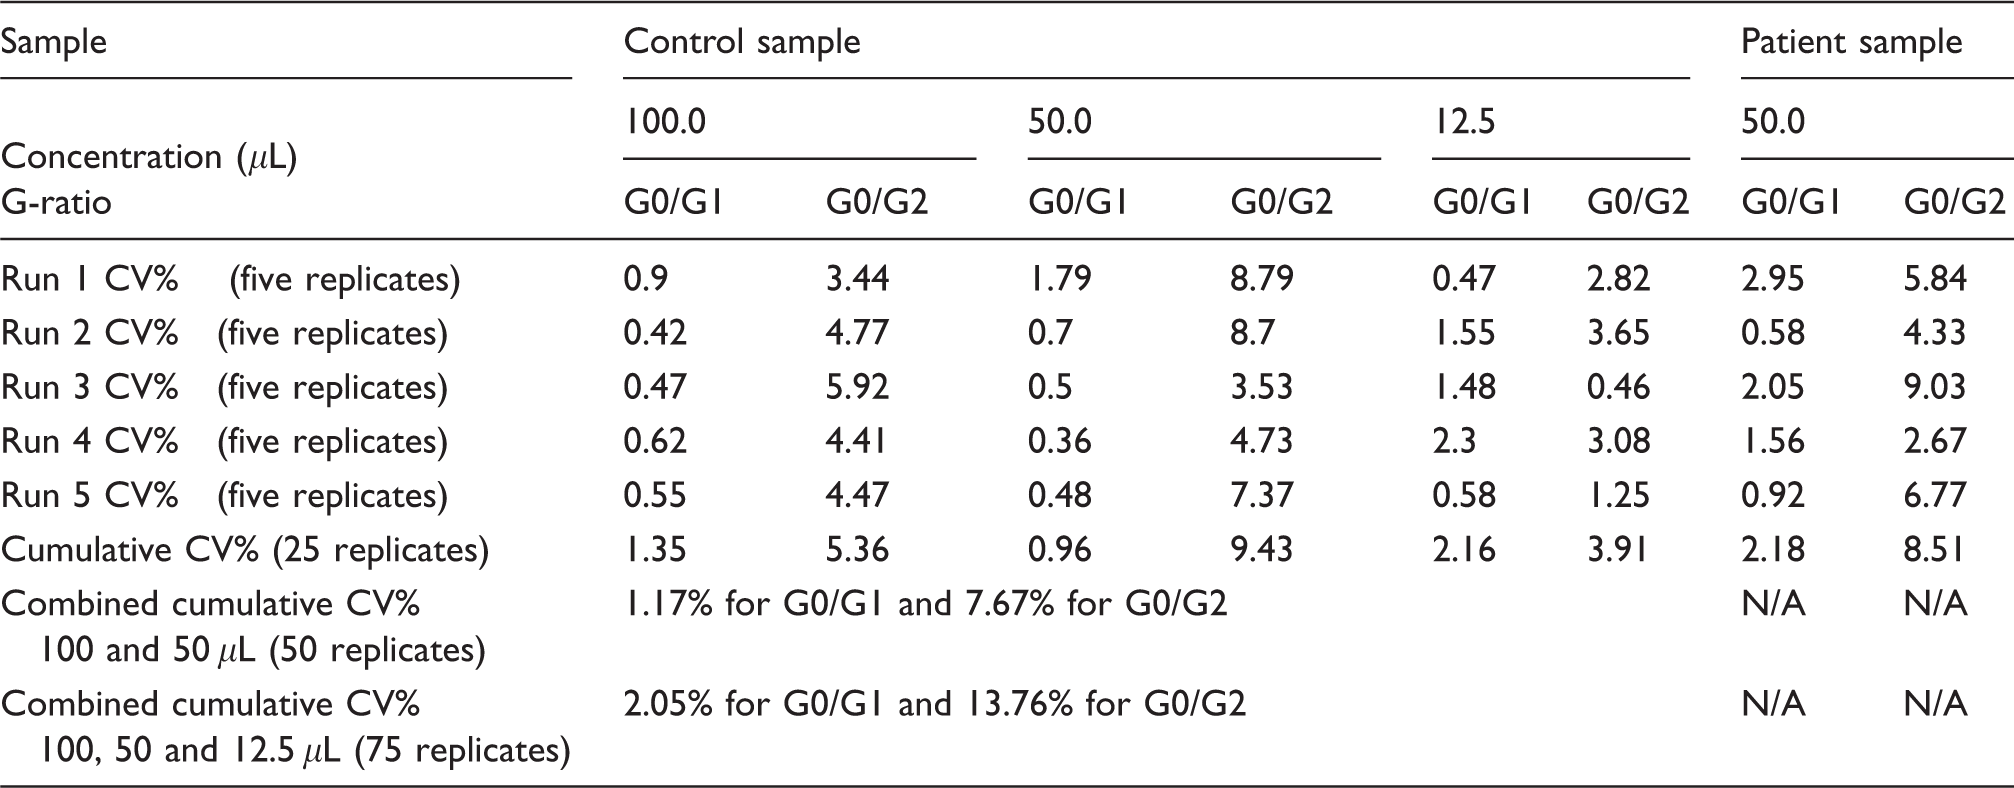
Note: Each run comprised five replicates at a given concentration. Three concentrations for the control sample (100, 50 and 12.5 μL) and one concentration for the patient sample (50 μL) was used, thus 20 samples per each run. The values represent the CV% of 5 replicates for both the G0/G1 and G0/G2 ratios. The cumulative CV% row shows the CV over five runs of one control concentration.
CV: coefficient of variation.
Both the UPLC instrument and sample preparation platform were tested for linearity. For the UPLC instrument, the mannose 3–2AB standard supplied direct from the manufacturer was mixed as a known solution according to the sample preparation section and injected. The concentrations of Man3–2AB were plotted against peak areas showing an R2 value of 0.999 (Figure 3(a)). Therefore, we propose that the UPLC system presents a linear response between analytical runs.
For the reportable range of the automated sample preparation platform, the G-ratio value from serum samples remained consistently below 10% cumulative CV from concentrations of 37.5 μL up to 100.0 μL inclusive (Table 2). With the addition of 12.5 μL G-ratios (LLOQ), the cumulative CV rose to 14.6%. The peak areas across all concentrations remained relatively consistent as seen from the average peak areas. Thus, we suggest a reportable range of 37.5 μL to 100 μL for the automated IgG N-glycan purification process.
Reportable range of the method from cumulative CV percentage.
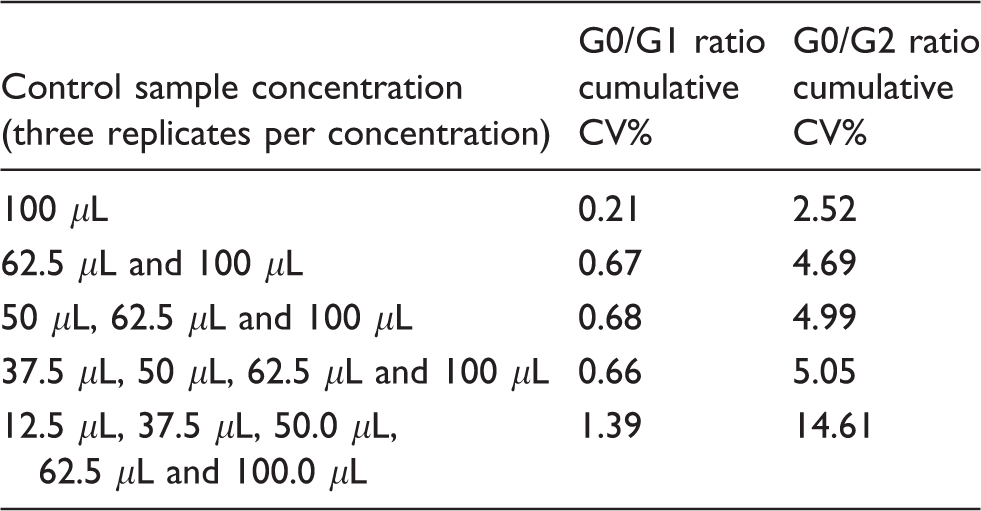
CV: coefficient of variation.
LLOQ tests were performed on the smallest peaks of UPLC chromatograms of three 12.5 μL of control samples. The three EP s/n ratios for the smallest GPs were all less than 10. The CVs for G0/G1 and G0/G2 ratios of these samples were less than 10% (see supplement page 1). Detection limits for volumes lower than 12.5 μL were not measured as 10 μL was the lowest permissible volume for the protein G plate.
Serum samples and processed N-glycans showed strong stability. For control samples, CVs of G-ratios were <20% for the control samples for up to 40 days of refrigeration (Figure 3(b)). CVs of G-ratios were <10% for the patient sample up to 40 days of refrigeration (Figure 3(c)). G-ratios for control samples were stable and below CV 10% for four freeze–thaw cycles (Figure 3(d)). For patient samples, CVs of G-ratios were stable after two cycles, but the CV% rose to 15% for the third and fourth cycles (Figure 3(e)). Processed N-glycans were tested for intermittent storage under two conditions from two stages in the method. Samples tested up to 11 days showed similar results with CVs <10% when either frozen (−40°C) or refrigerated (4°C), after (a) glycan release or (b) glycan dry down (supplement page 2). Upon change of UPLC column, the control pooled sample and patient serum samples showed similar results with G-ratio CVs <10% across all three columns which were used throughout the study (supplement page 3). Samples in the UPLC injection dock were stable up to 26 h at 5°C. G0/G1 and G0/G2 CV% of a 26 h patient sample were 0.7% and 0.2%, respectively, compared with the same sample after 6 h. After this period, peak splitting began to occur (supplement page 4).
The UPLC profiles indicated that for each of the 28 glycan peaks, after a high sample (100.0 μL of control sample), areas of blank water sample peaks were virtually zero, showing little or no crossover in the injection needle (no peaks to quantify, data not shown). Protein G wells and Hypersep Cartridges appeared reusable in the sample preparation step. For PBS blanks ran through reused (×1) protein G wells with reused (×1) Hypersep Diol Cartridges, peak areas were <10% of the LLOQ when injected after the high sample (100 μL). For example, the largest blank sample glycan peaks were 1.09%, 3.29% and 9.61% of the LLOQ (supplement page 5).
The results of the manual sample preparation experiment showed reproducible G-ratios at three concentrations of 12.5, 50.0 and 100.0 μL control samples, but CVs were higher in some cases. The G0/G1 ratio CVs were 0.11%, 3.06% and 6.79%, respectively. The G0/G2 ratio CVs were 3.41%, 11.14% and 24.55%, respectively (supplement page 6).
The recovery of washed IgG from human serum averaged at 328.8 μg or 58.8% of average values from the referenced cohort at 559 μg 38 or 65.76% of the maximum IgG-binding capacity of the resin (500 μg). The concentrations of the patient IgG samples tested ranged from 273.5 to 611.5 μg (Figure 3(f)).
The reference ranges for G0/G1 and G0/G2 ratios were derived from adult patients with classical galactosaemia and controls in our previous study. 31 For galactosaemia patients, the G0/G1 ratio was 0.75 (±0.15), and for G0/G2, this was 0.95 (±0.39). For controls, the G0/G1 ratio was 0.65 (±0.14) and the G0/G2 was 0.78 (±0.29).
The environments of clinical apparatus and sample condition showed good repeatability with serum and plasma (supplement page 7). The haemolytic plasma CVs were <10% across four 50.0 μL control samples, two spiked with haemolytic plasma and two spiked with non-haemolytic plasma from li-hep tubes. The CVs for G0/G1 and G0/G2 were 0.4% and 2.1%, respectively. For lipaemic samples (high turbidity), 50.0 μL of control spiked with 30 μL of lipaemic plasma showed reproducibility at 1.9% and 2.6% CV for G0/G1 and G0/G2, respectively. High bilirubin plasma sample CVs were <10% for each duplicate of 72.0, 305.0 and 392.0 μmol/L bilirubin samples which were spiked at 30.0 μL into 50.0 μL control serum. The CVs were 1.1%, 0.6%, 0.4% for G0/G1 and 3.1%, 0.3% and 1.9% for G0/G2, respectively. Neat high bilirubin plasma versus neat serum from a single patient showed G-ratios with CVs that were not found to be reproducible which may indicate differing profiles for plasma samples when tested separately. The neat serum sample containing high concentrations of bilirubin (72 μmol/L) did not show consistent G-ratios which may indicate some interference at these concentrations.
Discussion
This application of the UPLC method has several advantages when compared with other available methods for the diagnosis of N-glycosylation, such as isoelectric focusing of serum transferrin or tandem mass spectroscopy. 40 It is a well-established, high-throughput robust analytical technique to obtain high-resolution separation of N-glycans released from glycoproteins. 41 N-glycans labelled with a fluorescent label such as 2-aminobenzamide (2-AB) are detected at femtomole concentrations. The major advantages of UPLC analysis of fluorescently labelled glycans are the high reproducibility, exact relative glycan quantification and effective separation of structural isomers and lower cost compared with MS.
Accurate relative glycan quantification and reproducible separation can only be achieved if the glycans released from glycoproteins are free from contaminants that may lead to artefacts and poor assay reproducibility. 34 Buffer, detergents, serum contaminants may interfere with chemical and biochemical reactions. 42 In our study, we presumed that the IgG was free from contaminants and was not prone to any interactions. The reasons for omitting the common analytical interference experiment were the advances in UPLC preparation technology that allow the efficient removal of buffers, reagents and endogenous carbohydrates by washing the immobilized glycoproteins prior to enzymatic glycan release.43,44 We considered, however, the possibility of the existence of other common biological interferants such as haemolytic, icteric and lipaemic indices. These did not impact strongly on method reproducibility. However, as seen in the neat 72 μmoL bilirubin serum samples, samples from heavily jaundiced patients (>50 μmol/L) may not show consistent G-ratios.
The repeatability of the method was found to be optimal with CVs of <10%. CVs of this unique automated method far exceeded that of the manual execution. As expected, the manual technique is flawed and prone to human error.
In other chromatographic methods, recovery would be normalized and quantified with the use of an IS which was not possible here as, to our knowledge, no commercially available IgG with a known quantity of appended glycans currently exists. 45 But importantly, recovery may vary from run to run, but it does not have an effect on the IgG N-glycan ‘fingerprint’ of each sample as seen in the repeatability of the assay.
As this is a qualitative method, ratios of glycan peak areas relevant to each other are measured, rather than areas relevant to an IS, i.e. the peaks are self-calibrating. Peaks were identified as the relevant glycan units using the UPLC dextran ladder and glycobase as described in the sample preparation section. These ratios are consistent and irrespective of total peak area above certain serum concentrations. They accurately describe quantitative galactose incorporation values when compared with control values.4,11 Further, we have reported the recovery of IgG from human serum compared with published average values 39 which was improved in this method at an estimated 65.76% compared with 40.0% reported in the study by Stockmann et al. 31 We have also introduced mannose 3 as a potential IS which showed ideal repeatability in the linearity experiment, did not interfere with N-glycan peaks and warrants further investigation.
Differential glycosylation patterns in IgG N-glycans provide a more informative clinical marker in galactosaemia compared with the current biochemical tests. Galactosaemia patients on restricted diet have higher G0/G1 and G0/G2 ratios compared with healthy individuals suggesting ongoing glycosylation processing defects.4,16 Treated galactosaemia patients generally have increased non-galactosylated (G0) and monogalactosylated (G1) structures, with decreased in certain digalactosylated (G2) structures compared with healthy controls. 16 In the synthesis of N-glycans, assembly of core structures occurs in the endoplasmic reticulum, and processing reactions, such as addition of galactose, occur in the Golgi apparatus. 46 In addition to the N-glycan processing defects, which we have identified in all treated adult galactosaemia patients, we have previously observed that a small subset of patients have continuing N-glycan assembly defects in addition to processing defects regardless of treatment with dietary galactose restriction.16,17 These assembly defects are mostly limited to galactosaemia untreated neonates, but can be detected as rare outliers.16,17 For these individuals (which are outliers), an analysis of the total serum N-glycome (N-glycans from all proteins in the serum) in addition to IgG analysis is applicable and provides a broader analysis of glycan structures which may be affected. These patients have shown a deficiency of total branched glycan structures in addition to poor galactose incorporation.
Galactosaemia appears to be a modifiable galactosylation disorder as demonstrated by different galactose tolerance levels in patients with identical genotypes. 11 Having validated this method and that in view of the individual G-ratio variation in patients, we propose that this sensitive and reliable assay can be applied to personalized monitoring of treatment interventions for individual patients.
Conclusions
In summary, we present the validation of an automated high-throughput, low-cost, sensitive and informative method of IgG N-glycan profiling for classical galactosaemia. The method may now potentially be applied to enable the improved monitoring of patients with galactosaemia.
Supplemental Material
Supplemental material for Validation of an automated ultraperformance liquid chromatography IgG N-glycan analytical method applicable to classical galactosaemia
Supplemental material for Validation of an automated ultraperformance liquid chromatography IgG N-glycan analytical method applicable to classical galactosaemia by Hugh Owen Colhoun, Eileen P Treacy, Marguerite MacMahon, Pauline M Rudd, Maria Fitzgibbon, Roisin O'Flaherty and Karolina M Stepien in Annals of Clinical Biochemistry
Footnotes
Acknowledgements
All authors would like to thank our patients with Classical Galactosaemia for their contribution to this research.
Declaration of conflicting interests
The author(s) declared no potential conflicts of interest with respect to the research, authorship, and/or publication of this article.
Funding
The author(s) disclosed receipt of the following financial support for the research, authorship, and/or publication of this article: Health Research Board Grant HRA Grant No. POR-2014-623. EU FP7 High Glycan program (Grant no. 278535) and SFI Spokes Microbe Mom program (Grant no. 16/SP/3827).
Ethical approval
Ethical approval for this study was obtained from the ethics committee of the Mater Misericordiae University Hospital, Dublin, Ireland (Reference 1/378/1811). The patients and their parents gave their full informed consent to partake before they were enrolled in the study.
Contributorship
ROF and KMS contributed equally to this work. HOC, ROF, KMS, PMR, MM, MF, EPT – conception and design, analysis and interpretation of data, drafting the manuscript and revising the manuscript critically for important intellectual content.
All authors read and approved the manuscript before submission.
References
Supplementary Material
Please find the following supplemental material available below.
For Open Access articles published under a Creative Commons License, all supplemental material carries the same license as the article it is associated with.
For non-Open Access articles published, all supplemental material carries a non-exclusive license, and permission requests for re-use of supplemental material or any part of supplemental material shall be sent directly to the copyright owner as specified in the copyright notice associated with the article.