
Abstract
Background
Analysis of citrate and oxalate in a 24-h urine sample is important in the screening and monitoring of patients with nephrolithiasis. To streamline the analytical process, it was decided to combine oxalate and citrate and analyse them simultaneously in the same assay.
Objective
A highly sensitive and specific assay for analysis of urine citrate and oxalate was developed using liquid chromatography-tandem mass spectrometry (LC-MS/MS) with a simple weak anion exchange solid phase extraction (WAX SPE) clean-up procedure.
Method
Premixed calibrator/acidified urine (50 µL) was combined with mixed internal standard (13C2 oxalate/citrate-d4) and 5% v/v formic acid in water and passed through a Waters WAX SPE plate. After clean-up steps, the plate was eluted with 5% NH3 in methanol, the eluent was dried down and re-constituted with 100 µL distilled water. Separation was then performed on an HSS T3 2.1 × 50 mm column (Waters, Manchester, UK), flow rate of 0.5 mL/min using a gradient of aqueous and organic mobile phases. We detected multiple reaction monitoring transitions m/z citrate 191.1>110.9, citrate IS 195.1>112.9, oxalate 88.9>60.85, oxalate IS 90.9>61.9 using a Waters TQD in electrospray-negative mode.
Results
Oxalate and 13C2 oxalate were eluted at 0.29 min; citrate and citrate-d4 were eluted at 0.52 min. Mean recovery was 100% for oxalate and 103% for citrate; lower limit of quantification of oxalate was 60 µmol/L and 50 µmol/L for citrate. Oxalate was linear up to 1388 µmol/L; citrate was linear up to 4762.5 µmol/L. Oxalate was found to be affected by ion suppression (matrix effect: −23 to +65%) but was compensated for by the internal standard used in all cases. The coefficient of variation of the assay in urine for oxalate was <7% for oxalate and 5% for citrate.
Discussion
We have developed a rapid assay for LC-MS/MS measurement of urinary oxalate and citrate in a routine clinical laboratory. It is simple, reproducible and easy to perform.
Introduction
Urinary stones
The analysis of citrate and oxalate in a 24h urine sample is important in the screening and monitoring of patients who may be potential stone formers (nephrolithiasis). Citrate acts to suppress stone formation as it binds to calcium ions in the urine, thereby lowering the saturation of calcium oxalate. Citrate has been shown in different studies1,2 to inhibit the aggregation of preformed crystals and also to inhibit their attachment to damaged urinary epithelium which is known to accelerate stone formation.
Oxalate is a small, hydrophilic molecule that is derived from three sources; dietary, endogenously and from the breakdown of ascorbic acid (vitamin C). Excess oxalate in the urine is classed as a promoter of stone formation as it can form insoluble calcium oxalate complexes which account for the largest proportion of renal stones. 3 Patients with recurrent calcium-based stones tend to have hyperoxaluria 3 which may be due to different reasons including increased dietary intake, increased uptake in the gut due to conditions such as Crohn’s disease, 4 or rarer genetic disorders such as primary hyperoxaluria types 1–3. 5
Oxalate is difficult to quantify on analytical chemistry analysers due to interference from ascorbic acid and a complex charcoal clean-up procedure which may adversely affect system tubing and optics. Current LC-MS/MS methods are adequate for oxalate quantification but chromatography can be troublesome and may require long equilibration times to return back to starting conditions. Often, due to the antagonistic properties of oxalate and citrate, they are requested together as part of a urine stone screen. It was therefore decided to combine oxalate and citrate in the same assay in order to reduce time in sample preparation, analysis and processing.
Our previous mass spectrometry (MS) method used a weak anion exchange (WAX) analytical column prior to injection into a mass spectrometer 6 which took advantage of the compound’s anionic nature. In the new method proposed, a WAX solid phase extraction (SPE) plate is used earlier in a manual extraction step to significantly clean-up the sample. At low pH, oxalate and citrate are both negatively charged, while the SPE plate is positively charged, and elution with an alkali solution (5% NH3 in MEOH) increases the pH, thus negating the interaction between the SPE plate and the analytes of interest which are washed off into the plate beneath.
Materials and methods
Sample preparation
Stock solutions were prepared in phosphate-buffered saline (PBS) (Sigma, Poole, UK) pH 1.6 using liquid TraceCert oxalate (Sigma, Poole, UK) and traceable citrate powder (VWR) which was subsequently diluted in PBS pH 1.6 to give concentrations of 0–1388 µmol/L for oxalate and 0–4762.5 µmol/L for citrate. The quality controls (QCs) were also made in PBS pH 1.6 using oxalic acid dihydrate powder (Sigma, Poole, UK) and traceable citrate powder to give concentrations for oxalate of 480, 793 and 1000 µmol/L and citrate concentrations of 199, 1920 and 4800 µmol/L. Aliquots (200 µL) of calibrators and QCs were stored at −20℃ for up to six months prior to use.
Stock internal standards were made for oxalate and citrate; 13C2 oxalate (Sigma, Poole, UK) was dissolved in PBS pH 1.6 to a concentration of 10 mg/mL and then stored at 4℃; citrate-d4 (VWR, Leicestershire, UK) was dissolved in PBS pH 1.6 to a concentration of 20 mg/mL and then stored frozen at −20℃. Working internal standards were made for each individual batch of samples; 20 µL stock oxalate internal standard was added to 50 µL of stock citrate internal standard which was then diluted with 930 µL deionized water.
Standards, QC or sample (50 µL) were manually pipetted into a 96-deep well plate (Porvair, Leatherhead, UK). In addition to this, 20 µL of mixed internal standard and 500 µL 2% (v/v) formic acid (BDH, Bristol, UK) were added to each well before covering with a disposable adhesive plate sealer (ThermoFisher Scientific, UK). After vortexing for 60 s at 1800 r/min, the entire contents of the wells were pushed through a pretreated (1 mL methanol followed by 1 mL deionized water) WAX SPE plate using a positive pressure manifold (Waters, Manchester, UK).
Further washes were carried out using 1 mL 2% (v/v) formic acid in water and then 1 mL methanol. After each of the five stages of liquid addition, all visible liquid was pushed fully through the plate and discarded to waste. Five hundred microlitres of 5% (v/v) ammonia solution (Fisher Scientific, Loughborough, UK) in methanol were then used to elute the contents of the WAX SPE plate into a clean and dry 96-well plate. This was dried down with gentle gas flow at 60℃ until no liquid remained. Finally, 100 µL of fresh de-ionized water was added to each well, the plate was then heat sealed, vortexed for 60 s and centrifuged at 882 × g for 5 min. Following centrifugation, the plate was placed on the autosampler for analysis; 5 µL of supernatant was injected into an Acquity ultrahigh pressure liquid chromatography system (Waters, Manchester, UK).
Chromatography
The mobile phases utilized were A (MPA): deionized water with 0.1% (v/v) formic acid (BDH, Bristol, UK) and 2 mmol/L ammonium acetate (Sigma, Poole, UK) and B (MPB): LC-MS grade methanol containing 0.1% (v/v) formic acid and 2 mmol/L ammonium acetate. The sample (5 µL) was then injected onto a 1.8 µm HSS T3 Vanguard column coupled to an HSS T3 2.1 × 50 mm 1.8 µm analytical column (both Waters, Manchester, UK). Starting conditions were 95% MPA for the first 0.75 min; the composition then changed to 100% MPB and returned to starting conditions at 1.25 min (95% MPA: 5% MPB), and each sample had a total run time of 2.5 min.
Mass spectrometry
After separation, the eluate was injected directly into a Waters XEVO® TQD tandem mass spectrometer (Waters, Manchester, UK). Control of the system and data processing were orchestrated by MassLynx NT 4.1 software provided by Waters. The height of the detected peaks was used to generate a standard curve, 1/× weighting and linear least squares regression was used which gives greater accuracy at lower concentrations.
The MS system was operated in electrospray negative mode; the capillary voltage was 2.0 kV and the source temperature was 150℃. The desolvation temperature and gas flow were 600℃ and 800 L/h, respectively. The quantifier and qualifier transitions monitored for citrate were m/z 191.1>110.9, citrate IS 195.1>112.9, oxalate 88.9>60.85 and oxalate IS 90.9>61.9 which were detected in multiple reaction monitoring mode with a dwell time of 0.08 s.
Validation
Published acceptance criteria 7 were used to validate the assay for diagnostic use in the laboratory.
Ion suppression
To investigate ion suppression, three different concentrations of oxalate and citrate plus a blank (PBS pH 1.6) were added into six different urine samples postextraction following a documented procedure. 8 The matrix effect was calculated from the peak height after taking into account the peak height of the endogenous oxalate and citrate in the sample.
Accuracy
Calibrators were prepared gravimetrically using traceable oxalate and citrate powders. The method of standard additions was used to confirm the lack of matrix effects given the use of PBS-based calibrators. Three different concentrations of oxalate and citrate were spiked into two sets of six different samples; the known sample concentration was subtracted from the observed concentration. The values were plotted on a graph (R-Squared value of ≥0.99) and an acceptability target of less than 5% was put in place. Inter- and intra-assay accuracy was calculated from QC samples with a known concentration of oxalate and citrate.
Recovery
Four different concentrations of citrate (0, 375, 1500, 3000 µmol/L) and oxalate (0, 187.5, 750 and 1500 µmol/L) were spiked into six different urine samples pre-extraction. The recovery was calculated using the measured compared with the expected concentration.
Imprecision
Imprecision was assessed using PBS pH 1.6-based QC samples; intra-assay imprecision was evaluated by analysing each level of QC 10 times within the same sample run. To calculate inter-assay imprecision, the same lot of QC material was analysed on 10 different runs, hence assessing the variation between batches.
Linearity
A calibration curve was prepared in PBS pH 1.6 of citrate from 0 to 20,000 µmol/L and oxalate from 0 to 10,000 µmol/L. The assay was judged linear, if the R2 value of expected versus measured concentrations was >0.99.
For the assessment of linearity of dilutions, six patient samples were spiked with a known concentration of oxalate and citrate. Doubling dilutions (1:2 to 1:16) were carried out and the results from each sample and analyte were plotted on graphs; the R2 value was calculated to give an indication of the linearity.
Limit of quantification
QCs were made in PBS pH 1.6 containing exactly 60 µmol/L of oxalate and 50 µmol/L of citrate. These were subsequently analysed 10 times within the same run. The lower limit of quantification (LLOQ) was deemed acceptable if the CV for each analyte was less than 20% with a bias <20%.
Specificity
Solutions (1 mg/mL) of lactic acid, ascorbic acid, isocitrate, malic acid and methylmalonic acid were prepared using distilled water and analysed using the routine LC-MS/MS method.
Postextraction stability
Postextraction stability was assessed by preparing a plate with standards, QCs and 13 patient samples. Analysis was undertaken and the plate was immediately resealed postanalysis; it was then stored at 4℃ for 72 h, centrifuged and reanalysed.
Comparative assays
Urine samples (n = 47) for citrate were analysed and compared with the previous high performance liquid chromatography-tandem mass spectrometry method used in the laboratory. 9 Urine samples for oxalate (n = 40) were also analysed by the new method and compared with a Trinity Biotech enzymatic method (oxalate oxidase) which was carried out in a 96-well plate; the coloured product was measured at an absorbance of 590 nm using a Biotek Epoch plate reader. Previous external quality assurance (EQA) samples were stored in frozen aliquots and re-analysed using the new method, and the results were compared with the all laboratory trimmed mean (ALTM).
Statistical analysis
All data were analysed using Analyse-It Software (Analyse-It Software Ltd, Leeds, UK).
Results
Using the chromatographic conditions described above, the retention times for oxalate and 13C2 oxalate were 0.29 min, citrate and citrate-d4 were 0.52 min. The chromatograms shown in Figure 1 represent a typical chromatogram for QC/calibrators and patient samples. The peaks are well resolved with no interference present, indicating the specificity of the method. Time between injections was 2.5 min, which allowed the solvent gradient to return to starting conditions and equilibrate the column before the next injection. Previous use of the internal standards in the routine methods6,9 gave good results and hence these were used for the new assay.
A typical chromatogram of a urine sample with concentrations of 367 μmol/L oxalate and 2187 μmol/L citrate. Isocitrate is shown to be chromatographically separated from citrate.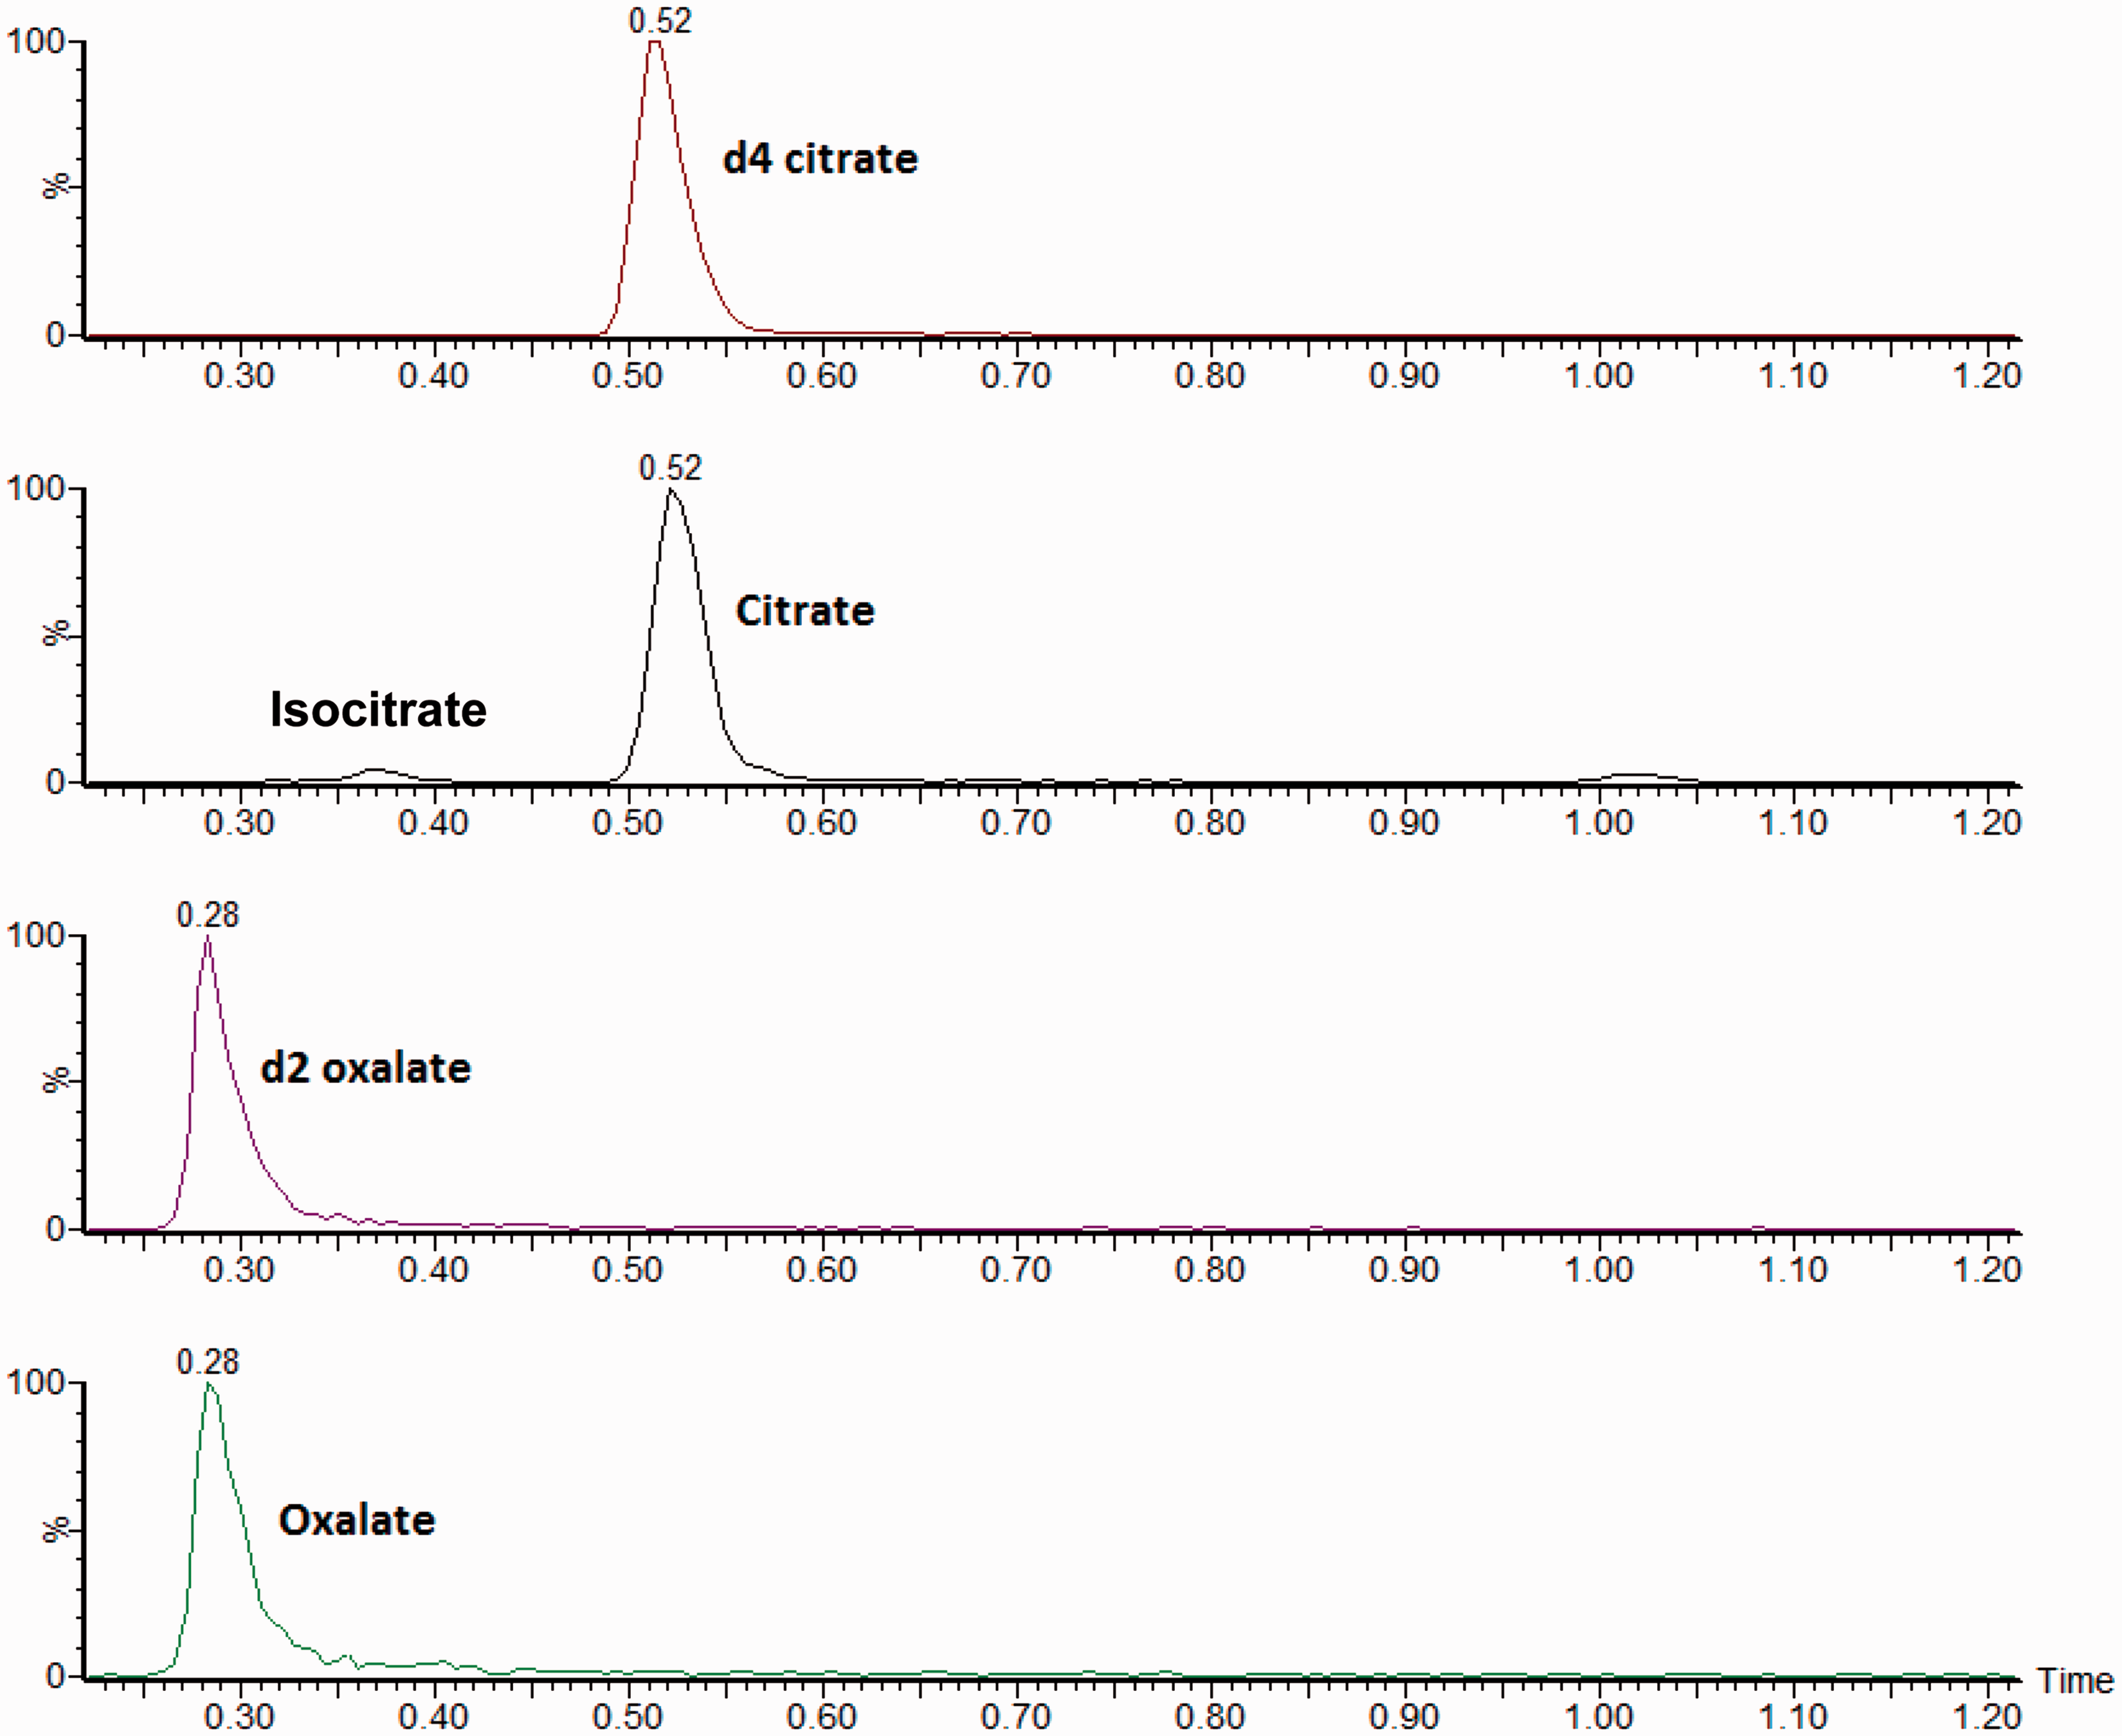
Ion suppression was negligible for citrate, as the matrix effect was 10% or less; however, the ion suppression was significant for oxalate, and the matrix effect varied between −23% and +65.1%, thus showing that the different matrices in the urine samples had a profound effect. The matrix effect was compensated by the internal standard present in every sample as indicated by the recovery experiments – the mean recovery following the addition of oxalate to six urine samples was 100.3% (range: 95.2–106.8%) and following the addition of citrate was 102.7% (range: 95.6–110.1%).
The results of the imprecision studies in prepared PBS-based quality control samples.
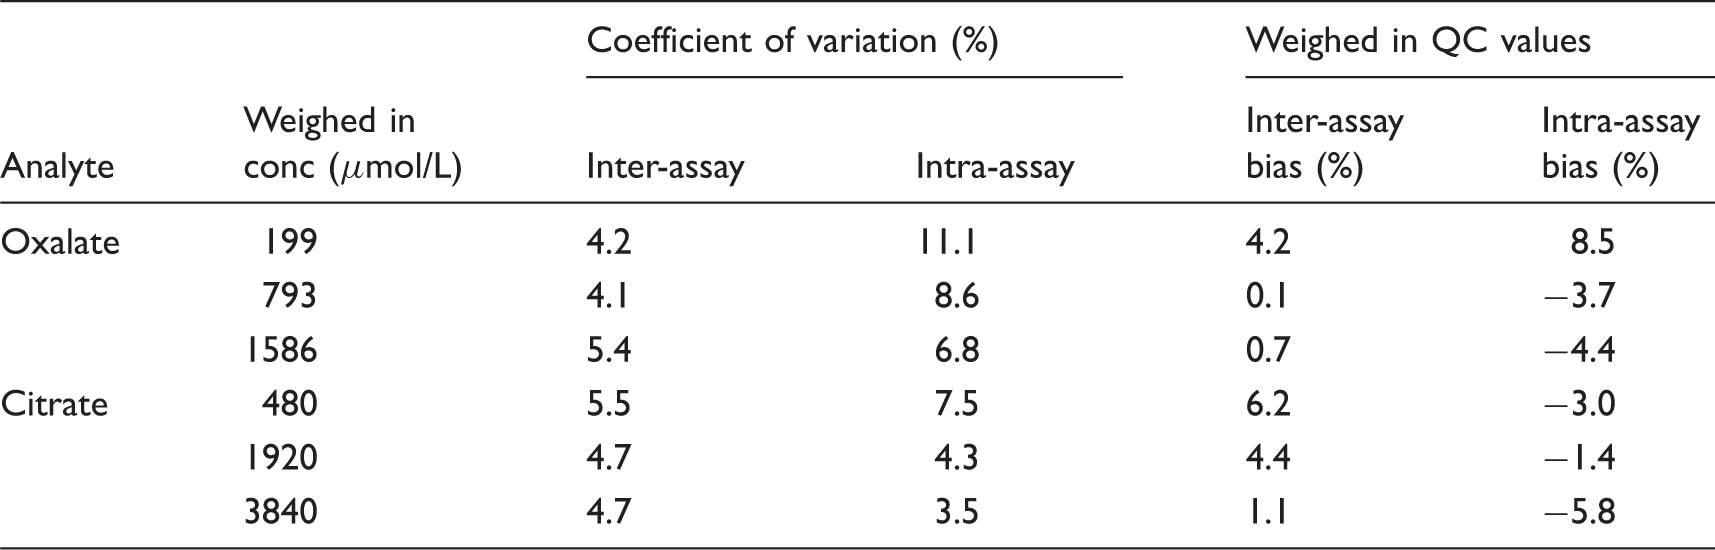
QC: quality control.
Repeated analysis at the limit of quantification (LOQ) for oxalate (60 µmol/L) and citrate (50 µmol/L) using freshly made QC material at these concentrations gave CVs of 6% or less for both analytes with a bias of −2% for oxalate and −9% for citrate. We confirmed that the CV was acceptable in matrixed samples by analysing 10 oxalate samples at concentrations around the LOQ of the assay which gave a CV of 8%. Interference studies showed a response below the LLOQ for all the compounds tested listed in the Materials and methods section (data not shown). Isocitrate does share the same transition as citrate, but the analytical column eliminates interference by chromatographically separating these compounds (shown in Figure 1).
Postextraction stability studies showed the plate to be stable at 4℃ for 72 h, and re-analysis of the plate was carried out on the same mass spectrometer which showed the results to be very similar, i.e. <1% deviation from the original.
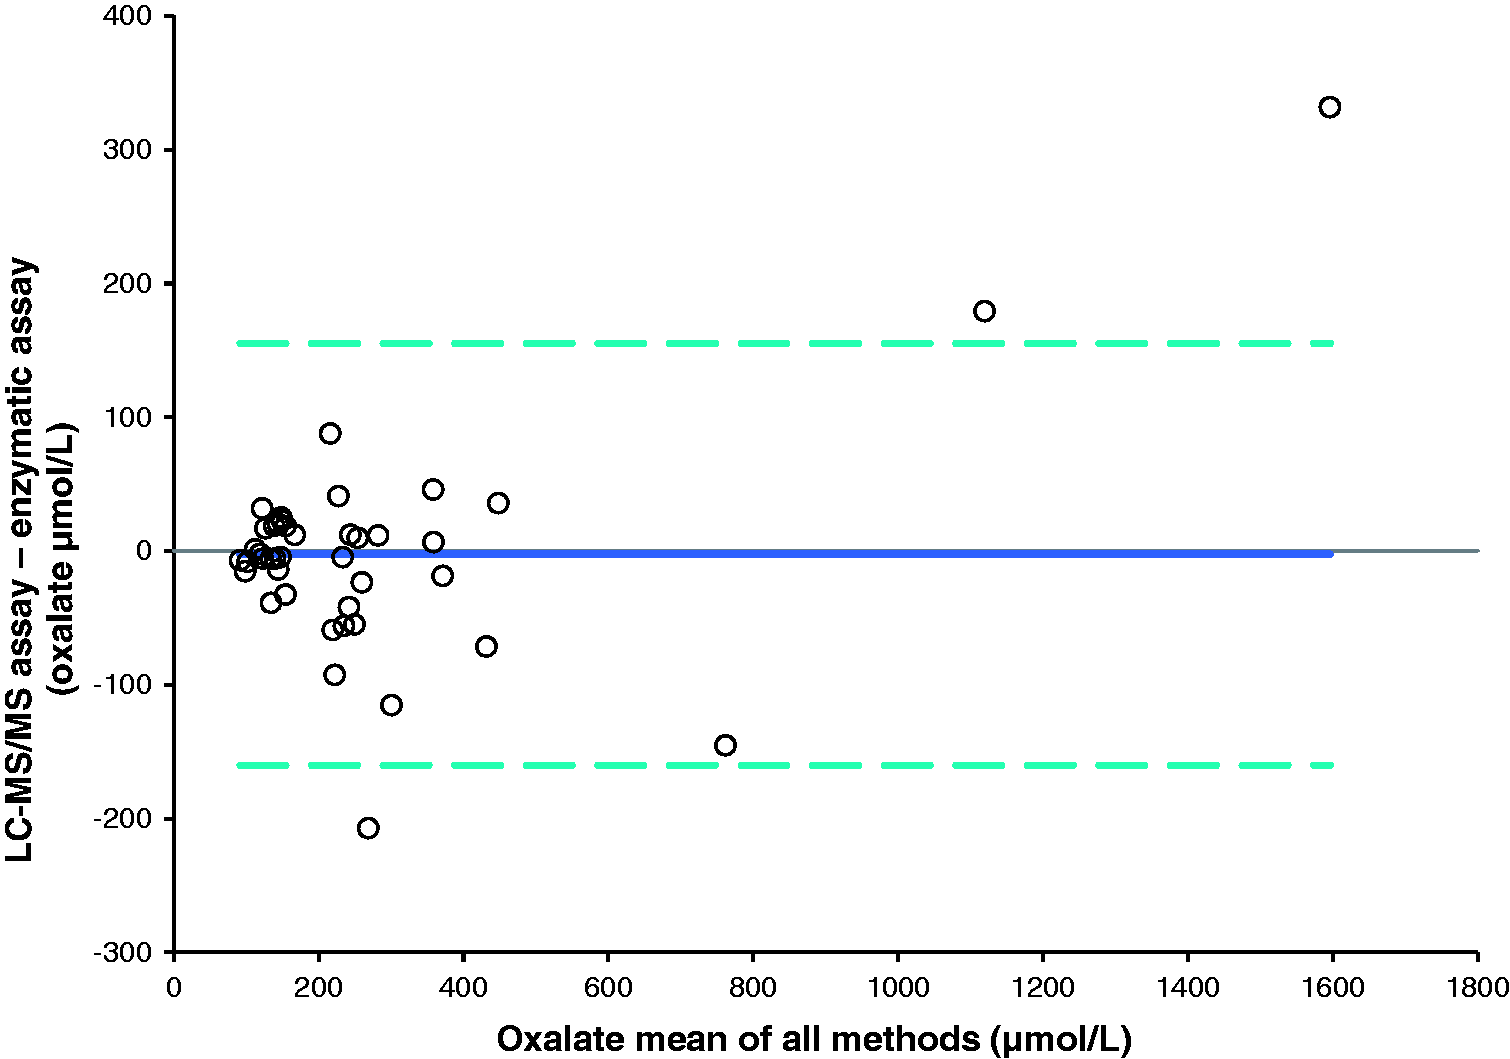
A method comparison of urine samples analysed by this assay against an established in-house assay for citrate (n = 47) and an enzymatic assay for oxalate (n = 42) gave Bland-Altman plots shown in Figures 2 and 3, respectively. The mean bias for citrate was 72.1 µmol/L (95% CI: 0.8 to 143.4 µmol/L), Passing-Bablok analysis gave an equation of: new assay = 1.05 × existing assay + 27.46 µmol/L. The Pearson correlation r value was 0.99 for citrate. The mean bias for oxalate was −2.5 µmol/L (95% CI: −22.6 to 27.6 µmol/L), Passing-Bablok analysis gave an equation of: new assay = 0.98 × enzymatic assay−0.82 µmol/L. The Pearson correlation r value was 0.97.
Bland-Altman plot comparing the combined LC-MS/MS assay with the previous LC-MS/MS assay for citrate, 95% limits of agreement −403.9 to 548.1 μmol/L. Bland-Altman plot comparing the LC-MS/MS assay with the enzymatic assay for oxalate, 95% limits of agreement −155.2 to 160.2 μmol/L.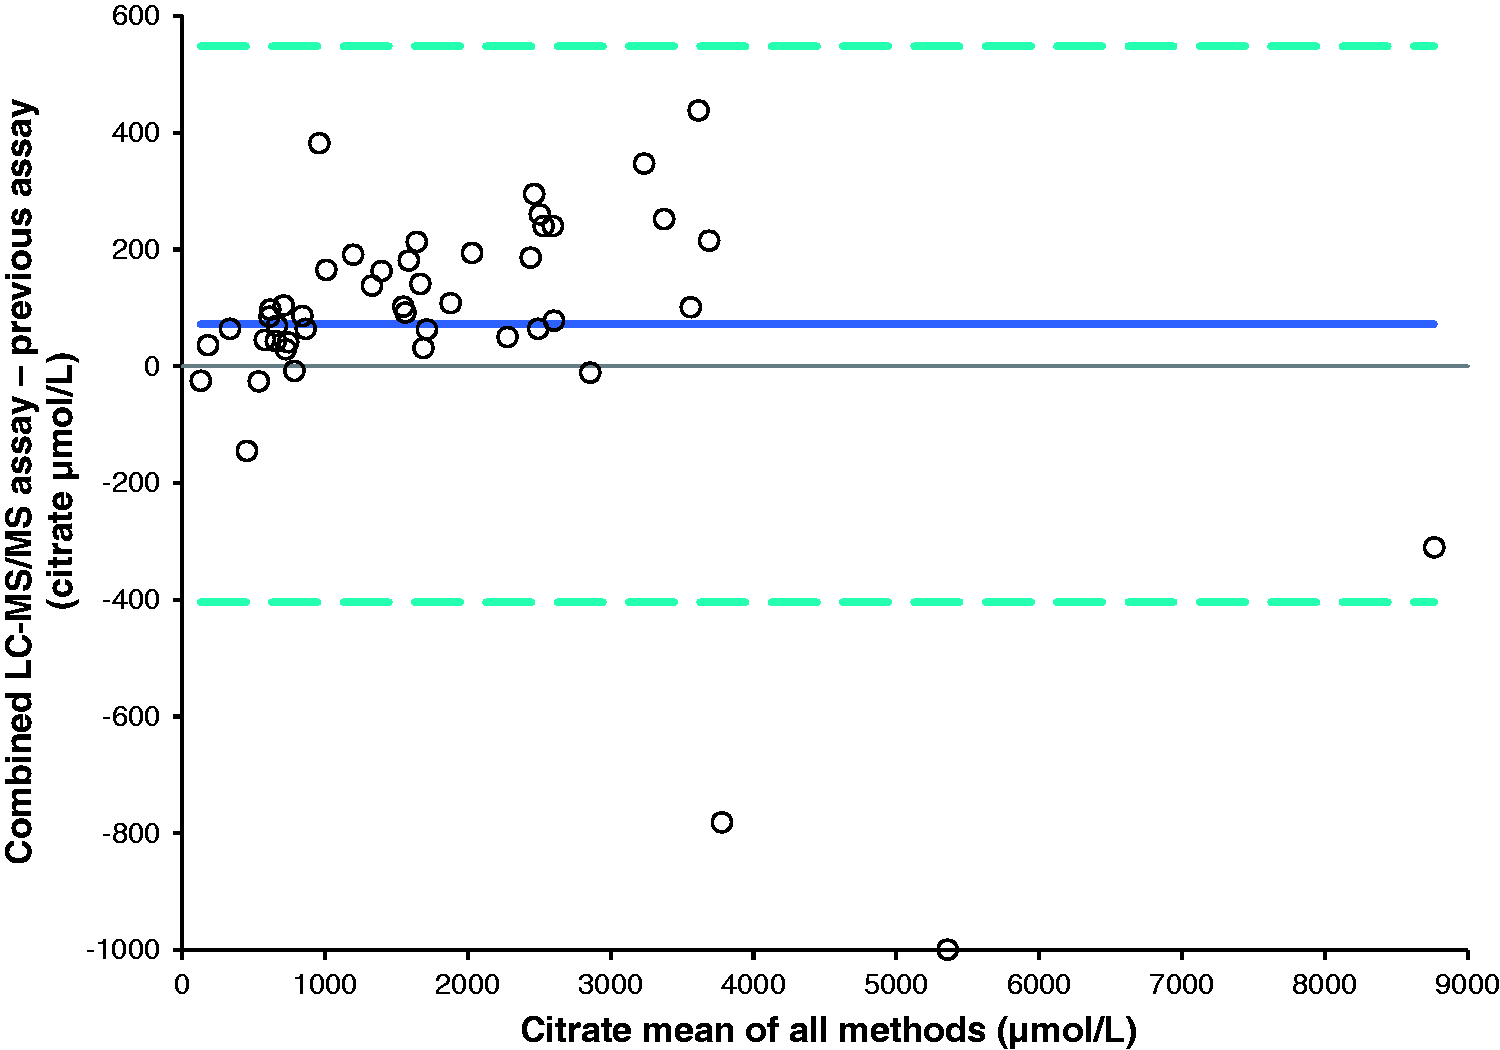
Discussion
We have developed an assay for oxalate and citrate using a sample clean-up step prior to analysis, citrate results compare well with our previous assay and oxalate well with a well-established oxalate oxidase commercial enzymatic method. The use of a WAX plate allows simultaneous quantification of citrate and oxalate in a clean sample suitable for MS purposes.
Previously reported oxalate assays have utilized sample derivatization using butanolic HCL; we attempted this and found our own method to be successful but due to the length of sample preparation, the hazardous reagents involved and variations in extraction efficiency we decided to move away from this to a simpler method. We had previously used a WAX analytical column which worked well, and hence we decided to utilize these principles in an SPE plate for our new method. Recovery studies performed well.
Citrate analysis by MS is less troublesome than oxalate; our previous method was relatively simple and consisted of mixing 10 µL of calibrator/sample with 20 µL of internal standard and 900 µL of water to dilute out any interference. Although this assay is perfectly acceptable, we wanted to combine analysis for citrate and oxalate, and hence the reason for change. The original method validation compared citrate results to the enzymatic method for citrate which showed good agreement; therefore, comparison of our new method to the old MS method is adequate for validation purposes.
MS is seen as a higher order method when compared with enzymatic methods; although it is expensive to implement MS, it is very diverse and can be used for a multitude of applications, therefore paying for itself quickly. With this in mind, carrying out oxalate and citrate analysis on an MS platform should give better results when compared with the enzymatic assay. The enzymatic assay requires multiple steps for analysis which is slow and error prone due to the use of multiple aliquot tubes and several transfer steps. Additionally, there is a potential for contamination from charcoal sediment which may cause erroneous results and have a detrimental effect on automated systems used. In contrast to this, the MS method is much more simple and easier for the operator; the use of deep well plates for sample prep allows the same position to be used throughout. A dirty charcoal extraction step is not required, and the only lengthy part of the assay is the drying down time where the operator can carry out other tasks. Additionally, the use of an internal standard compensates for any losses throughout the sample preparation process and also compensates for any ion suppression.
Comparison data for oxalate analysis using HPLC-MS/MS and oxalate oxidase.
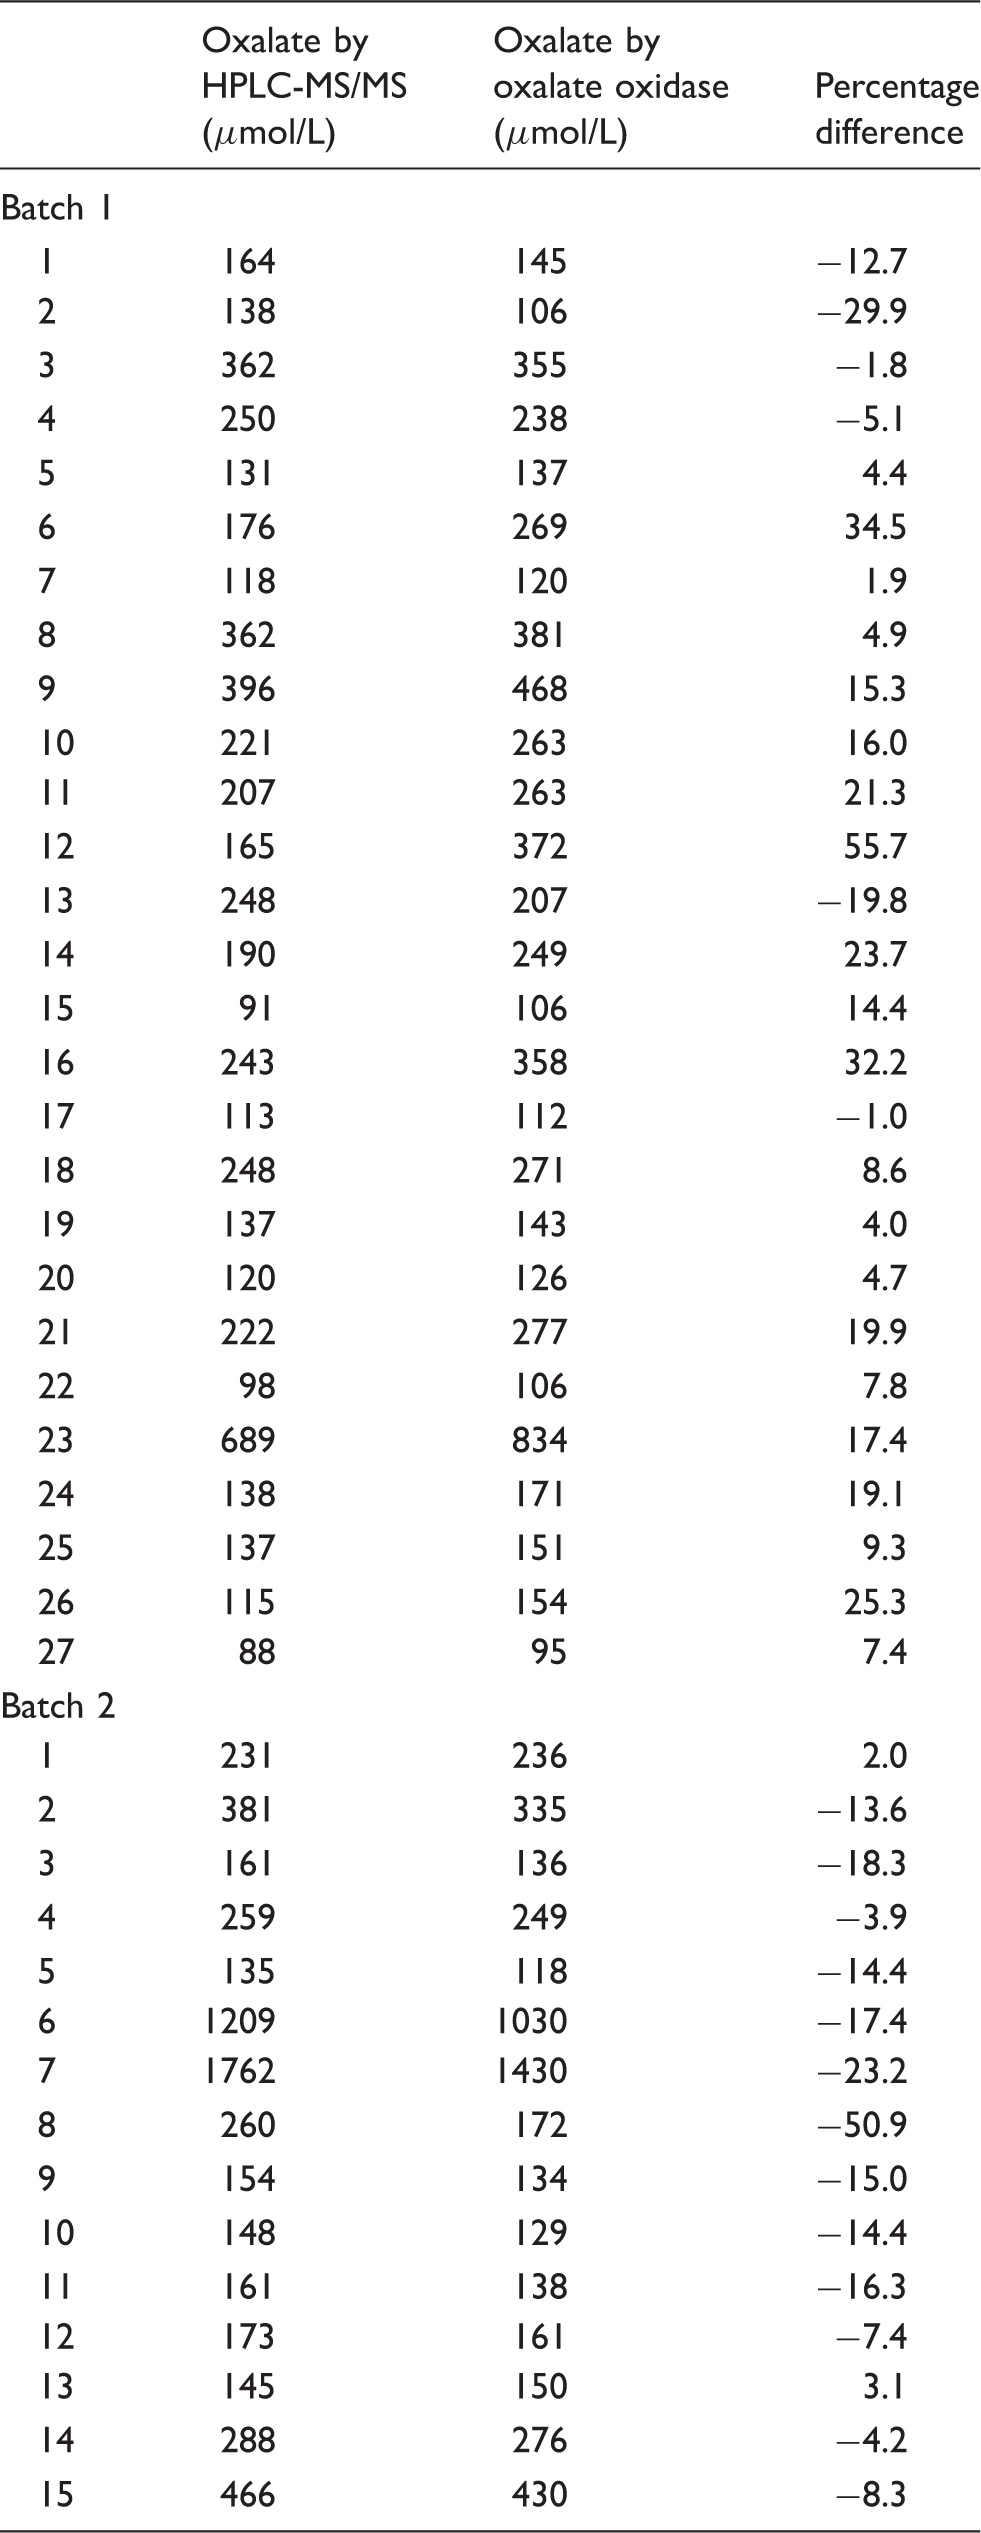
HPLC-MS/MS: high performance liquid chromatography-tandem mass spectrometry.
EQA samples for oxalate and citrate are sent by WEQAS in a UK wide scheme; currently, performance is judged against the ALTM which is generated from 23 laboratories, all using the oxalate oxidase method. The past five EQA returns from our laboratory have showed a slight positive bias for oxalate but not citrate, suggesting the oxalate oxidase method may be under-recovering. Analysis of 28 previous EQA samples showed the new LC-MS/MS method to exhibit a 13% positive bias when compared with the ALTM.
Periodically, EQA is sent which is omitted from the scheme after analysis due to high variability, thus suggesting there may be a problem with the enzymatic assay when certain samples are analysed. Cross-validation of the Trinity Biotech standards showed that they had good agreement with our standards and rules out calibration as a cause of the EQA differences. Additional investigation is required to identify the cause of this variation.
As documented oxalate and citrate are both are both troublesome compounds due to their highly polar nature, but we believe that our new assay is more than suitable for their quantification. The inclusion of citrate has made the process more efficient by reducing staff time and MS time required, thus freeing up staff members for other tasks. The method is simple, quick and reproducible in the routine biochemistry laboratory.
Footnotes
Declaration of conflicting interests
The author(s) declared no potential conflicts of interest with respect to the research, authorship, and/or publication of this article.
Funding
The author(s) received no financial support for the research, authorship, and/or publication of this article.
Ethical approval
Not applicable.
Guarantor
DJM.
Contributorship
BK, JA and DM co-designed the study.
JA and DM performed the study.
DM, JA and BK wrote the draft paper.
DM, JA and BK revised the draft paper.
DJM and JA performed the development and validation of the assay.
All authors have contributed to the manuscript.