
Abstract
Background
Coenzyme Q10 is an endogenous antioxidant as well as a popular dietary supplement. In blood circulation, coenzyme Q10 exists predominantly as its reduced ubiquinol-10 form, which readily oxidizes to ubiquinone-10 ex vivo. Plasma concentrations of coenzyme Q10 reflect net overall metabolic demand, and the ratio of ubiquinol-10:ubiquinone-10 has been established as an important biomarker for oxidative stress. However, the lability of ubiquinol-10 makes accurate determination of both forms of coenzyme Q10 difficult. Ex vivo oxidation of ubiquinol-10 to ubiquinone-10 during sample collection, processing and analysis may obfuscate the in vivo ratio.
Methods
We developed a rapid and sensitive method for the determination of ubiquinol-10 and ubiquinone-10 in human plasma, using coenzyme Q9 analogues as internal standards. Single-step protein precipitation in 1-propanol, a lipophilic and water-soluble alcohol, allowed for rapid extraction.
Results
Analysis by ultra performance liquid chromatography-tandem mass spectrometry provided rapid run-time and high sensitivity, with lower limits of quantitation for ubiquinol-10 and ubiquinone-10 of 5 μg/L and 10 μg/L, respectively.
Conclusions
This method is suitable for clinical studies with coenzyme Q10 supplementation in various disease states where this lipid-antioxidant may be beneficial. We have applied this method to >300 plasma samples from coenzyme Q10 research studies in chronic haemodialysis patients and postsurgical patients.
Introduction
Coenzyme Q10 (ubiquinone, CoQ10) is an endogenous lipophilic benzoquinone and a vital component of aerobic cellular respiration, coupling electron transport to oxidative phosphorylation in mitochondria. It is synthesized in the human body by a pathway similar to that of cholesterol; systemic concentrations may be affected by diet, disease and drugs that inhibit the mevalonate pathway such as statins. Approximately 95% of CoQ10 in circulation and tissues exists in its reduced form (ubiquinol, UL10), which functions as a potent antioxidant by preventing lipid peroxidation in cellular membranes and low-density lipoproteins (LDL) through its own oxidation to ubiquinone (UN10).1,2 Therefore, the ratio of UL10:UN10 is considered a biomarker for oxidative stress, 3 and the accurate determination of both forms of CoQ10 is needed in several clinical research areas.
While many analytical methods exist for determining the UL10:UN10 ratio in plasma, gaining an accurate snapshot of a ratio that represents in vivo proportions is highly challenging. Oxidation of UL10 during sample collection, storage, processing and analysis can obfuscate a meaningful interpretation of redox status. Therefore, a number of reported methods avoid separation of UL10 and UN10, instead chemically oxidizing UL10 and measuring total CoQ10 (TQ10) only.4–7 In these cases, a very fast and highly sensitive assay is not required, and HPLC coupled with UV detection is sufficient. To effectively measure both UL10 and UN10 simultaneously and with high sensitivity, HPLC coupled with electrochemical detection (ECD) or tandem mass spectrometry is the preferred approach.4,8,9 The specificity of tandem mass spectrometry is superior to that of ECD, 4 while yielding a similar lower limit of detection (LOD).
Methods for extracting CoQ10 from human plasma have also varied considerably, ranging from solid-phase extraction procedures 10 to liquid–liquid extractions using hexane8,11,12 to protein precipitation using 1-propanol.7,13–15 We found that liquid–liquid extraction in hexane, followed by evaporation and reconstitution, resulted in significant oxidation of UL10. Single-phase extraction through protein precipitation offers the fastest and most accurate method in determining plasma UL10:UN10 ratio. The high lipophilicity of 1-propanol, as well as its miscibility with water, allows for more efficient extraction of CoQ10 than 2-propanol or other short-chain alcohols. 16 With these considerations, we developed a quantitative method combining extraction of human plasma in 1-propanol (containing CoQ9 analogues as internal standards) and direct injection of the extract onto an ultra performance liquid chromatography-electrospray-tandem mass spectrometry (UPLC-ESI(+)-MS/MS) system. Through use of a rapid resolution chromatographic column and high flow rate, the run time per sample was kept under 5 min, optimizing analysis of UL10 and UN10 within a limited time window of stability.
Experimental
Chemicals and reagents
Hexane, 1-propanol, 2-propanol, ethanol and methanol were obtained from Fisher Biosciences (Fair Lawn, NJ). EDTA, ammonium formate, oxidized form of CoQ10 and coenzyme Q9, sodium borohydride and 1,4-benzoquinone were obtained from Sigma-Aldrich (St. Louis, MO).
Preparation of standards
Oxidized CoQ10 (ubiquinone UN10) was dissolved in hexane to produce a primary stock standard at a concentration of 500 mg/L. The stock was stored in aliquots at −80℃. A new stock was prepared monthly. A working CoQ10 standard was prepared daily by diluting the primary stock in ethanol to produce a final concentration of 1 mg/L and kept on wet ice during preparation of the standard curve.
Reduced CoQ10 (ubiquinol, UL10) standard was prepared fresh daily as follows. Oxidized CoQ10 stock of 100 μL (above) was mixed with 1900 μL of hexane in a screw-cap glass tube. Fifty microlitres of methanol and 20 mg of sodium borohydride were added. The tube was capped and shaken by hand for 3 min, and then placed in the dark for 5 min to complete the reduction. One millilitre of water containing 100 μM EDTA was added and the tube was shaken for 1 min. The mixture was centrifuged (1500 g, 5 min, 4℃). The upper hexane layer was transferred to a clean glass tube. Hexane layer of 200 μL was diluted with 800 μl of ethanol to produce a final reduced CoQ10 concentration of 5 mg/L. The standard was kept on wet ice during preparation of the calibration set.
Preparation of internal standards
Internal standard coenzyme Q9 (oxidized form), was dissolved in hexane to produce a primary stock standard at a concentration of 500 mg/L. The stock was stored in aliquots at −80℃. A new stock was prepared monthly.
Coenzyme Q9 (reduced form) standard was prepared daily as follows. Coenzyme Q9 (oxidized form) 100 μL of stock (above) was mixed with 1900 μL of hexane in a screw-cap glass tube. Fifty microlitres of methanol and 20 mg of sodium borohydride were added. The tube was capped and shaken by hand for 3 min, and then placed in the dark for 5 min to complete the reduction. One millilitre of water containing 100 μM EDTA was added and the tube was shaken for 1 min. The mixture was centrifuged (1500 g, 5 min, 4℃). The upper hexane layer was transferred to a clean glass tube.
A working internal standard solution was prepared by diluting 5 μL of coenzyme Q9 (oxidized form) primary stock and 100 μL of coenzyme Q9 (reduced form) standard to 10 mL with 1-propanol to produce a final concentration of 250 μg/L each. The working internal standard was prepared daily and kept on wet ice during sample preparation.
Preparation of standard curves
Separate sets of calibration standards were prepared for the oxidized and reduced forms of CoQ10; this allowed ready detection of unacceptable redox conversion. Ethanol was used as the matrix for the calibration standards; both oxidized and reduced CoQ10 were stable in ethanol for the duration of a typical analysis. Two sets of 2-mL microcentrifuge tubes labelled 0, 0.5, 1, 2.5, 5, 10, 25 and 50 μL were prepared. To the first set of tubes, labelled amounts of oxidized CoQ10 were added along with ethanol to a total volume of 100 μl (calibration range of 5–500 μg/L). To the second set of tubes, labelled amounts of reduced CoQ10 were added along with ethanol to a total volume of 100 μL (calibration range of 25–2500 μg/L). Two hundred microlitres of working internal standard solution were added to each tube, thoroughly mixed and then transferred to a 96-well plate or autosampler vial for liquid chromatography-tandem mass spectrometry (LC-MS/MS) analysis.
Blood sample collection
Whole blood sample was collected in Vacutainers™ containing sodium heparin as an anticoagulant. Collected blood samples were immediately placed on wet ice and centrifuged (4℃, 5000 g, 5 min). Blood plasma was transferred to chilled cryo-tubes and immediately capped and frozen at −20℃, until its later transport to a −80℃ freezer within 48 h.
Quality control samples
Whole blood was collected from two sets of healthy volunteers. One set of volunteers had been taking CoQ10 supplements and the second group had taken no supplements. Blood from each group of volunteers were pooled; aliquots of supplemented (high-QC) and non-supplemented (low-QC) plasma were frozen at –80℃ and two aliquots from each pool were analysed alongside each set of samples.
Preparation of blood samples and controls
Plasma samples were thawed on ice and 100 μL of each sample was added to a 2-mL microcentrifuge tube. A total of 200 μL of working internal standard solution were added to each tube. Tubes were capped, vortexed well and centrifuged for 10 min (25,000 g, 10 min, 4℃). The supernatant was transferred to a 96-well plate and placed in the LC autosampler, which was kept at 4℃ for the duration of the run. Injection volume ranged from 2.5 to 5 μL.
It was found during method development that to assure stability and reproducibility, the sample set should be allowed to equilibrate in the 4℃ autosampler for at least 30 min before commencement of injection and no more than 12 clinical samples along with the calibrators and controls should be prepared during each run to avoid significant oxidation of the reduced CoQ10 in plasma extracts. While one set of samples and controls is being analysed on the LC-MS/MS, a second set of samples and controls may be prepared for analysis.
LC-MS/MS instrumentation and operating conditions
An Agilent G6410B triple-quadrupole mass spectrometer (equipped with ‘Hotbox’ upgrade) was coupled to an Agilent 1290 UPLC with binary pump, autosampler and column compartment. The LC column was an Agilent Zorbax SB-C18, 30 mm × 2.1 mm × 3.5 μm maintained at 40℃. The mobile phase was methanol containing 5 mM ammonium formate pumped at a rate of 0.8 mL/min. The run time was 4.2 min per injection.
The mass spectrometer source was operated in the positive ion electrospray mode. Drying gas was 10 L/min of nitrogen at 350℃. Nebulizer gas was nitrogen at 35 psig. Capillary voltage was 4000 V. The mass spectrometer was operated in the MRM mode with the following transitions. Coenzyme Q10 (oxidized): m/z 863.7→197.1, fragmentor = 220 V, CE = 41 V, dwell = 200 ms. Coenzyme Q10 (reduced): m/z 882.7→197.1, fragmentor = 160 V, CE = 25 V, dwell = 200 ms. Coenzyme Q9 (oxidized form): 795.6→197.1, fragmentor = 190 V, CE = 33 V, dwell = 200 ms. Coenzyme Q9 (reduced form): 814.7→197.1, fragmentor = 150 V, CE = 25 V, dwell = 200 ms.
Calibration curves were generated with peak heights and analysed with a second order polynomial fit by the MassHunter WorkStation.
Results and discussion
Extraction solvents and UL10:UN10 ratio
In the present study, several extraction procedures were evaluated, including a hexane liquid–liquid extraction and single-step protein precipitation using 1-propanol or 2-propanol. As other authors have concluded,4,15–17 1-propanol was the best solvent for CoQ10 extraction, both in terms of analyte recovery and stability in plasma UL10:UN10 ratio.
Optimization of the chromatographic method
The chromatographic method of Ruiz-Jiménez et al.
8
was adapted to our analytical system with minimal changes considering the similarity of our instrumentation and the robustness of the method for rapid separation of the four compounds of interest. A representative mass-ion chromatogram of a plasma sample is shown in Figure 1. UL9 eluted at approximately 1.1 min, followed by UL10 at 1.9 min, UN9 at 2.3 min and UN10 at 4.0 min. The retention times exhibited good stability over a 5 h run with ≤ 5% coefficient of variation.
Representative mass-ion chromatogram showing separation of UL10, UL9, UN9 and UN10. Structures of ubiquinone and ubiquinol, where n is the number of isoprene units in the side chain. UL10 and UN10 have 10 isoprene units, while UL9 and UN9 have 9 isoprene units; otherwise they are structurally identical.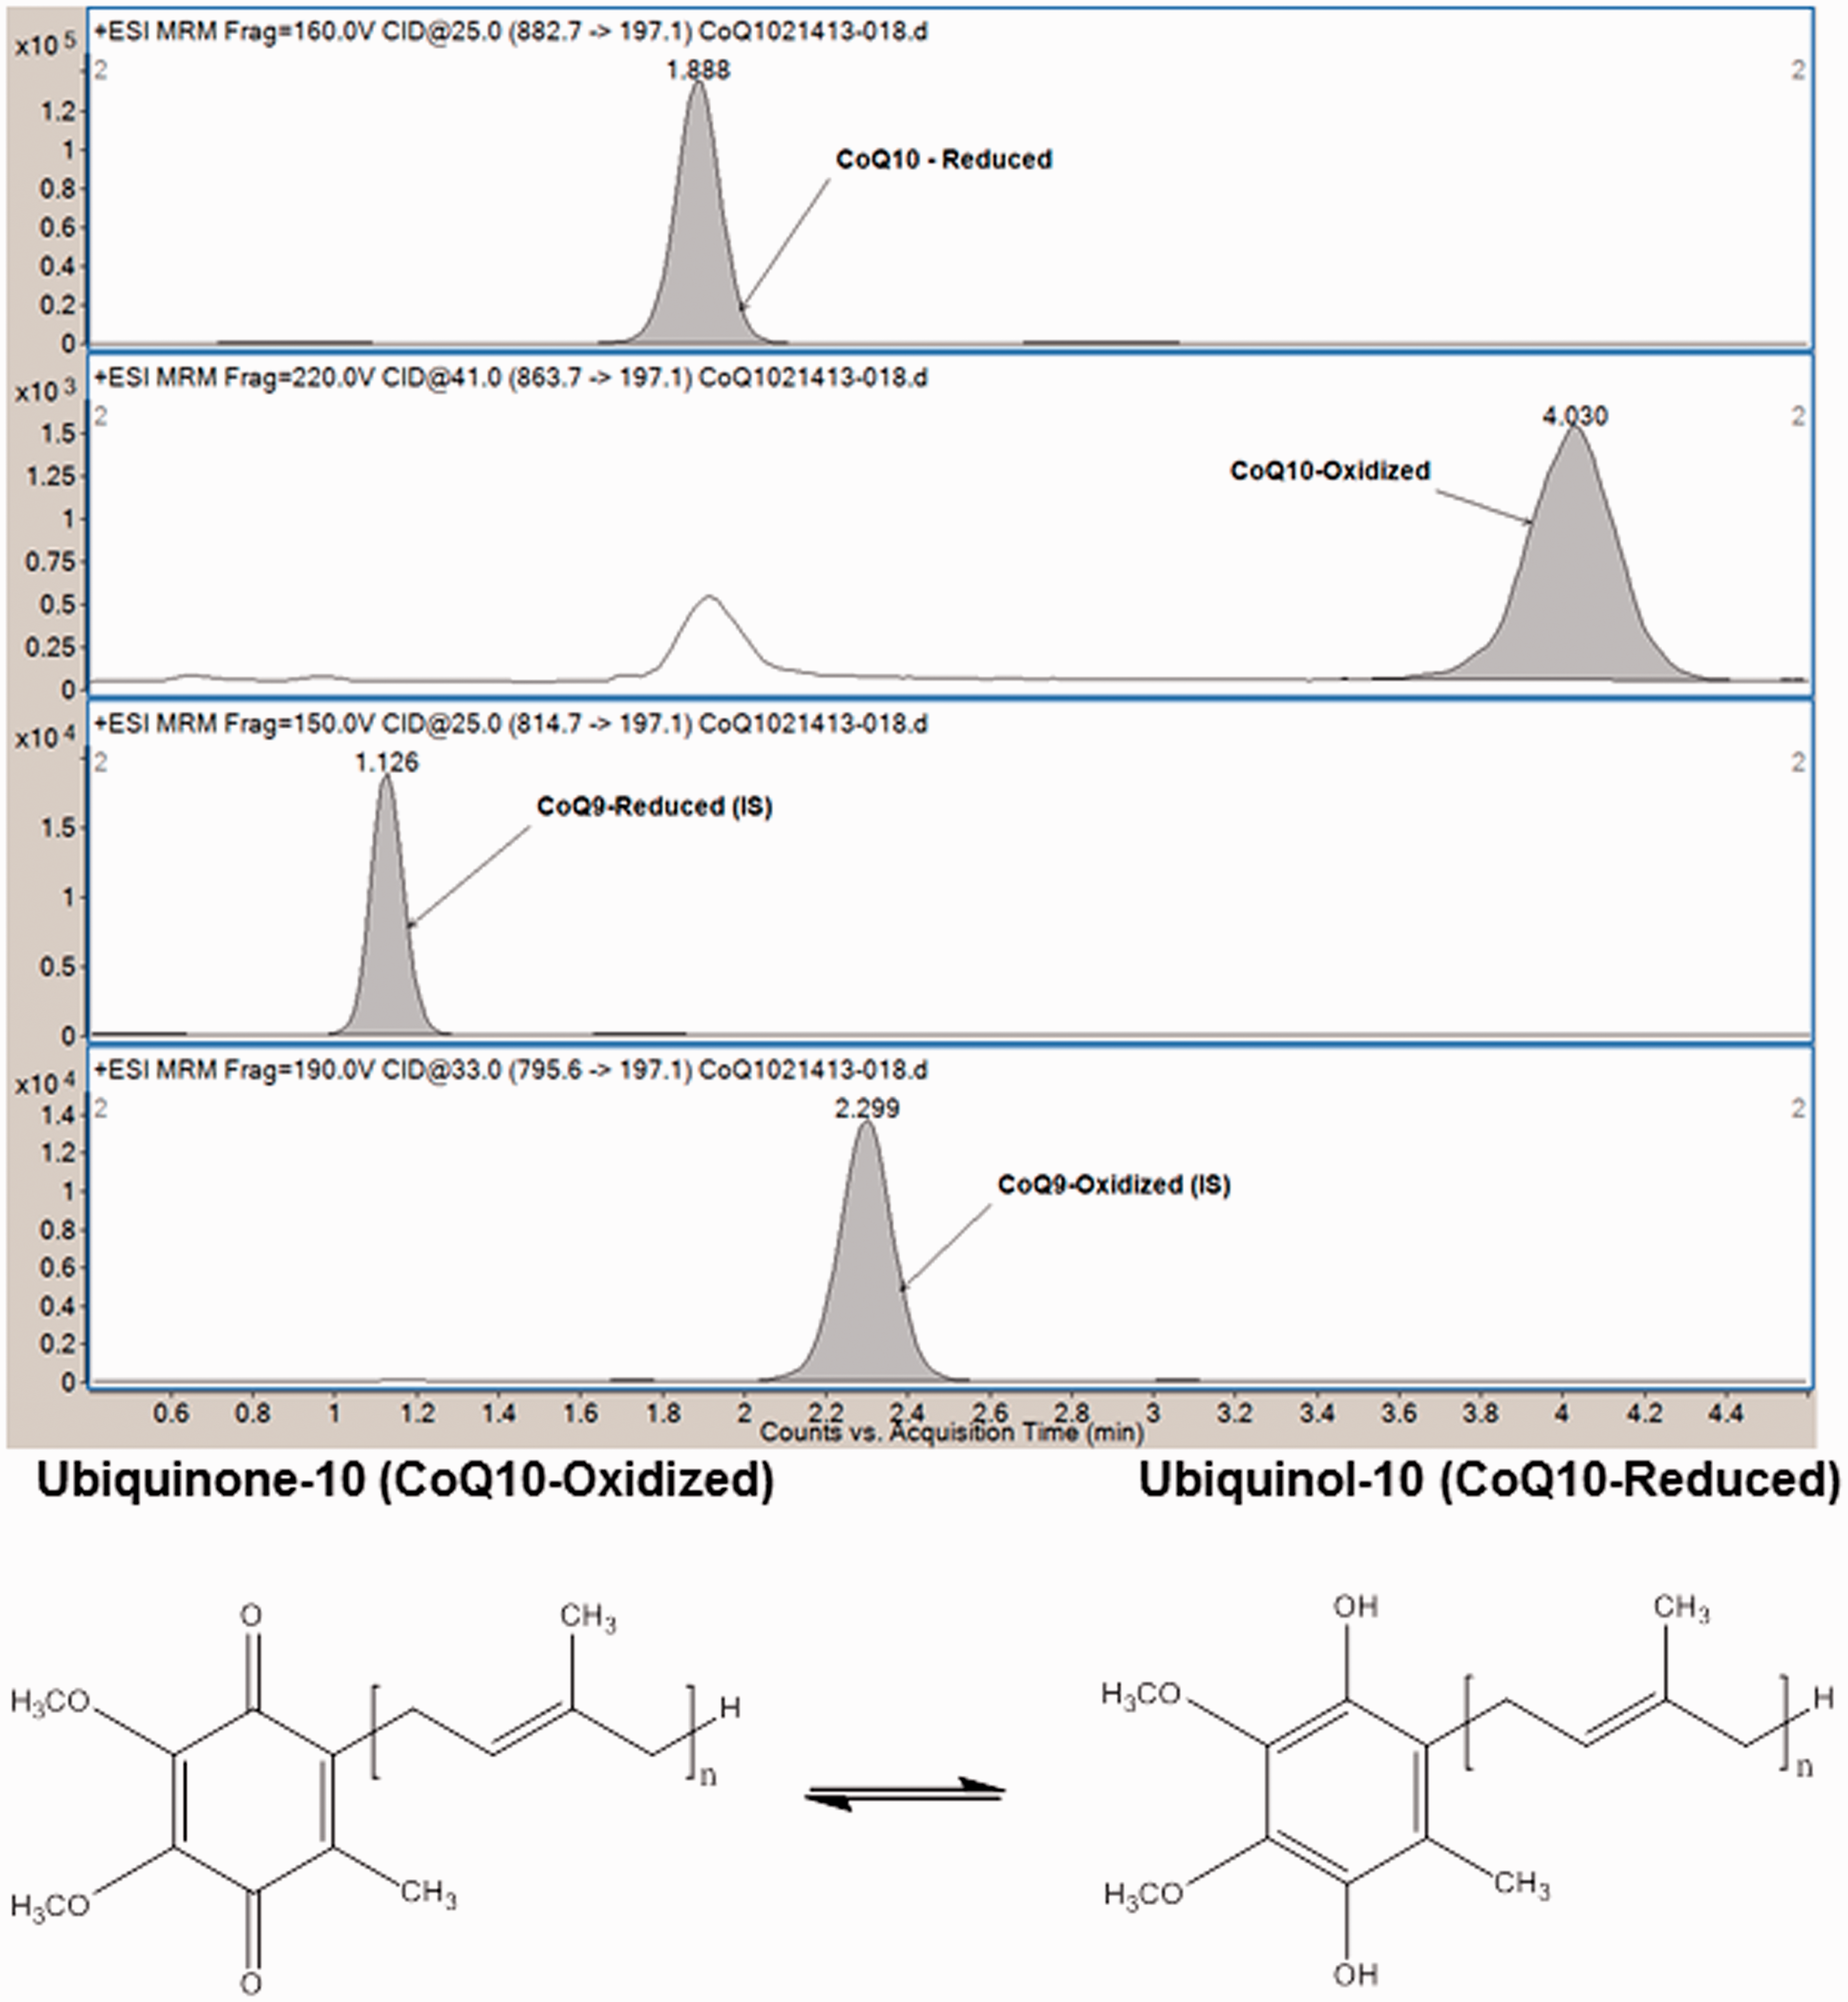
Optimization of the detection method
Chromatographic and detection parameters of UL10, UN10, UL9 and UN9.
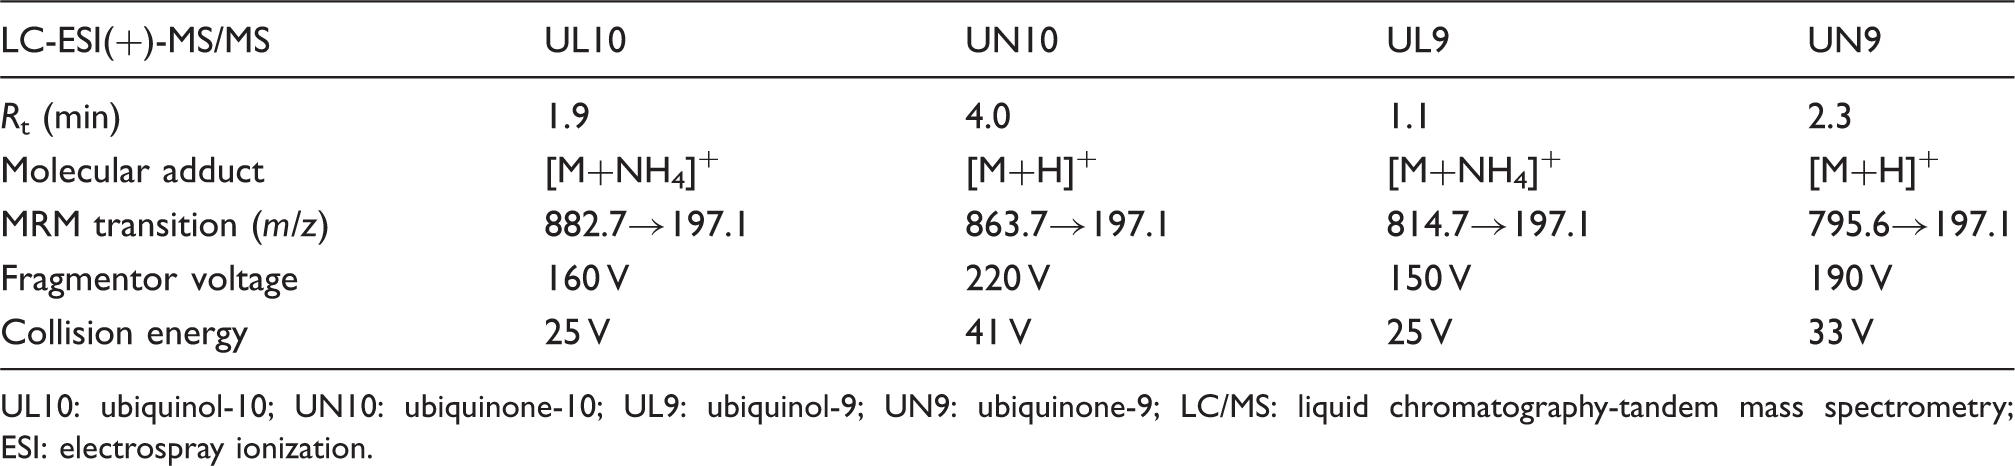
UL10: ubiquinol-10; UN10: ubiquinone-10; UL9: ubiquinol-9; UN9: ubiquinone-9; LC/MS: liquid chromatography-tandem mass spectrometry; ESI: electrospray ionization.
Method validation
Calibration curves were run for UL10 and UN10 with the peak height representing the standard concentration for each compound, using UL9 and UN9 as internal standards. LOD and lower limits of quantitation (LOQ) were set based on signal-to-noise ratios of 3 and 10, respectively; the LOQ has the additional criteria of accuracy ≤15% of the spiked concentration in triplicate samples. The LOD in plasma for this method was 1 μ/L for both UL10 and UN10, while the LOQ for UL10 and UN10 was 5 and 10 μg/L, respectively. The calibration range for UL10 was 5–500 μg/L and for UN10 it was 25–2500 μg/L, which cover the anticipated concentration ranges of plasma samples from both non-supplemented and high-dose supplemented human subjects; both curves consistently exhibited r2 ≥ 0.999 from run to run.
Pooled plasma samples, stored at −80℃, from non-supplemented and supplemented volunteers were used as low- and high-quality controls (QCs), respectively. Chromatographic precision of the instrumentation was evaluated by the reproducibility of 10 repeated injections of each QC sample. The precision for low QCs was 6.5% and 13.6% for UL10 and UN10, respectively; the precision for high QCs was 3.5% and 10.5% for UL10 and UN10, respectively. Intraday precision of the assay was evaluated by processing 10 samples each of low and high QCs, which were divided into two runs to keep the maximum number of samples per run under 12. Intraday precision for low QCs was 11.6% and 7.7% for UL10 and UN10, respectively; intraday precision for high QCs was 1.6% and 6.1% for UL10 and UN10, respectively. Linearity of sample volume was validated for a range of 0.025–0.1 mL with ≤ 15% coefficient of variation.
Benchtop stability of 1-propanol plasma extracts
Stability of the analytes and corresponding internal standards in autosampler at 4℃ over 4.5 h as indicated by their monitored mass ion peak heights (mean ± SD, n = 3–4).
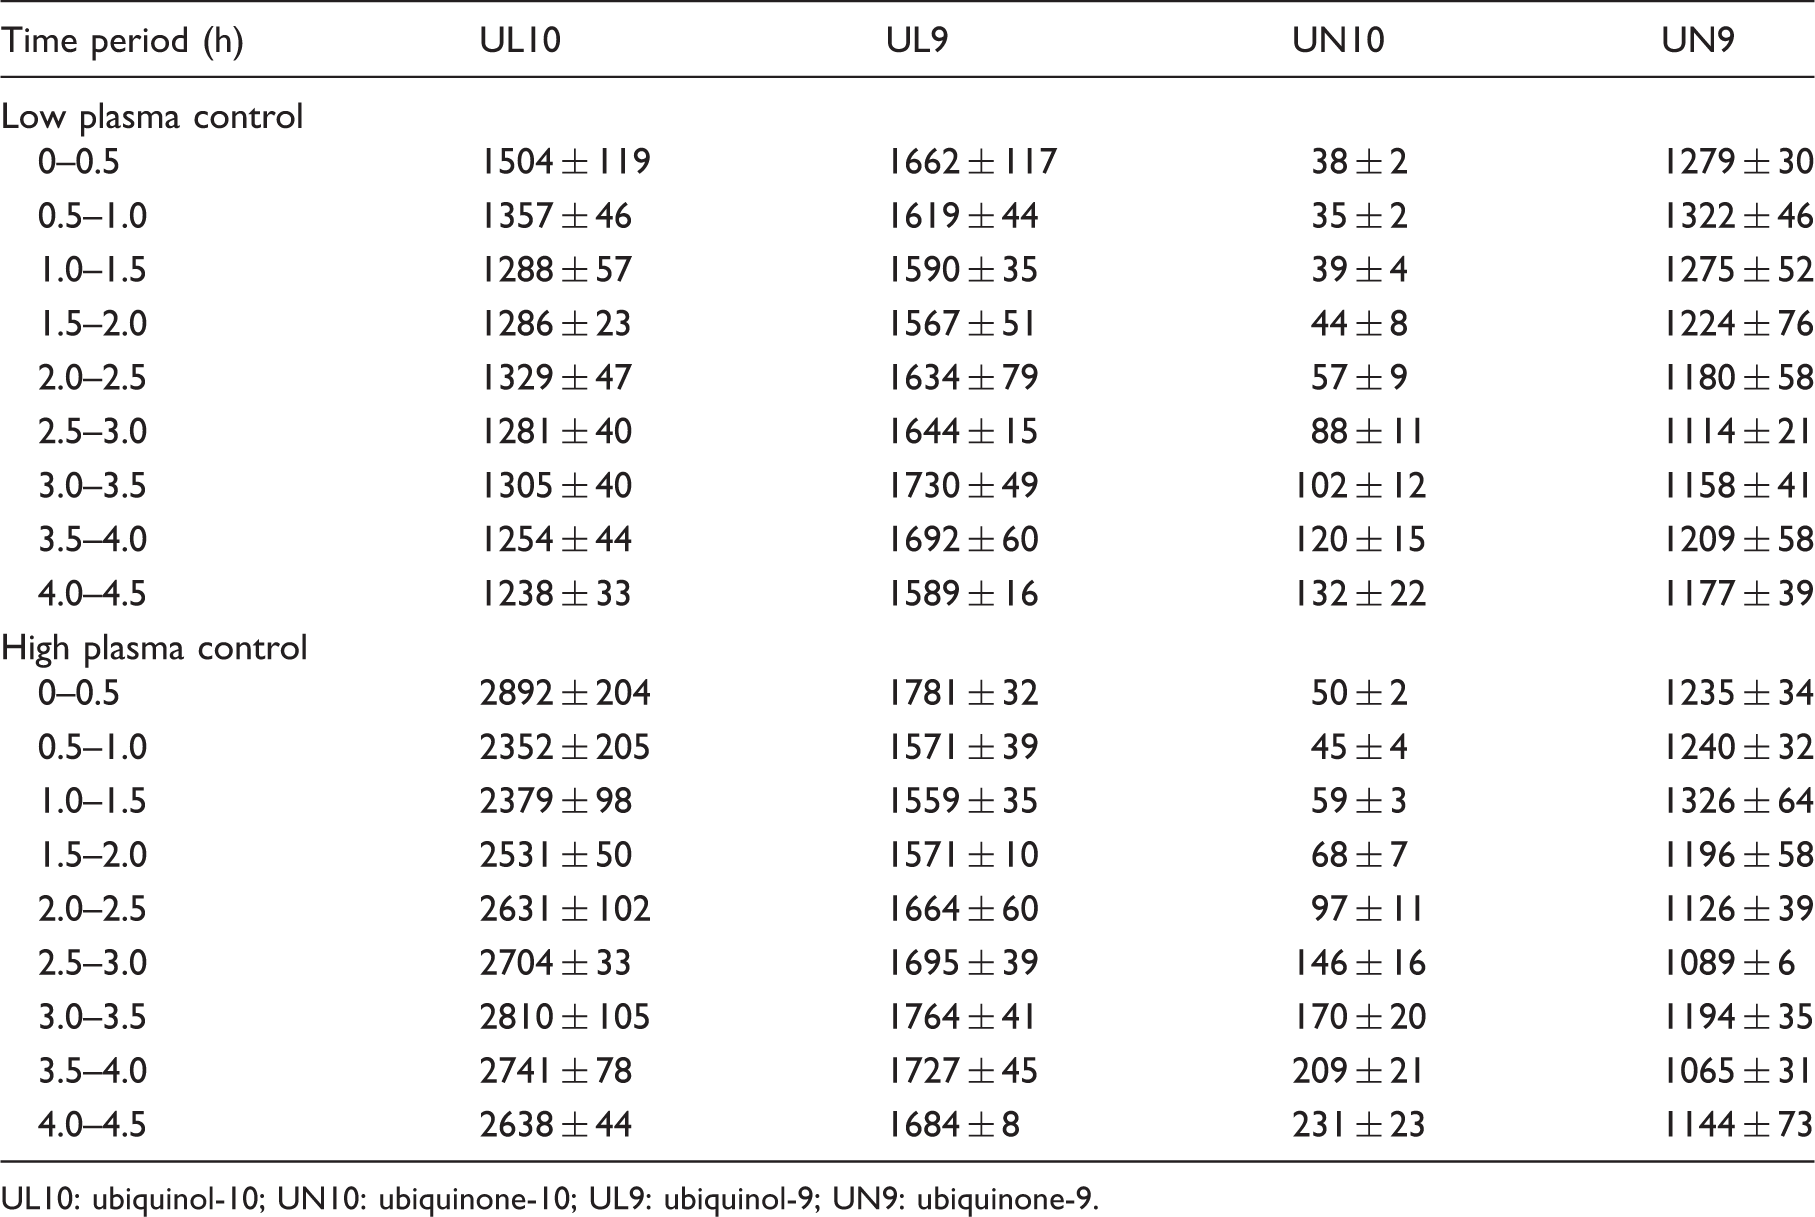
UL10: ubiquinol-10; UN10: ubiquinone-10; UL9: ubiquinol-9; UN9: ubiquinone-9.
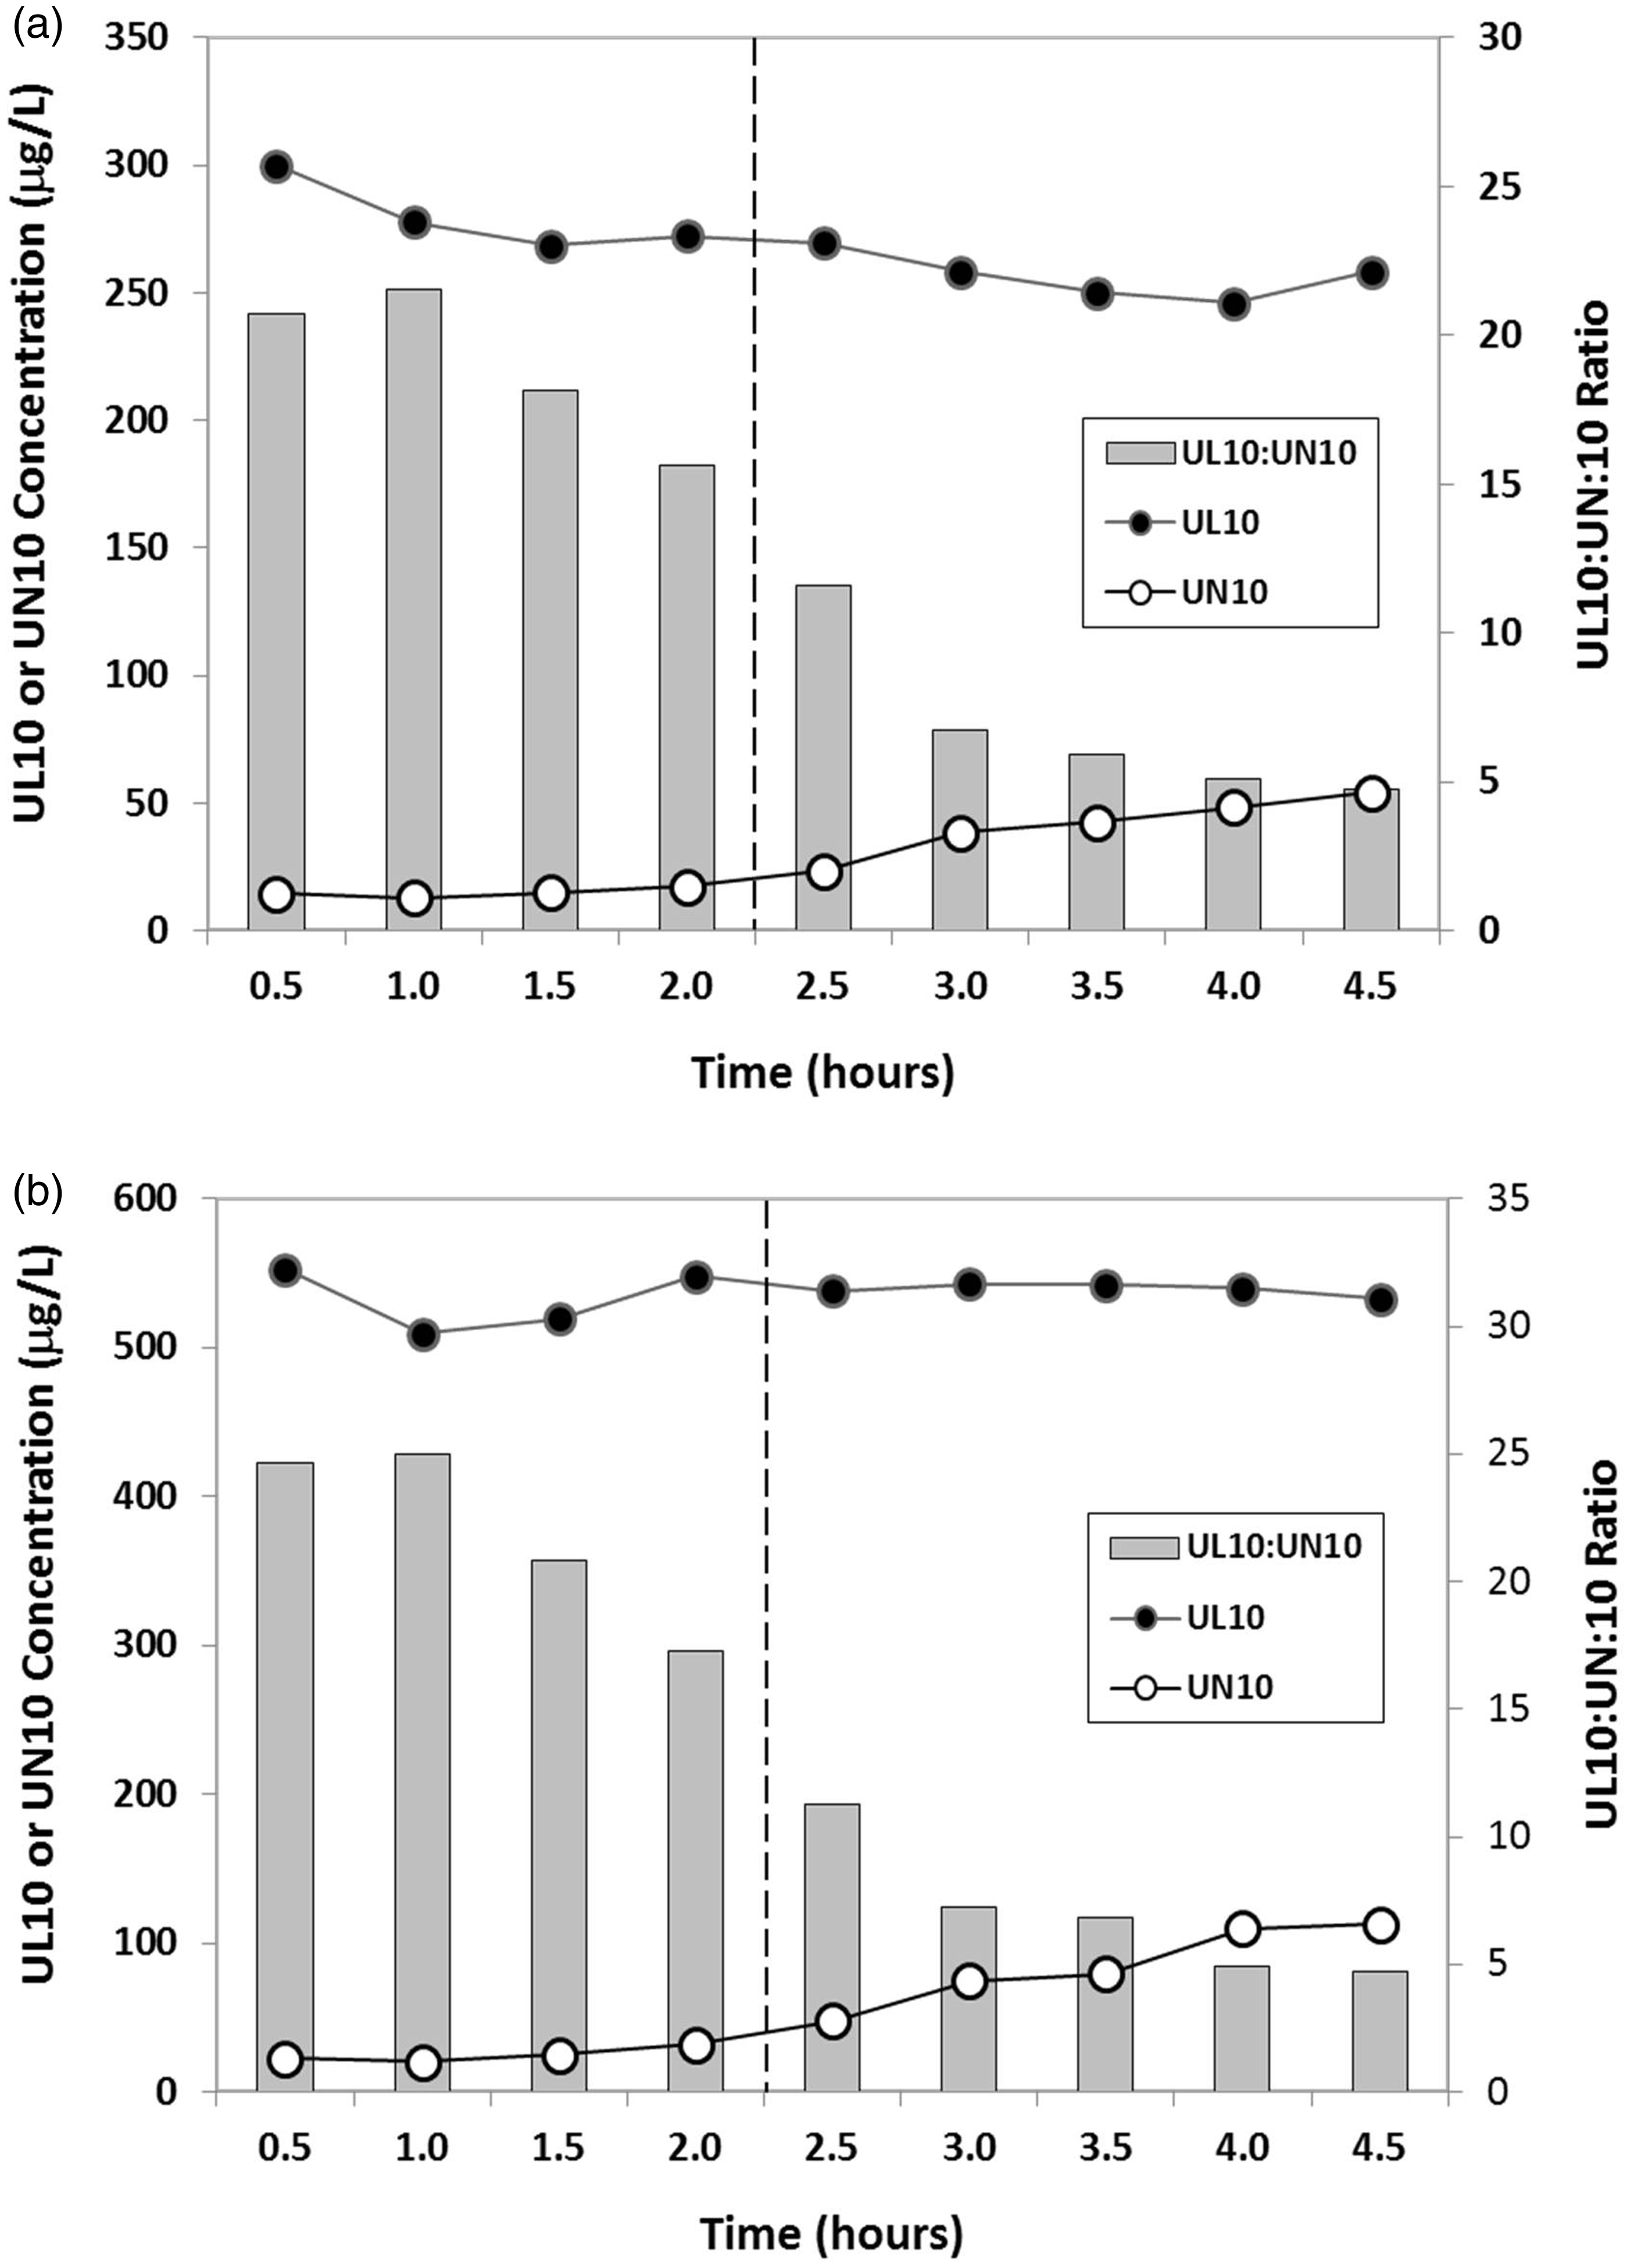
Stability of 1-propanol extract of low (a) and high (b) plasma quality controls in autosampler at 4℃ over 4.5 h. Injection of samples commenced after 30 min of equilibration. Significant oxidation of UL10 to UN10 in the 1-propanol extracts of human plasma spike occurred beyond 2 h.
Comparison of samples oxidized with 1,4-benzoquinone
To compare the current method with methods that measure TQ10 by chemical oxidation of plasma samples with 1,4-benzoquinone, we followed the procedure outlined by Hansen et al. 4 Low- and high-QC samples were analysed in triplicate for UL10 and UN10 concentration along with samples treated for 10 min with 1 mM 1,4-benzoquinone prior to extraction in 1-propanol. Benzoquinone-treated samples showed a complete disappearance of UL10 and a total CoQ10 recovery of 100.7 ± 11.8% indicating quantitative oxidation of UL10 to UN10.
Stability upon processing of blood samples
To accommodate multisite clinical studies, we have standardized the blood collection and processing protocol. All blood samples collected in heparinized tubes were immediately chilled in slush ice and centrifuged within 1 h of collection (2500 r/min, 4℃, 15 min) to harvest the plasma. Plasma samples were temporarily held in a −20℃ freezer at the study site until transfer to −80℃ freezer at the long-term storage site within 24 h. A short-term stability study was conducted with freshly collected plasma samples from a supplemented human subject comparing storage at −20℃ versus −80℃. Figure 3 shows that UL10 and UN10 in plasma were stable under either storage condition over 24 h.
Comparative short-term storage stability of UL10 and UN10 in freshly collected plasma samples from a supplemented human subject at −20℃ and −80℃.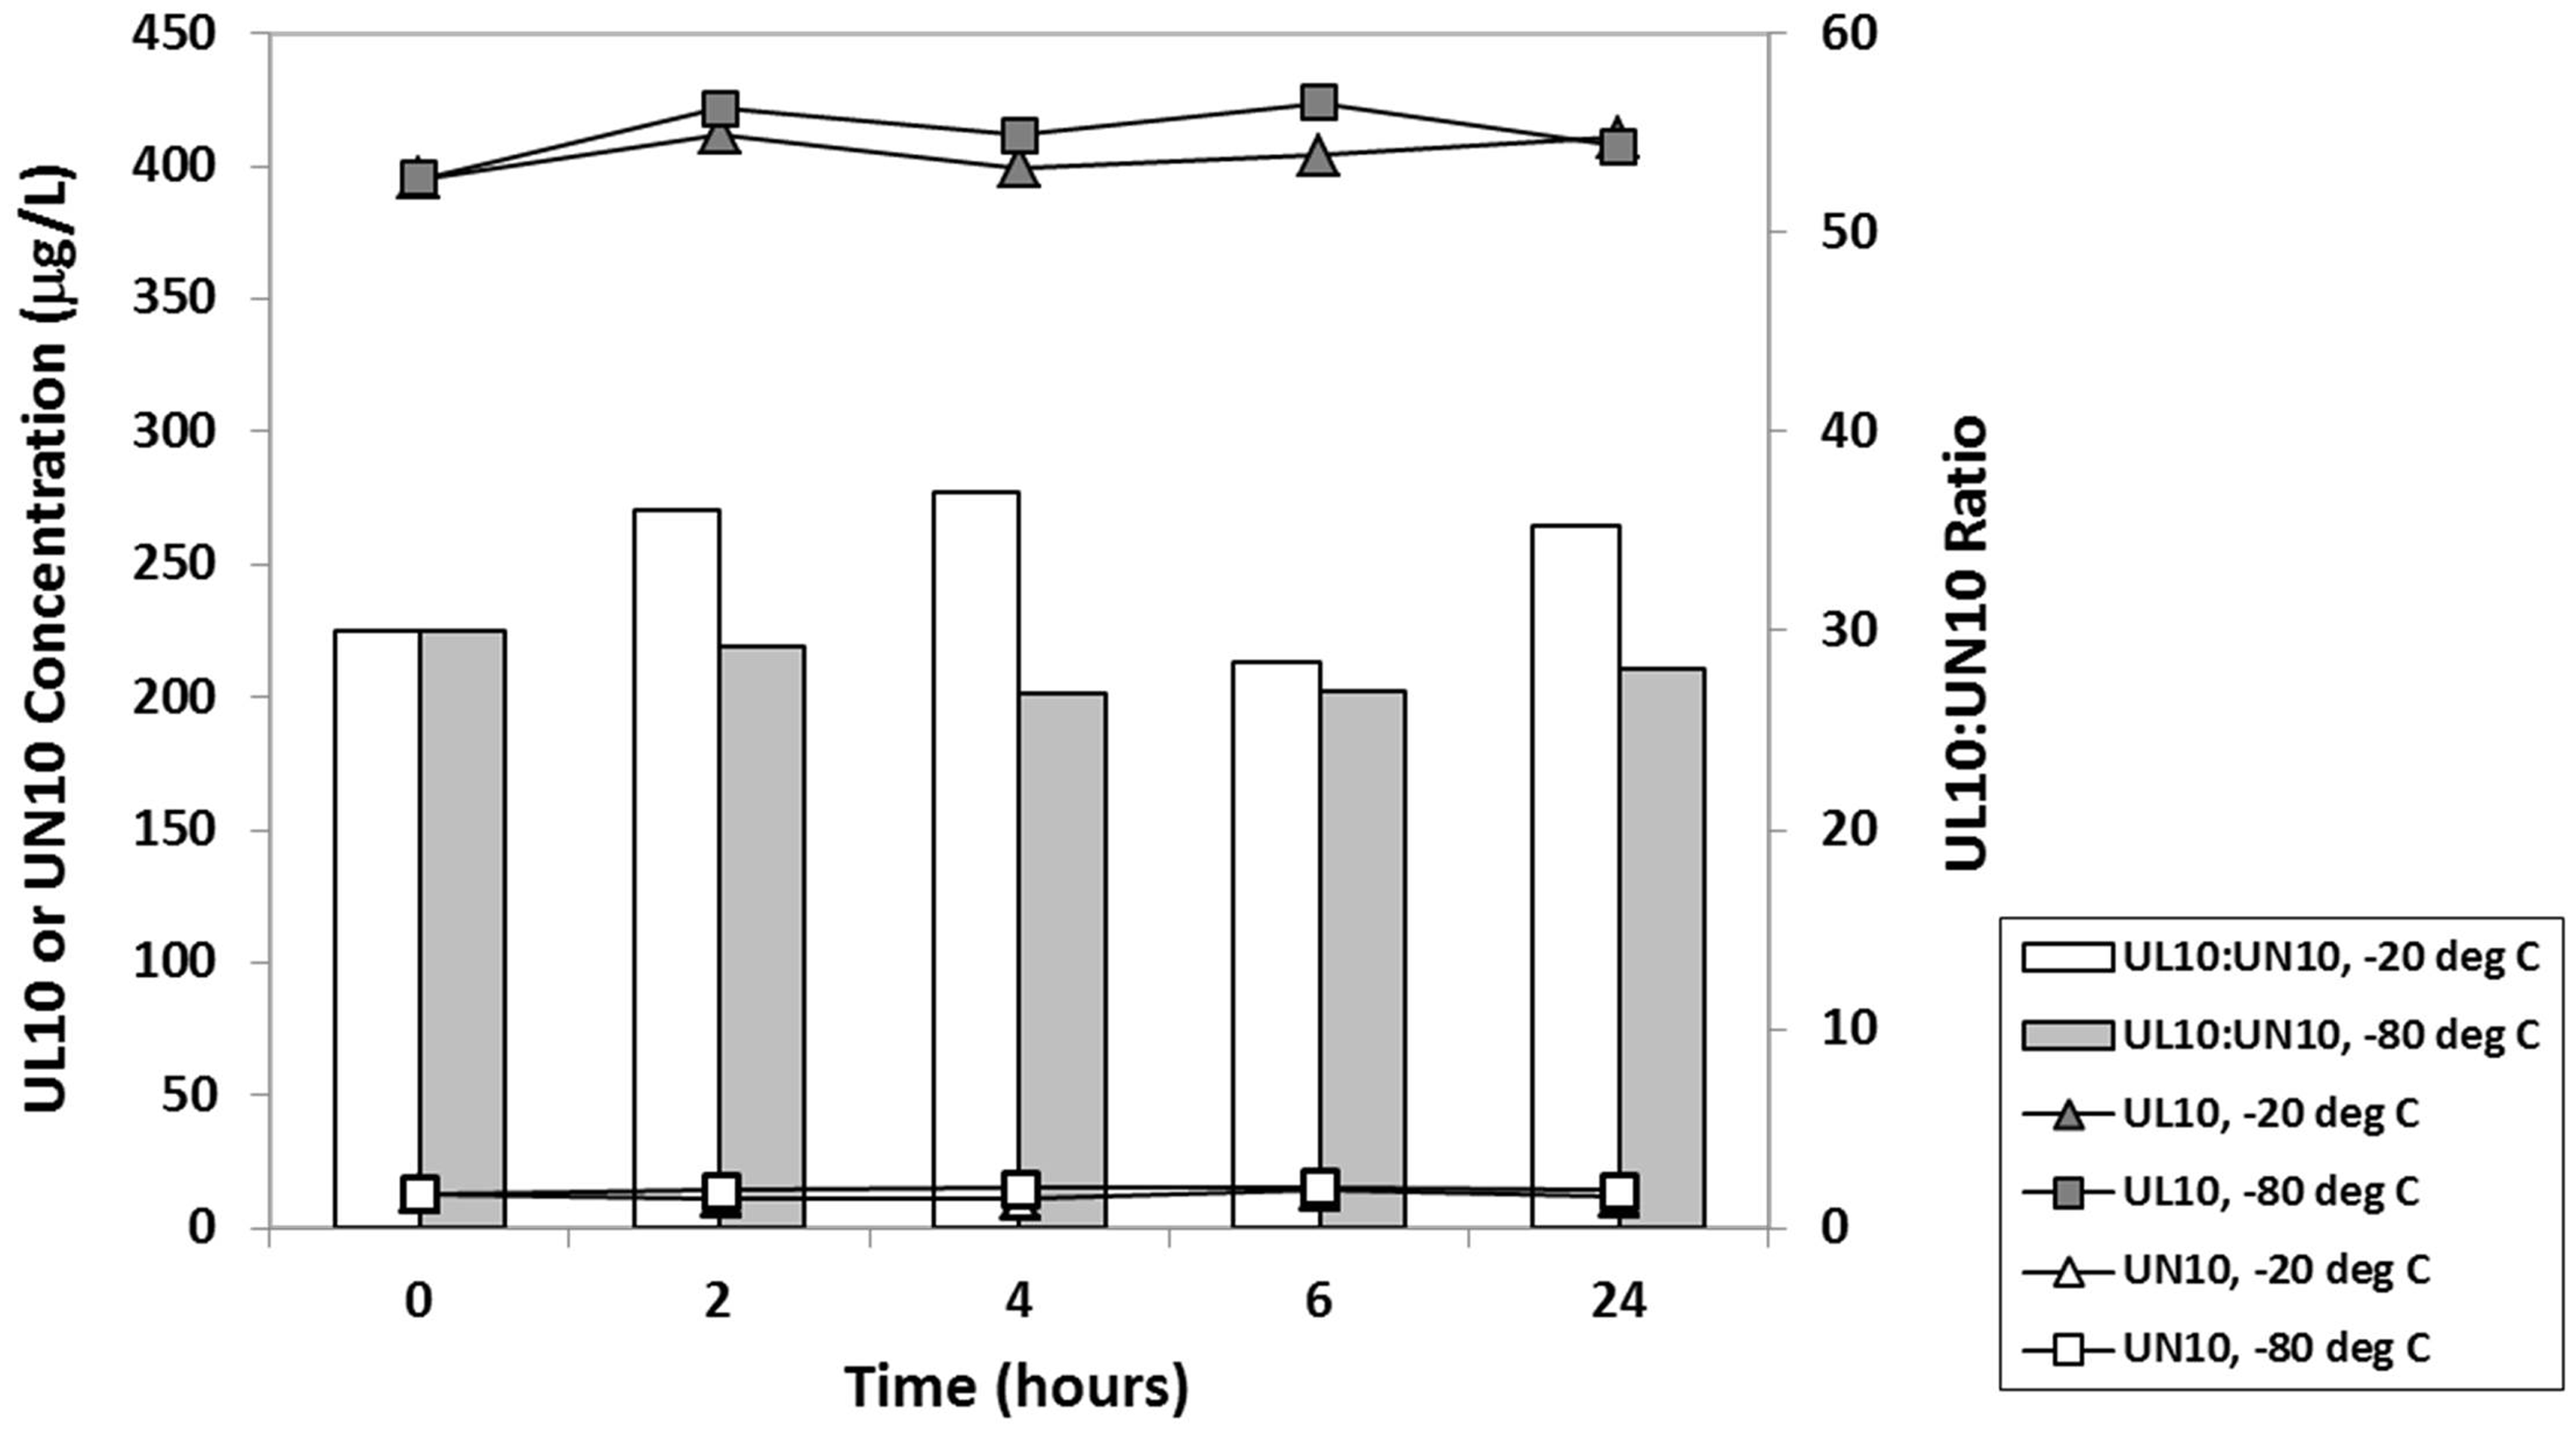
Plasma UL10 and UN10 in non-supplemented healthy volunteers
Plasma concentrations of UL10 and UN10 in a group of healthy, non-supplemented human subjects.
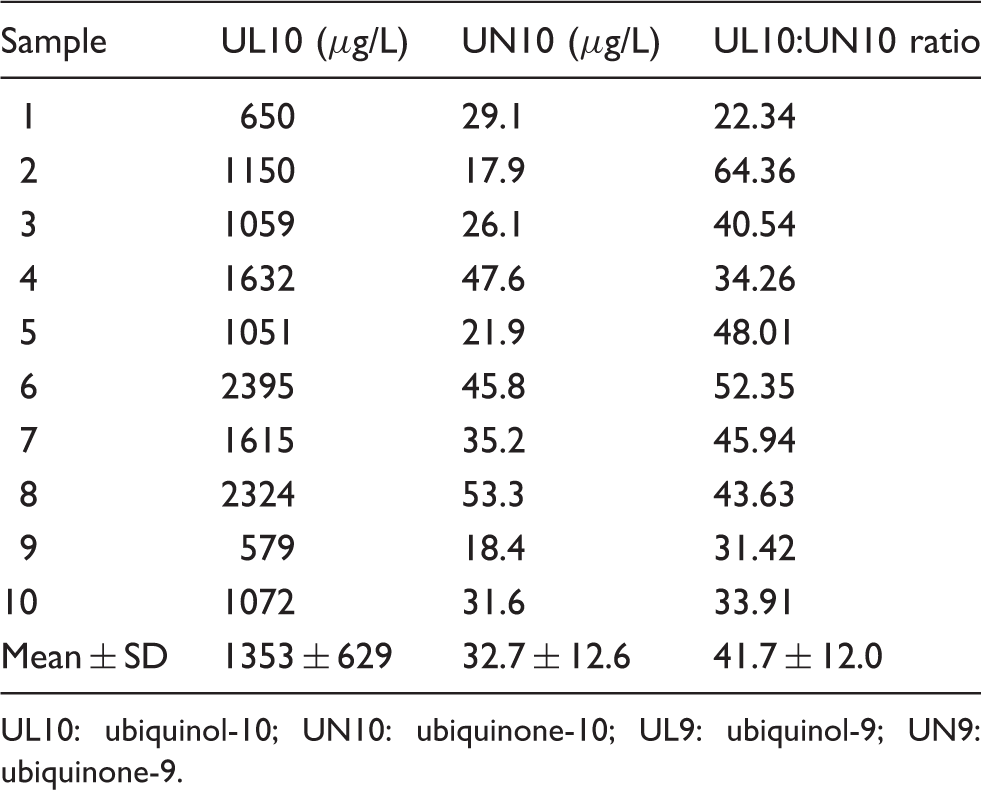
UL10: ubiquinol-10; UN10: ubiquinone-10; UL9: ubiquinol-9; UN9: ubiquinone-9.
Comparison of UL10:UN10 ratio in healthy human subjects between current study and published literature reports using various methods for quantification of UL and UN in plasma or serum.
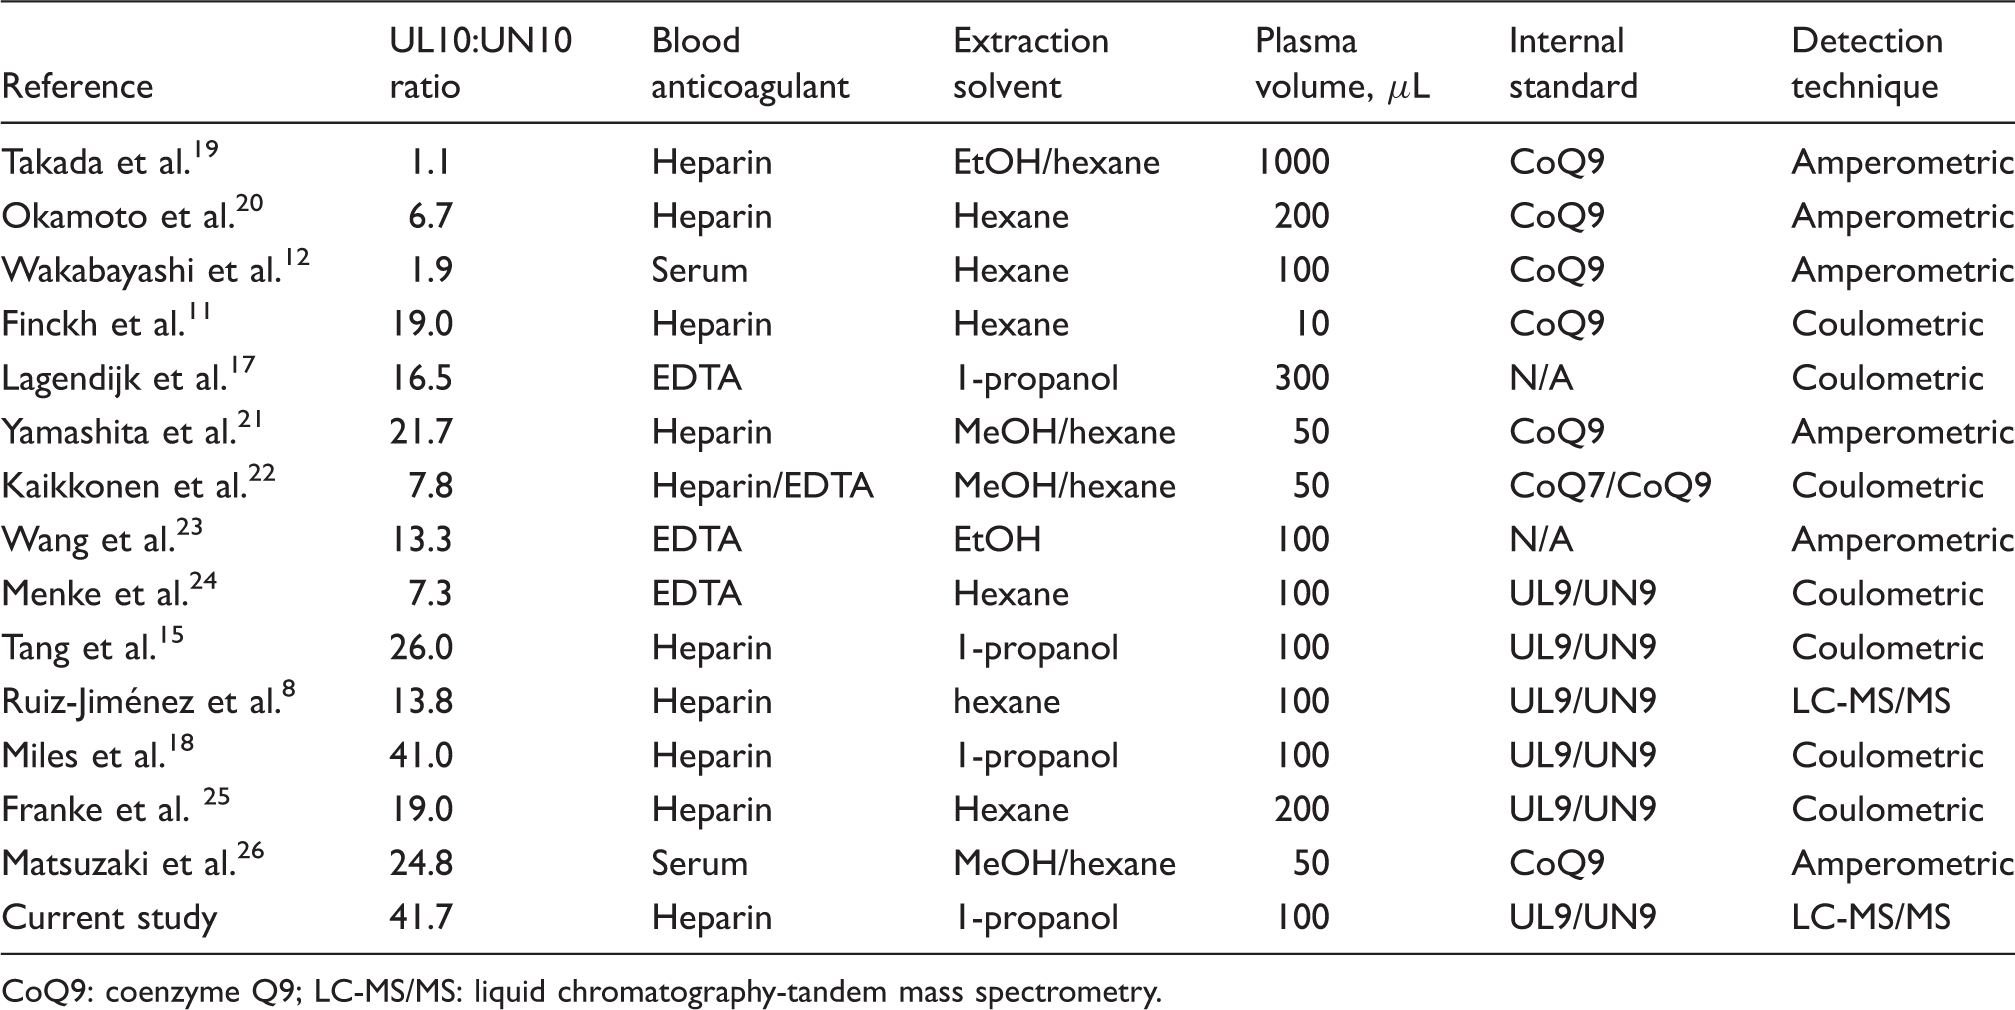
CoQ9: coenzyme Q9; LC-MS/MS: liquid chromatography-tandem mass spectrometry.
Conclusions
A highly sensitive and selective method for the simultaneous determination of UL10 and UN10 concentrations in human plasma was developed, with the advantage of combining LC-MS/MS with an efficient single-step extraction in 1-propanol. Although the stability of UL10 in 1-propanol plasma extract limits the number of samples that should be processed per batch to 12, the simple extraction procedure and fast instrument run time (4.2 min) allow for multiple runs per day. This method is suitable for clinical studies with CoQ10 supplementation in various disease states where this lipid-antioxidant may be beneficial. We have applied this method to >300 plasma samples from CoQ10 research studies in chronic haemodialysis patients and postsurgical patients.
Footnotes
Declaration of conflicting interests
None.
Funding
This study was supported by grants from the National Institute of Health NCCAM R21 AT004265-03 and NCATS Grant KL2 TR000421. CKY was supported by the Norman S Coplon Extramural Grant Program of Satellite Healthcare.
Ethical approval
De-identified samples were obtained from consenting healthy subjects, per protocol approved by the University of Washington Institutional Review Board (#38662).
Guarantor
DDS.
Contributorship
Study design: AJC, CKY, LJR, BRP, JH, DDS.
Study conduct: AJC, LJR, BRP.
Statistical analysis: AJC, CKY.
Drafting and revising the article: AJC, CKY, JH, DDS.