
Abstract
Background
Evaluation of low-density lipoprotein oxidation is important in the risk assessment of cardiovascular disease. Atomic force microscope is widely used to evaluate the physical properties including stiffness on a single-particle scale. In this study, the effect of low-density lipoprotein oxidation on the low-density lipoprotein stiffness was investigated using an atomic force microscope.
Methods
Isolated low-density lipoprotein particles with or without oxidation were densely bound to an Au substrate on mica, and then pressed and deformed by the atomic force microscope tip. The stiffness of each low-density lipoprotein particle was estimated as the elastic modulus obtained by the force curve analysis. Biochemical change of low-density lipoprotein due to oxidation was studied by electrophoresis.
Results and conclusion
The elastic modulus of low-density lipoprotein particles ranged between 0.1 and 2 MPa. The oxidation of low-density lipoprotein increased the number of low-density lipoprotein particles with smaller elastic moduli, indicating the decrease in low-density lipoprotein stiffness. The elastic modulus of low-density lipoprotein might be potentially useful to evaluate low-density lipoprotein oxidation.
Introduction
Low-density lipoproteins (LDLs) contain a central core comprising triacylglycerols and cholesteryl esters, and a surface monolayer containing phospholipids, free cholesterol and apolipoprotein B-100 (apoB-100) as a major protein constituent. 1 When unsaturated fatty acids of LDL are oxidized, chained peroxidation reactions occur and propagate to adjacent lipids, subsequently generating aldehydes including malondialdehyde (MDA) and 4-hydroxynonenal.2,3 These aldehydes and other lipid peroxidation products including 13-hydroperoxyoctadecadienoic acid can quickly modify the free amino groups of apoB-100. 4 Fragmentation of apoB-100 concomitantly occurs during the oxidation of LDL. 5 Such oxidatively modified LDLs, that is, oxidized LDLs (ox-LDLs) can induce morphological changes and increase the stiffness in endothelial cells, 6 activate platelets 7 and enhance the conversion of arterial macrophages to foam cells. Therefore, the ox-LDL plays a central role in the development of atherosclerosis. 8
A number of methods have been reported to quantify ox-LDLs. For decades, thiobarbituric acid (TBA) methods have been used widely, and the thiobarbituric acid reactive substances (TBARS) are one of the most popular indicators for lipid oxidation.9,10 Similarly, the detection of conjugated diene generated by lipid peroxidation is a common method especially for continuous monitoring of lipid oxidation. 11 Various chromatographic methods for the detection of lipid peroxide have been reported previously.12,13 Previously, we also reported an electrochemical detection of ox-LDLs using the acid-treated carbon nanotube electrode.14,15 Alternatively, immunological measurement of modified apoB-100 can reflect LDL oxidation and is commonly used in clinical practice. 16 None of these methods, however, can provide the information of oxidation for each LDL particle. In another words, it is impossible to know whether the oxidation occurs uniformly among all LDL particles or non-uniformly. If the latter is the case, studying the oxidation profile among LDL particles might be useful for more accurate understanding of LDL oxidation and more precise evaluation of the risk for cardiovascular disease. For this purpose, atomic force microscope (AFM) is a potentially powerful tool. AFM not only measures the topography of samples in the scale of nanometer, but also maps biomolecules on samples and measures physical properties like the binding force.17,18 This nanoscale analysis is realized by measuring the force between cantilever tip of AFM and the surface of analyte. The information of LDL oxidation also will be available when AFM can be targeted for physical properties closely related to LDL oxidation, such as charge and size of LDL19,20 and the modification of apoB-100.16,21
Over the past several decades, the stiffness of various cells, lipid vesicles and proteins has been investigated using AFM systems.6,22,23,24,25 In the present report, change in LDL stiffness due to its oxidation is evaluated with AFM. The usefulness of elastic modulus of LDL particles obtained from the force curve analysis will be demonstrated.
Materials and methods
Chemicals
Disodium hydrogen phosphate heptahydrate, sodium dihydrogen phosphate dihydrate, sodium chloride, EDTA and copper sulphate were purchased from Wako Pure Chemical Industries Ltd, Osaka, Japan. AFM was done using cantilevers, BL-AC40TS-C2, purchased from Olympus Corp., Japan. Mica and gold were purchased from Nilaco Corp., Japan. A TBARS assay kit was purchased from Cayman Chemical, MI, USA.
Preparation of native LDL and ox-LDL
Blood was drawn after an overnight fast from four normal subjects (two females, two males, age 24–27 years old). Serum samples were separated by centrifugation at 2000 g for 10 min at 4℃ and used freshly. LDL fraction was isolated from the serum by sequential ultracentrifugation. 26 During the ultracentrifugation, EDTA (260 µM) was always present in the sample solution to avoid lipid oxidation. Ultracentrifugation was carried out using a near-vertical tube rotor (MLN-80; Beckman Coulter, Fullerton, CA) on a model Optima MAX (Beckman Coulter). The density of serum (2.0 mL) was adjusted with KBr to d = 1.019 kg/L and then centrifuged at 40,000 r/min for 20 h at 4℃. The top 2.5 mL fraction containing chylomicrons, VLDL and intermediate-density lipoproteins (IDL) was removed by aspiration. Then, the remaining fraction was adjusted with KBr solution to d 1.063 kg/L and centrifuged again at 50,000 r/min for 18 h at 4℃. The top 2.5 mL fraction containing native LDL (n-LDL) was isolated by aspiration and nominated as n-LDLs. EDTA was removed from the n-LDLs using an ultrafiltration device having a molecular cut-off of 100 kDa (Amicon Ultra 0.5 mL; Merck Millipore Ltd, Ireland) as follows: The n-LDL (400 µL) was filtrated using the ultrafiltration device, and the n-LDL was obtained as a residue (less than 40 µL). Phosphate-buffered saline (PBS, pH 7.4) (0.4 mL) was added to the residue and filtrated again. This filtration process was repeated five times. Protein was determined by the method of Lowry modified by Markwell et al. 27 and was adjusted to 0.25 g/L. The n-LDL was oxidized by incubation with 1 µM CuSO4 at 37℃ for 0 h to 8 h. The oxidation level of ox-LDLs was determined as MDA-equivalent TBARS concentration. 28
Oxidative change in apoB-100 was examined with SDS-PAGE using NuPAGE NOVEX 3–8% Tris-Acetate Protein Gel (Life Technologies, CA, USA). Each sample (15 µL, 0.05 g protein/L) was pretreated with 5µL of NuPAGE LDS sample buffer (Life Technologies) in non-reducing condition and was run at 75 V in NuPAGE tris-actetate SDS running buffer (Life Technologies). Proteins were stained with SimplyBlue SafeStain (Invitrogen Carlsbad, CA, USA).
AFM experiments
An Au layer was prepared on a freshly cleaved muscovite mica substrate using thermal evaporation. A gold wire with a purity of 99.9% was used as evaporation source. The mica substrate was cleaved in air and immediately introduced into the deposition system, and then was cleaned in situ by heating it at 300℃ for 10 h before deposition. To obtain a flat surface, the gold layer was deposited at 500℃. The deposition rate was 0.1 nm/s and the layer thickens was 100 nm.
The Au/mica substrate was set on the stage. The Au topography was measured in PBS in AC mode using an AFM system (MFP-3D; Asylum Research, Santa Barbara, CA, USA). In the AC mode, AFM cantilever was oscillated in the PBS buffer and the amplitude of oscillation was controlled to a constant value during the scanning of the sample surface by changing the position of the cantilever by piezo. From the travel distance of piezo at a position, topography images were obtained. The scan size and rate of scan were, respectively, 500 × 500 nm and 0.7 Hz. Force curves were obtained using contact mode. In brief, an AFM tip mounted on the cantilever was moved closer to the Au surface with 122 nm/s until the tip contacted the surface and the deflection value of the cantilever increased 0.05 V from the deflection before contact (approaching process). Then the tip was withdrawn from the surface. The sensitivities of the cantilevers were calibrated using the tip contact region to the Au surface of the force curves and the cantilever spring constant was measured by using a thermal method program equipped with MFP-3D.
After determination of the cantilever sensitivity, n-LDLs or ox-LDLs were added to PBS, and incubated for 3 min, followed by washing with PBS buffer to remove unbound LDLs and ox-LDLs. Topographies of the LDL particles, physically adsorbed on the Au surface, were measured in PBS. Their force curves were obtained using the same condition. Force curves were obtained by changing the position of the tip after measuring the topography. The elastic moduli of the LDLs, which indicate the LDL stiffness, were estimated from the force curves of the approaching process using software equipped with MFP-3D with a Hertz model modified by Sneddon.
29
The model can correlate the applied force to indentation of the soft sample and its elastic modulus (E) with a rigid tip. It is given as
Results and discussion
Time course of LDL oxidation
The whole time course of LDL oxidation is shown in Figure 1. According to the change in TBARS, the oxidation time of 0–2 h corresponded to the lag phase and that of 2–4 h to the propagation phase. In the lag phase, LDL oxidation is known to be retarded for the presence of antioxidants in LDL such as ubiquinol and α-tocopherol.
31
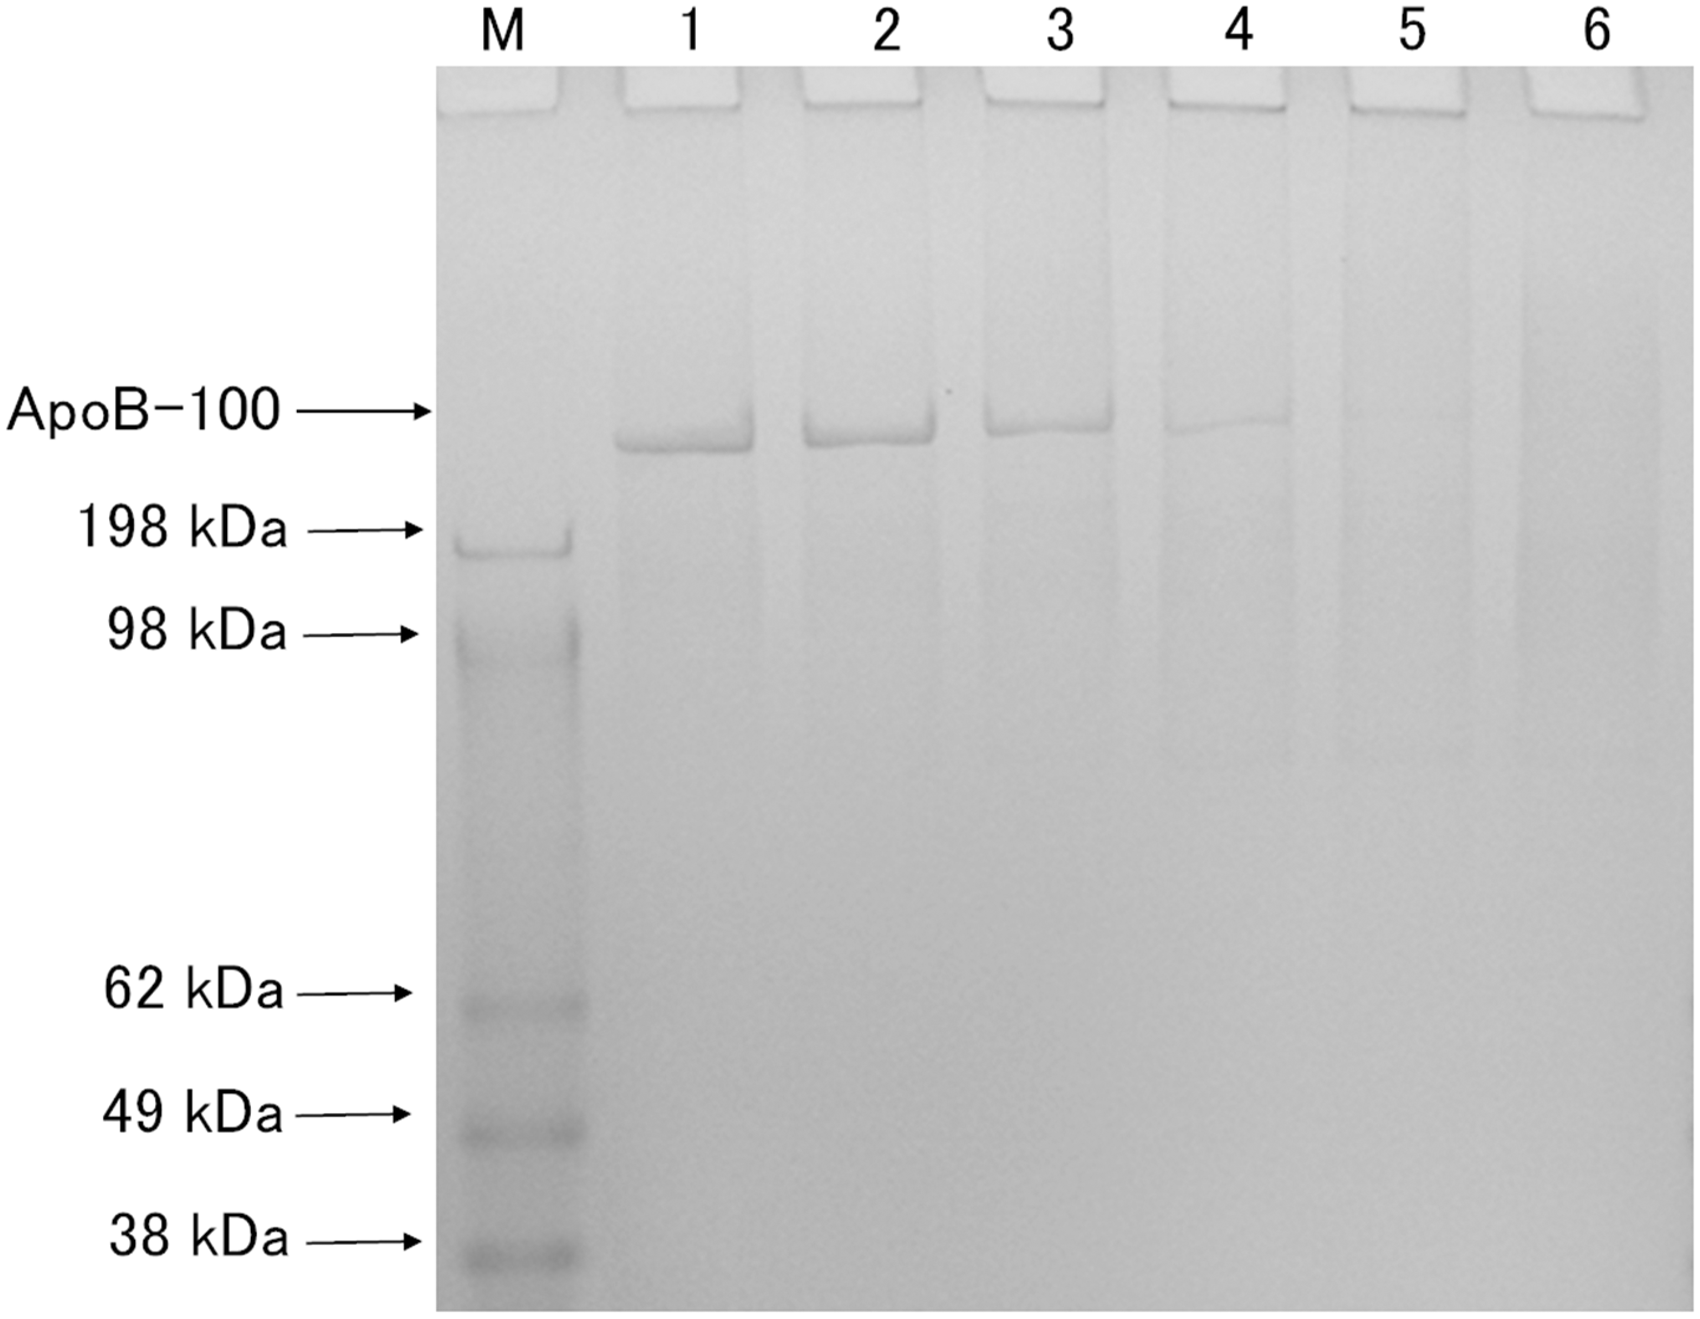
In the propagation phase, an exponential increase of lipid peroxides and other products occurs after depletion of the antioxidants in LDL. In the following studies, we used the ox-LDL at 1 h (ox-LDL 1 h) and that at 3 h (ox-LDL 3 h) to represent them as the lag phase and the propagation phase, respectively. A SDS-PAGE study showed that apoB-100 was considerably preserved in the ox-LDL 1 h, but was totally lost in the ox-LDL 3 h (Figure 2).
Time course of the change in TBARS during oxidation for the LDLs with (closed circle) or without (open circle) copper oxidation. TBARS are expressed as the MDA equivalent concentration. SDS-PAGE for n-LDL and ox-LDL. Lane 1,2,3,4,5 and 6 corresponds to n-LDL without incubation (lane 1), n-LDL after incubation without Cu++ for 24 h (lane 2), ox-LDL1h (lane 3), ox-LDL2h (lane 4), ox-LDL3h (lane 5) and ox-LDL4h (lane 6), respectively. Molecular weight markers are shown on the left side (M). Note that the LDL band became weaker and more smeared with increasing oxidation time. Aggregation of LDL was not observed up to 4 h.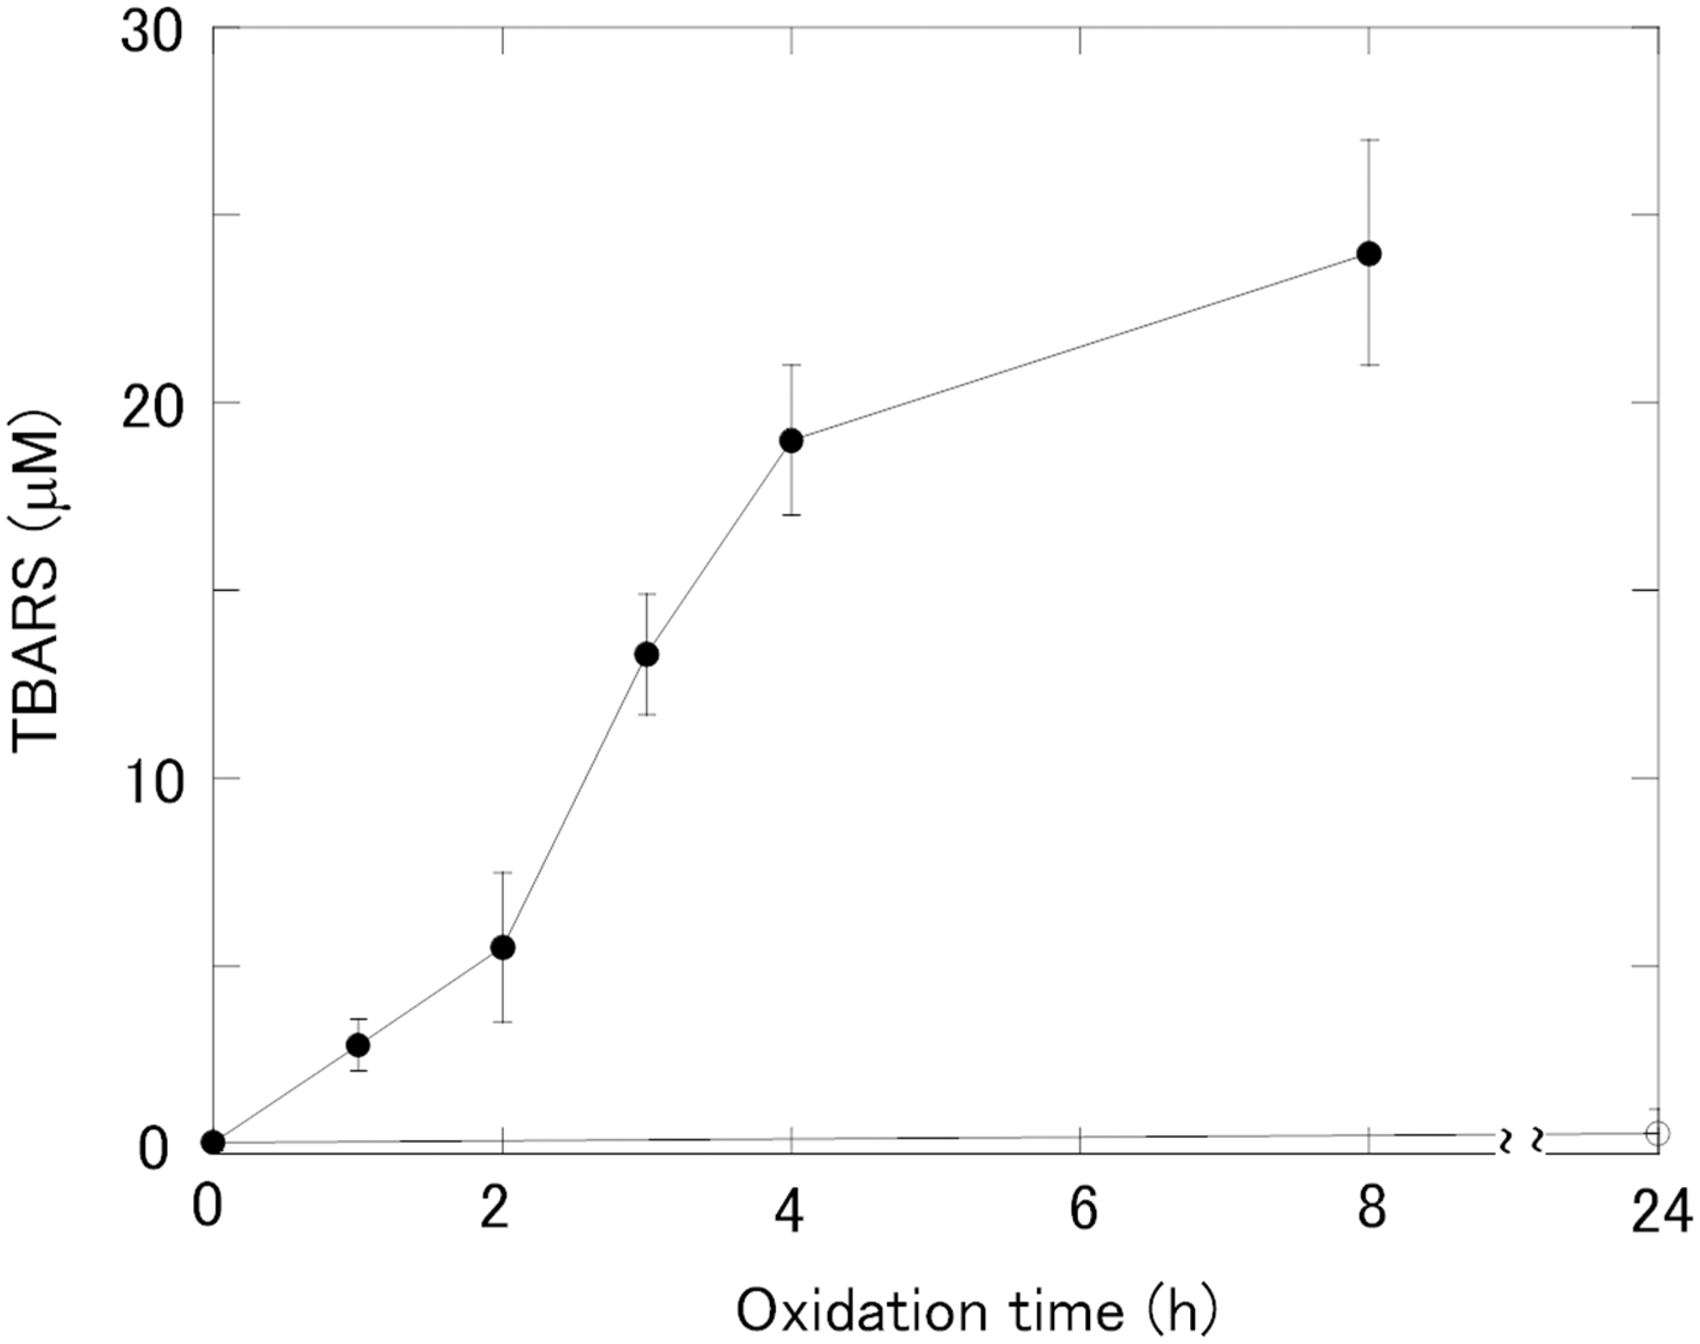
Topography
The AFM-based topographies of the n-LDL, ox-LDL 1 h, and ox-LDL 3 h are shown in Figure 3.
Topographies of Au layer before LDL immobilization. The n-LDLs and ox-LDLs on the Au layer were measured using AFM: (a) Au, (b) n-LDL, (c) ox-LDL 1 h and (d) ox-LDL3h. Some LDL particles appear larger (white arrow, Figure 3(d)).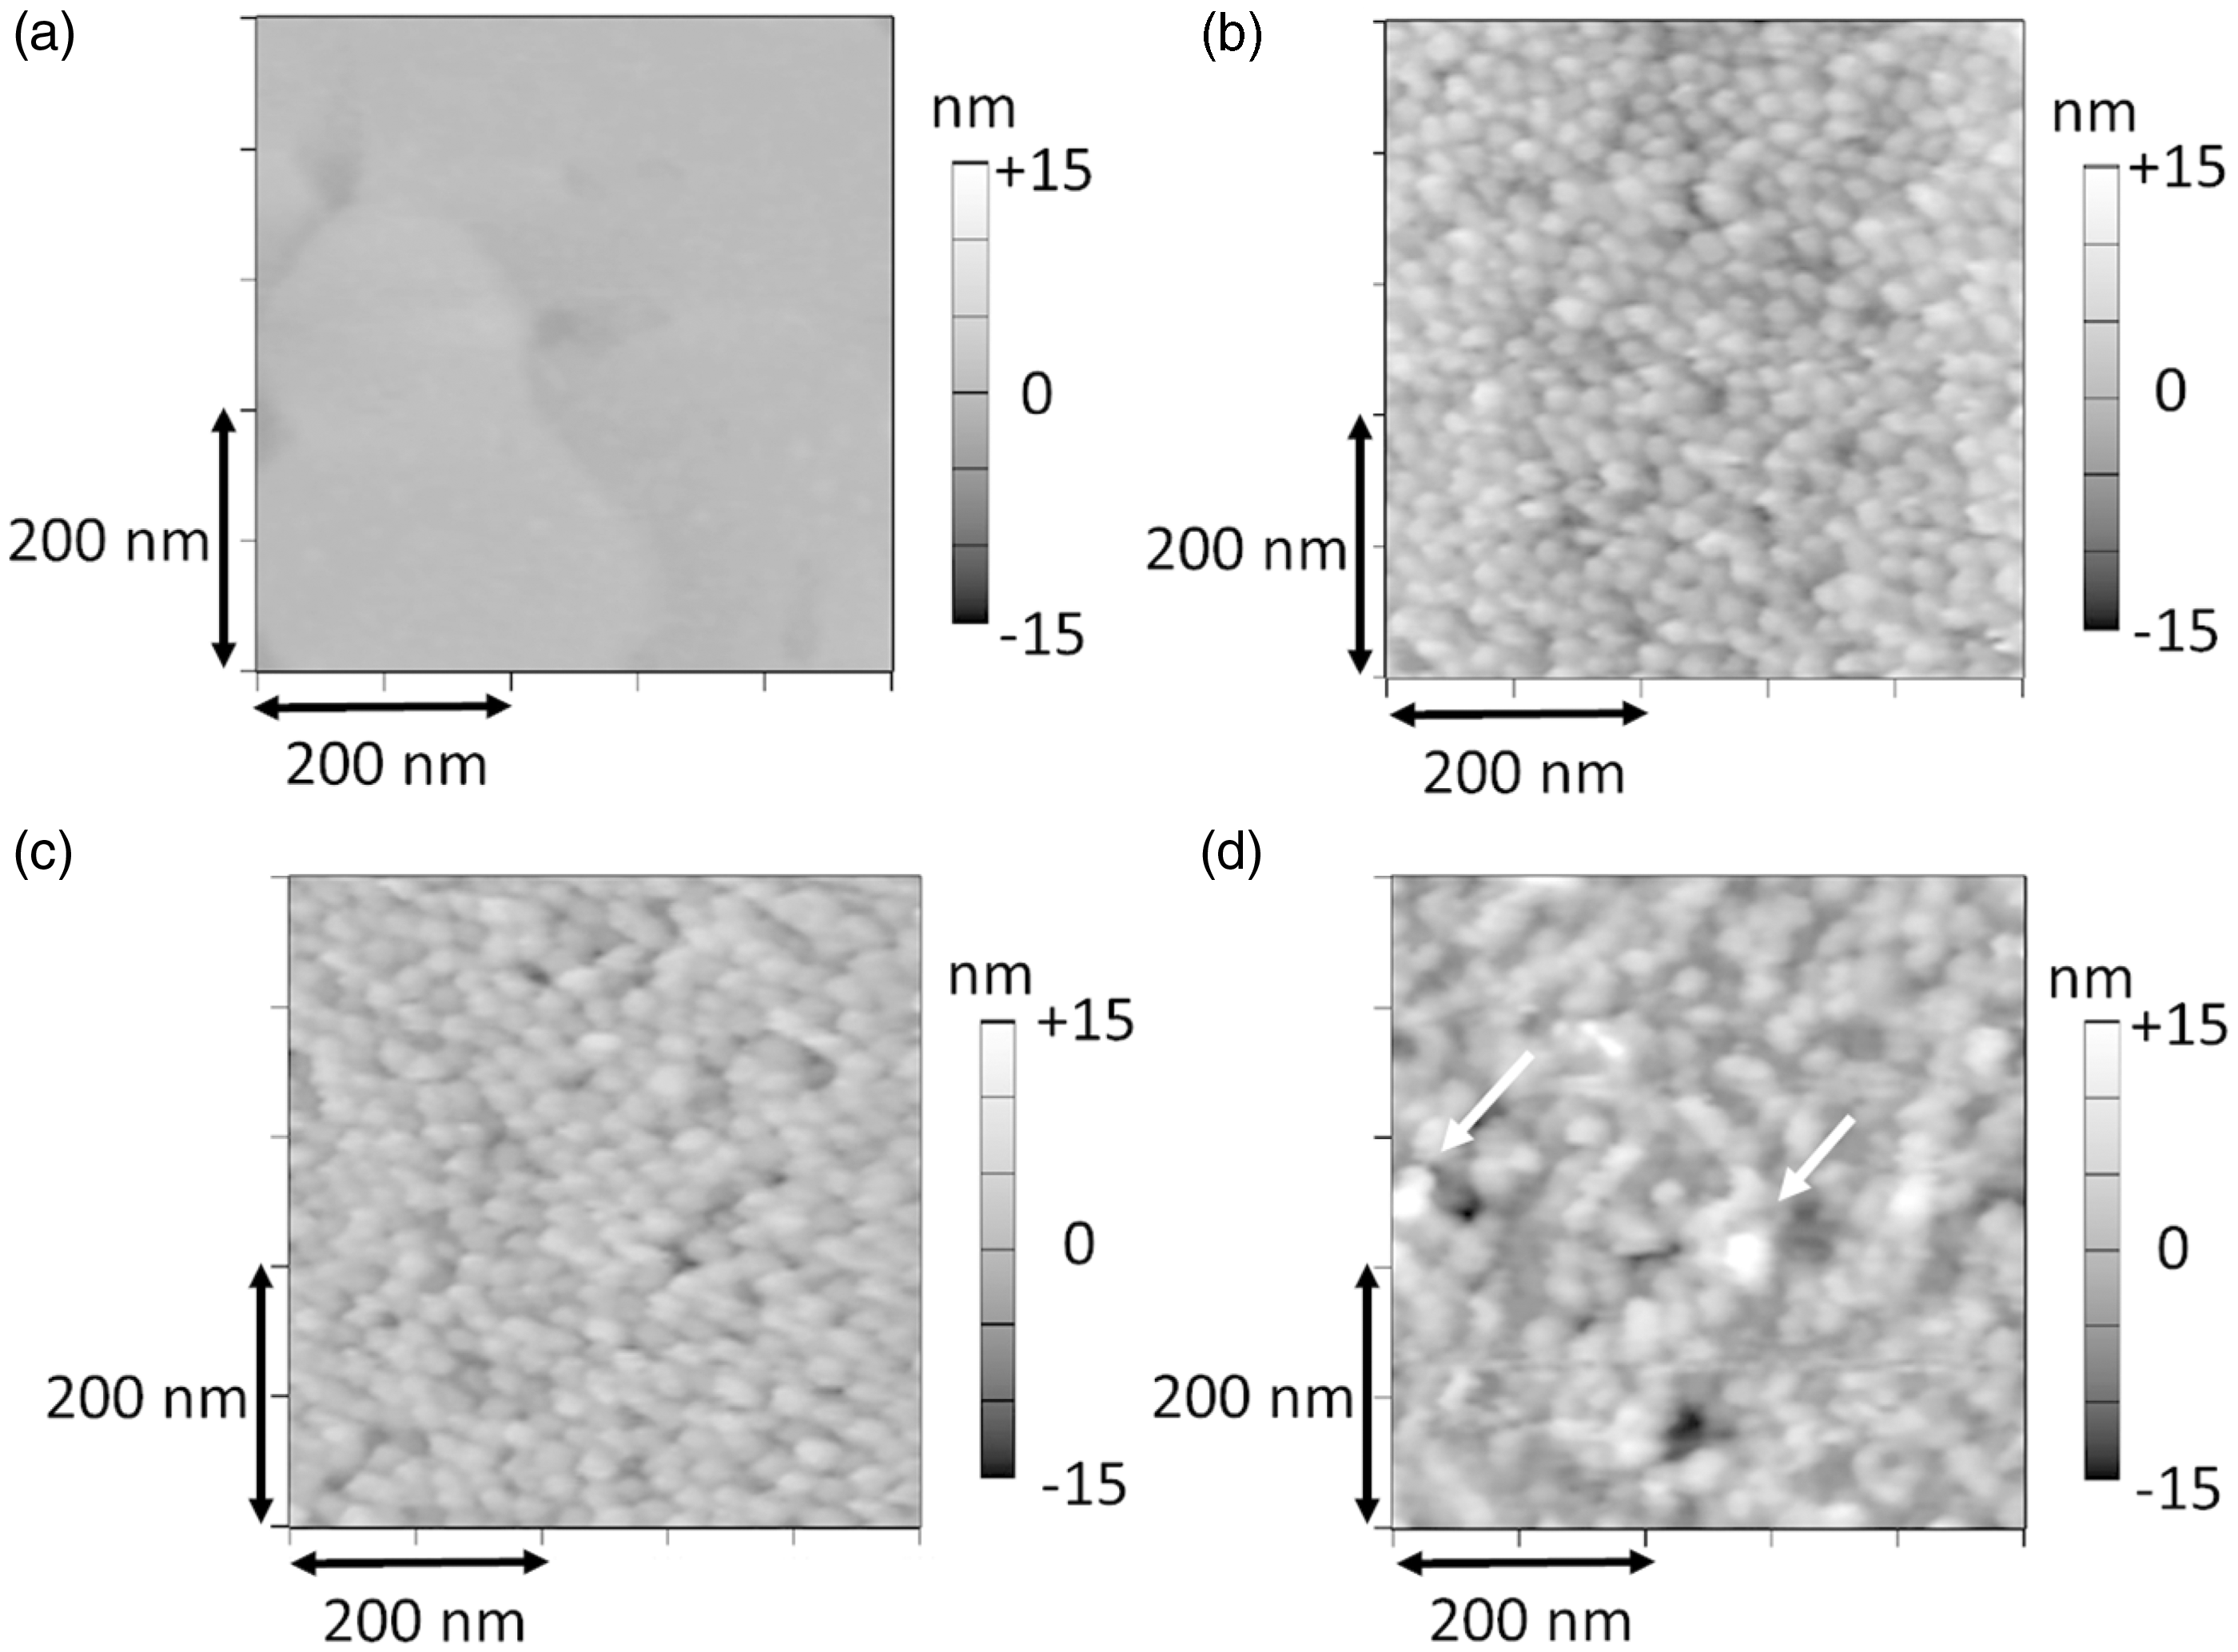
The n-LDL or the ox-LDLs were densely immobilized on the Au surface. The diameter of LDLs and ox-LDL 1 h was roughly estimated from the images by measuring the long axis and short axis of the observed LDL particles as 20–30 nm. As reported previously, the LDLs have spherical structures with diameter of 23–26 nm.26,32 In AFM, however, they were slightly flattened possibly due to the adsorption to the Au and/or to the bias of AFM. Although no definite change was observed in the topography between n-LDLs and ox-LDL 1 h, a few particles were enlarged among ox-LDL 3 h, as indicated by white arrows in Figure 3(d), supposedly due to denaturation and/or fusion of LDL particles. 33 This indicates that the size of LDL particles is affected not only by the oxidation but also due to its adsorption to the Au, however, the elastic modulus is less likely to be affected.
Force curve study
Force applied to the sample, as calculated from the deflection and the spring constant of the cantilever, is shown as a function of the piezo travel distance. The elastic moduli were estimated from the region of the contact point to 8 nm of indentation. Typical force curves of n-LDLs and ox-LDL 3 h are shown in Supplementary Figure 1(a) and (b), respectively. The force applied to the n-LDLs at 10 nm indentations of the LDLs was more than that to the ox-LDL 3 h, indicating that the stiffness was decreased in the ox-LDL 3 h. The elastic moduli of the n-LDLs and the ox-LDL 3 h were estimated as 1.5 and 0.55 MPa, respectively, by fitting the curves using the Hertz model. The elastic modulus is a combination of the Young’s modulus of the AFM tip and the sample and/or substrate. However, care must be taken in interpreting the estimated elastic modulus because the Hertz model required some presumptions such as the tip shape and frictionless contact. To avoid the effects of the substrate stiffness on the measurement, the indentation should be less than 2–3 nm because the LDL size is about 25 nm. However, in this study, the elastic modulus of LDLs was estimated from the contact point to 8 nm indentations of the force curves to obtain sufficient data for the fittings.
Effect of oxidation on elastic modulus
The n-LDLs, n-LDLs incubated without Cu++, ox-LDL 1 h and ox-LDL 3 h were studied for the elastic modulus. A typical distribution of the elastic modulus of the n-LDLs, ox-LDL 1 h and ox-LDL 3 h is shown in Figure 4. About 100 force curves were studied for the elastic modulus in each LDL sample. In n-LDLs, the elastic moduli ranged widely between 0.1 and2.5 MPa, and about a half of them ranged from 0.7 to 1.3 MPa. The stiffness of protein-coated giant unilamellar vesicles is 50–110 MPa, while that of the cell membranes is 10–100 kPa.13,14,15,16,23,24 The elastic modulus of LDL was found between those of the cells and giant unilamellar vesicles. These values are much smaller than those for proteins ranging from 100 MPa to a few GPa.25,34
Distribution of the stiffness of n-LDLs and ox-LDLs. Each dot shows the calculated elastic stiffness from the force curves of n-LDLs, n-LDL incubated without Cu++, ox-LDL 1 h and ox-LDL 3 h. Solid bars indicate the median of dots.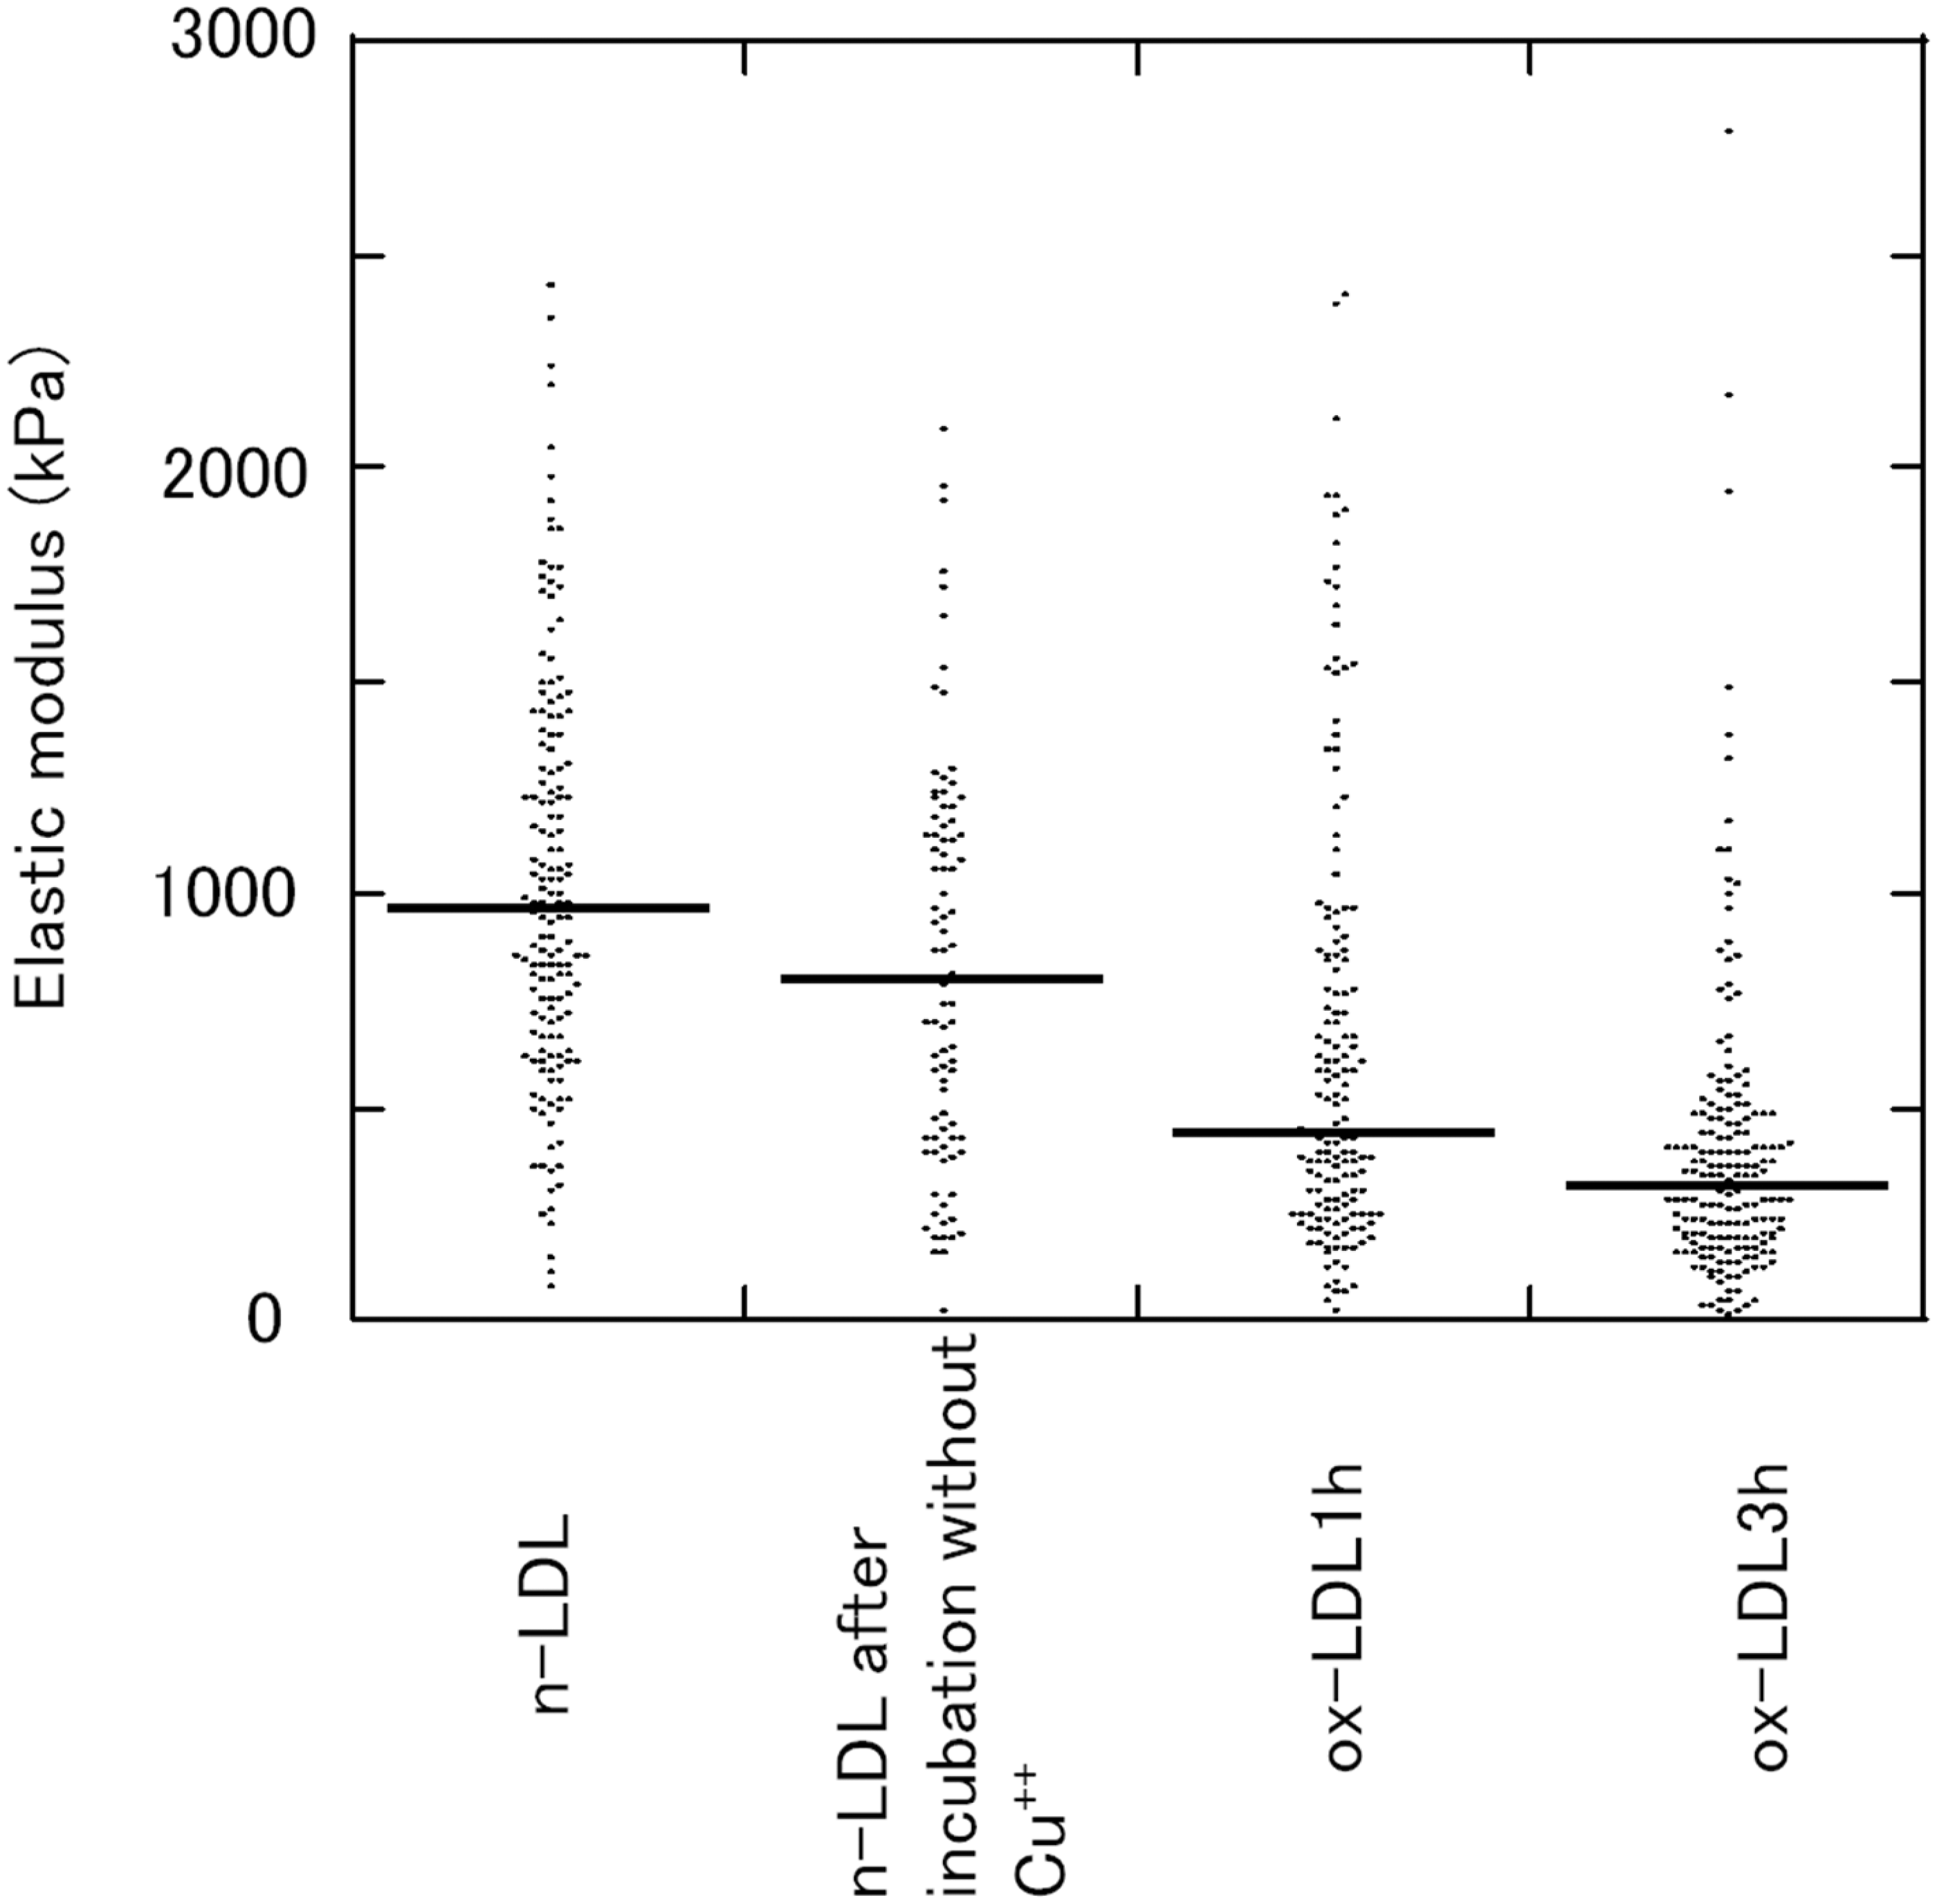
The distribution of the elastic moduli was relatively homogeneous in n-LDL. However, the oxidation changed the distribution pattern into a bottom-swelling shape, as typically shown in ox-LDL 3 h.
Consequently, the median of elastic moduli decreased largely: 0.95, 0.80, 0.44 and 0.32 MPa, respectively, for n-LDL, n-LDL incubated without Cu++, ox-LDL1h and ox-LDL 3 h. A significant difference was found between n-LDL and ox-LDL 1 h (P < 0.001) or ox-LDL 3 h (P < 0.001) (Mann-Whitney test), indicating that the decrease in the elastic modulus began as early as 1 h (lag phase) and continued until 3 h (propagation phase).
The distribution of elastic modulus for n-LDL, n-LDL incubated without Cu++, ox-LDL1h and ox-LDL 3 h from other three young adults was measured and shown in Supplementary Figure 2. The averaged median of elastic modulus of each condition was calculated from each distribution. In each subject, oxidation caused the decrease of elastic modulus. The relationship between TBARS and the elastic modulus, calculated from Figure 4 and Supplementary Figure 2 is shown in Figure 5. Accordingly, the mean elastic modulus decreased along with the increase in TBARS (Figure 5).
Relationship between the elastic modulus and TBARS. TBARS are expressed as the MDA equivalent concentration. Closed circles, the mean (n = 4); vertical line, standard deviation of the elastic modulus; horizontal line, standard deviation of TBARS.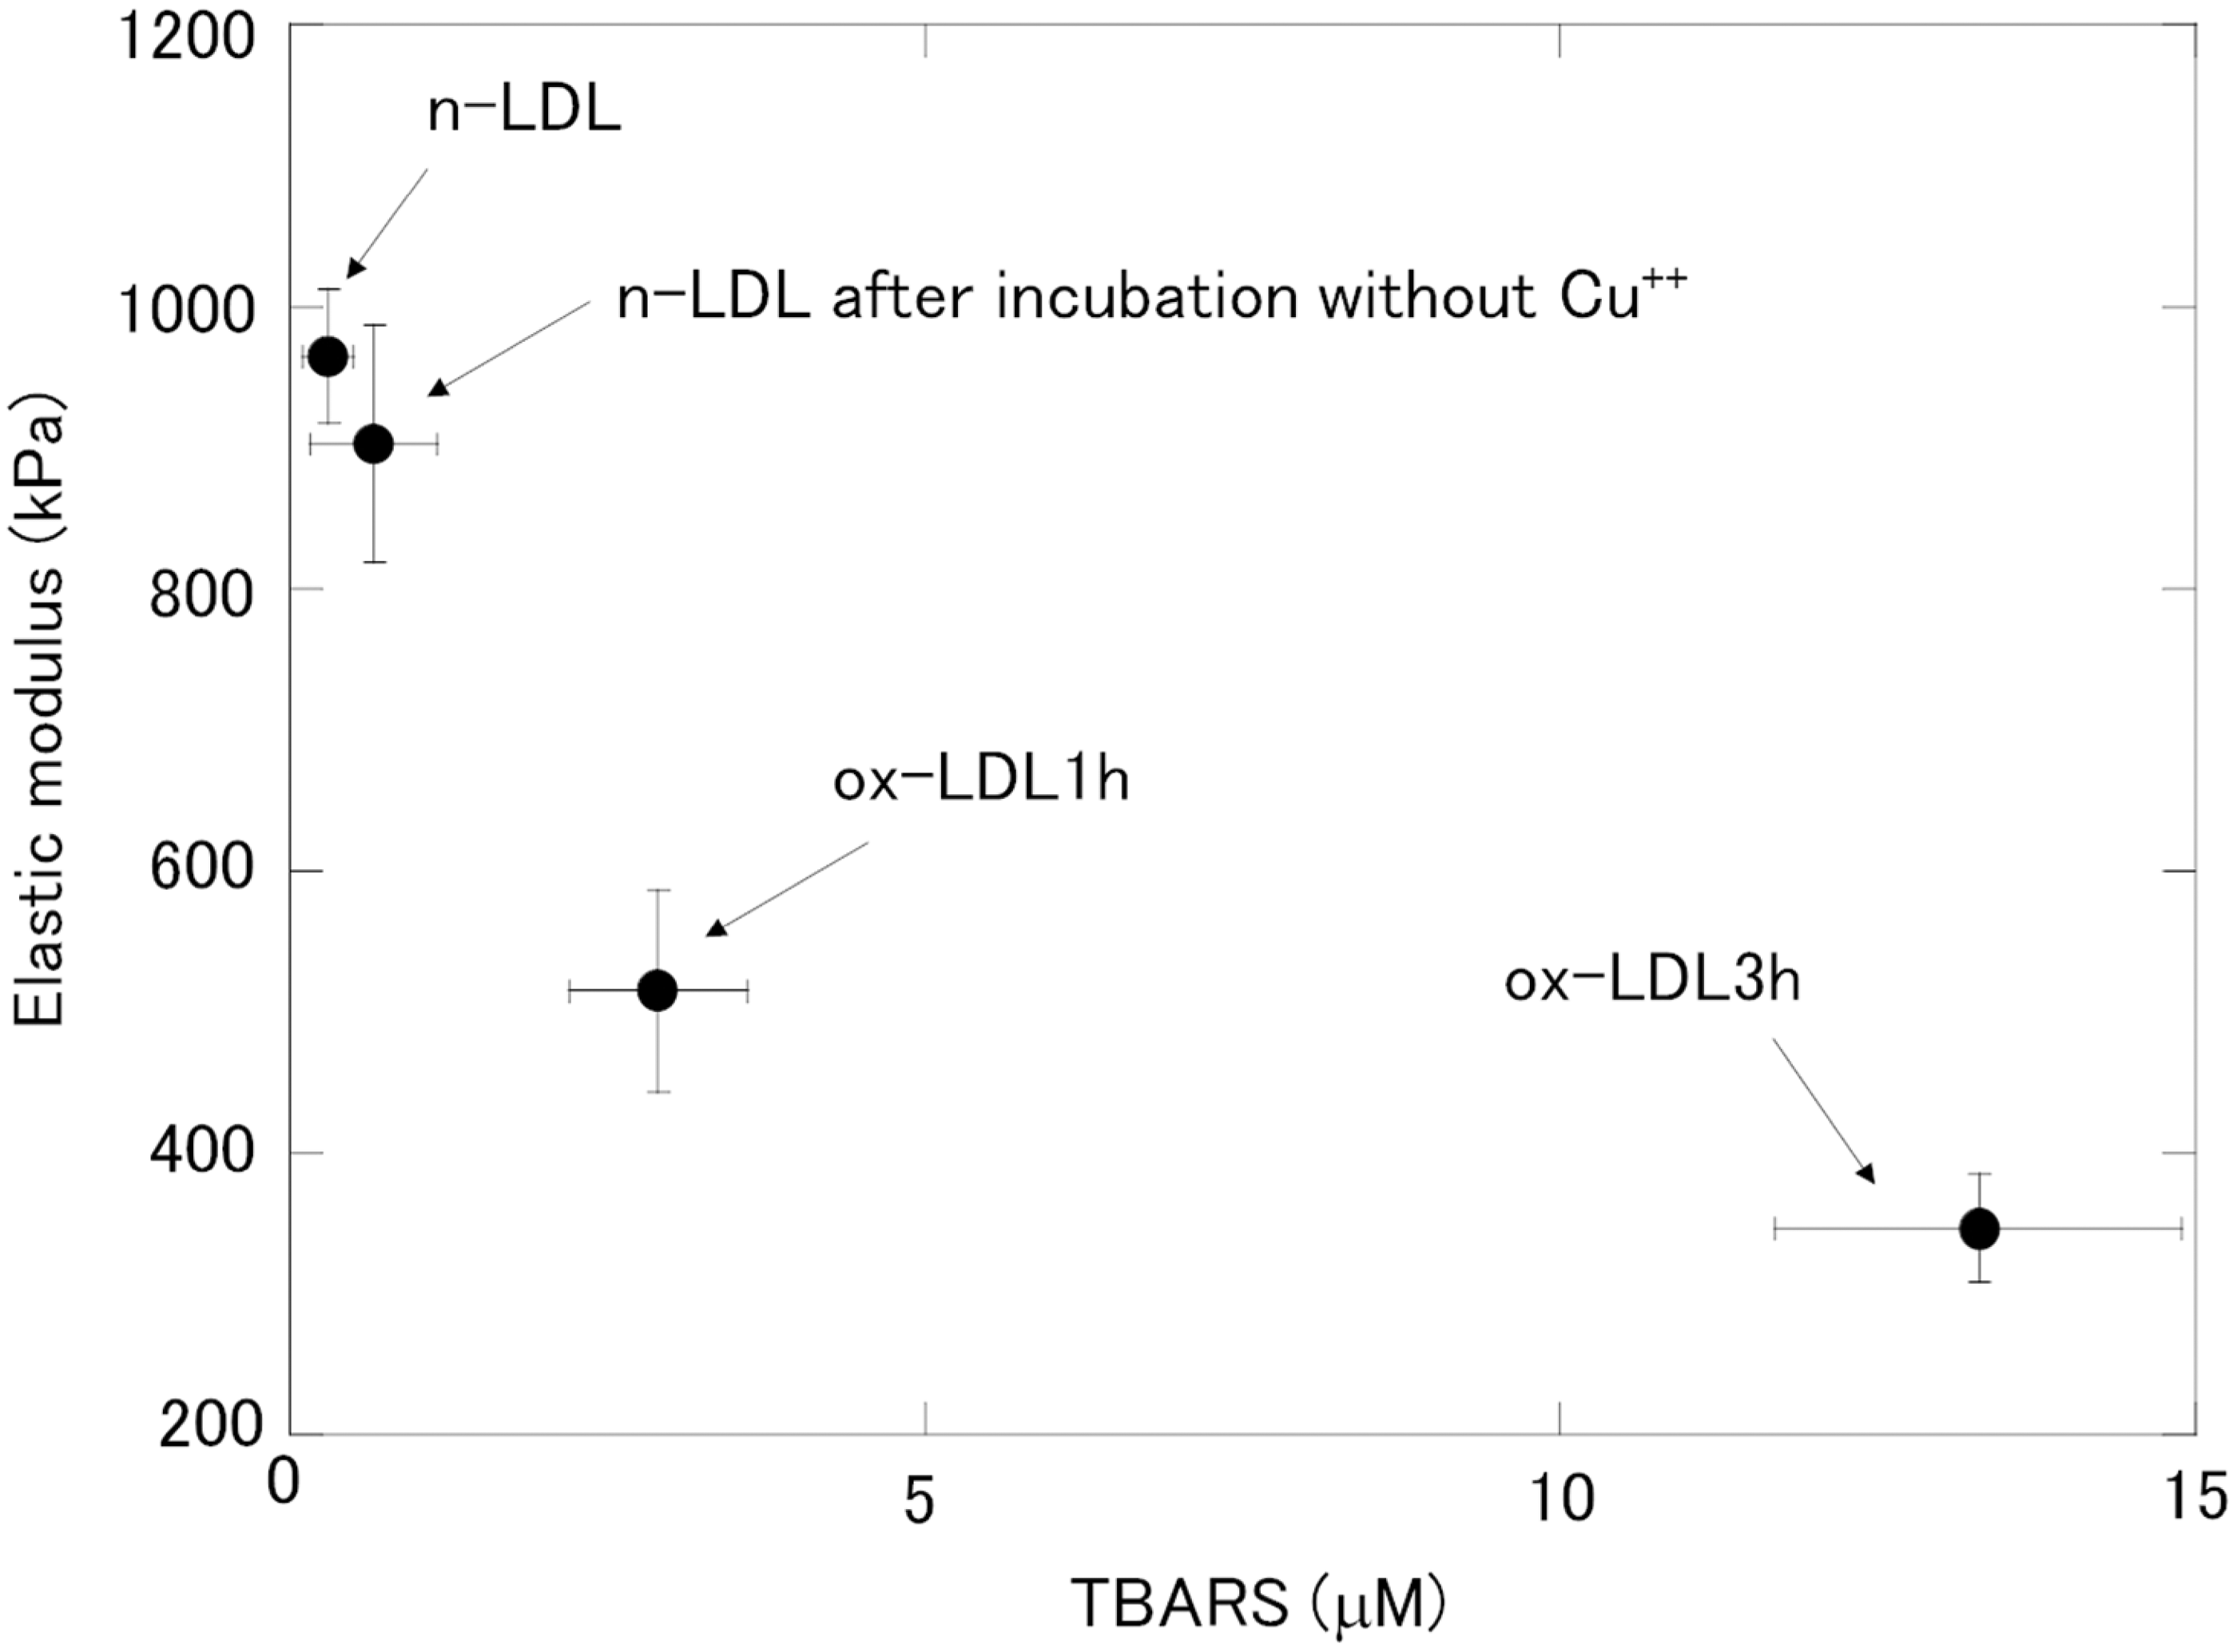
As shown in Figure 4 and Supplementary Figure 2, the medians of the elastic modulus of the n-LDL and the n-LDL after incubation for 24 h without copper, respectively, were 970 ± 50 and 900 ± 80 kPa (n = 4, P < 0.34; Mann-Whitney test). Although the medians between the two LDL preparations were not different significantly, the percentage of LDL particles with the elastic modulus less than 400 kPa was apparently different, although statistically insignificant: 9 ± 2% (n = 4) and 18 ± 6% (n = 4, P < 0.058; Mann-Whitney test), respectively, for the n-LDL and the n-LDL after incubation for 24 h without copper. Although a detailed study is necessary in the future, it is suggested that our proposed method might have potential to detect weak oxidation of LDL particles by analysing the distribution of elastic modulus. Further, in combination of this method with oxidation procedure, we might be able to evaluate the oxidizability of LDL by comparing the distributions of the elastic modulus before and after oxidation. Moreover, we might be able to classify LDL particles according to the oxidizability.
In this study, we showed the usefulness of AFM in the measurement of LDL stiffness and the contribution of oxidation to the LDL stiffness. Other lipoprotein species such as chylomicrons, VLDL, IDL and HDL, remain to be studied. To address possible contribution of the factors other than oxidation, such as age, sex, plasma lipids and sugar, exercise, and various diseases to the lipoprotein stiffness is of our future interest.
Conclusions
AFM-based measurement of the elastic modulus of LDL might be useful for the evaluation of LDL oxidation.
Footnotes
Acknowledgements
We thank Prof. Koichi Mukasa for discussion related to AFM measurements.
Declaration of conflicting interests
None.
Funding
This work was supported by a JSPS Grant-in-Aid for Scientific Research (C) KAKENHI (23590655), and partly by the Regional Innovation Strategy Support Program, Sapporo Health Innovation “Smart-H”, of the Ministry of Education, Culture, Sports, Sciences and Technology, Japan.
Ethical approval
No.14-73, The Ethical Committee, Faculty of Health Sciences, Hokkaido University.
Guarantor
S-PH.
Contributorship
ST designed this study and measured the sample. AS prepared Au-coated mica substrate; KS advised the protocol development for preparing the substrate. RS advised LDL preparation. S-PH, HF and HC reviewed the relevant literature and advised the team on data analysis. All authors reviewed and edited the manuscript and approved the final version of the manuscript.
References
Supplementary Material
Please find the following supplemental material available below.
For Open Access articles published under a Creative Commons License, all supplemental material carries the same license as the article it is associated with.
For non-Open Access articles published, all supplemental material carries a non-exclusive license, and permission requests for re-use of supplemental material or any part of supplemental material shall be sent directly to the copyright owner as specified in the copyright notice associated with the article.