
Abstract
Background
Measurement of chloride in sweat is an essential part of the diagnostic algorithm for cystic fibrosis. The lack in sensitivity and reproducibility of current methods led us to develop an ion chromatography/high-performance liquid chromatography (IC/HPLC) method, suitable for the analysis of both chloride and sodium in small volumes of sweat.
Methods
Precision, linearity and limit of detection of an in-house developed IC/HPLC method were established. Method comparison between the newly developed IC/HPLC method and the traditional Chlorocounter was performed, and trueness was determined using Passing Bablok method comparison with external quality assurance material (Royal College of Pathologists of Australasia).
Results
Precision and linearity fulfill criteria as established by UK guidelines are comparable with inductively coupled plasma-mass spectrometry methods. Passing Bablok analysis demonstrated excellent correlation between IC/HPLC measurements and external quality assessment target values, for both chloride and sodium. With a limit of quantitation of 0.95 mmol/L, our method is suitable for the analysis of small amounts of sweat and can thus be used in combination with the Macroduct collection system.
Conclusions
Although a chromatographic application results in a somewhat more expensive test compared to a Chlorocounter test, more accurate measurements are achieved. In addition, simultaneous measurements of sodium concentrations will result in better detection of false positives, less test repeating and thus faster and more accurate and effective diagnosis. The described IC/HPLC method, therefore, provides a precise, relatively cheap and easy-to-handle application for the analysis of both chloride and sodium in sweat.
Introduction
Cystic fibrosis (CF) is the most common autosomal recessive genetic disorder in Western Europe, with an incidence of 1:2500. Due to defects in the cystic fibrosis transmembrane conductance regulator, abnormally high amounts of chloride are excreted in sweat, which is accompanied by high sodium concentrations to maintain electroneutrality. Even with the introduction of gene mutation analysis and the introduction of newborn screening programs for CF, analysis of chloride concentration in sweat (the ‘sweattest’) remains an essential part of the diagnostic algorithm for CF. 1
In our laboratory, sweat is induced using the traditional iontophoresis method of Gibson and Cooke 2 with sweat collection onto filter paper for analysis. Until recently, we determined chloride concentrations using coulometry (Chlorocounter). Several surveys have demonstrated that sweat testing procedures differ widely.3–5 Minimum sweat collection and minimum age/weight of the newborn vary between laboratories. Also, laboratories maintain different reference values and employ different techniques. Used techniques apart from coulometry are flame photometry, ion selective electrodes, and colorimetry. Due to our enrollment in the Royal College of Pathologists of Australasia (RCPA) external quality assessment (EQA) program for chloride, we were faced with the occasional lack of agreement with consensus values, especially at borderline CF chloride concentration ranges (20–30 mmol/L). Clinically, this led to several false-positive and false-negative results. At the same time, the Australian Association of Clinical Biochemists (AACB) working party adjusted the allowable limits of performance from 10% to 5%, a criterion that Chlorocounter measurements could not meet. In addition, although determination of sodium concentrations alone is not suitable for the diagnosis of CF, sodium measurements are a valuable addition as a control on pre-analysis, since a relatively high sodium concentration may reveal sample contamination. 6 Also, elevated chloride concentrations may result from other pathophysiological conditions, such as Addison’s disease, or aging (electrolyte concentrations in sweat increase with age), thus leading to chloride concentrations compatible with CF. Sodium concentrations may contribute to the interpretation of these borderline elevated chloride concentrations, as a chloride/sodium ratio <1 points to other causes of sweat chloride elevation, whereas a chloride/sodium ratio >1 supports the diagnosis of (mild) CF. Measurements of sodium concentration could thus prevent a false-positive diagnosis of CF and provide a valuable addition as a control on pre-analysis. With the implementation of a new test, we, therefore, aimed at measurement of both chloride and sodium concentrations.
In the Netherlands, the majority of laboratories now use the Wescor® Macroduct™ Sweat Collection system, a more practical and reliable system than traditional collection onto filter paper. 7 Sweat induction is still based on pilocarpine iontophoresis, and sweat is collected in a coiled capillary instead of on a filter paper. The use of pilocarpine gels in both electrodes prevents contamination with electrolytes. Several, somewhat older, studies have demonstrated a decrease in sweat conductivity (and thus sweat electrolyte concentration) with a diminishing sweat rate,8,9 and therefore, guidelines state that a minimum sweat rate of 1 g/m2/min is required, which corresponds to 71 mg sweat in 30 min on a 5.5-cm diameter filter paper. In general, 100 mg sweat within a period of 30 min is used as a minimum for reliable CF analysis. With the Macroduct™, a sweat volume of approximately 15 µL is equivalent to 100 mg sweat obtained by pad absorption. Such small volumes of sweat thus require a sensitive method to determine chloride (and sodium) concentrations. The complete Macroduct collection and analysis system allows direct sweat analysis by conductivity measurements. However, although studies on conductivity reference values have been published by several groups,10–13 so far consensus on reference values for sweat conductivity is missing. As outlined by Taylor et al., 14 deviation between conductivity and chloride concentration measurements increases at higher ionic strength, and no studies have been performed in patients with inconclusive or mild CF. Both the CF foundation guidelines 15 and UK guidelines, 6 therefore, state that sweat conductivity measurements may be used in a screening approach, but that they require further study and that diagnosis of CF should not be based on conductivity measurements alone. Therefore, although the Macro- and Nanoduct system provide integrated conductivity analysis, analysis of chloride and sodium concentrations instead of conductivity remains the method of choice.
Recently, Pullan et al. 7 described a precise method for the analysis of sweat, using inductively coupled plasma mass spectrometry (ICP-MS). Since MS equipment is expensive and not widely implemented, our goal was to develop an accurate but relatively cheap and practical method for the determination of both chloride and sodium in small volumes of sweat. Here, we describe such a method, using ion chromatography/high-performance liquid chromatography (IC/HPLC).
Methods
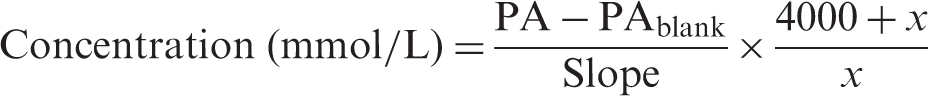
Sweat samples (n = 35) were obtained from routine sweat testing, including patients with clinical suspicion of CF and patients from the newborn screening program. Sweat was collected using traditional iontophoresis. Filter papers were collected in pre-weighted sweat collection cups, and sweat weight was determined. If the yield was below 50 mg, sweat collection was repeated. For patient comfort, tests with yields between 50 mg and 100 mg were analysed, but interpreted with great caution and generally repeated at a later time. Total sweat was dissolved by incubating the filter paper in 4000 µL ultra pure water, and chloride and sodium concentrations were determined using IC/HPLC. The IC system consisted of a Metrohm 861 Advanced compact IC equipped with a conductivity detector (Metrohm). For chloride, chromatographic separation was achieved using a Metrosep A supp 4 (250 × 4.0 mm) column with a Metrosep RP2 Guard/3.5, and 2 mM NaHCO3/Na2CO3 as eluent. To reduce eluent background conductivity, the Metrohm Suppressor Module (MSM) was used for chemical suppression. After each sample run, regeneration and rinsing of the MSM were performed for 5 min, with 50 mM H2SO4 and ultra pure water, respectively. For sodium, separation was achieved using the Metrosep C3 (250 × 4.0 mm) with a Metrosep C3 Guard, with 5 mM HNO3 as eluent. In this case, the MSM was not applied. Both sodium and chloride analyses were performed at room temperature, flow rates were set at 1 mL/min and CO2 was removed before detection by a CO2 suppressor, thereby further reducing background conductivity. The assay was calibrated by sodium chloride standards (range 0–2.5 mmol/L), and the standard curve was constructed by plotting peak area against concentration. As internal quality controls, commercially obtained aqueous, simulated human sweat matrix control samples (Quantimetrix, low, medium and high concentration) were included in each run, and an empty filter paper was used as a blank. Chloride and sodium concentration were calculated as follows
Data acquisition and processing were performed using IC Net 2.3 and Microsoft Office Excel, respectively. Statistical analyses were performed using Analyse-it and EP-evaluator.
Total analysis time of a full sample series including controls and blanks was around 3 h for chloride and an additional 3 h for sodium. Changing the columns in between chloride and sodium analysis takes approximately 30 min. Hands-on-time (including sample processing and data analysis) is estimated to be approximately 3 h, which is comparable to Chlorocounter measurements. Per sample, a minimum input of 250 µL (diluted sweat) was required.
Results
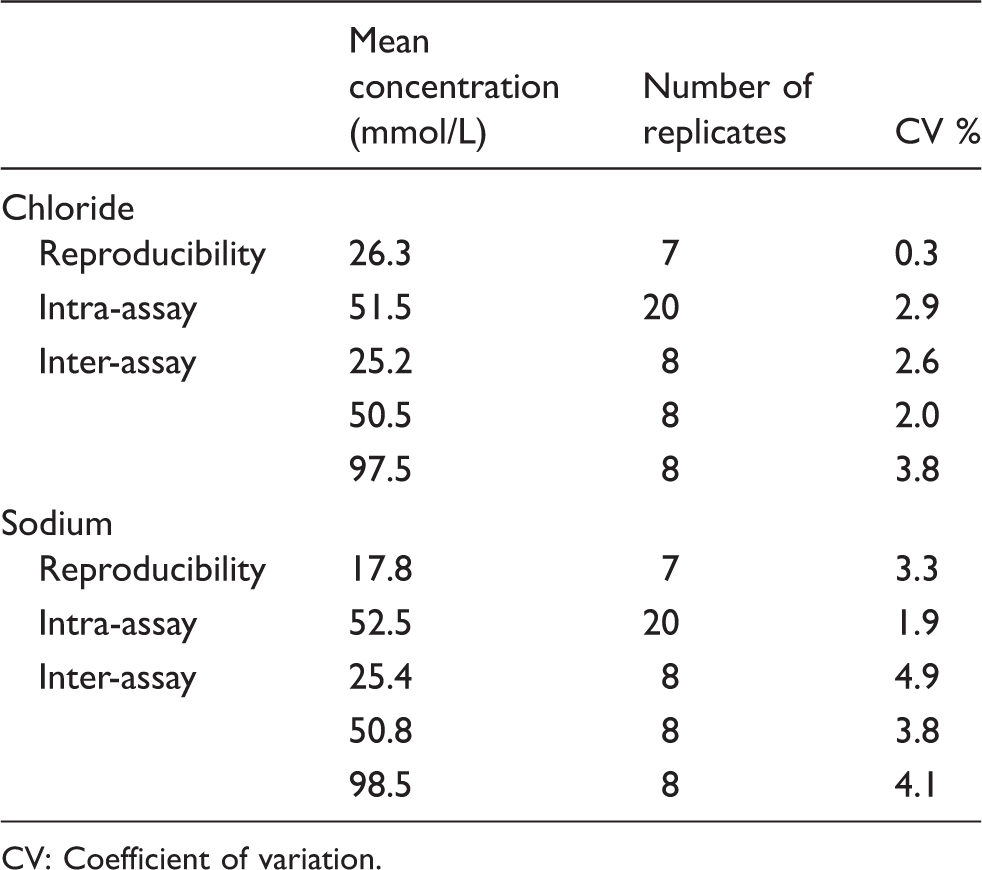
Figure 1 shows chromatograms for chloride and sodium, for RCPA control samples as well as patient sweat samples. Although patient samples contained some peaks of unknown origin, none of these interfere with chloride or sodium peaks. Table 1 lists the precision results of sodium and chloride measurements. Reproducibility measurements (n = 7) demonstrated a coefficient of variation (CV) of 0.3% at 26.3 mmol/L for chloride and of 3.3% at 17.8 mmol/L for sodium. Intra-assay precision (n = 20, sample processing included) was 2.9% at 51.5 mmol/L for chloride and 1.9% at 52.5 mmol/L for sodium. Inter-assay variation (n = 8) was determined at low, medium and high concentrations. For chloride, we found CVs of 2.6% at 25.2 mmol/L, 2.0% at 50.5 mmol/L and 3.8% at 97.5 mmol/L. For sodium, we found CVs of 4.9% at 25.4 mmol/L, 3.8% at 50.8 mmol/L and 4.1% at 98.5 mmol/L. The method was linear up to 10 mmol/L for both chloride and sodium, which, after correction for dilution (×40), corresponds to 400 mmol/L sweat, and the limit of quantitation (LOQ), determined as the concentration with a CV of 20%, was 0.0238 mmol/L (corrected = 0.95 mmol/L in sweat) for chloride and 0.0088 mmol/L (corrected = 0.35 mmol/L in sweat) for sodium. These specifications well fulfill the criteria of the (in 2013 adapted) UK guidelines, which recommend a CV <5% at concentrations up to 40 mmol/L for chloride and sodium and a limit of detection of at least 10 mmol/L.
IC/HPLC chromatograms of chloride (left) and sodium (right). Upper graphs show RCPA control samples and lower graphs show patient sweat samples. No interference of other analytes were observed. Precision of chloride and sodium measurements. CV: Coefficient of variation.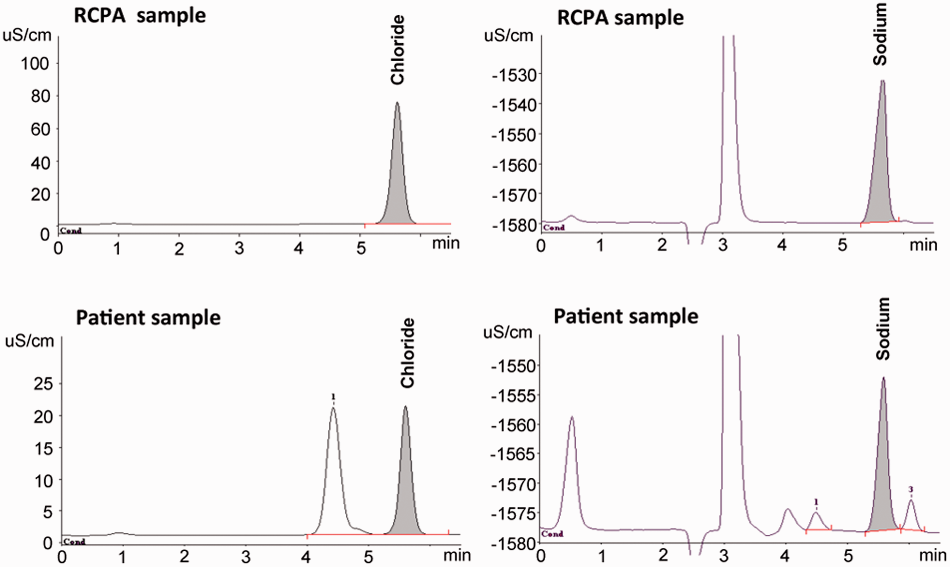
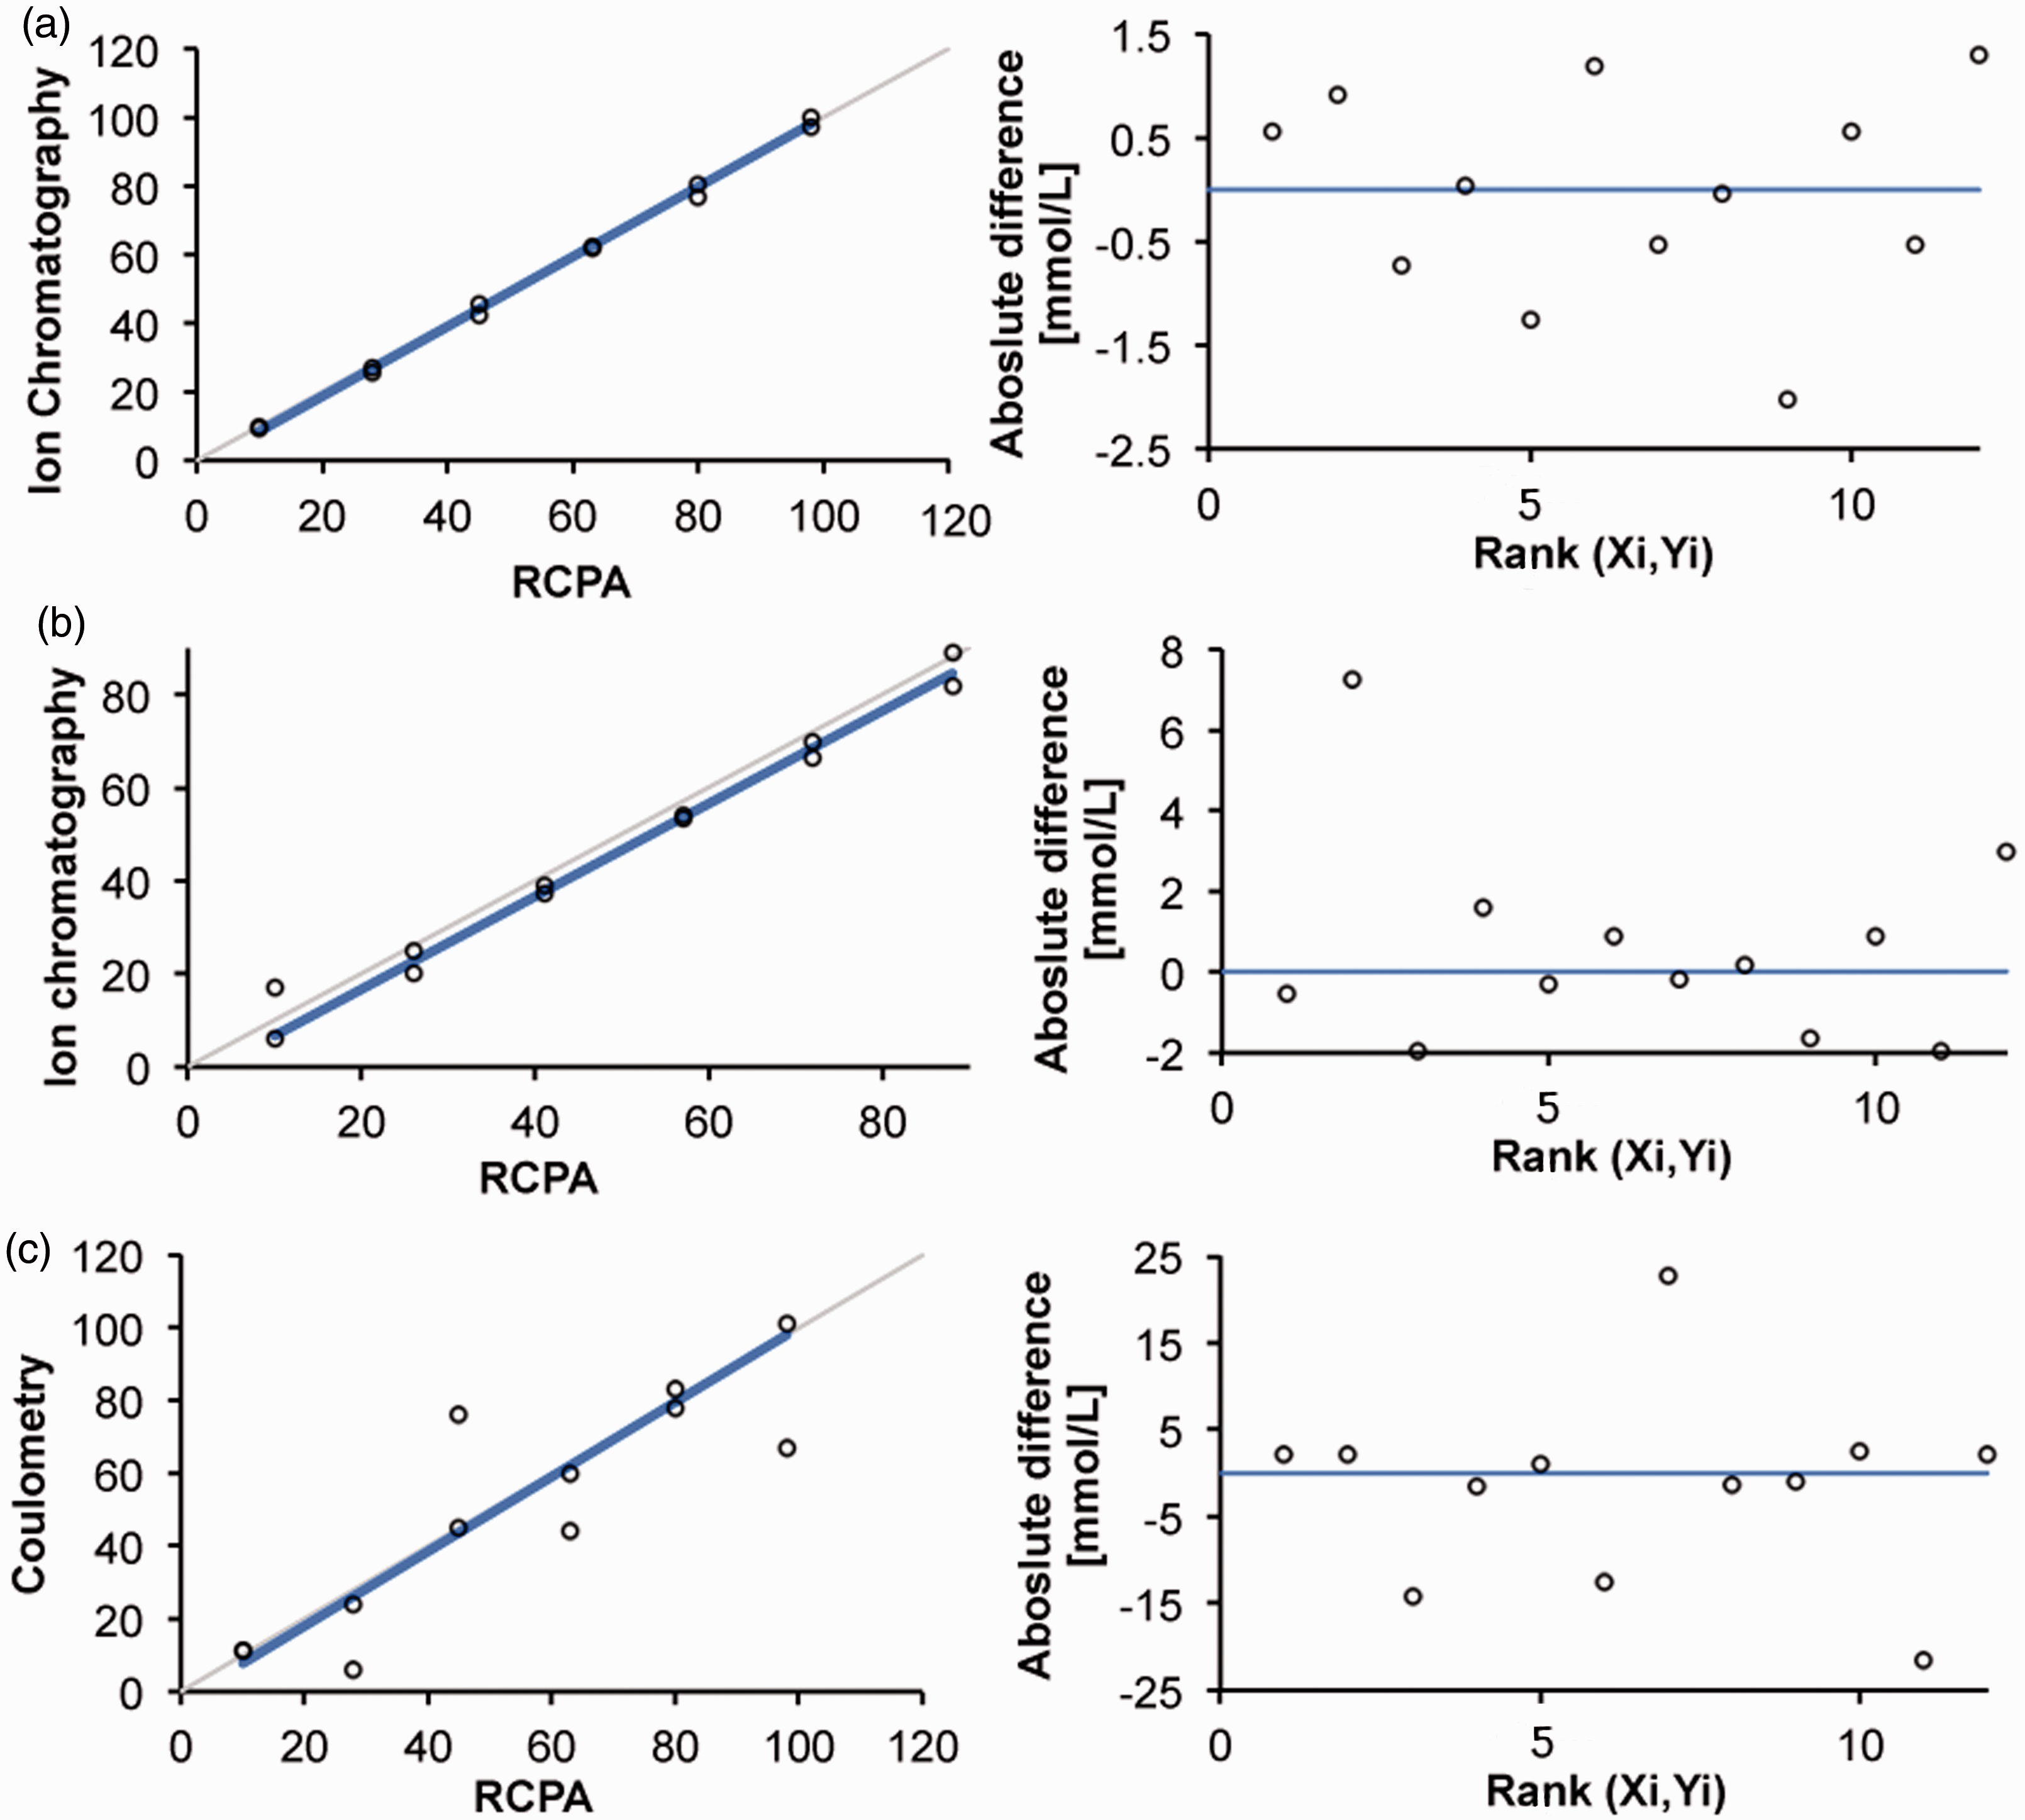
For chloride, Passing Bablok method comparison (n = 47: 35 patients’ samples and 12 RCPA control samples) between our newly developed IC/HPLC method and the traditional coulometry method not only demonstrated a good correlation between both methods (slope and intercept ≠ significantly from 1 and 0, respectively) but also displayed rather large variation and some outliers, as shown in Figure 2. Therefore, the results of 12 samples of the RCPA quality assurance program were compared with the chlorocounter and the IC/HPLC method. As demonstrated in Figure 3, Passing Bablok analysis of these data shows that our IC/HPLC method highly correlates with RCPA target values, with average deviations of 0.5 mmol/L and a maximum deviation of 2.0 mmol/L. In contrast, coulometry measurements show large variation, with average deviations of 3–4 mmol/L and maximum deviations of 15–20 mmol/L from RCPA target values. Sodium measurements correlate well with RCPA target values within the clinical relevant concentration range (30–70 mmol/L), although a small negative bias of 3 mmol/L was observed. Also, variation increased at higher and lower concentration, but average deviation was 2 mmol/L. As chloride will be used as the main diagnostic criterion and sodium functions as a control, this was considered clinically insignificant.
Passing Bablok method comparison between coulometry and ion chromatography (IC/HPLC) for chloride measurements. Left: identity plot; right: Bland–Altman difference plot. Passing Bablok comparison between IC/HPLC and target values of RCPA EQA, for chloride (a) and sodium (b). (c) Passing Bablok comparison between coulometry measurements and RCPA target values. Left: identity plot; right: Bland–Altman difference plot.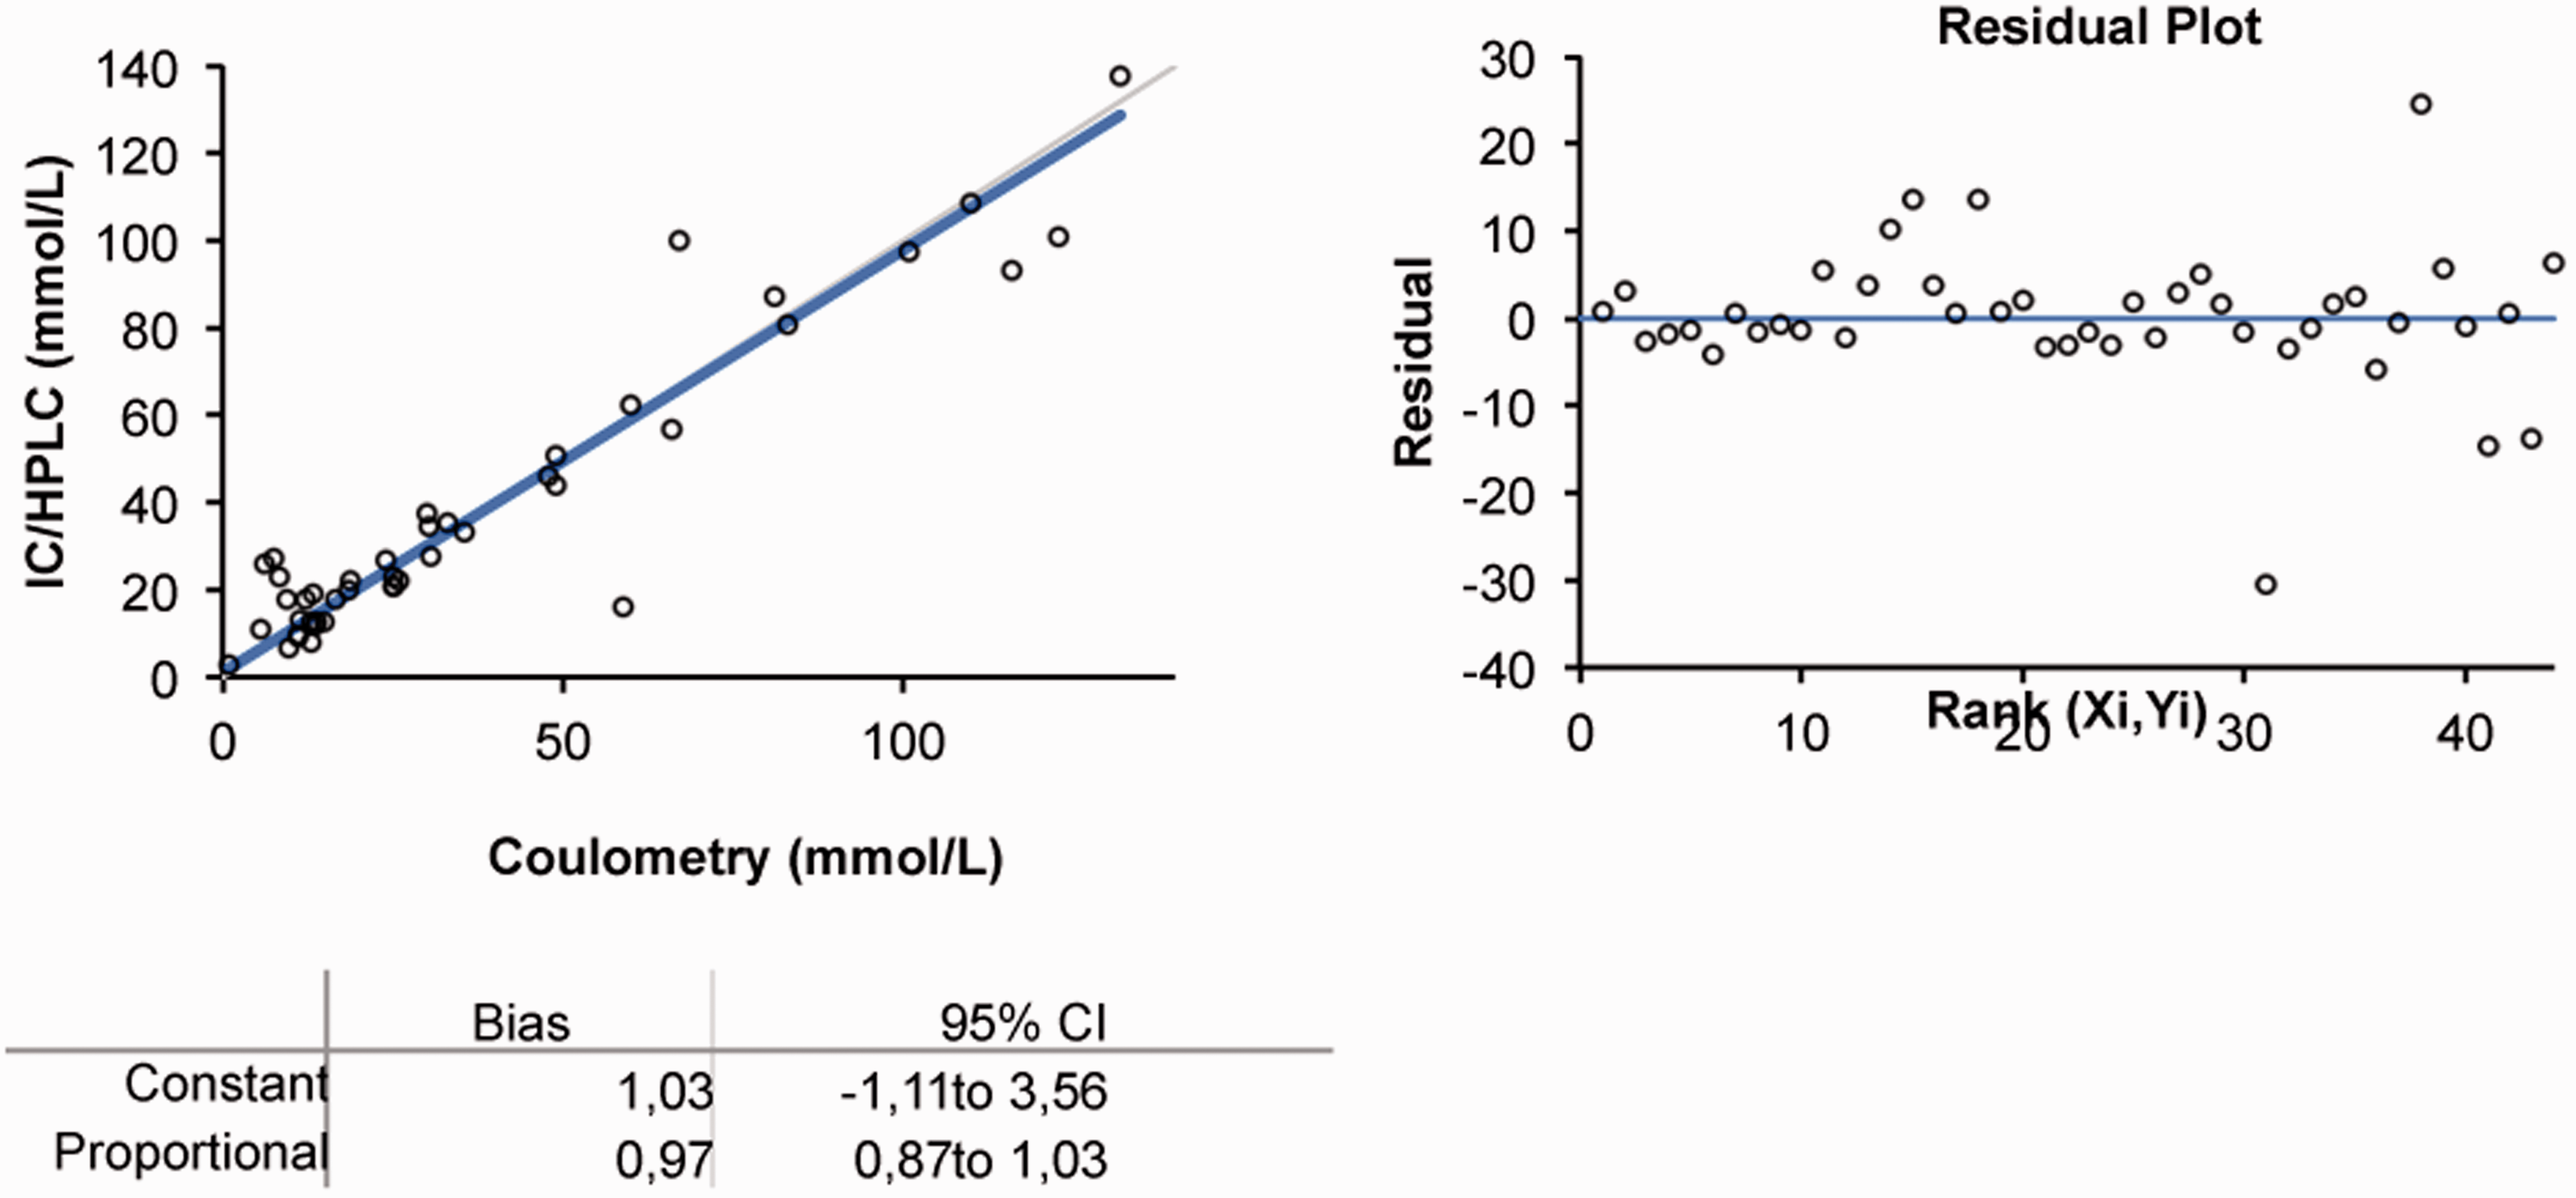
Discussion
Bearing in mind the severity of CF and the impact of this diagnosis, it is of extreme importance that the proper diagnosis is made. Although the ‘sweattest’ is an essential part of the diagnostic algorithm for CF, pre-analysis and laboratory methods vary widely and there is a lack in standardization, which may lead to inaccurate or delayed diagnosis. Methods/equipment for the measurement of chloride and sodium vary from flame photometry, ion selective electrodes (ISE), coulometric and colorimetric methods to ICP-MS.3,4,6 ISE modules are often incorporated in routine clinical chemistry analysers and thus available in most laboratories. Small volumes (as obtained with the Macroduct), however, are not compatible with ISE measurements and dilution leads to concentrations below the linear range. Spiking of samples with saline and calculation of the initial chloride/sodium concentration was described; 16 however, in our opinion errors may be introduced when applying this procedure. Flame photometry as well as dedicated chloride meters generally require somewhat larger analysis volumes also. Furthermore, these instruments have become outdated and are not easily serviced or replaced and, more importantly, lack precision and accuracy. In 2000, a survey in the UK revealed that almost half of the questioned laboratories did not include internal quality control (IQC) in pre-analysis and an EQA was not available at the time. 3 As a result of this survey, in 2003, guidelines for the performance of the sweattest as well as an EQA were introduced. 6 These guidelines describe variation coefficients of 5–10% for chloride and 5–7% for sodium at a concentration of 50 mmol/L, with the highest CVs observed in ISE and enzymatic methods. In our own experience, CVs significantly increase at lower concentrations, which is also reflected in recent results of the Australian RCPA quality assurance program. In 2013, 27 laboratories enrolled in this program, and overall CVs ranged from 2.0% for IC/HPLC to 5.0–8.2% for direct ISE measurements. However, in the lower range (10–30 mmol/L), for some specimens, 20–30% of participating laboratories reported results outside the performance limits and as a result, clinical interpretations of the same specimen varied between normal/equivocal and equivocal/positive. For this EQA, allowable limits of performance were set at 10%; however, after a recent review by the AACB working party, this was adjusted to 5%, in concordance with UK guidelines. This means that an additional number of laboratories (including our own before introduction of the new method) will fail to meet the criteria.
As stated above, many hospitals have introduced the Wescor® Macroduct™ Sweat Collection system. 7 The system is more user- and patient-friendly than the traditional collection onto filter paper and was demonstrated to have a lower failure rate due to insufficient sweat collection. 17 As mentioned, small volumes of sweat are obtained, and thus a sensitive method is required for analysis. By using the complete Macro- or Nanoduct system, it is possible to analyse sweat conductivity immediately after collection. Since studies on conductivity measurements in mild CF are lacking and there is no consensus on reference values, measurement of chloride (and if possible sodium) concentration is the method of choice. We have, therefore, performed a few initial tests to evaluate if our method can be used in combination with the Macroduct coil. The Macroduct collection coil contains a blue dye to visualize sweat collection, and we found that this dye does not interfere in HPLC chromatograms. Although further evaluation is required, initial results demonstrate good compatibility with the Macroduct collection system.
To our knowledge, two HPLC methods for the analysis of chloride in sweat have been described. An IC/HPLC method was developed by Miller et al. 18 Unfortunately, method characteristics or validation data were not provided. The chromatograms suffer from a number of additional peaks, which may possibly interfere with chloride analysis. Due to the use of a conductivity detector in our system, the amount of (interfering) peaks is greatly reduced. Keevil et al. 19 reported a reversed-phase HPLC method with similar analytical characteristics as our method. A comparison with ISE measurements demonstrated good correlation; however, ISE measurements are not the gold standard and EQA data were not provided, most likely due to the lack of an EQA program at the time. Also, the system was not tested in combination with the Macroduct. Most importantly, sodium analysis was not included in these methods, which we feel to be an indispensable measurand for the diagnosis of CF. Recently, Pullan et al. 7 described an ICP-MS method for the analysis of sweat, with excellent analytical characteristics. However, MS equipment is costly and requires skilled personnel and for these reasons it is not widely implemented. The IC/HPLC method that we describe here has similar or lower CVs compared to ICP-MS and shows equal concordance with EQA samples. Although the equipment is more specialized and expensive than Chlorocounter or ISE equipment, we believe that the higher accuracy and the additional measurement of sodium concentrations makes this method cost-effective, due to better identification of false-positive tests (and thus prevention of false diagnosis) and a reduction in the number of repeated tests. In addition, with different columns, the IC equipment may be employed for other medical (i.e. organic acids and sugars) as well as pharmaceutical (i.e. drug analysis) applications.
Routinely, in our laboratory sweattests are collected and analysed weekly. The introduction of the newborn screening in the Netherlands, however, requires a fast confirmatory test, to relieve parental anxiety after a positive screening. Dutch guidelines state that a sweattest should be performed and analysed within 48 h after informing the parents of a positive neonatal screening test result. 20 With a complete analysis time of approximately 7 h, our IC/HPLC method provides results in a timely manner, with the possibility of reporting preliminary chloride concentrations (within approximately 3 h) even faster in case of clinical urgency. Furthermore, these IC/HPLC results are accurate and reliable, thus providing a quick definitive diagnosis. Due to the simplicity of the method, laboratory technicians are easily kept familiar with the assay, even when they perform the assay approximately once a month.
To conclude, we present a newly developed IC/HPLC method for the determination of chloride and sodium concentrations in sweat, for the diagnosis of CF. Most laboratories have HPLC instrumentation available and our method encompasses a simple set-up, without extensive sample preparation. In addition, this method demonstrates high precision, trueness, a wide linear range and an excellent LOQ that is compatible with the Macroduct collection system.
Footnotes
Declaration of conflicting interests
None declared.
Funding
This research received no specific grant from any funding agency in the public, commercial, or not-for-profit sectors.
Ethical approval
Not required.
Guarantor
JD.
Contributorship
IK and WHAJ conceived the study. JD researched the literature, performed data analysis and wrote the first draft of the manuscript. TTRS and AM performed the practical work and data analysis. TTRS, WHAJ, BR and IK edited the manuscript. All authors reviewed the manuscript and approved the final submitted version of the manuscript.