
Abstract
Background
Median diagnostic delay of five to six years seen in primary hypogammaglobulinaemia results in morbidity including bronchiectasis. Patients typically have multiple health care encounters and blood tests before the diagnosis is considered. We report outcomes from using the difference between total protein and albumin (globulin fraction) to reduce diagnostic delay in unsuspected hypogammaglobulinaemia.
Methods
A prospective >5 year programme in the setting of a National Health Services Hospital Blood Sciences pathology service processing serum samples from primary and secondary care. Patients with globulin fraction below the first percentile were reviewed in the context of supplied clinical details. Immunoglobulin measurements were performed in selected patients.
Results
Of 2,910,850 globulin fractions 27,304 (0.9%) were below the 1st percentile globulin fraction (<18 g/L). After exclusions, 933 (3% of these) had immunoglobulins measured. Of these, 292 had IgG < 5 g/L, 186 < 4 g/L and 80 < 3 g/L, giving respective positive predictive values of 31%, 20% and 8.6%. Positive predictive value for common variable immunodeficiency was 1.3%. We identified 12 new cases of common variable immunodeficiency, 10 new haematological disorders and 20 hypogammaglobulinaemias secondary to medication. Locally derived cut-offs are required as small differences between analysers have a significant effect on screen-positive rates.
Conclusions
Use of a 1st percentile globulin fraction improved early detection of hypogammaglobulinaemia. This is a useful adjunct to alert clinicians to unsuspected hypogammaglobulinaemia but should not replace immunoglobulin measurement. Patients with globulin fraction below the first percentile should be reviewed for possible hypogammaglobulinaemia.
Keywords
Introduction
The primary hypogammaglobulinaemias are an uncommon group of disorders in which diagnostic delay is common, with a median delay of between five and six years being reported in UK and USA.1,2 There may have been some improvement, with a UK study from 2005 reporting an average delay of two years. 3 The German national registry for primary immunodeficiency suggests that the situation has not improved and may even have deteriorated. 4 This is despite efforts from the European Society for Immunodeficiency (ESID) and others to reduce delay by publication of diagnostic pathway guidelines for non-immunologists.5–7 Diagnostic delay affects quality of life and incidence of end organ damage for these patients.2,3 In the case of primary antibody deficiency (PAD), delayed diagnosis risks the development of irreversible lung changes, such as bronchiectasis, which in turn increases the rate of further infection and progressive damage.2,3 There are a number of algorithms published to help in the recognition and differential diagnosis of immunodeficiency, but if these are not consulted and immunodeficiency is not considered as part of the differential, the diagnosis may be missed or delayed.5–7 A significant factor in delayed diagnosis is this failure to consider immunodeficiency. In our experience, this is partly due to the misconception that primary immunodeficiency is a childhood presentation. Common variable immunodeficiency (CVID), the commonest primary hypogammaglobulinaemia (after immunoglobulin A deficiency) has been reported at ages 3 to 79 years, has a median age for onset of symptoms of 23 and 28 years for males and females, respectively, 2 and an estimated overall prevalence of at least 3.7 per 100,000 population.4,8
CVID commonly presents with recurrent infections, mainly of the respiratory tract but also involving the gut and other sites. It also commonly presents with autoimmune disease, 9 granuloma 10 or cytopenias,2,9 all of which are common complications of this disorder.2,11 Many of these patients therefore have multiple encounters with health care systems during the years between disease development and diagnosis. During this period, multiple serum biochemistry profiles and often hospital admissions are common. These episodes present an opportunity to identify patients with unsuspected immunodeficiency and hence reduce diagnostic delay. It is recognized that patients with hypogammaglobulinaemia may have a low globulin fraction, calculated as the difference between serum total protein (TP) and albumin (AL). 12 This provides an opportunity for laboratories to alert clinicians to the possibility of hypogammaglobulinaemia in these patients. We have used this technique previously in an ad hoc manner but from March 2007 an upgrade to our computer software (to LabCentre v1.5, Clinisys UK) enabled us to initiate a more comprehensive and rigorous protocol for investigating patients with a low globulin fraction without delaying the reporting of the biochemical profiles upon which they were based. There are no published data on the use of calculated globulin fraction in screening for unsuspected hypogammaglobulinaemia. Similarly, there is no guidance on what lower limit should be used, how to derive that limit or the expected performance of any particular cut-off. Answers to these questions are important to inform ongoing debate about when to use TP and AL, especially in the context of harmonization of liver function and biochemistry profile test panels.
The serum globulin fraction consists of all serum proteins except AL. Immunoglobulins comprise only about 30% by mass and so there is significant potential for changes in other proteins to mask hypogammaglobulinaemia. Many of these proteins may increase during an acute phase response to infection, e.g. alpha-1-antitrypsin and complement components. In the scenario of a patient with hypogammaglobulinaemia presenting with infection, there is therefore the potential that a low globulin fraction would normalize during acute inflammation. We investigated the efficacy of globulin fraction for the detection of hypogammaglobulinaemia in routine practice. In this paper, we describe:
How we established criteria for suspicion of hypogammaglobulinaemia. A retrospective analysis of the efficacy of these criteria in a set of patients with an established diagnosis of CVID. Outcome data from six years of the prospective use of this protocol in routine practice.
Methods
Setting
Hull and East Yorkshire Hospitals NHS Trust (HEY) Pathology Department provides pathology services to a population of 600,000 in both primary and secondary care. The Clinical Biochemistry, Haematology and Immunology services form a Blood Sciences unit using a common laboratory computer system (LabCentre, Clinisys UK). Clinical Biochemistry performs about 460,000 serum TP and AL tests as part of biochemistry profiles or liver profiles each year. TP was measured by a rate biuret method and AL by bromocresol purple according to the manufacturer’s recommended method (LX20 analysers, Beckman Coulter UK, High Wycombe, UK). Requests are received from primary care (44%), HEY hospital inpatients (40%), HEY outpatients (15%) and other sources (1%). Serum immunoglobulin measurements were performed according to the manufacturer’s recommended methods on a BNII nephelometer (Siemens Healthcare Diagnostics, Frimley, UK).
All statistical procedures were performed using StatGraphics vXV (Statpoint); 95% confidence intervals for proportions were calculated by Wilson’s procedure with continuity correction.
Establishing criteria for suspicion of hypogammaglobulinaemia
Cut-off values to trigger referral of the globulin fraction result to an immunologist were calculated retrospectively from a historical set of 496,211 unselected anonymized consecutive biochemistry profiles received between February 2006 and February 2007. A cut-off was selected that balanced good sensitivity for low IgG against an acceptable result referral rate (considered to be <1% of all TP/AL tests performed). Sensitivity, specificity and positive and negative predictive values for detection of low Immunoglobulin G (IgG) along with correlation between globulin fraction and IgG concentration were calculated from a subset of these profiles. This subset comprised all samples that had IgG measured at the same time as TP and AL after exclusion of all patients with a known monoclonal paraprotein. A total of 5022 results were identified.
Retrospective analysis of the efficacy of the criteria in a set of patients with an established diagnosis of CVID
A retrospective audit of diagnostic delay was performed in February 2007 to establish a baseline for diagnostic delay in CVID in the local area. For the purposes of determining diagnostic delay, we considered the onset of symptoms to have occurred at the first of a series of two major or one major and two minor infections within a three-year period, as used by previous authors to assess diagnostic delay in immunodeficiency. 1 Available case notes of all adults receiving intravenous immunoglobulin replacement for a diagnosis of CVID according to ESID criteria were examined. Eight patients were identified. Serum TP and AL results were taken from case notes and the laboratory computer system in order to calculate globulin fraction.
Outcomes from prospective use of the protocol in routine practice
An agreed protocol as described below was introduced into routine prospective practice in March 2007. We report outcome data for the period March 2007 to December 2012.
During this period, all globulin fraction results (calculated as TP–AL) below 18 g/L in patients aged 10 years or older were referred by an automated system to a Clinical Immunologist (Principal or Consultant Clinical Scientist) for review after exclusion of oncology sources. Referral was electronic and did not delay the reporting of the biochemistry result. The results and clinical details provided with the current request were reviewed. Patients with a known cause for transient hypogammaglobulinaemia (e.g. postop or transfusion) or with known low IgG were excluded. All other samples had immunoglobulin measurements performed. Immunoglobulin reports were issued with a comment that ‘Immunoglobulins performed because of the low globulin fraction on biochemistry profile’ and low results telephoned to the requesting doctor if clinically indicated.
Performance was prospectively assessed on the number of new cases of hypogammaglobulinaemia (based on IgG below set limits of 3, 4 and 5 g/L) and a diagnosis of CVID according to ESID criteria. 13
Results
Establishing criteria for suspicion of hypogammaglobulinaemia
Figure 1 shows the positive correlation between serum IgG and globulin fraction (r2 = 0.73, p < 0.001) in the 5022 patients in whom immunoglobulins had been simultaneously requested at source and measured on the same sample. Use of the first percentile globulin fraction from the unselected group of 496,211 samples (globulin fraction < 18 g/L) as a cut-off for measuring immunoglobulins would have detected 58%, 59% and 50% of samples with IgG<3 g/L, <4 g/L and <5 g/L, respectively, in this group of 5022 patients. Table 1 shows the positive predictive value (PPV) and sensitivity of different globulin fraction cut-offs for the detection of various IgG concentrations in this group. For example, using a cut-off of <18 g/L would have given a sensitivity of 58% and PPV of 9.4% for IgG <3 g/L.
(a) Relationship between immunoglobulin G (IgG) concentration and calculated globulin fraction in 5022 serum samples and (b) globulin fraction results for IgG values of particular interest. The lower limit of the IgG reference interval is 6 g/L. Effect of globulin fraction cut-off on positive predictive values and sensitivity for low immunoglobulin G. Retrospective analysis of 5022 samples after exclusion of monoclonal paraproteins. Based on analysis of 496,211 unselected routine biochemistry profiles. Total number of the 5022 samples with IgG below cut-off. PPV: positive predictive value; IgG: immunoglobulin G; Sens: sensitivity.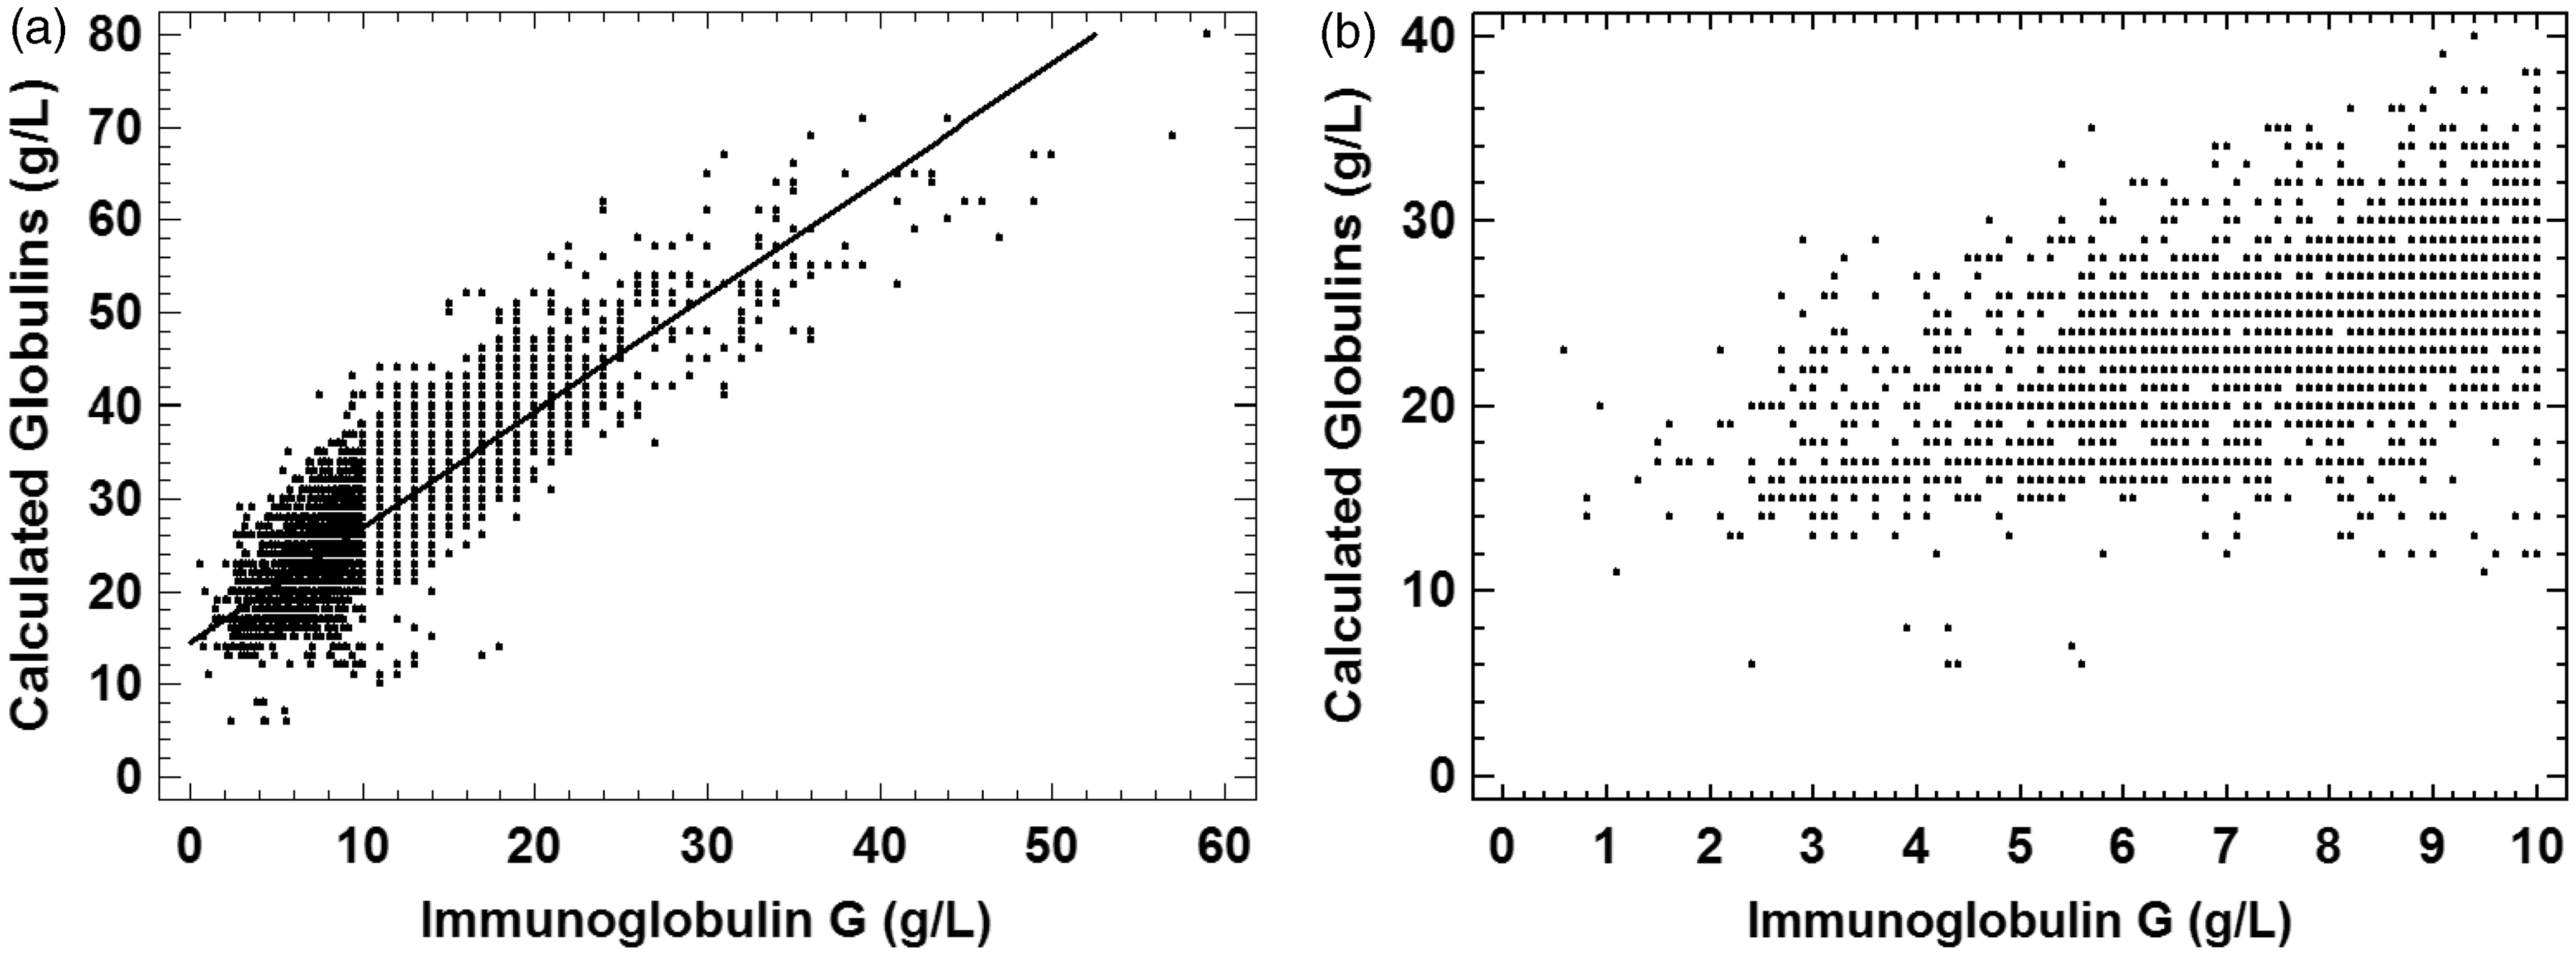
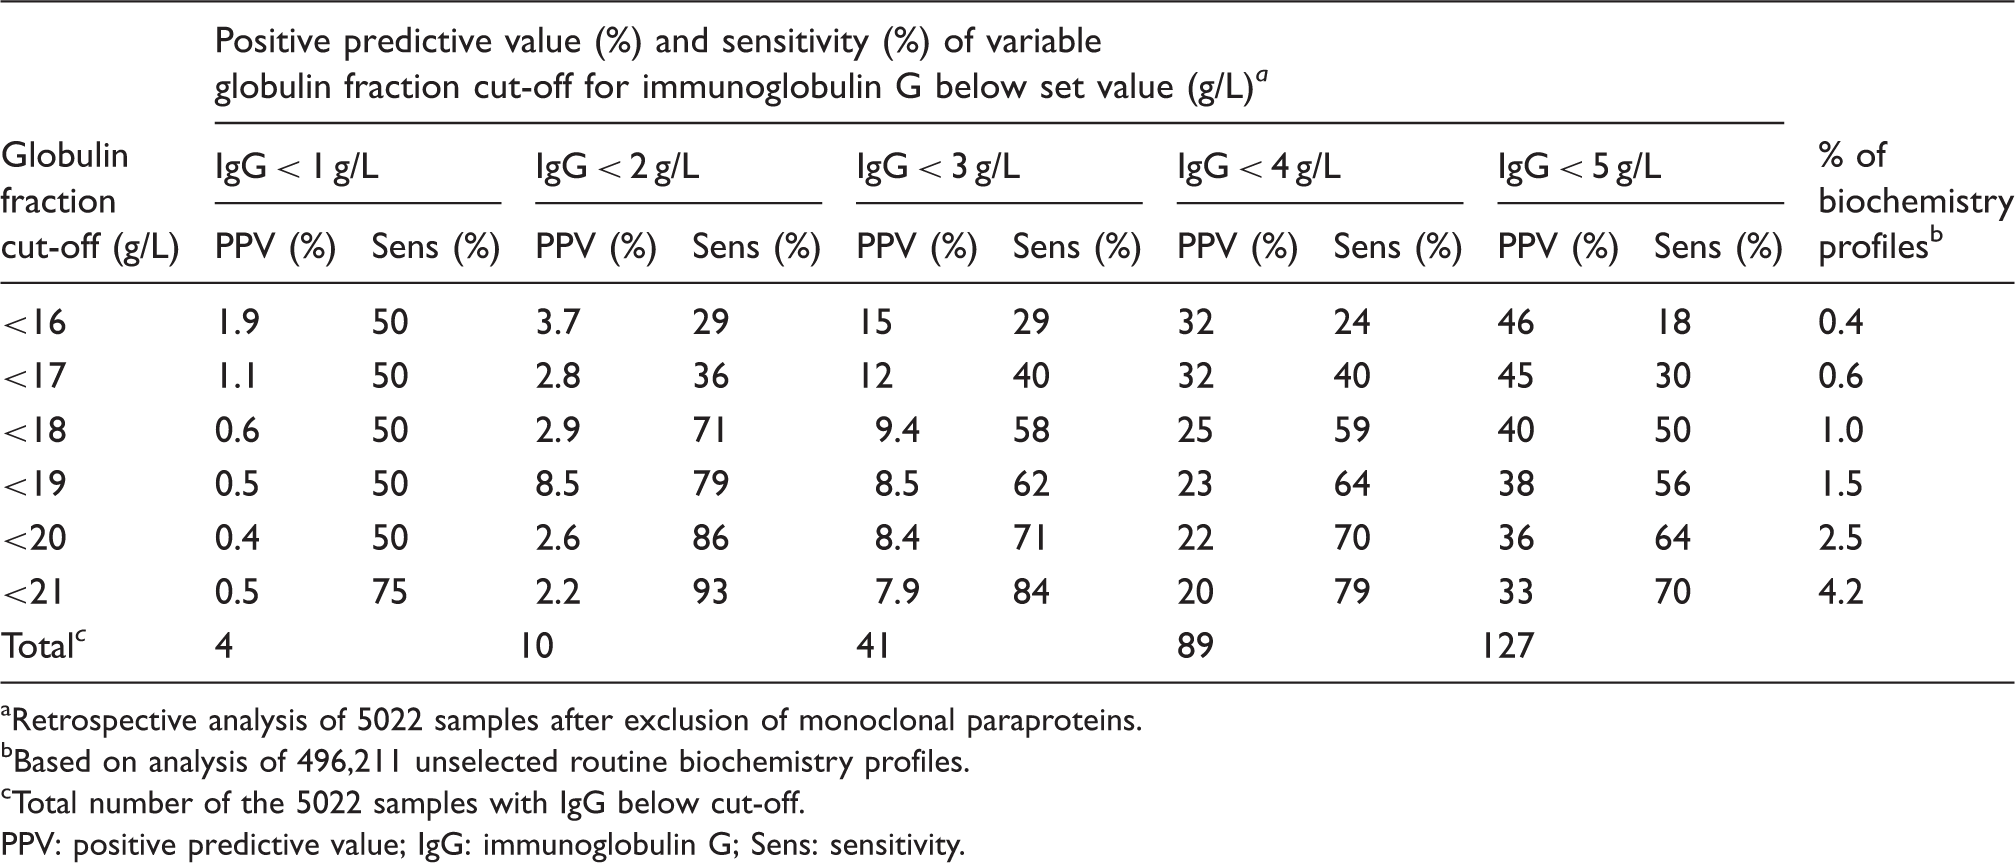
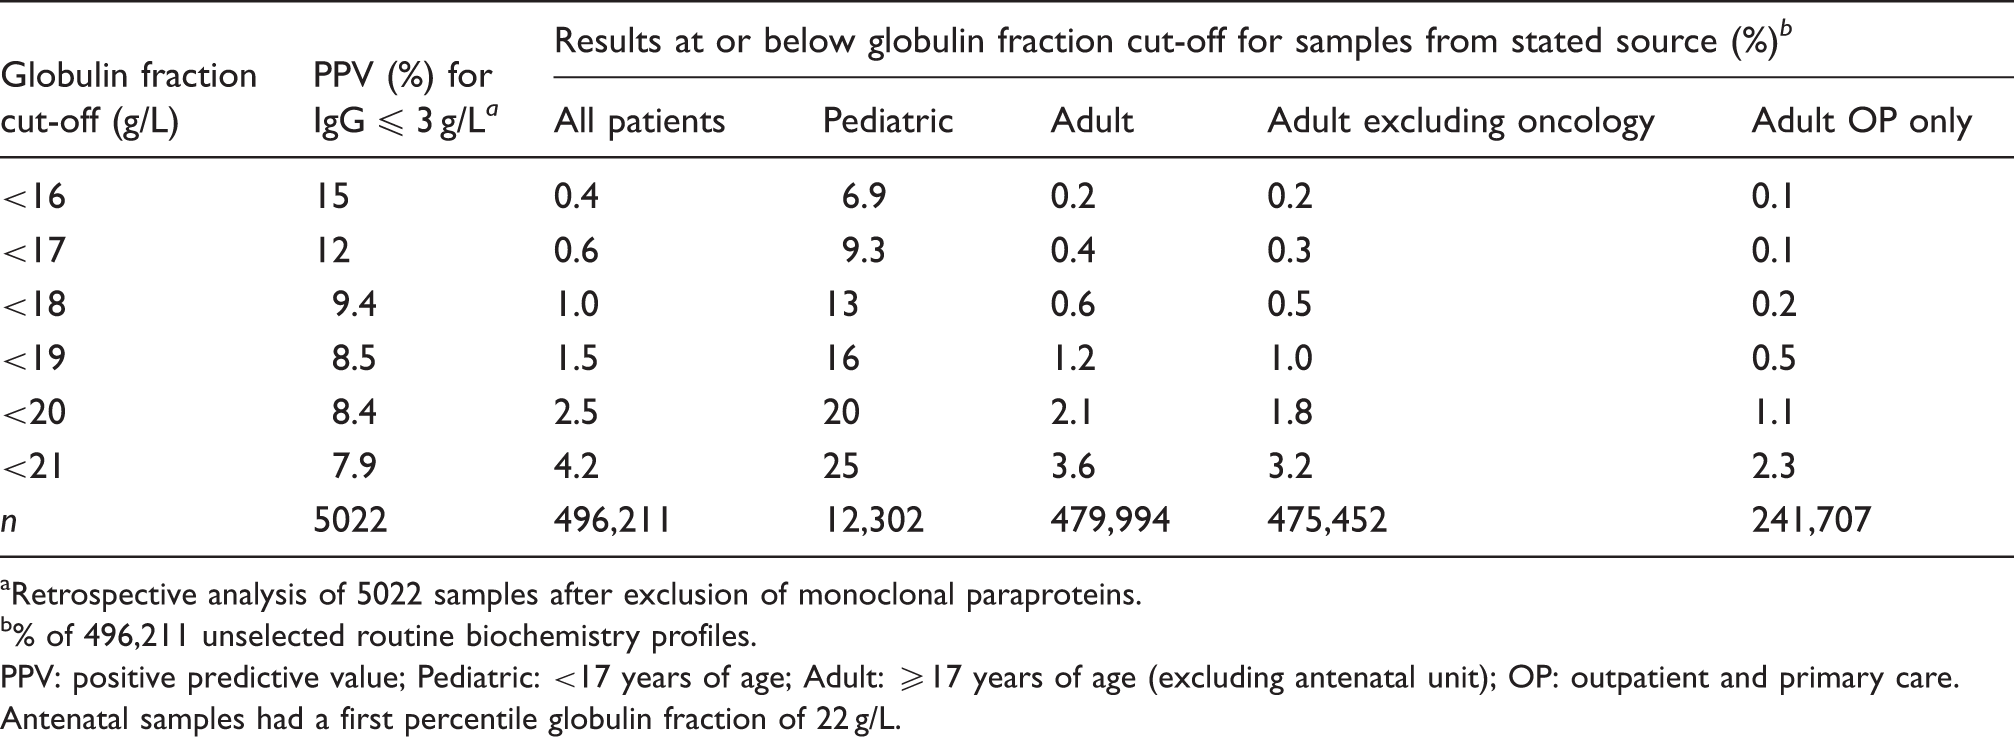
Figure 2 shows the effect of patient age on the proportion of patients with a globulin fraction below the cut-off value of 18 g/L. The proportion of results below this cut-off was highly variable up to age of about nine years but remained relatively stable thereafter. There was no significant difference in the proportion of patients with globulin fraction <18 (first percentile) when comparing outpatient and primary care samples (Pearson’s Chi-squared test, p > 0.05) but inpatient samples were significantly more likely to be below this cut-off (p < 0.001) than those from outpatient and primary care (Table 2). For example, 1.0% of all samples but only 0.2% of primary care and outpatient samples had a globulin fraction below 18 g/L.
Effect of age on the proportion of patients with globulin fraction <18 g/L. Effect of sample source on the screen-positive rate for various globulin fraction cut-offs. Retrospective analysis of 5022 samples after exclusion of monoclonal paraproteins. % of 496,211 unselected routine biochemistry profiles. PPV: positive predictive value; Pediatric: <17 years of age; Adult: ≥17 years of age (excluding antenatal unit); OP: outpatient and primary care. Antenatal samples had a first percentile globulin fraction of 22 g/L.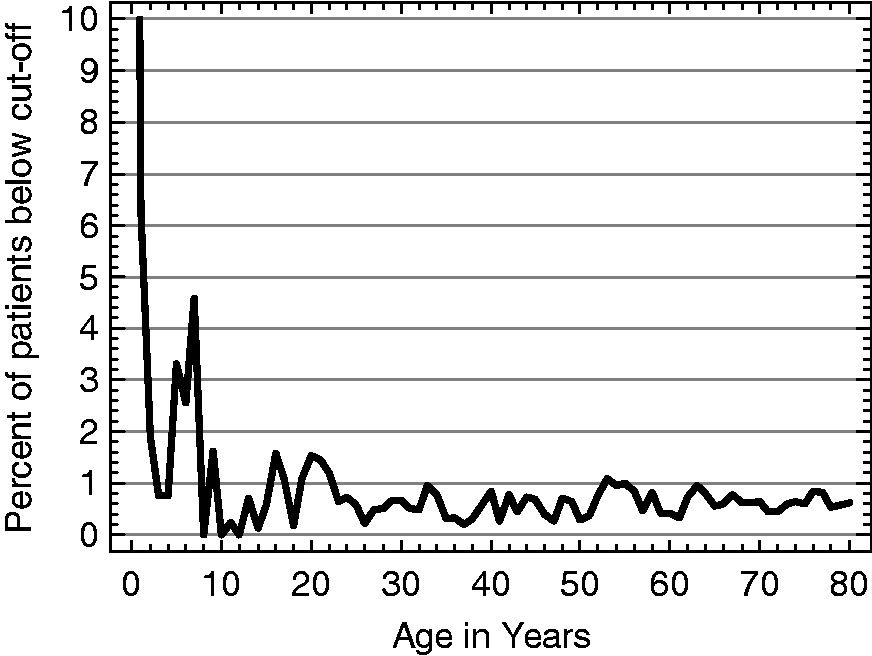
The receiver operating characteristic (ROC) curves in Figure 3 show the modelled efficacy of various globulin fraction cut-offs for the detection of IgG below a range of limits. All of the curves flatten significantly above a false positive rate of 1%. Based on these data, we established globulin fraction cut-off criteria that would balance the number of result referrals (screen-positive rate) against the PPV and sensitivity. A higher cut-off value increases the number of referrals and sensitivity while reducing the PPV and specificity. We considered a 1% referral rate for results to be acceptable as this would result in about 10–15 result referrals each day and our experience was that only two or three of these would require immunoglobulin measurement after exclusion of known causes of low globulin fraction.
ROC curves showing the effect of varying globulin fraction cut-offs for detection of specified immunoglobulin G concentrations. IgG: immunoglobulin G.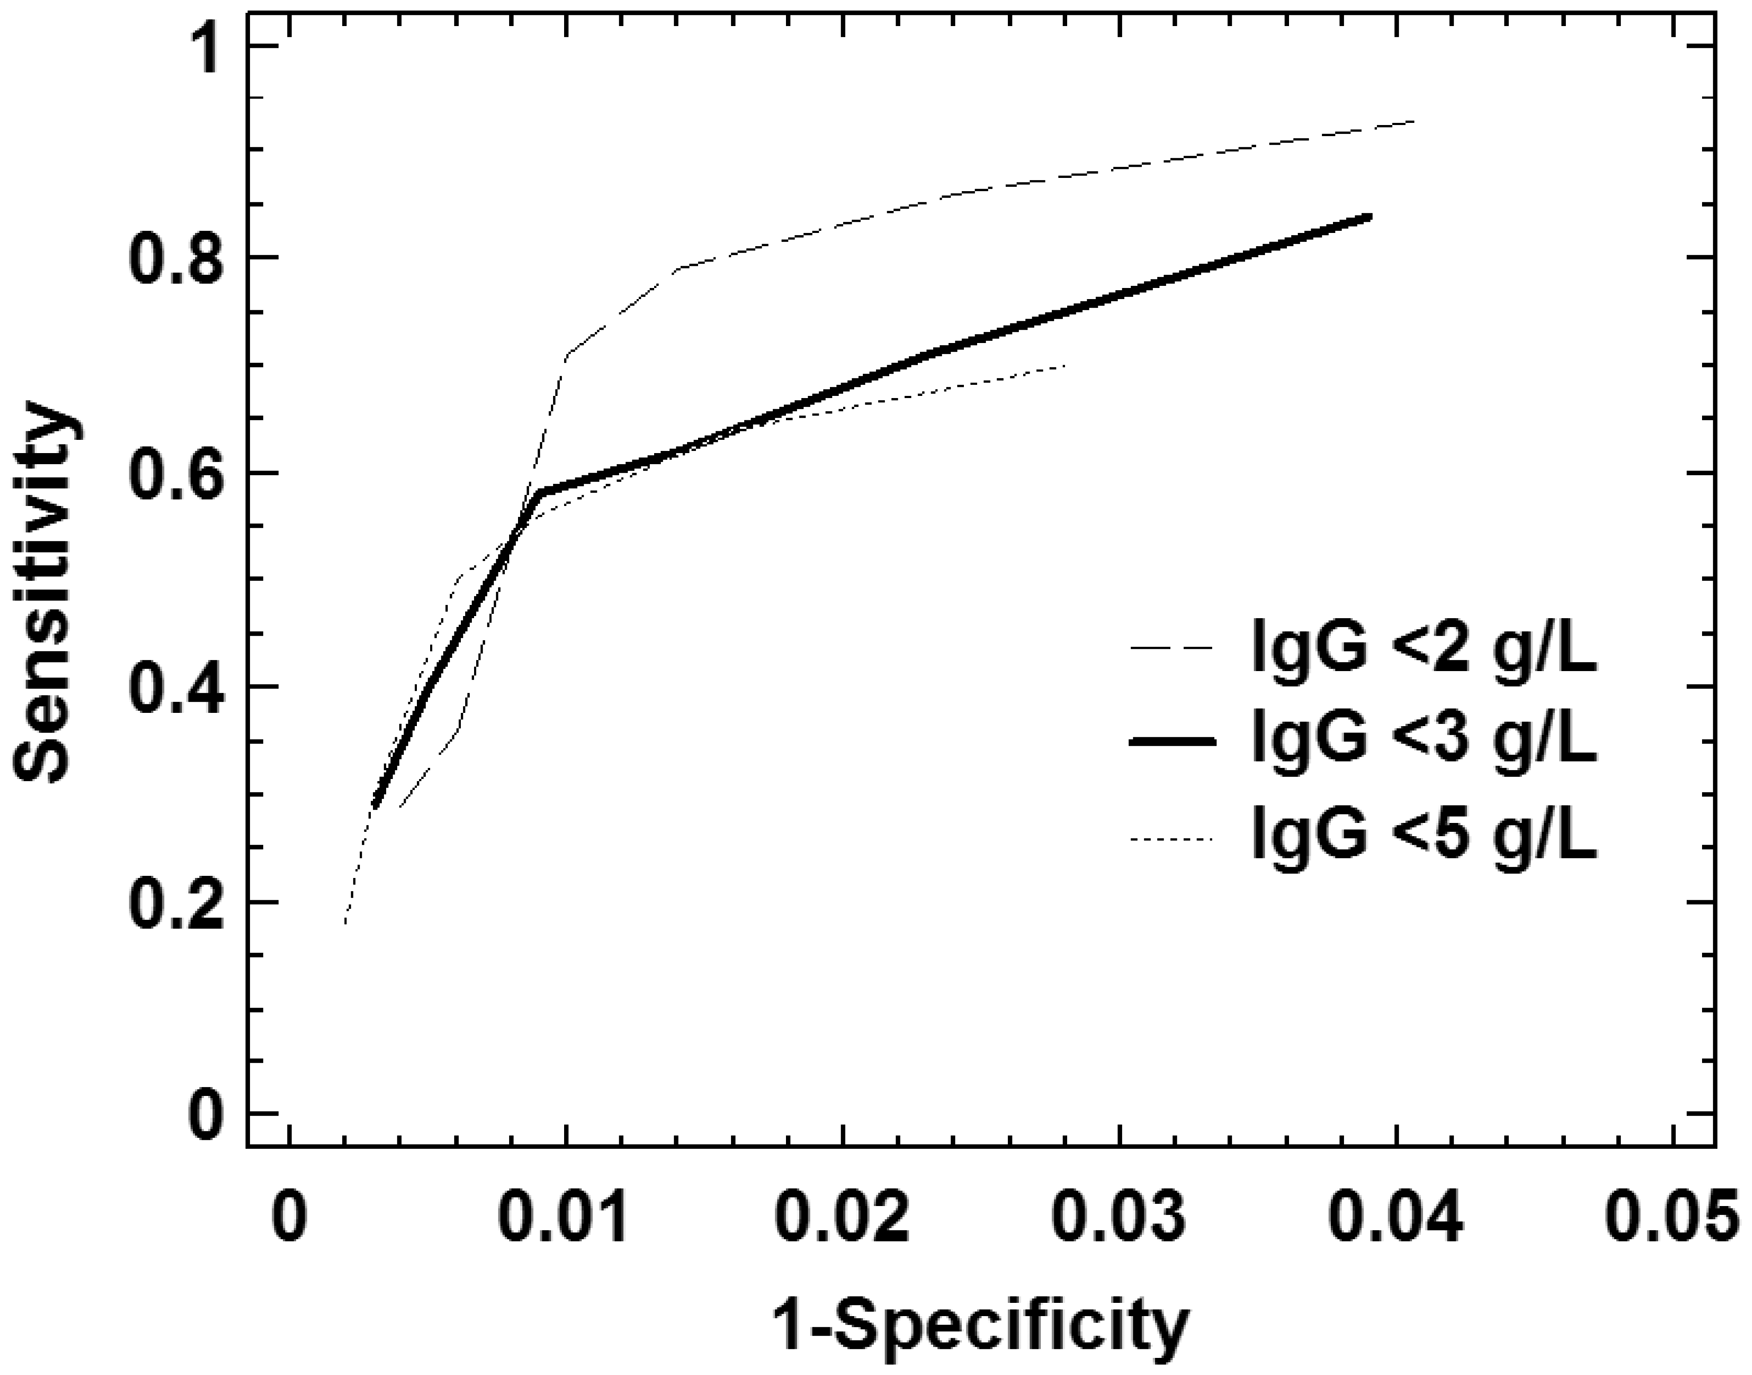
Retrospective analysis of the efficacy of the criteria in a set of patients with an established diagnosis of CVID
On the basis of results from section ‘Establishing criteria for suspicion of hypogammaglobulinaemia’, we established the following protocol for retrospective evaluation of eight adults with CVID:
Globulin fraction <18 g/L. Exclusion of samples from haematology and oncology specialties. Exclusion of samples taken postoperatively, post-transfusion or in high-dependency units. Exclusion of samples where a previous globulin fraction had been ≥20 g/L in the last two months (but not where there was evidence of concurrent infection or inflammation).
Among the group of eight adult patients with CVID, there was clinical evidence of diagnostic delay in five (60%), with a median (range) of four years (2 years–30 years). Retrospective application of the above protocol to historical data from these patients showed potential for a reduction in diagnostic delay in all five individuals. Median reduction was 3.5 years (range 2 months–18 years).
Figure 4 shows a typical set of historical results from a patient with CVID. This is a patient who had many biochemistry profiles performed and shows the progressive decline of the globulin fraction over a period of about nine months, providing an interesting insight into the timescale for the development of CVID. A similar timescale was seen in other patients when a good series of data was available.
Development of common variable immunodeficiency in a single patient. T: period of multiple transfusions; RT: commencement of immunoglobulin replacement therapy.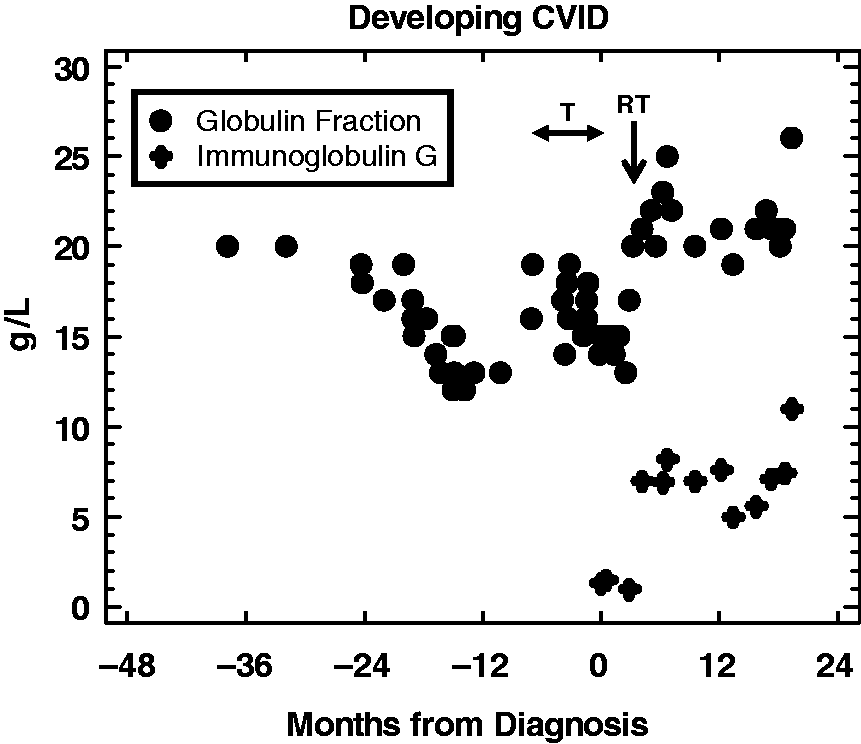
Outcomes from prospective use of the protocol in routine practice
Following the above study, we established the following protocol for referral of results to an immunologist in routine practice:
Age ≥ 10 years. Globulin fraction < 18 g/L. Exclusion of samples from haematology and oncology specialties.
Selection on the basis of the above criteria was automated by incorporating an algorithm into the laboratory information management system. Results fulfilling the criteria were referred to a clinical immunologist for assessment. The clinical immunologist then assessed the results and available patient information and excluded samples (i) taken postoperatively, post-transfusion or in high dependency units unless there was a history of recurrent infection (ii) where the globulin fraction had been ≥20 g/L in the previous two months (but not where there was evidence of concurrent infection or inflammation) (iii) when immunoglobulins had been measured appropriately in the previous three months. After exclusions, the remaining samples all had serum immunoglobulin concentrations measured (immunoglobulins G, A and M).
These criteria were used prospectively for the period between April 2007 and December 2012. During this period, 2,910,850 consecutive globulin fraction results were screened, of which 27,304 (0.9%) had a globulin fraction below 18 g/L (a mean of 88 per week). After exclusions (in accord with the protocol), 933 (3% of referred results) had immunoglobulins measured. Of these 933 samples, 292 had IgG < 5 g/L, 186 < 4 g/L and 80 < 3 g/L. The combination of globulin fraction <18 g/L and application of our selection criteria therefore had PPV (95% confidence interval) for IgG being below 5, 4 and 3 g/L of 31% (28–34%), 20% (18–23%) and 8.6% (7–11%). PPV for CVID was 1.3% (0.7–2.3%). When reporting these results, a recommendation to perform additional investigations including screening for secondary causes was made if IgG was <4 g/L. The results below 3 g/L were telephoned to the requesting doctor. Amongst patients with IgG < 4 g/L, 12 new CVID (nine now on replacement therapy, one on prophylactic antibiotics and two probable CVID currently untreated) were identified. Diagnosis of probable CVID was made on the basis of the established ESID diagnostic criteria.13 In addition, 10 new haematological disorders were identified (three non-Hodgkin’s lymphoma and seven monoclonal gammopathies). Monoclonal gammopathies identified included one AL amyloid, two oligosecretory myeloma, three light chain myeloma and one monoclonal gammopathy of uncertain significance. Twenty patients with probable secondary drug-related hypogammaglobulinaemia were also identified (six cyclophosphamide, three rituximab, three ciclosporin/tacrolimus, three valpoate, three sulfasalazine, two aurothiomalate).
Discussion
These data demonstrate (i) correlation between IgG concentration and globulin fraction, (ii) opportunistic screening using systematic criteria can reduce diagnostic delay for primary and secondary hypogammaglobulinaemia and (iii) good PPV and sensitivity can be achieved with an easily manageable screen-positive rate. Additionally, audit of the results from patients with established CVID showed that a diagnosis would have been achieved significantly earlier in 60% of patients had our criteria been in use at the time that their disease developed. These results demonstrate that routine use of low globulin fraction is an effective early warning of unsuspected primary and secondary hypogammaglobulinaemia with potential to reduce morbidity associated with delayed diagnosis.
The PPV in the prospective data showed a consistent trend to being lower than those calculated from the 5022 results in the retrospective study. This trend would be explained by a higher proportion of patients in the retrospective group with inflammatory disease. In inflammation, alpha and beta globulins such as alpha-1-antitrypsin, haptoglobin and complement may be increased so that immunoglobulins would need to be lower to achieve a low globulin fraction. As the retrospective group was unselected, it would be expected that there would be a significant group of patients with inflammatory disease, e.g. from rheumatology and gastroenterology sources. However, though there was a trend to lower PPV, these differences were not statistically significant (p = 0.64, 0.05 and 0.09 for IgG of <3, <4 and <5 g/L).
During the study period, only one additional patient with CVID was identified outside the study protocol, suggesting a sensitivity of 92% (12 of 13). However, this probably overestimates the true sensitivity due to the overrepresentation of low globulin fraction patients that would be expected in the implementation phase of a new programme. The modelled sensitivity of 59% for IgG < 4 g/L suggests that the globulin fraction cannot replace immunoglobulins for patients with symptoms of antibody deficiency but is a potentially very useful tool for reducing diagnostic delay for patients in which these disorders have not been considered. It remains necessary to be vigilant in clinical practice as this screen cannot be considered a replacement for a good clinical history-based differential diagnosis. Specific antibody deficiency with normal immunoglobulins (SPAD) will also be missed as these patients would be expected to have normal globulin fraction.
While there is a general awareness within pathology that low globulin fraction may result from hypogammaglobulinaemia there are no previously published data quantifying this relationship or how this may be effectively used in clinical practice.
Hypogammaglobulinaemia is easily confirmed by inexpensive immunoglobulin assays if the disorder is suspected. The problem is that these are rarely performed early in the diagnostic workup and this leads to diagnostic delay.1–3,14 We have shown that implementation of an opportunistic testing programme as part of the normal evaluation of routinely requested laboratory tests can significantly reduce diagnostic delay. Reducing diagnostic delay has significant benefits for these patients as inadequate immunoglobulin replacement has been shown to result in irreversible end organ damage.2,3 Use of these criteria to test for hypogammaglobulinaemia in our laboratory, performing about 460,000 globulin fraction calculations a year, resulted in the diagnosis of a new case of PAD (CVID) approximately once every six months. Some of these patients had a history of recurrent respiratory tract infections, a common presenting feature of this disorder, but a primary immunodeficiency had not been considered in the differential diagnosis. About 25% of our patients currently on immunoglobulin replacement therapy were picked up through this screening programme. Our aim in developing this protocol was to reduce diagnostic delay in PAD. In practice, the protocol has been beneficial in both primary and secondary disease. Ten new haematological disorders were identified as a result of low globulin fraction. These included six patients with AL amyloidosis, light chain multiple myeloma or non-secretory myeloma, diseases in which diagnostic delay is common and early diagnosis significantly reduces end organ damage and survival. We recently changed from using the Beckman LX20 to the Beckman AU5800 for measurement of TP and AL. Both analysers use colorimetric biuret and colorimetric bromcresol purple for TP and AL, respectively. However, as a result of the analyser change we have had to recalculate our 1st percentile for globulin fraction; previously <18 g/L, our cut-off is now <23 g/L. This difference in analysers is observed in external quality assessment reports (e.g. UKNEQAS) and may reflect a move from kinetic to end-point biuret method for TP. This demonstrates the critical importance of using locally derived cut-offs based on local technology and the distribution of globulin fraction in the tested population.
In using these criteria in routine practice for six years, we have detected clinically significant antibody deficiency in patients in whom this had not previously been suspected. Some of these had classical symptoms but the diagnosis had not been considered. Examples include a patient previously investigated for a persistent cough for possible Mycobacterium tuberculosis infection following a visit to Pakistan and a second patient with recurrent respiratory tract infections and multiple courses of antibiotics over a period of 18 months. Neither patient had had immunoglobulins measured. In disorders like CVID, recurrent chest infections result in bronchiectasis which exacerbates the predisposition to further infections. Delayed diagnosis is considered a significant factor in morbidity associated with this disorder. Our clinical impression is that patients with CVID are presenting earlier, with fewer infections and less end organ damage, though it is not possible to objectively assess this from the relatively small numbers involved.
There is potential to refine the protocol based on the source of sample. By excluding haematology and oncology requests, we may have excluded some patients presenting with idiopathic thrombocytopaenia (a common presenting feature of CVID) and oncology patients with drug-induced hypogammaglobulinaemia. 2 Since the end of this study and for this reason, we now include haematology and oncology patients. Using different cut-offs for different sources of samples may also potentially offer benefits. Our current cut-off only gives a 0.2% screen-positive rate for primary care and out patients, which is where most patients with primary disease will present. A significant contribution to the variability by source comes from lower globulin fractions in paediatric, postoperative and oncology patients. Increasing the cut-off limit irrespective of patient source results in diminishing returns (Figure 3), for example, our data suggest that cut-offs of <19 and <20 g/L would give screen-positive rates of 0.5% and 1.1% in primary care and outpatients compared with 0.2% for our current cut-off of <18 g/L. These relative increases in screen-positive rates of 150% and 450% would only increase sensitivity to 64% and 70% for the detection of IgG < 4 g/L (compared with 59% using <18 g/L). Though these sensitivities can only be considered indicative (as they are derived from the cohort of 5022 samples), this suggests a relative increase of only 8% and 19%, respectively, in sensitivity. Antenatal samples showed a higher first percentile (22 g/L) and so most low IgG results in this group of patients are probably being missed. The variability in globulin fraction distributions with age is more difficult to assess. Figure 2 shows a large shift at about age 10 years with the number of globulin fraction results below the population 1st percentile of 18 g/L falling rapidly and then stabilizing with increasing age. Paediatric samples are probably less likely to be taken from patients who may be generally well than adult samples are and so may have a greater proportion of patients with increased acute phase proteins. Rises in acute phase proteins will increase the globulin fraction. This was the rationale for a previous normal globulin fraction in a patient with evidence of infection or inflammation not being considered sufficient evidence of normal immunoglobulins in our criteria. How often immunoglobulin concentrations should be repeated when globulin fraction remains low is unknown as there are no data demonstrating the chronology of disease development. It is interesting to note the rapid fall in globulin fraction over a period of about nine months as demonstrated in Figure 4 and observed for other CVID patients with available historical records. This provides an intriguing insight into the time course of CVID development and this rapid fall may explain why patients with CVID typically presented with very low immunoglobulin concentrations (all <3 g/L in this cohort, with five <1 g/L) while patients with secondary disease tended to present with higher concentrations (77% > 3 g/L).
Conclusions
These data confirm the relationship between IgG concentrations and calculated globulin fraction. In addition, they demonstrate that application of calculated globulin fraction in clinical practice has potential to reduce diagnostic delay for patients with unsuspected primary or secondary hypogammaglobulinaemia.
Footnotes
Acknowledgments
SJ is supported by a NISCHR Fellowship.
Declaration of conflicting interests
The authors declare no conflicting interests.
Funding
This research received no specific grant from any funding agency in the public, commercial, or not-for-profit sectors.
Ethical approval
Not required, as this is a report of the outcome of a change in established routine practice.
Guarantor
SH.
Contributorship
SH conceived and designed the study, performed the statistical analysis and drafted the manuscript. SH, SK, WS, SJ, PD contributed to data interpretation and critically revised the manuscript for important intellectual content. SH is the guarantor.