
Abstract
Background
The role of glucagon-like peptide-1 (GLP-1) has become a new scientific interest in the field of pathophysiology of type 1 diabetes mellitus (T1DM), but the results of the published studies were contradictory. The aim of our study was therefore to measure fasting and postprandial GLP-1 concentrations in T1DM patients and in healthy controls and to examine the difference in those concentrations between the two groups of subjects.
Methods
The cross-sectional study included 30 C-peptide negative T1DM patients, median age 37 years (20–59), with disease duration 22 years (3–45), and 10 healthy controls, median age 30 years (27–47). Fasting and postprandial total and active GLP-1 concentrations were measured by ELISA (ALPCO, USA). The data were statistically analysed by SPSS, and significance level was accepted at P < 0.05.
Results
Both fasting total and active GLP-1 concentrations were significantly lower in T1DM patients (total 0.4 pmol/L, 0–6.4 and active 0.2 pmol/L, 0–1.9) compared with healthy controls (total 3.23 pmol/L, 0.2–5.5 and active 0.8 pmol/L, 0.2–3.6), P = 0.008 for total GLP-1 and P = 0.001 for active GLP-1. After adjustment for age, sex and body mass index, binary logistic regression showed that both fasting total and active GLP-1 remained significantly independently lower in T1DM patients (total GLP-1: OR 2.43, 95% CI 1.203–4.909 and active GLP-1: OR 8.73, 95% CI 1.472–51.787).
Conclusions
T1DM patients had independently lower total and active GLP-1 fasting concentrations in comparison with healthy people, which supports the potential therapeutic role of incretin therapy, along with insulin therapy, in T1DM patients.
Keywords
Introduction
The new therapeutic approach in type 1 diabetes mellitus (T1DM) grounds on the fact that glucose homeostasis is dependent on combined effects of different hormones in addition to insulin, which together contribute to better glucose regulation and less side effects. The role of glucagon-like peptide-1 (GLP-1) has become a focus of the scientific interest in the field of pathophysiology of T1DM, but the results of the published studies were disparate. Few smaller studies showed promising therapeutic effect of GLP-1 analogues in T1DM patients so far,1–5 while some studies did not find beneficial effect of GLP-1 analogues in T1DM. 6
The results of published studies showed lower or similar fasting GLP-1 concentration in T1DM patients in comparison with non-diabetic population.7,8 Impaired postprandial rise in GLP-1 was described in T1DM patients, 9 explained by insulin resistance, chronic hyperglycemia and insulin deficiency. 7 However, other studies indicated equal postprandial GLP-1 concentration in T1DM patients as in healthy subjects.8,10 The results from Greenbaum et al. 11 indicated equal basal and postprandial GLP-1 concentration in T1DM and in healthy people, but improved incretin effect, due to β-cell destruction, which was also described in type 2 diabetes mellitus.12 On the other hand, Kielgast et al. 13 described equal incretin effect in T1DM and in healthy controls and equal fasting GLP-1 concentrations.
Since controversies still exist over GLP-1 concentration in T1DM in relation to healthy subjects, the aim of this study was to measure fasting and postprandial GLP-1 concentrations in T1DM patients and in healthy controls and to examine the difference in those concentrations between the two groups of subjects. The secondary aim of the study was to investigate whether there was a gender difference in GLP-1 concentration.
Materials and methods
Study population
The cross-sectional study included 30 C-peptide negative T1DM patients and 10 healthy volunteer controls. The sample size was in accordance with the G-power 3.1.3. calculation for a difference between the two groups (t-test; total sample size 12, α = 0.05, 1−β=0.88, effect size d = 2.31, allocation ratio N2/N1 0.3). The patients were selected from the annual patient review at Vuk Vrhovac University Clinic for Diabetes, Endocrinology and Metabolic Diseases, Zagreb, Croatia. The diagnosis of T1DM was defined according to the following criteria: less than 40 years of age at the time of the disease development, episode of diabetic ketoacidosis, positive autoimmune markers and continuous need for insulin therapy within one year of the diagnosis. 14 Inclusion criteria for the T1DM patients were 18–65 years of age, at least one-year duration of T1DM, without history of cardiovascular, severe liver or chronic kidney disease, with glomerular filtration rate >45 mlmin−11.73−1m2 and without adrenal insufficiency. The patients received intensive insulin therapy (long-acting insulin in one or two dosage and ultrashort-acting insulin three times daily) and took no other medication that could affect glucose metabolism. Ten age-, gender- and body mass index (BMI)-matched people were included as the healthy control group (without diabetes mellitus, without history of cardiovascular, severe liver or chronic kidney disease, with glomerular filtration rate >45 ml min−11.73−1m2 and without adrenal insufficiency). The Hospital and Medical Faculty Ethical Committee approved the study protocol. Written informed consent was obtained from each examinee, and the study was performed in accordance with the Declaration of Helsinki.
Detailed medical history, including age at diabetes diagnosis, type of insulin therapy and other medications were obtained. Physical examination included measuring the body weight, height and waist to hip ratio and calculation of BMI. All investigations were performed in the morning, following an overnight fast. All patients received long-acting insulin the night before and ultrashort-acting insulin before the breakfast. Fasting venous blood samples were drawn at 8:00 h and postprandial 30 min after the standard diabetic breakfast in T1DM and in healthy subjects. The caloric amount of the meal depended on the patient’s weight and consisted of 70% carbohydrates, 25% proteins and 5% fat. All healthy control subjects had also standardized breakfast. Venous blood samples (plasma and serum) were collected for biochemistry panel measurement, glycated hemoglobin (HbA1c), fasting and postprandial total GLP-1 (GLP-1 0′ and GLP-1 30′) and active GLP-1 (GLP-1 0′ and GLP-1 30′) concentration. Plasma samples for GLP-1 were collected in BD™ P700 Blood Collection System for Plasma GLP-1 Preservation (BD Customer Service, USA). All samples were aliquot and stored frozen at −70℃ from the collection time until analysis.
Laboratory assays
Biochemistry panel, C-peptide, HbA1c, pancreatic islet cell antibodies and serum creatinine concentration were assayed using routine laboratory methods: serum creatinine (spectrophotometry, OLYMPUS AU400), C-peptide (chemiluminescence, ADVIA Centaur XP), HbA1c in whole blood (immunoturbidimetry-TINIA, COBAS INTEGRA), glutamic acid decarboxylase (GAD), tyrosine phosphatase-related islet antigen 2 (IA-2), enzyme-linked immunosorbent assay (ELISA; photometer STATFAX 2100), islet cell antibodies (ICA; indirect immunofluorescence on microscope). Plasma total GLP-1 and active GLP-1 concentrations were measured using ELISA (sandwich) commercial kit, Human Total GLP-1 (7-36 and 9-36) ELISA Kit, ALPCO, USA; Human Active GLP-1 (7-36) ELISA Kit, ALPCO, USA; photometer STATFAX 2100. Postprandial change in hormone concentration was calculated as difference between postprandial and fasting hormone concentration, expressed as delta (Δ). The kit insert for total GLP-1 quotes intra-assay CV variation at 3.7% at 3.02 pmol/L and 4.7% at 10.2 pmol/L; and inter-assay variation of 6.2% at 4.16 pmol/L and 9.5% at 12.58 pmol/L. The kit insert for active GLP-1 quotes intra-assay CV variation at 5.4% at 3.49 pmol/L and 2.5% at 10.18 pmol/L; and inter-assay variation of active GLP-1 was 3.9% at 4.13 pmol/L and 5.6% at 12.14 pmol/L.
Statistical analysis
Statistical analysis was done using Statistical Package for the Social Sciences (SPSS) version 17.0 for Windows. Because of small sample size, variables were described as median and minimum–maximum range and nonparametric statistical tests were used. Nominal variables were presented as frequencies. The difference between two independent numerical variables was tested using Mann–Whitney test. Binary logistic regression analysis was used (Hosmer–Leveshow goodness-of-fit test), using OR with 95% CI. Significance level was accepted at P < 0.05.
Results
Subject demographics
Study included 30 C-peptide negative T1DM patients and 10 healthy controls. There were 17 male and 13 female patients, ranging in age from 20 to 59 years (median 37), with median diabetes duration of 22 years (3–45), BMI of 24 kgm−2 (20–30), HbA1c concentration of 7.2% (5.1–12.4), fasting glucose concentration of 6.9 mmol/L (2.5–13.1), postprandial glucose concentration of 10.2 mmol/L (2.7–16.3), median total insulin requirement of 0.6 IUkg−1 day−1 (0.32–0.94) and median creatinine of 66 µmol/L (43–88). Regarding the number of positive pancreatic islet cell antibodies, four did not have positive antibodies, six had one positive antibody, 14 had two positive antibodies and six patients had three positive antibodies. Healthy controls included four males and six females, with median age of 30 years (27–47), BMI of 25 kgm−2, median HbA1c concentration of 5.2% (4.3–5.8) and median creatinine of 70 µmol/L (43–114). There was no difference in age (z = −0.907, P = 0.365), gender (χ2 = 0.533, P = 0.716) and BMI (z = −0.395, P = 0.693) between the T1DM patients and healthy controls.
Hormone concentrations
Differences in GLP-1 concentration between T1DM patients and healthy controls (Mann–Whitney test; median, minimum–maximum).
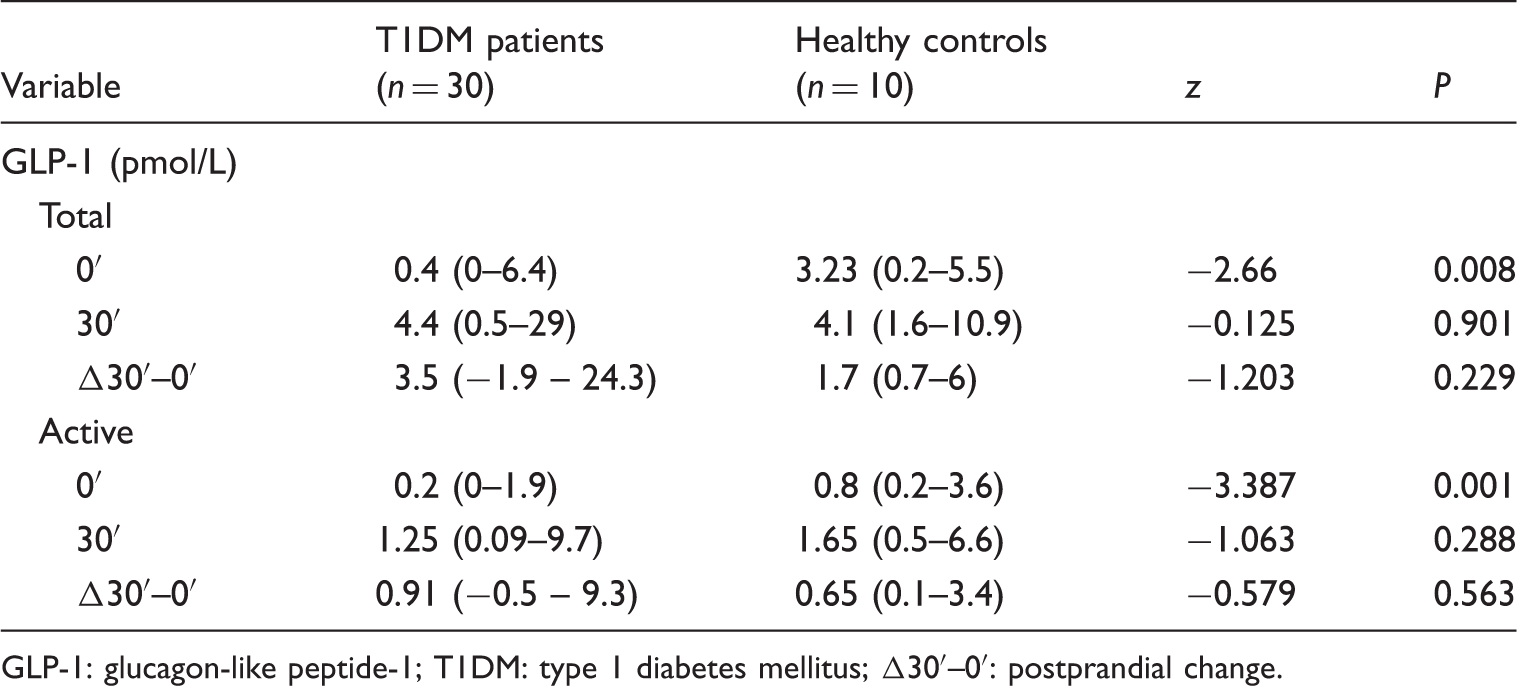
GLP-1: glucagon-like peptide-1; T1DM: type 1 diabetes mellitus; Δ30′–0′: postprandial change.
Binary logistic regression of fasting total and active GLP-1 in relation to healthy controls (N = 40).
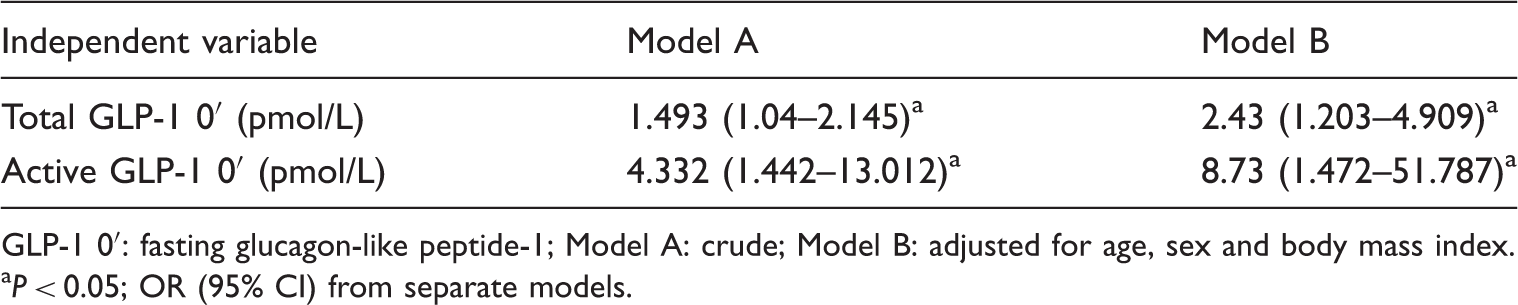
GLP-1 0′: fasting glucagon-like peptide-1; Model A: crude; Model B: adjusted for age, sex and body mass index.
aP < 0.05; OR (95% CI) from separate models.
There was no difference in GLP-1 concentrations between the groups of patients with T1DM according to the calorie intake and also to the total number of positive pancreatic islet cell antibodies. There was no correlation between GLP-1 with insulin requirement in T1DM patients (data not shown).
Figure 1 shows total GLP-1 concentrations, at 0′, 30′ and ΔGLP-1, in T1DM patients in relation to gender. Men had significantly higher total GLP-1 at 0′ (P = 0.02), total GLP-1 at 30′ (P < 0.001) and total ΔGLP-1 (P = 0.012) concentrations in comparison with women. There was no difference in age, disease duration, HbA1c, insulin requirement, BMI and creatinine concentration between the genders. Men had significantly higher waist to hip ratio in comparison with women (z = −2.952, P = 0.03). Total GLP-1 30′ concentration remained independently higher in men by binary logistic regression after adjustment for waist to hip ratio, disease duration, age and insulin requirement (OR 3.267, 95% CI 1.032–10.343) (data not shown). There was no gender difference in active GLP-1 concentrations in T1DM patients. In healthy controls, we did not find difference in GLP-1 concentrations in relation to gender (data not shown).
Differences in total GLP-1 concentrations between the gender in type 1 diabetes mellitus patients. GLP-1: glucagon-like peptide 1.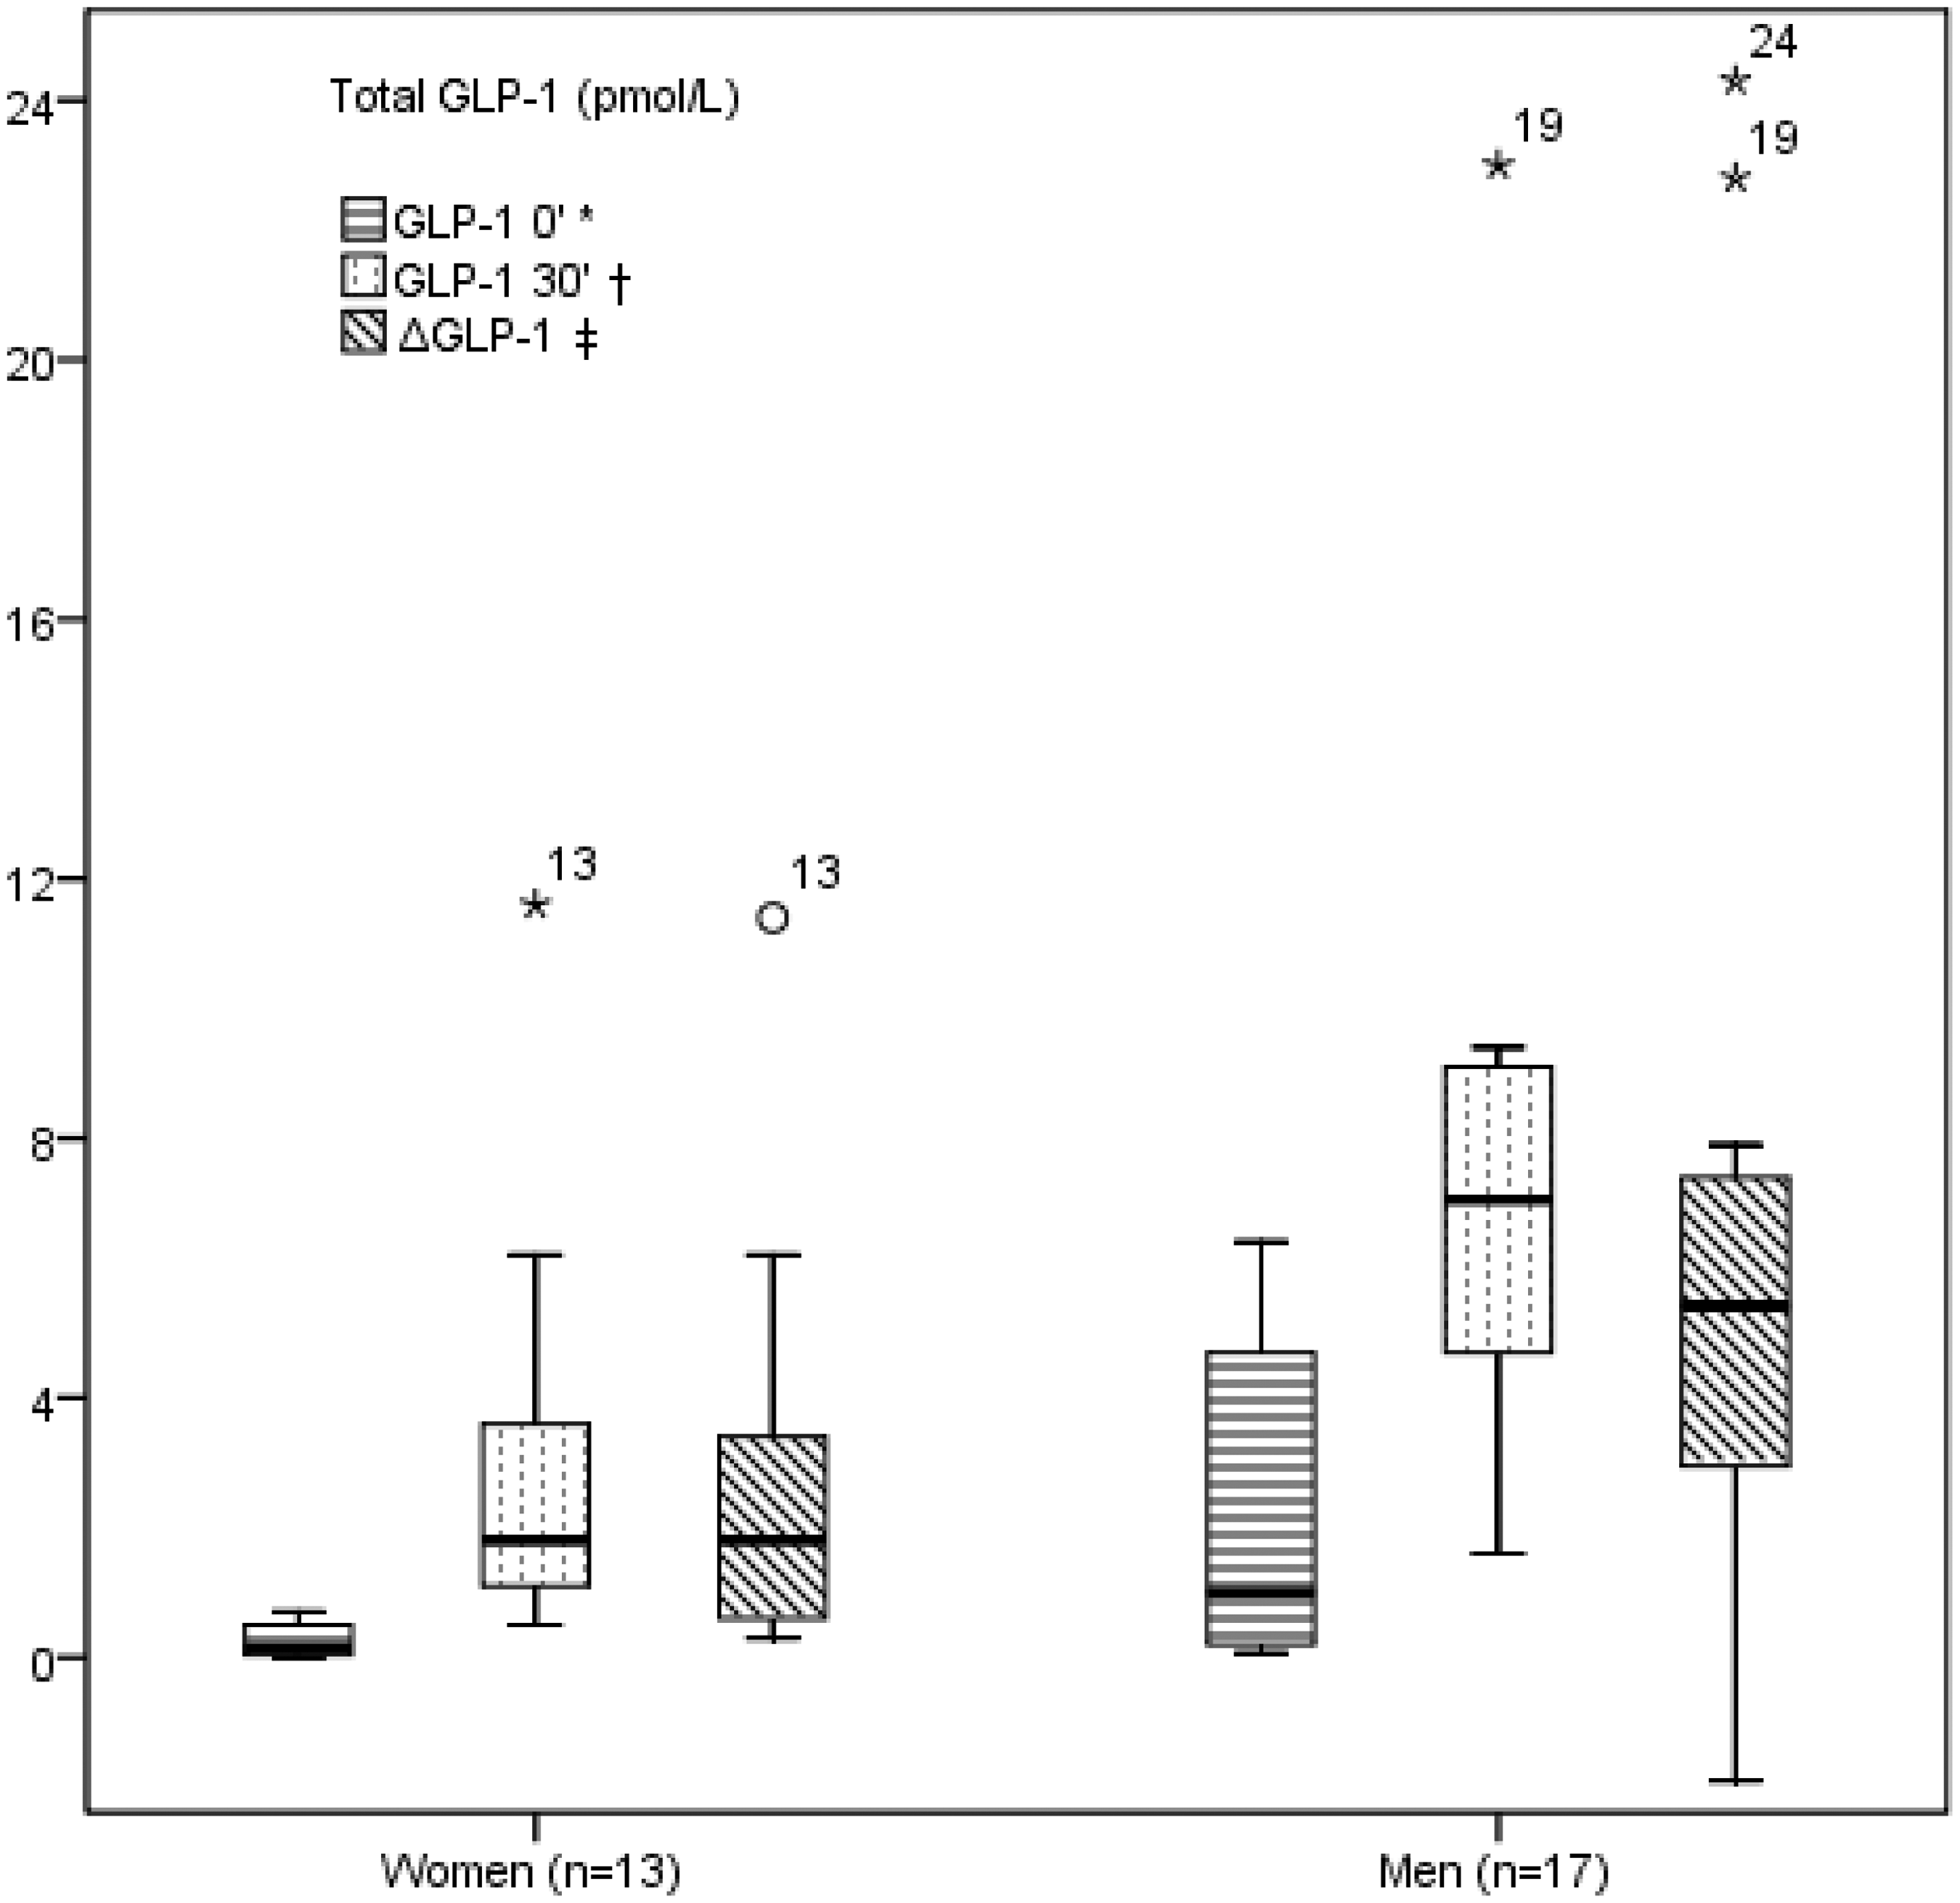
Discussion
T1DM patients had independently lower fasting both total and active GLP-1, but not the postprandial concentrations, in comparison with healthy subjects. The results are partially in accordance with the results of Vilsboll et al. They also found lower fasting GLP-1 concentration in T1DM patients (N = 8) in comparison with healthy controls (N = 8) and no postprandial difference. We agree that hypothetically exogenous insulin therapy might have inhibitory effect on GLP-1. 8 The hypothesis is additionally supported by the results of Lugari et al., 7 who described equal fasting active GLP-1 concentration, without postprandial rise, between T1DM and healthy controls. They examined 16 T1DM patients, who received long-acting insulin the night before, but did not receive insulin before the breakfast. Thus, bolus insulin therapy in study of Vilsboll and in our study might explain the lower fasting GLP-1 concentration in T1DM patients, by the already proposed mechanism. Greenbaum et al. showed equal fasting and postprandial GLP-1 concentrations between the T1DM patients (N = 17) and healthy controls, but their patients had better glucoregulation, were younger and had lower BMI, while there were no data about insulin therapy. 11 Higher calorie intake was followed by higher postprandial GLP-1 concentration in their study, explained by food-induced GLP-1 production. Our study did not confirm the relation, while no difference was found in postprandial GLP-1 concentration in relation to different calorie intake between different subjects, but we did not study different calorie intake among the same subjects; and our patients had smaller percentage of fats (5 %) compared with their subjects (33 %). Maybe the difference in fat content is responsible for that. Food stimulation of GLP-1 thus remains possible.
In both groups (T1DM and healthy controls) of our study, we found lower fasting and postprandial GLP-1 concentrations in comparison with previous results from other studies. So far, the above-mentioned differences in GLP-1 concentrations among T1DM patients and between T1DM patients and healthy controls are explained by different methods of hormone measurement, different patients’ characteristics and difference in insulin therapy. 15
We also found the difference in total GLP-1 concentrations between the genders in T1DM patients. Men had significantly higher total GLP-1 at 0′, at 30′ and higher postprandial change (ΔGLP-1) concentrations in comparison with women. After adjustment for age, disease duration, waist to hip ratio and insulin therapy, postprandial total GLP-1 concentration remained independently higher in men in comparison with women with T1DM. There is no study in T1DM that described GLP-1 concentration in relation to gender. One study in non-diabetic healthy population reported higher GLP-1 concentration in women, explaining by higher body fat percentage in women. 16 We could presume that T1DM men had higher GLP-1 due to higher waist to hip ratio in our study; however, multivariate statistics disproved it. In contrast to T1DM, we did not find gender difference in GLP-1 concentration in healthy controls, but the sample was small for a definitive conclusion.
Study strengths and limitations
We included T1DM patients without residual β-cell function (C-peptide negative); therefore, our sample is more homogenous and we could eliminate endogenous insulin impact on GLP-1 concentrations. In all subjects, we measured total and active GLP-1 concentrations. Total GLP-1 concentration should be a better indicator of overall GLP-1 secretion, while active GLP-1 possesses almost all biological effects in body. All subjects were adults, of same race, without significant difference in gender abundance, and all subjects were controlled in one centre with standardized therapeutic approach. It was a cross-sectional study, which restricted the ability to establish causality. We did not measure hormones in duplicates and there were single blood collections.
Conclusion
T1DM patients had independently lower the total and active GLP-1 fasting concentrations in comparison with healthy people and that supports potential therapeutic role of incretin therapy, along with insulin therapy, in T1DM patients. For the first time to our knowledge, we found the difference in total GLP-1 concentrations between the genders in T1DM patients. Men with T1DM had independently higher total GLP-1 postprandial concentration in comparison with women, while no gender difference existed in healthy controls. Further larger studies are needed to confirm the results and clarify roles of GLP-1 in the pathophysiology of T1DM and possible therapeutic effect of GLP-1 analogues.
Footnotes
Acknowledgements
The authors would like to acknowledge the laboratory staff at Merkur University Hospital, Vuk Vrhovac University Clinic for Diabetes, Endocrinology and Metabolic Diseases, Zagreb, Croatia.
Declaration of conflicting interests
None declared.
Funding
This work was supported by Ministry of Science, Education and Sports of the Republic of Croatia (grant 045-1080230-0516).
Ethical approval
Ethical approval was obtained from the Hospital and Medical Faculty Ethical Committee in Zagreb (REF number: 643-03-01-12).
Guarantor
KZ.
Contributorship
All the authors declare that they participated in the acquisition of data, analysis and interpretation of the data, and drafting of the manuscript, and that they have seen and approved the final version.