
Abstract
Background
Previously, high-performance liquid chromatography (HPLC) equipped with ultraviolet or fluorescence detectors has been used for separation of human mercaptalbumin (HMA) and human non-mercaptalbumin (HNA). However, it is difficult to perform reliable chromatographic analysis due to peak interference of such serum compounds as uric acid and bilirubin. The aim of this study is to explore a selective and simple analytical method for the determination of HMA and HNA.
Method
HMA and HNA in serum sample were separated by HPLC and reacted with bromocresol green using a postcolumn reaction scheme.
Results
A complete separation of HMA and HNA is achieved in less than 30 min by using weak anion exchange columns and isocratic elution. Within-run and between-day precisions at albumin concentration of 45 g/L were 4.2 and 1.7% for HMA and 4.5 and 4.6% for HNA, respectively. There was no interference in HMA and HNA peaks when bilirubin-, haemoglobin- or chyle-spiked pooled serum samples were analysed.
Conclusion
Our method is reliable and not labour-intensive and, therefore, might be applicable for clinical and epidemiological studies.
Introduction
Human serum albumin (HSA) is characterized by diverse biological functions such as the maintenance of osmotic pressure needed for proper distribution of body fluids and transport of drugs, hormones or fatty acids. HSA takes two different interchangeable forms according to its redox state: one is human mercaptalbumin (HMA), which has one reduced sulphhydryl (SH) group at cysteine 34 of each albumin molecule, and the other is human non-mercaptalbumin (HNA), which has an oxidized SH group. 1 Accurate and precise HSA measurement is clinically important, when it is used to evaluate nutritional status or the severity of certain diseases such as hepatic and pancreatic disorders.2,3 For routine laboratory determination of HSA, dye-binding techniques with bromcresol green (BCG) have been commonly used in Japan. 4 In contrast, the bromcresol purple (BCP) method has been less commonly used than the BCG method despite its higher specificity, because the rate of BCP–HSA binding reactivity differs between HMA and HNA.5,6 Muramoto et al. 5 established a new method, the so-called modified BCP method, which can reduce the reaction differences between human HMA and HNA using 5,5′-dithiobis-2-nitrobenzoic acid with or without sodium dodecyl sulphate. The BCP method recently devised by Muramoto et al. 5 can react to HSA with higher specificity than the BCG method and is considered a promising candidate to replace the conventional BCG method. For this reason, the modified BCP method for the routine laboratory determination of HSA has prevailed in Japanese facilities.
Ono et al. 7 observed that in a patient to whom penicillin G was administered, the modified BCP method yielded HSA values about 50% lower than anticipated by electrophoresis, while the values measured by the BCG method well corresponded to the electrophoretic evaluation. It remains unclear how HSA values determined by the modified BCP method are affected. Moreover, the clinical relevance of HMA and HNA has not yet been well explored. 8 To respond to these questions, development of a simple and precise determination method which can separate and quantitate HMA and HNA is essential. In this regard, application of high-performance liquid chromatography (HPLC) is explored to enable effective separation of HSA into HMA and HNA.
Measurement of HMA and HNA using HPLC with a ultraviolet (UV) detector has been discussed in previous reports.9,10 The drawback of this method is that serum uric acid unavoidably interferes with the HMA and HNA chromatograph (Figure 1(a)). Moreover, a drug circulating in serum might affect the chromatograph because a large number of drugs have been known to demonstrate absorbance spectra in the UV range. Recently, we have revised an HPLC postcolumn BCG technique for the determination of HMA and HNA in human serum samples. Its specificity and reliability will be examined in this report.
A typical chromatogram of HMA and HNA in the pooled serum sample analysed with the UV method (a) and the HPLC postcolumn BCG method (b).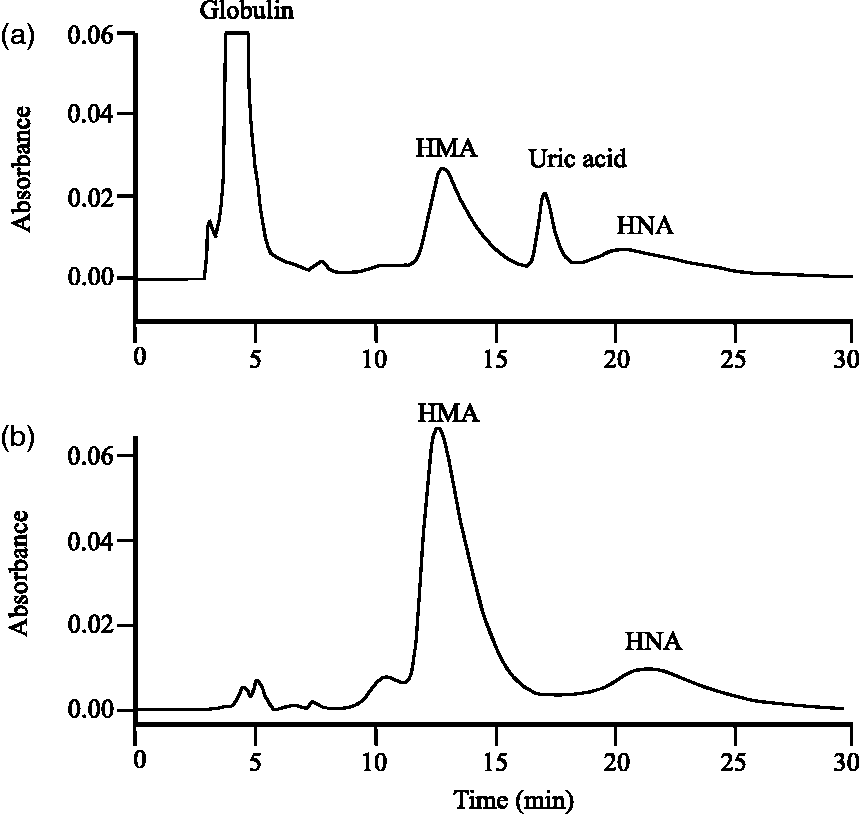
Materials and methods
Chemicals
N-methylpiperazine and Na2SO4 were purchased from Sigma-Aldrich (St. Louis, MO). BCG and HPLC-grade ethanol were from Tokyo Kasei Kogyo (Tokyo, Japan) and Wako Pure Chemicals (Osaka, Japan), respectively. Water used throughout the experiments was distilled and deionized to 18 MΩ with a Millipore Milli-Q System (Millipore Co., Bedford, MA). All other reagents were of analytical grade purity.
Apparatus and HPLC conditions
The HPLC instrument used in this study was the Hitachi LaChrom Elite system (Tokyo, Japan) equipped with an isocratic pump (L-2130), an auto injector (L-2200) and a column oven (L-2300). Detection of the HSA was performed by the Photodiode Array Detection system (Model L-2455). A weak anion exchange column (Asahipak ES-502 N 7 C packed with porous polymers, 7.5 mm ID × 100 mm) equipped with a precolumn (Agilent, Tokyo, Japan) was used to separate HSA.
The optimum HPLC conditions were shown as follows: the mobile phase, which was composed of 50 mM N- methylpiperazine-HCl buffer (pH 4.8), 40 mM Na2SO4 and 3% ethanol, was degassed prior to use. The flow rate was set at 1.0 mL/min. The temperature of the precolumn and separation column was held at 32.0℃. The eluate was mixed with BCG reagent which was composed of 150 mM citric acid, 3% Briji-35 and 0.3 mM BCG (pH 4.0). The flow rate of BCG was set at 1.0 mL/min. The mixture passed through the reaction coil (i.d., 0.5 mm; length, 2 m) at a reaction temperature of 32℃. The BCG reacted with HSA was detected at the wavelength of 620 nm. The sample volume injected into the HPLC was 5 µL.
Sample preparations
Serum samples from three healthy volunteers (clinical laboratory workers of the Nagoya University Hospital, 25–34 years of age) were collected and pooled. The pooled serum sample was used for the fundamental studies such as the decision of optimum ethanol concentrations in the HPLC mobile phase and validation assay. Immediately before the HPLC analysis, the serum samples were thawed and filtered through the Mini-UniPrep syringeless filter (Agilent, Tokyo, Japan) equipped with 0.45 µm regenerated cellulose, which is a very low, non-specific, protein-binding membrane.
Modified BCP method for HSA assay
HSA assay by the modified BCP method was performed using a commercial assay kit, Aqua-auto Kainos ALB Test Kit, purchased from Kainos laboratories, Inc (Tokyo, Japan). This test kit has been calibrated using a calibration material, ERM-DA470 obtained from Institute for Reference Materials and Measurements. The testing procedure is as follows: five minutes after loading 5.2 µL serum sample and 80 µL Reagent-1, 90 µL Reagent-2 was added. After the incubation reaction (37℃ for 5 min), colourimetric determination was performed at wavelength 600 and 660 nm (end-point method). This method was based on the previously reported method 5 and operated by an autoanalyser JCA-BM 6050 (Japan Electron Optics Laboratory Co., Ltd, Tokyo, Japan).
Study for optimum conditions
To optimize the conditions for the determination of HMA and HNA, we varied the ethanol concentrations of the mobile phase (2, 3 and 5%) and the serum volumes injected into the HPLC (2, 5 and 10 µL).
Assay validation
Under the optimized condition, dilution reproducibility and within-run and between-day precisions were examined through the assaying of the pooled serum sample. Pooled serum sample was diluted with saline at concentrations of 4.5, 9, 18, 27, 35 and 45 g/L for dilution reproducibility and at concentrations of 25 and 45 g/L for within-run (n = 10) and between-day precisions (n = 10). All assays were duplicated.
Interference of bilirubin, haemoglobin and chyle and application of the method serum samples from patients
The influence of bilirubin, haemoglobin and chyle on the assay of HSA was tested using a commercial check kit Interference Check A Plus (Sysmex Corporation, Japan). Each possible interference substance was added to the pooled serum so that the concentrations of bilirubin, haemoglobin and chyle range between 0 and 200 mg/L, 0 and 5 g/L and 0 and 1400 Nephelometric Turbidity Unit (NTU), respectively. Then, these spiked serum samples were measured by our method.
The serum samples in this experiment were collected from 48 patients who underwent biochemical examinations at the Nagoya University Hospital. The samples were meticulously selected so that the samples that contain high concentrations of bilirubin, and triglycerides were collected to evaluate the effects of these unusual conditions on HMA and HNA chromatographs. HSA concentrations in these samples were measured using both the modified BCP method and our method.
The Ethics Committee of the Nagoya University Graduate School of Medicine, Nagoya, Japan, approved the study protocol.
Results and discussion
Chromatogram of HMA and HNA
Because of the lack of standard substances available for the HMA and HNA assay, the HMA and HNA concentrations in the serum sample remained undetermined. Thus, we decided to focus not on the absolute quantification but on the abundance ratio of HMA and HNA. As shown in Figure 1(b), analysis of pooled serum samples by our method indicated two obvious peaks at the retention time of around 13 and 20 min. When several commercial HSA standards were analysed by our method, each peak was shown at almost the same retention time. These retention times of HMA and HNA virtually agreed with those previously reported by the UV method 1 (Figure 1(a)). It has been reported that HMA readily oxidized to HNA within several hours at room temperature. 1 In our preliminary experiment, we confirmed that the 13-min peak area decreased after a 24-h incubation at room temperature, while the 20-min peak area (retention time of 20 min) increased in contrast (data not shown). These observations corroborate that our method accurately identified the chromatogram peaks of HMA and HNA at the retention time of 13 min and 20 min, respectively.
Optimization of the HPLC mobile phase
The composition of the mobile phase was optimized to achieve a sharp separation of HMA, HNA and other unknown peaks. First of all, the optimum conditions were sought at a fixed pH of 4.8. Other conditions were also predetermined: buffer type (N-methylpiperazine-HCl buffer), salt type (sodium sulphate), organic solvent (ethanol) and column oven temperature (32℃). These conditions were approximately the same as in the previously reported method.
1
We confirmed that varied ethanol concentrations could notably affect the retention time of both the HMA and HNA peaks (Figure 2). As shown in Figure 2, HMA and HNA peaks were separated in any ethanol concentrations. However, in the 5% ethanol experiment (Figure 2(c)), the HMA peak became less distinguishable from unknown substances. Moreover, it took longer to separate the HMA and HNA peaks with 2% ethanol (Figure 2(a)). In consideration of more balance between the peak separation and analysis time, the ethanol concentration of 3% (Figure 2(b)) was selected as optimum. On the contrary, the concentrations of sodium sulphate in mobile phase little affected the retention time and the shape of HMA and HNA peaks (data not shown). Therefore, we decided that the concentration of sodium sulphate was reduced to 40 mM from 400 mM, a concentration which was used for the mobile phase in the previously reported method.
1
This diminished sodium sulphate concentration may prevent salt from depositing in the HPLC system including separation columns. Given that the ethanol concentration in the mobile phase affects the HMA and HNA retention times, the separation mechanism of HMA and HNA by ES-502 N 7 C column might be not only anion exchange chromatography but reversed phase and/or molecular exclusion chromatography. The principle for the separation remains to be elucidated at present.
Effect of ethanol concentration in the HPLC mobile phase on HMA and HNA elution and peak separation.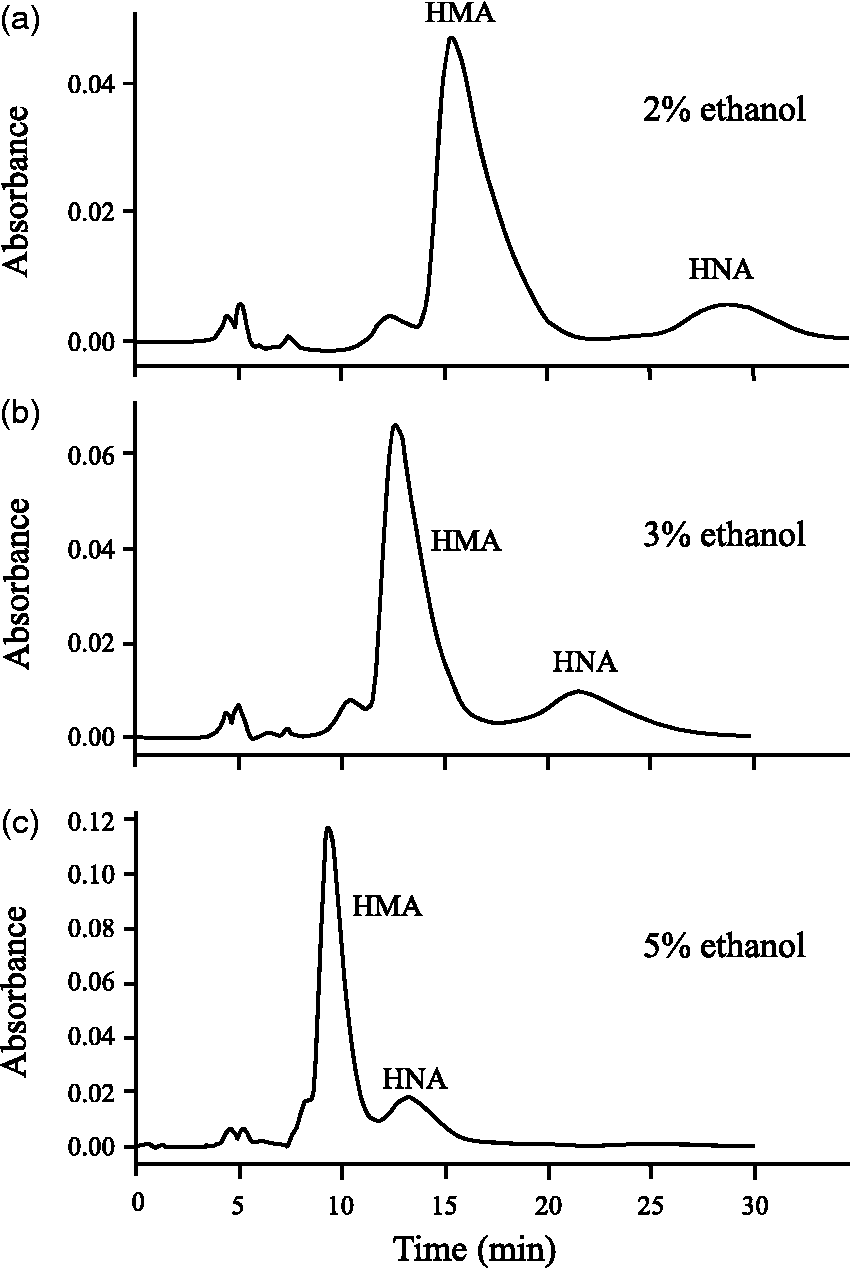
Effect of sample injection volume on peak shapes
It is important to find an optimum sample injection volume into the HPLC system for sensitive and selective analysis. A small injection volume of 2 µL could ensure a sharp separation (Figure 3(a)) compared with a larger injection volume of 5 µL or 10 µL (Figure 3(b) and (c)). However, with the injection volume of 2 µL, the problem was that HMA was below the limit of the detection level in some patients with liver disease, while the HMA peaks reached above that limit in all patients with the injection volume of 5 µL. Then, 5 µL was selected as the optimum injection volume.
Effect of the sample volume injected into the HPLC on the peak shape of the chromatogram.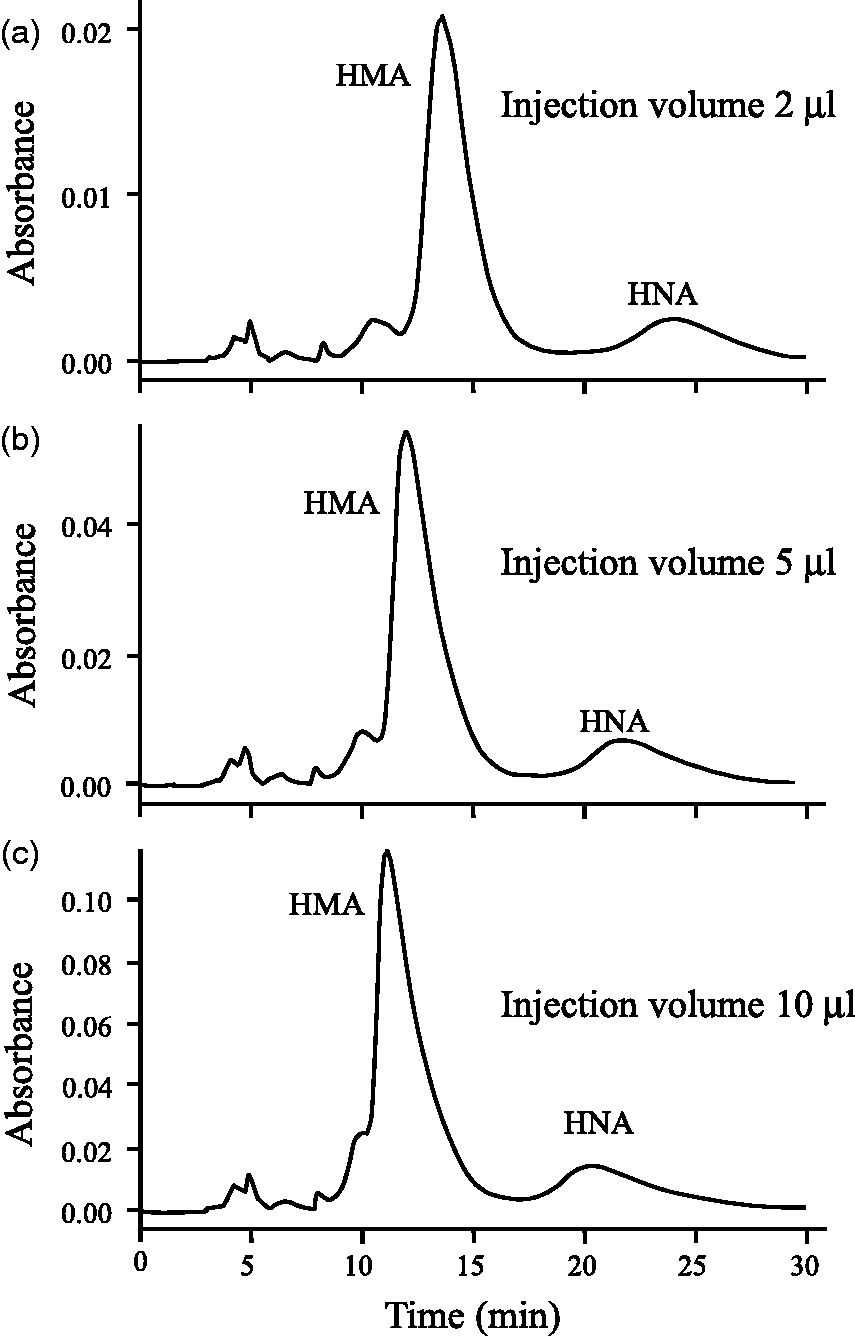
Assay validation
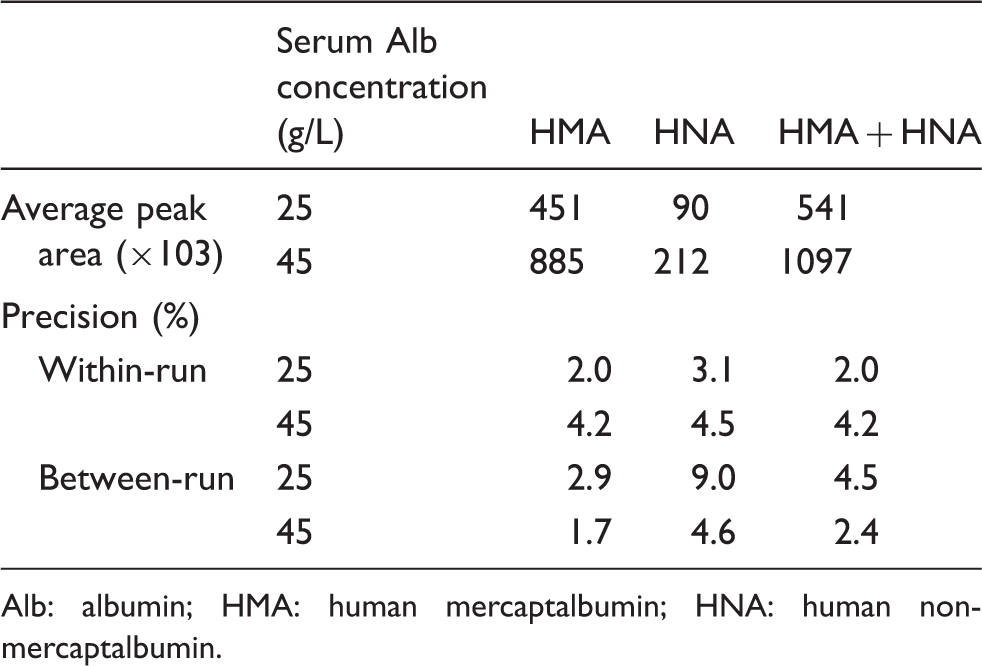
In the dilution reproducibility test, chromatograph peak areas were compared with the HSA concentrations obtained from the modified BCP method. As shown in Figure 4, the calibration curves for HSA (HMA + HNA), HMA and HNA were found to be linear. Within-run precisions were evaluated by the assaying of pooled serum samples at HSA concentrations of 45 and 20 g/L; the coefficient of variation (CV) ranged from 2.0 to 4.5% for HMA, HNA and HMA plus HNA. Moreover, between-day precisions were evaluated by duplicate assay during 10 consecutive days (n = 10); the %CV was less than 9.0% (Table 1). A high CV was found in the low-concentration HNA assay. This may be caused by relatively low-peak areas of HNA. In general, however, these validation results are considered acceptable for the HMA and HNA assay, although no data were available from previous studies, with which the current data can be compared.
Dilution reproducibility for HMA, HNA and HMA plus HNA. Peak area and precision data of analytical procedure. Alb: albumin; HMA: human mercaptalbumin; HNA: human non-mercaptalbumin.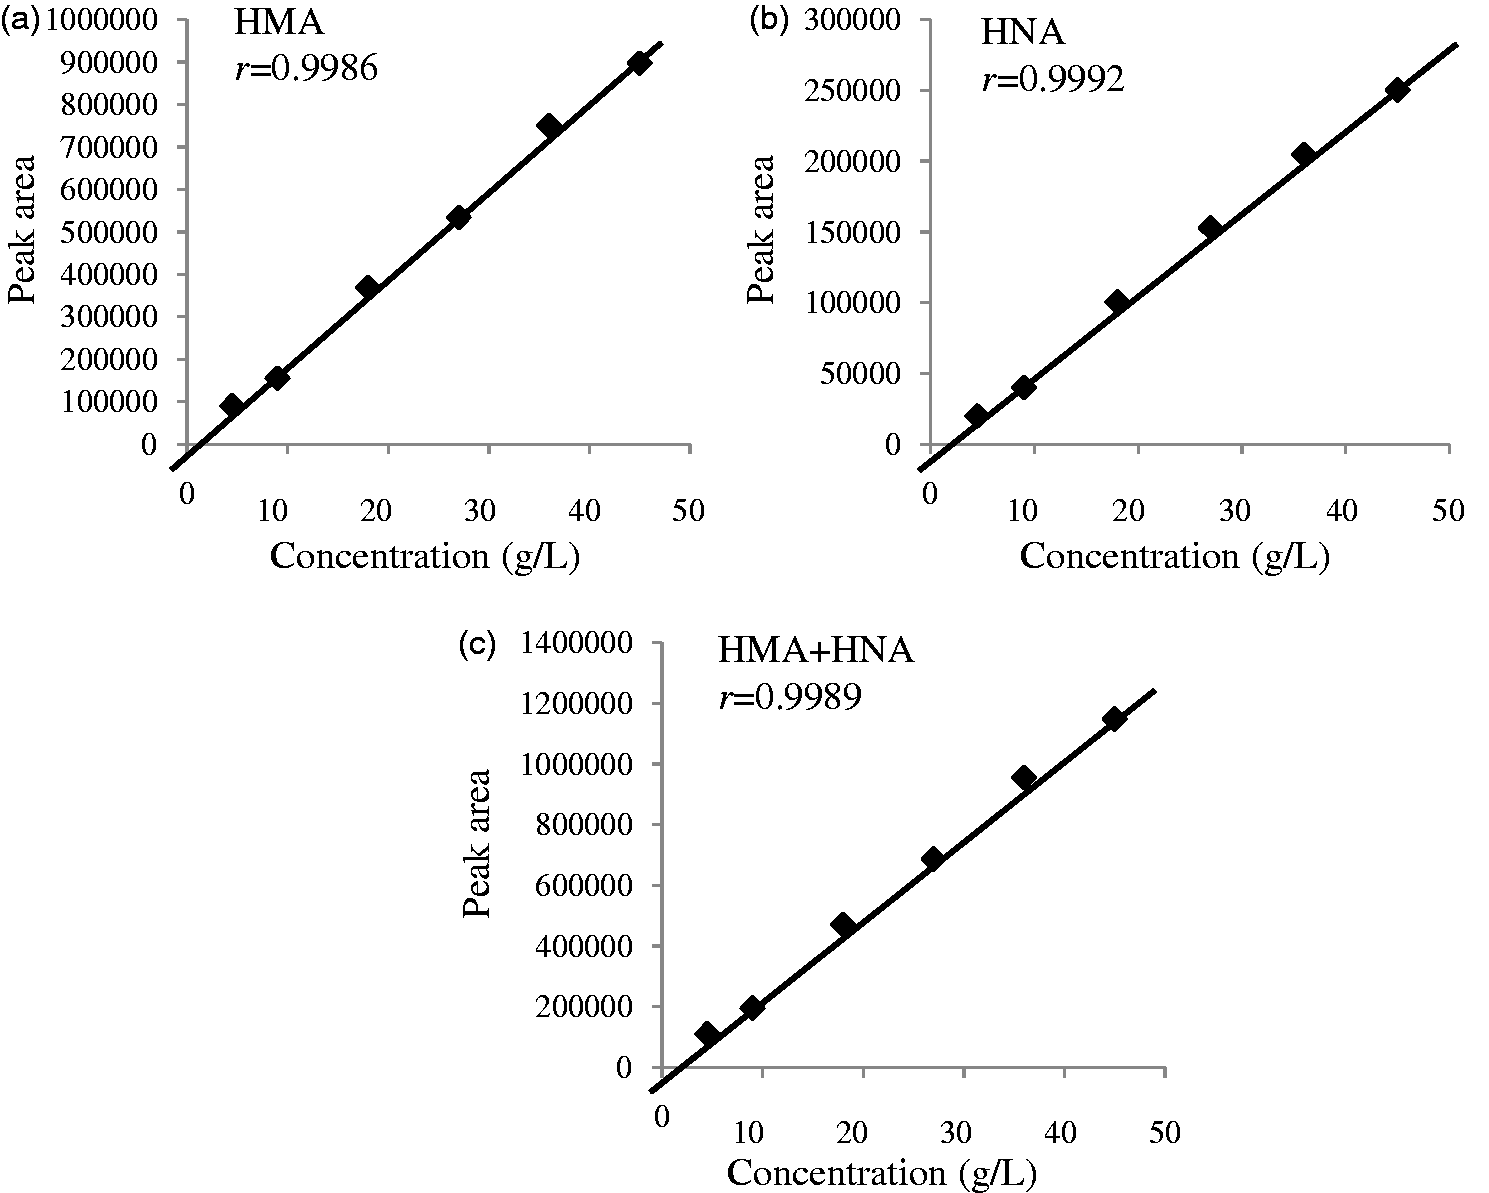
Interference of blood compounds and application to clinical serum samples
In the serum spiked with bilirubin, haemoglobin or chyle, no interference of those components with the HMA and HNA measurement was demonstrated (data not shown). Our method was applied to 48 clinical serum samples, and the results were compared with the HSA obtained from the modified BCP method. We found a highly close correlation of HSA measurements between our method and the modified BCP method, suggesting that our HPLC postcolumn BCG reaction method will serve well in determining the HMA and HNA ratio of HSA obtained from the modified BCP method (Figure 5). We have also calculated the slope and intercept for bilirubinaemia (n = 5, y = 13404x + 76389), chylaemia (n = 3, y = 16230x + 136739) and other pathological samples (n = 45, y = 20351x − 53153) separately. Although no interference due to the presence of either bilirubin or chyle was observed in our in vitro experiments, how hyper-bilirubinaemia or hyper-chylaemia in clinical samples interferes with the HSA measurements in our method remains to be investigated. Further studies are needed to examine the influence of other interference factors such as drug and other exogenous substances.
A scatter plot for the HSA concentrations obtained from the HPLC postcolumn BCG method and the modified BCP method using serum (n = 48) of bilirubinaemia ▴, chylaemia □ and other disorders ◯.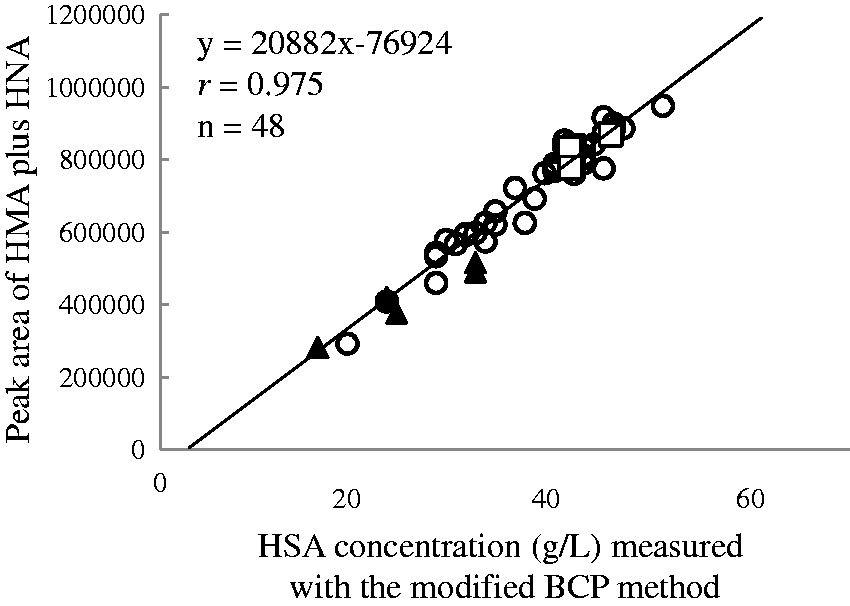
BCG has been reported to be less specific to HSA, as it also reacts with acute-phase proteins such as globulin.11–13 Some peaks of unknown origin in the chromatograms, which might be attributable to globulin reacted with BCG, appeared earlier than the HMA peak. This non-specific reaction caused HSA concentrations by the BCG method to be seemingly higher than by the BCP method. The advantage of our method for HSA assay is that these unknown peaks did not interfere in the HMA and HNA measurements. At least, the unknown peak areas were negligibly small in comparison with the HMA peak area. In our method, BCG-reacted globulins were successfully separated from HMA and HNA by HPLC, resulting in high correlations of HSA concentrations between our method and the BCP method.
Conclusions
We developed an HPLC postcolumn BCG method for HMA and HNA measurements with satisfactory peak separation and validity. For determination of HMA and HNA, our optimized method outperforms the HPLC-UV or -fluorescence detector methods, while serum preparation for the HPLC analysis was simple. In this respect, our method is expected to become widespread across the laboratories for HMA and HNA assay.
Footnotes
Acknowledgements
The authors would like to thank the contributors of this study.
Declarations of conflicting interests
None declared.
Funding
This work was supported in part by Grants-in-Aid for Scientific Research (23689034) from the Japan Society for the Promotion of Science and by JSPS KAKENHI (Grant Number 23689034).
Ethical approval
The ethics committee of the Nagoya University Graduate School of Medicine approved this study (No. 1038).
Guarantor
TM.
Contributorship
JU wrote the first draft of the manuscript. JU, YI and MM analysed HSA using HPLC. JU and TK took care of statistical analysis. HM conceived the study. HM and TM was involved in protocol development, gaining ethical approval. All authors reviewed and edited the manuscript and approved the final version of the manuscript.