
Abstract
Background
Prospective risk analysis (PRA) is an essential element in quality assurance for clinical laboratories. Practical approaches to conducting PRA in laboratories, however, are scarce.
Methods
On the basis of the classical Failure Mode and Effect Analysis method, an approach to PRA was developed for application to key laboratory processes. First, the separate, major steps of the process under investigation are identified. Scores are then given for the Probability (P) and Consequence (C) of predefined types of failures and the chances of Detecting (D) these failures. Based on the P and C scores (on a 10-point scale), an overall Risk score (R) is calculated. The scores for each process were recorded in a matrix table. Based on predetermined criteria for R and D, it was determined whether a more detailed analysis was required for potential failures and, ultimately, where risk-reducing measures were necessary, if any.
Results
As an illustration, this paper presents the results of the application of PRA to our pre-analytical and analytical activities. The highest R scores were obtained in the stat processes, the most common failure type in the collective process steps was ‘delayed processing or analysis’, the failure type with the highest mean R score was ‘inappropriate analysis’ and the failure type most frequently rated as suboptimal was ‘identification error’.
Conclusions
The PRA designed is a useful semi-objective tool to identify process steps with potential failures rated as risky. Its systematic design and convenient output in matrix tables makes it easy to perform, practical and transparent.
Introduction
Product quality for clinical laboratories means on-time delivery of the correct analysis results and products, for the right patient, to the right doctor. This requires sound validation, employee training and quality assurance with respect to the analytical activities. It also requires that attention be paid to the processes involved in both the pre-analytical and analytical phases, for example by means of risk analysis.1–6 As a tool to identify and prevent errors in processes, risk analysis is more suitable as a form of quality management than the well-known and widely used LEAN approach, which primarily revolves around logistic-economic factors in processes. The well-known Six Sigma approach, on the other hand, is primarily intended to count and control known non-conformities, not so much to newly identify them. Retrospective risk analysis is well known in clinical laboratories, and is used to identify the causes of failures. In contrast, prospective risk analysis (PRA)4–6 is driven not by incidents that have actually occurred, but by the examination of laboratory processes and their individual steps from an independent, more distant perspective to identify potential incidents in advance.
Ideally, all main processes within a clinical laboratory should be subjected to PRA. Depending on the type of laboratory, these include the pre-analytical process, the analytical process (on site or elsewhere, for tests that the laboratory does not carry out itself), the process for obtaining urgent (‘stat’) test results, the provision of blood products for transfusion or the processing and issuing of gametes for fertility treatment. To date, the insight into and application of PRA in clinical laboratories is still rather limited, despite the fact that PRA is mentioned in various guidelines regulating the organisation of clinical laboratories.6–11 For instance, clauses 4.11 and 4.14 of ISO directive 15189 stipulate that clinical laboratories should conduct risk assessments to examine potential failures in their processes, 9 alluding to the investigation of activities and processes in a preventive manner by way of PRA. Sound and convenient methods for executing PRAs are therefore desirable. The few methods described for executing PRAs in clinical laboratories, however, are either somewhat vague or rather complex and laborious.4–6,12,13 This article describes a practical and transparent approach to PRA that is suitable for laboratory processes, and presents the results of four of our PRAs to serve as illustration.
Methods
Study site
The PRAs described were performed in the Clinical Chemical and Haematological Laboratory at Rijnstate Hospital, Arnhem, the Netherlands, a 900-bed general care and teaching hospital. The laboratory department provides blood sampling services and laboratory testing around the clock for approximately 300 analytes for inpatients and outpatients, patients in primary care and a number of affiliated institutes.
Design of the risk analysis approach
Our PRA is an elaboration of the established Failure Mode and Effect Analysis (FMEA).6,14,15 In FMEA, a process is divided into separate steps. The potential failures identified per step each receive a Risk score (R). On the basis of this score and the chance of identifying failures after they have occurred, an assessment is made as to whether measures need to be taken. Elsewhere, we described an application of FMEA for the fertility laboratory which is situated in our department. 13 In comparison, the PRA method described in the present paper purposefully used a less detailed approach, 13 with processes divided into broader steps. In addition, a simple matrix was introduced to capture the risk scores. These improvements allow for a better overview of the processes and the results obtained.
To conduct the PRAs, the steps in each process were first inventoried, resulting in an outline in the form of a flow diagram (Figure 1). The flow diagrams provide an overview of each process and come in handy when documenting potential failures step by step. PRAs were conducted for the pre-analytical and analytical processes for both the regular and stat processing of laboratory tests. These processes have multiple ‘entries’ and ‘exits’ in our laboratory, giving rise to flow diagrams with multiple arms, each of which were described (provided they were of some importance). Each process step in the flow diagram was given a brief description and a code that was subsequently used in the score matrix (Figure 2).
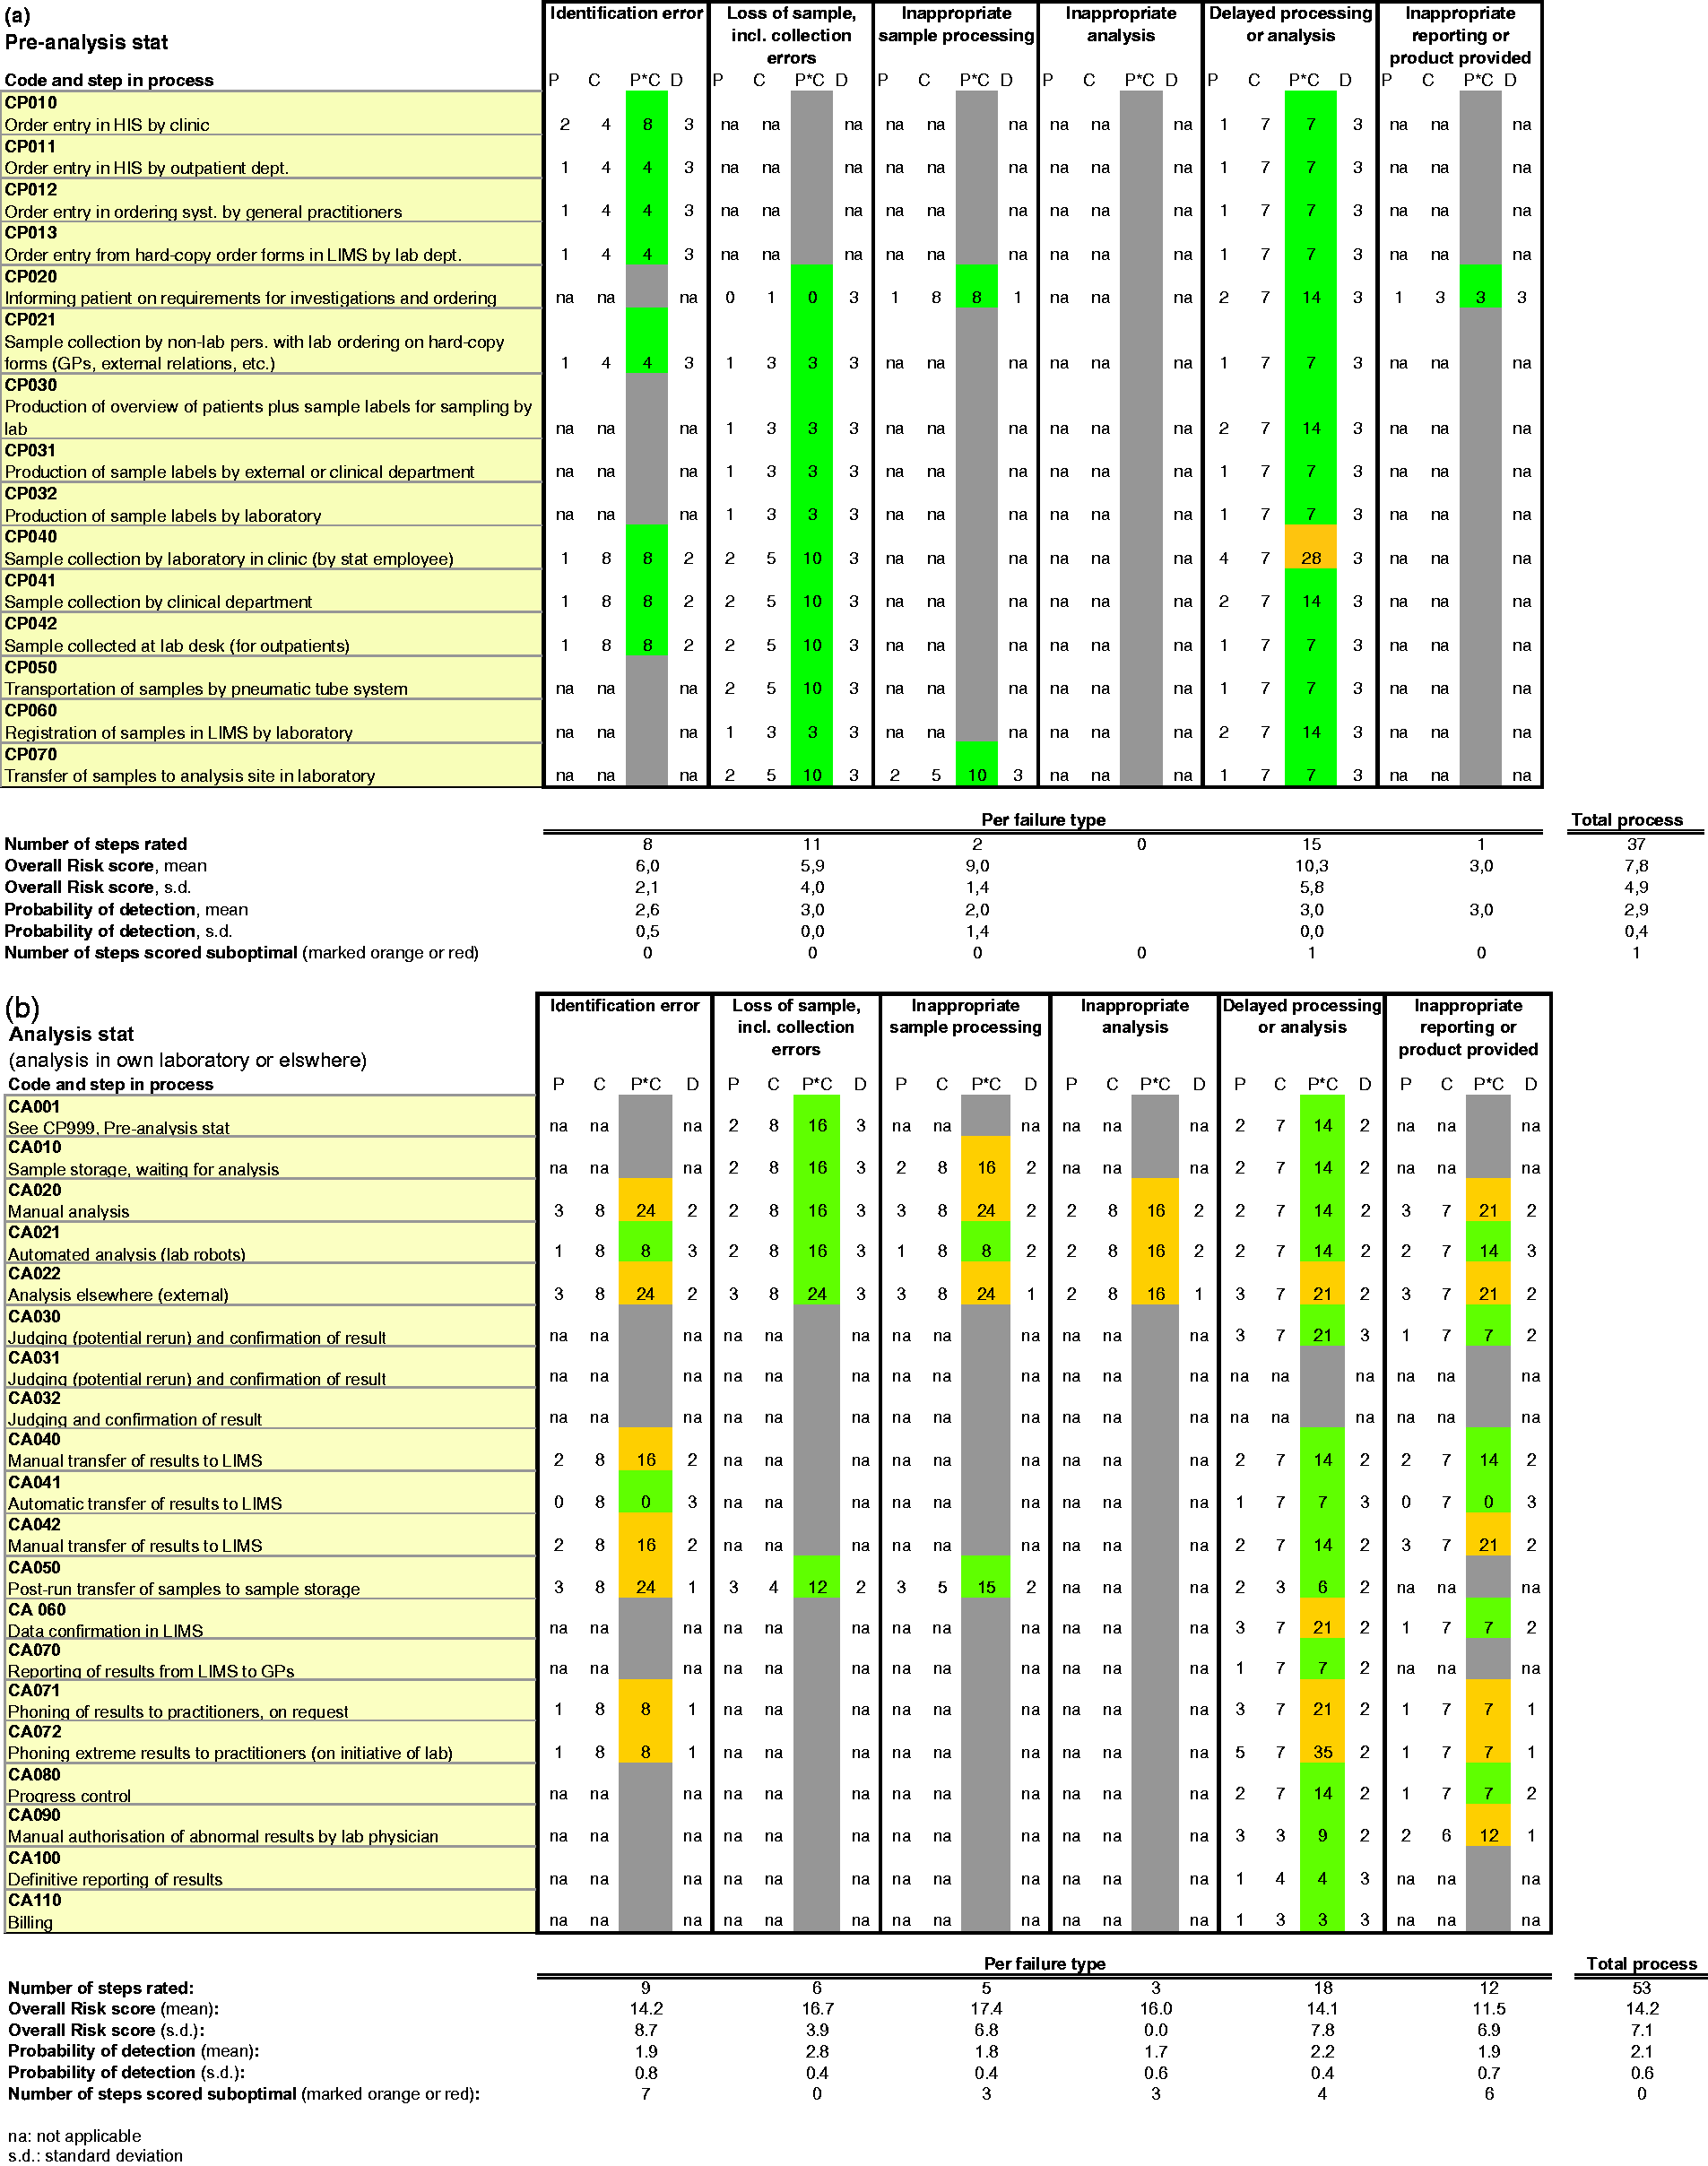
Process description in the form of flow diagrams of (a) the stat pre-analytical process and (b) the stat analytical process in our laboratory or elsewhere. PRA of (a) stat pre-analytical process and (b) stat analytical process in our laboratory or elsewhere. Abbreviations: P: Probability; C: Consequence; D: chance of Detection; na: not applicable. The codes CP and CA in column 2 for each process step refer to the relevant steps in the flow diagrams (Figure 1). Boxes marked in grey are those for which risk scoring is not applicable.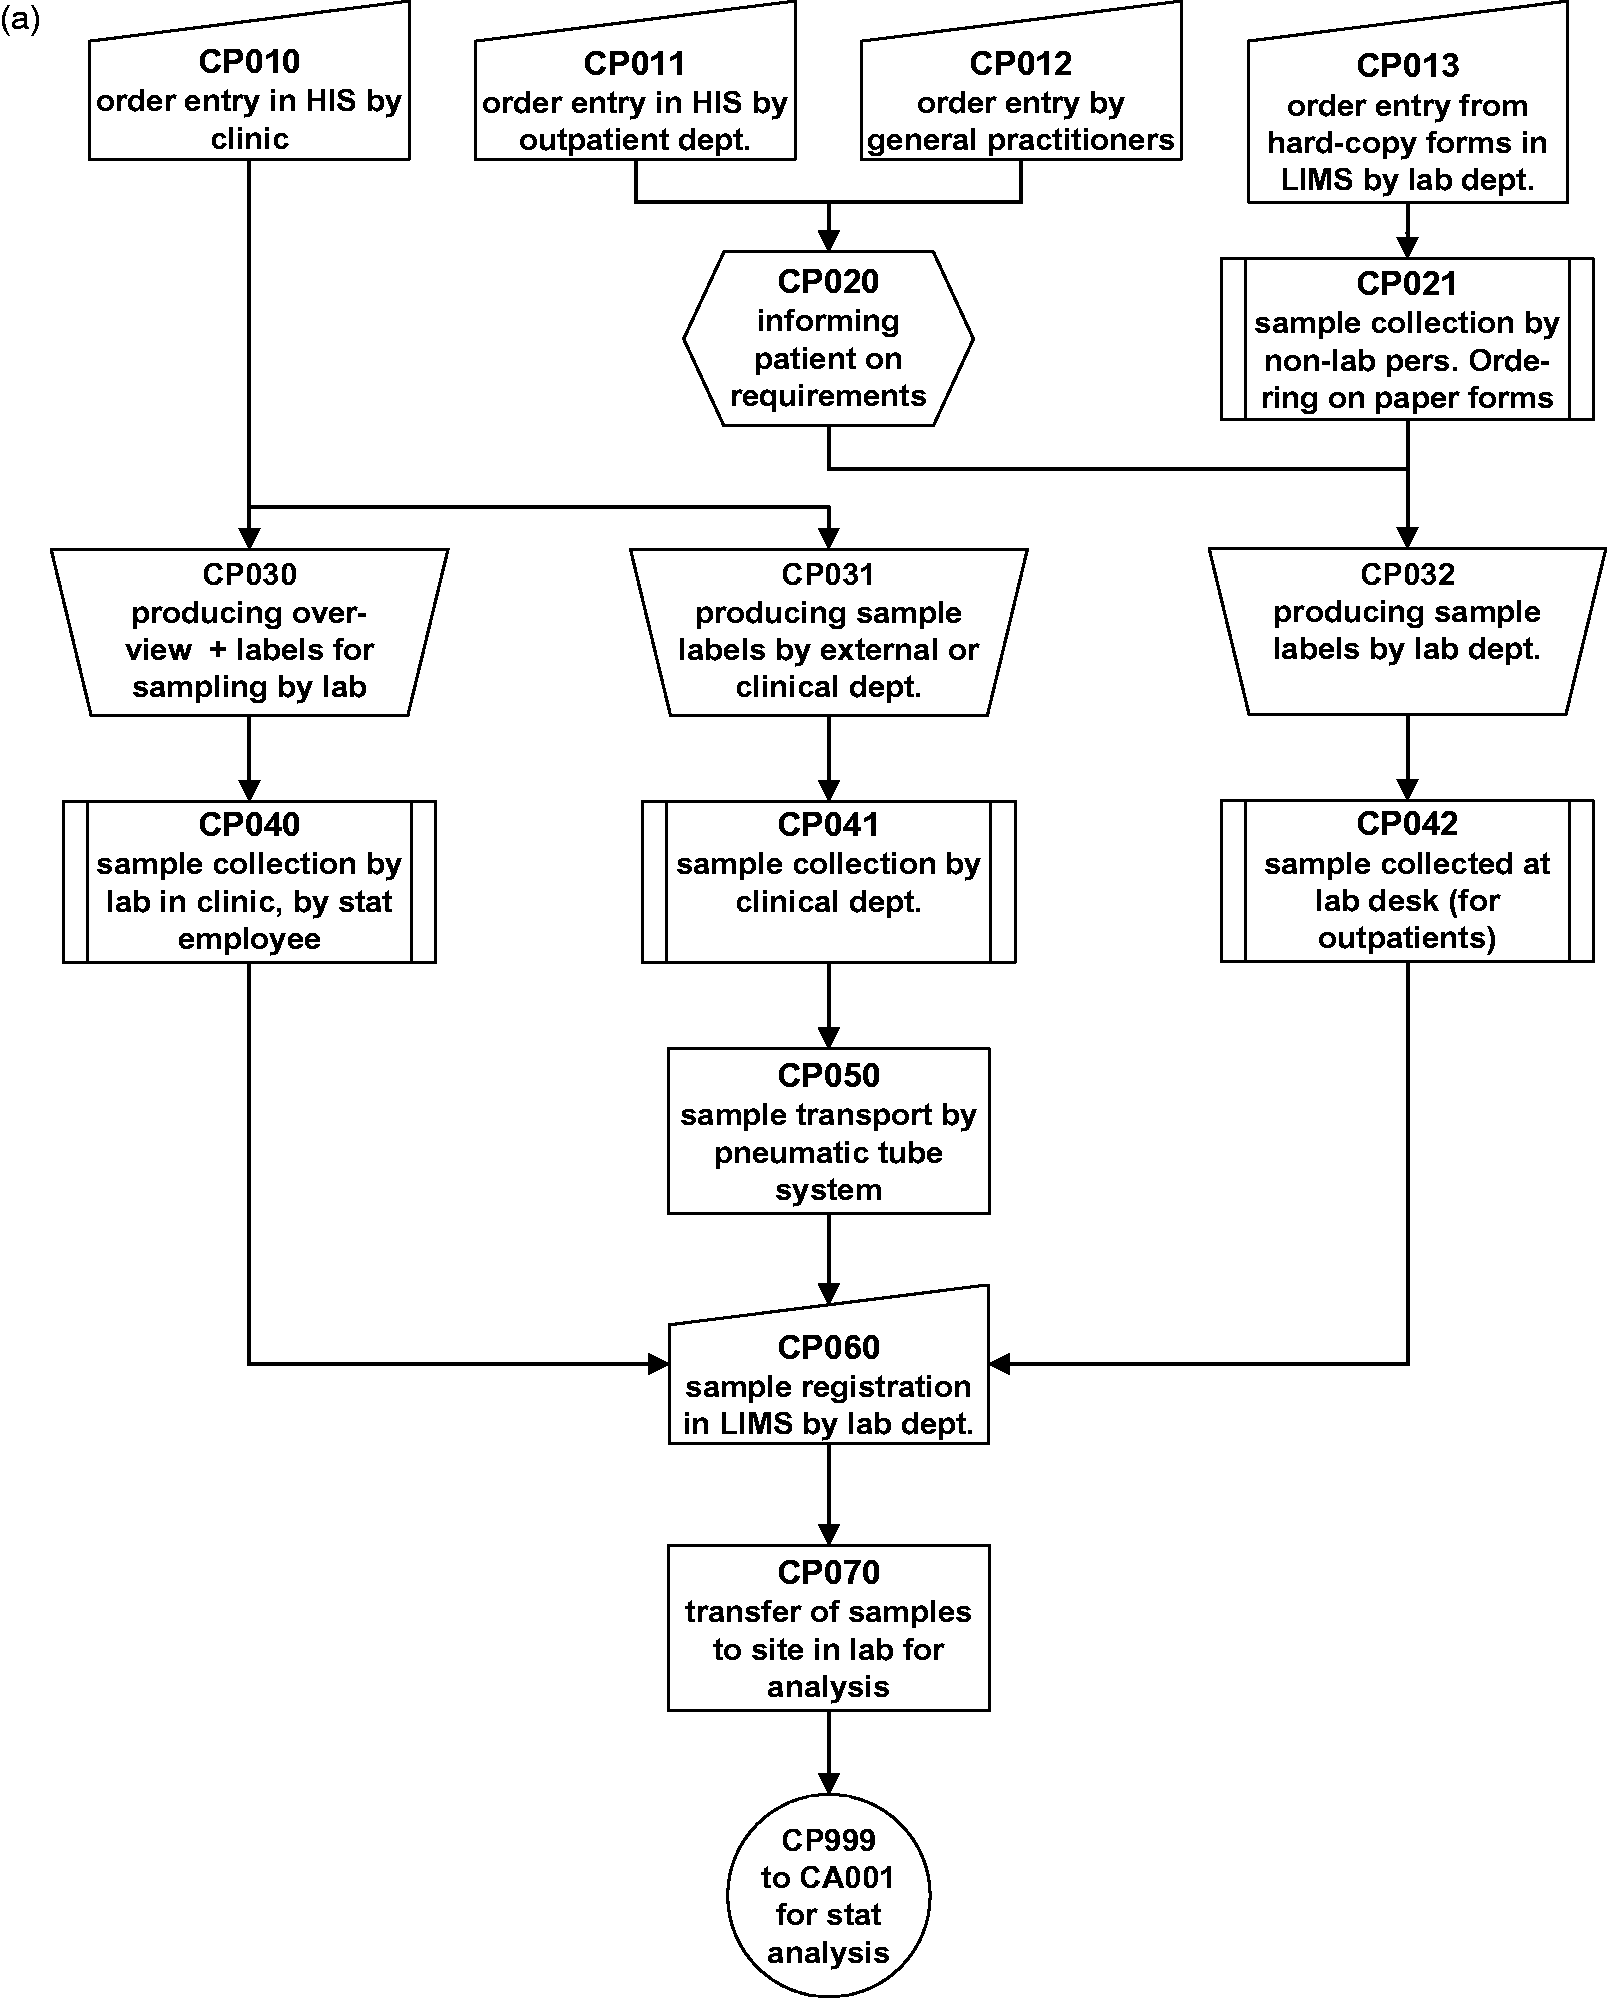
Prior to conducting the PRAs, we identified in a general sense the basic potential failures (also referred to in the literature as non-conformities, failure modes, incidents and errors) that can occur in the processes. We decided on a limited number of failures, so as to maximise clarity when performing the PRAs. The potential failures across laboratories are largely consistent,
5
but some variation can occur depending on the process considered, the personal choices of the individuals performing the PRA and the responsible staff. Our PRAs focused on the failure types:
identification error; mixing up or loss of material; incorrect sample labelling, processing or handling; incorrect execution of analysis; incorrect reporting or product delivery; and delayed execution.
Failure types 1 to 5 mainly relate to content. Failure type 6 primarily concerns the factor time, although time may also be involved in failure types 3 to 5. Space and environmental factors as reflected in issues such as temperature, noise, commotion, equipment, distances, power facilities, etc., can affect any time- and content-related aspect of the process, so play a role in all six failure types. For the sake of convenience, no additional failure types specific to the factors time or space/environment were introduced, as they were considered to be sufficiently addressed in the other failure types. To keep the scoring matrix uniform and universally applicable to all laboratory processes, specific headings were not deleted from the scoring table in cases where a specific failure type did not exist, but rather left blank (e.g. ‘incorrect execution of analysis’, which does not apply to pre-analysis, or ‘product delivery’, which applies not to the analytical but rather to the blood transfusion and fertility laboratory processes in our department).
Execution of the risk analysis
The PRAs were conducted, amid open consultation and discussion, by groups of four to seven members. In our experience, the group should neither be so large as to prevent efficient discussion and progress, nor too small, to guarantee the presence of sufficient knowledge and experience. One group member had experience performing PRAs, some members had a good overview of the process concerned and clinical laboratories in general, and several were regularly involved in executing the process. For each potential failure in a process step, an inventory was made of the following:
the Probability (P) of a certain failure occurring over time (also referred to as likelihood), scored on a scale of 0–10 (0 = almost never or impossible, 1 = less than once a year, 2 = once a year, 3 = several times a year, 4 = once a month, 5 = several times a month, 6 = once a week, 7 = several times a week, 8 = each day, 9 = several times a day, 10 = many times a day). the Consequence (C) (also referred to as the impact) of a failure, scored on a scale of 0–10. The degree of the consequence is assessed in light of the potential damage for patients (health risk, inadequate or ineffective treatment, discomfort), although serious consequences for employees are also taken into account in the higher ratings (i.e. 8 and higher) (0 = no problem, 1 = practically no problem, 3 = minor problem that can be solved by staff, 4 = somewhat inconvenient, 5 = inconvenient, 6 = discomfort, 7 = serious discomfort, 8 = injury to patient or someone else, 9 = severe injury to patient or someone else, 10 = catastrophic, severe injury with permanent and/or life threatening consequences). the chance of Detecting (D) a failure, scored on a scale of 1–3 (1 = low, 2 = medium, 3 = high).
The scores were obtained by consensus among the group members, after debate where necessary.
We recommend that each laboratory establish its own definitions for each score, as these may depend on the local conditions and culture as well as the process considered.
To estimate the overall Risk score (R), the Probability is multiplied by the Consequence of the failure; in other words, R = P × C, on a scale of 1–100. The P, C, R and D scores were recorded in a matrix table created in Excel (Figure 2).
Processing of the PRA results and evaluation
The overall Risk scores (R) were automatically calculated in the Excel table from the estimated Probability and Consequence of the different failure types (Figure 2). The R scores were evaluated in combination with the chance of Detecting the failure (D) as follows:
Acceptable:
R max. 5, low D R max. 15, medium D R max. 25, high D
Unacceptable:
R > 30, low D R > 40, medium D R > 50, high D
Suboptimal:
R 5–30, low D R 15–40, medium D R 25–50, high D
Overall Risk–Detection chance combinations with acceptable outcomes were highlighted in green in the matrix table, those not acceptable in red and those suboptimal in orange. This colour scheme permitted a quick overview of the risk analysis for each process. In our opinion, potential failures with unacceptable outcomes (red) require an immediate, more detailed risk analysis of the individual components of the process step. In the meantime, the process or sub-process concerned must be put on hold until the Probabilities or Consequences of failure have lessened or additional Detection chances have been introduced. More detailed analysis is also advisable for potential failures with suboptimal outcomes with relatively high R–low D combinations (orange). We did this for one of the potential failures in the stat analytical process.
Results
Overview of results of PRAs of four laboratory processes involved in production of test results.
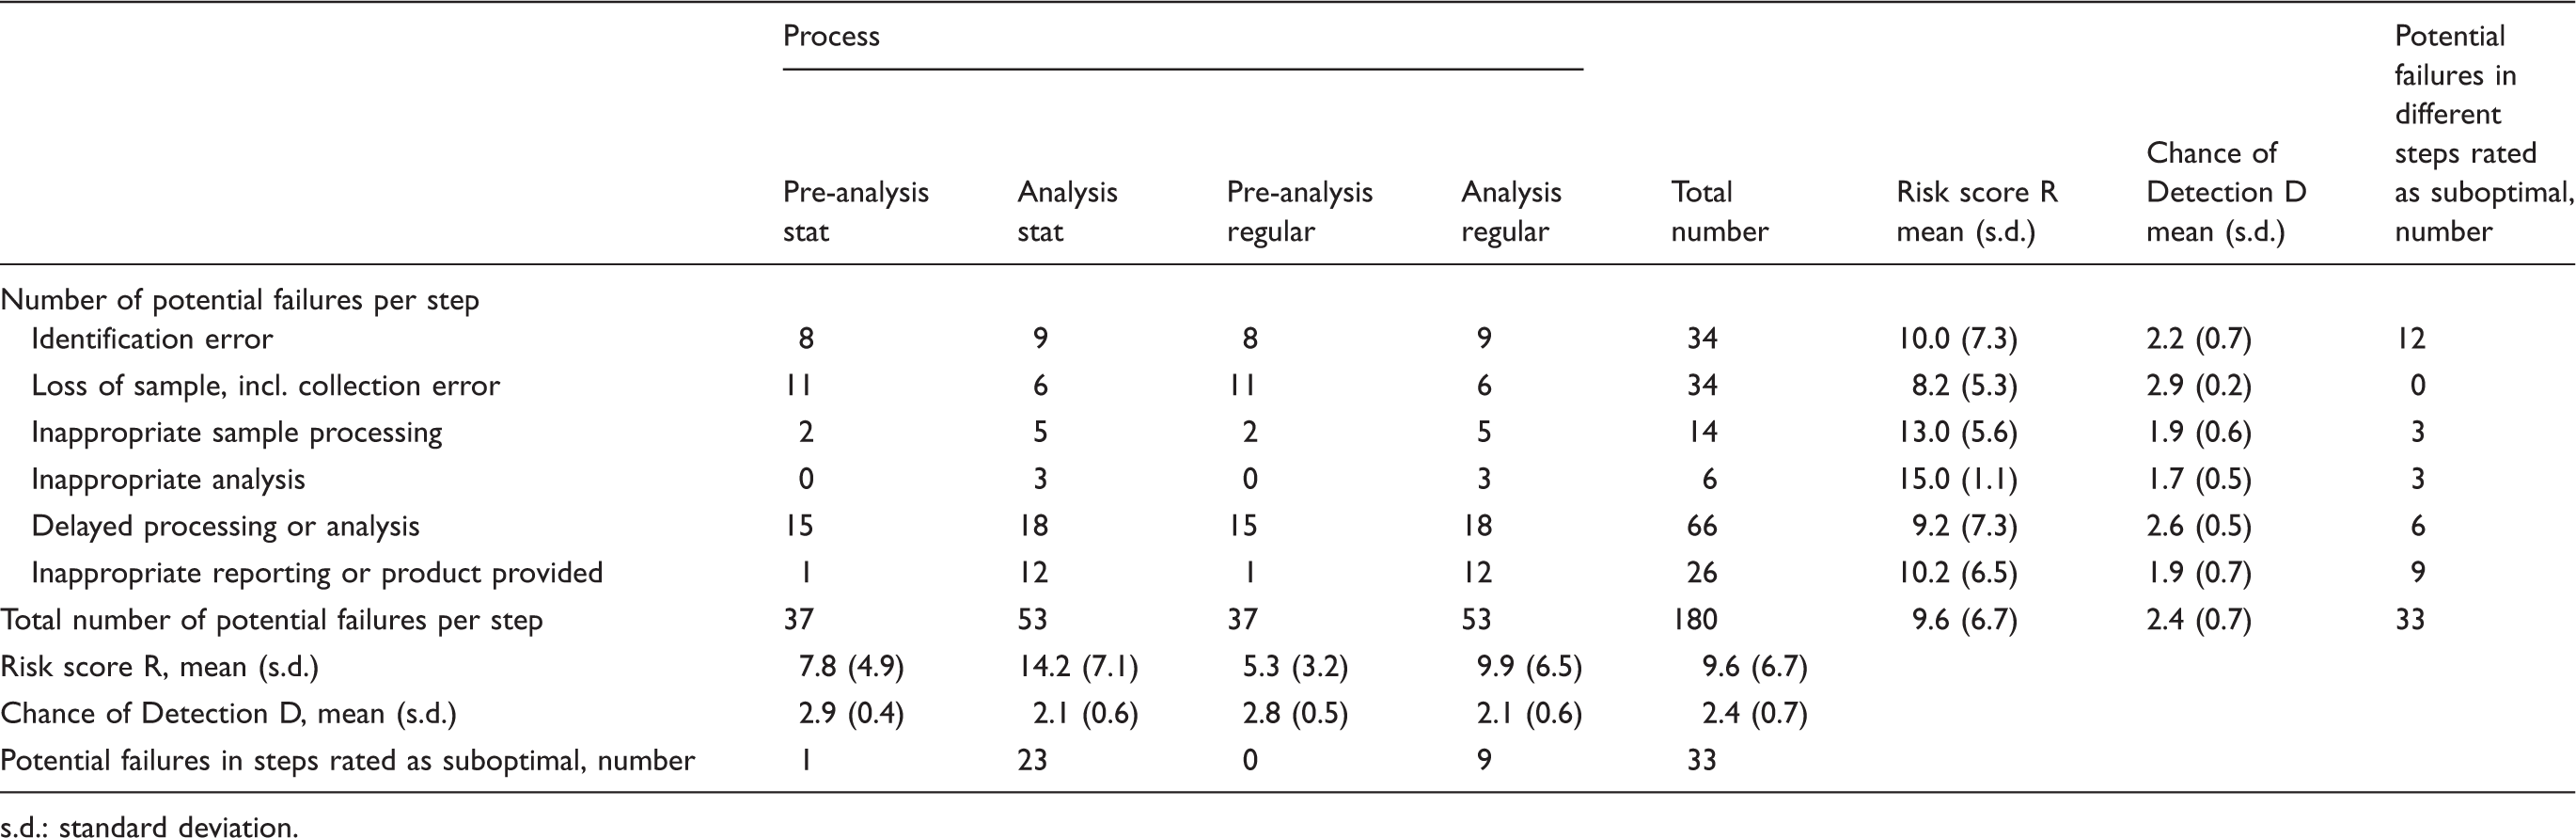
s.d.: standard deviation.
In total, 180 potential failures were identified in the various steps of all four PRAs. Of these, 33 potential failures were rated as suboptimal (18.3%). More potential failures were identified in the analytical processes (53) than in the pre-analytical processes (37), a difference mainly explained by the higher frequency of the failure type ‘inappropriate reporting’ (12 in the analytic process, 1 in the pre-analytic process). The absence of the failure type ‘inappropriate analysis’ in the pre-analytic process also helps to account for this difference, although to a lesser extent (3 in the analytic process, 0 in the pre-analytic process). All processes taken together, the overall mean Risk score (R) was 9.6 ± 6.7 (means ± s.d.) and the overall mean chance of Detection (D) was 2.4 ± 0.7.
Considering the scores per process, the highest mean R was observed for the stat analytical process (14.2 ± 7.1) and the lowest for regular pre-analysis (5.3 ± 3.2). For both stat processes, the mean R was higher than for the non-stat processes. The mean D was comparable for all processes (range 2.1–2.9). In the stat analytical process, potential failures with suboptimal scores were identified more frequently (23) than in the stat pre-analytical process, whereas the fewest potential failures with suboptimal scores were identified in regular pre-analysis (0).
Considering the scores per failure type, ‘delayed processing or analysis’ was observed most often (66), ‘inappropriate analysis’ the least (6). The highest mean R was obtained for ‘inappropriate analysis’ (15.0) and the lowest for ‘loss of sample/collection error’ (8.2). The mean D for the different failure types varied from 1.7 to 2.9. ‘Identification error’ was the most frequent suboptimal failure type (12) and ‘loss of sample/collection error’ the least frequent (0).
No potential failures were evaluated as unacceptable, although ‘Phoning extreme results to practitioners’ in step CA072, evaluated as suboptimal, had a relatively high R score (35) with a medium D (2) (Figures 1(b) and 2(b)). For this potential failure, a more detailed analysis was conducted using the same PRA approach described here. The step was divided into eight separate sub-steps, each activity was briefly described, and the Probability, Consequence and chance of Detection of potential failures were rated. The resulting R–D combinations were evaluated as described. One of the eight sub-steps proved to be overtly insufficient, that is, laboratory technicians were taking too long to phone extreme results to practitioners. Improvement measures were devised based on this insight: a pop-up was made that appears on the computer screen as soon as the laboratory technician confirms the test result, indicating that the result must be phoned through to the practitioner immediately.
Discussion
The working methods, guidelines and procedures for quality assurance for analyses in clinical laboratories have been detailed elsewhere.9,16,17 However, laboratory analyses are merely part of the wider processes performed in laboratories. Matters such as sample collection and handling, timely processing and reporting are also essential and valued by users. It is the total product that counts. PRA can help laboratory processes to operate in an optimal, error-free manner. In diagnostic laboratories, however, PRA is still fairly novel. This paper therefore describes a practical, transparent form of PRA for clinical laboratories. All aspects relevant to the key laboratory processes, from sampling to reporting test results, were evaluated step by step for all conceivable failures. Predefined potential failures were used, as this made performing the PRAs easier and more systematic, prevented arbitrariness in identifying failures and guarded against the omission of certain failure types in specific process steps. The risk scores obtained were recorded in convenient matrix tables, making each process immediately visible in its entirety. The overall Risk scores and the chances of Detection were compared against predetermined standards and the outcomes highlighted in the matrix tables, making it immediately visible in which step and for which failure type improvement actions were required. The overall Risk scores were evaluated in light of the chances of Detection, as the ultimate consequence of a certain risk depends on whether the failure is likely to be detected in time (and prevented) or not. Each completed PRA is accompanied by a brief report, which is convenient for further evaluation and revision both in itself and for auditing and review by others (cf. clause 4.13 of ISO 15189). 9
The exact results of PRAs are, of course, dependent on the local situation. Processes and their organisation differ between laboratories, as do the risks for certain failures and the safeguards applied to prevent or detect them in a timely manner. In addition, the rating of the Probabilities, Consequences and chances of Detection of potential failures may differ between laboratories, at least to some extent, as may the norms used in evaluating the scores. It should be clear, therefore, that the present results are merely illustrative. Still, the salient features of our four PRAs may provide some useful insights also applicable to other situations.
One observation was that, as expected, the highest Risk scores were obtained in the stat processes. Stat processes must satisfy higher standards than regular processes, which makes them more vulnerable to deviations and interference. Potential failures, and potential failures rated as suboptimal, were most often found in the stat and regular analytical processes. The failure type with the highest mean R score was ‘inappropriate analysis’. These observations underscore the importance of the analytical process carried out by clinical laboratories, as well as its susceptibility to errors. The failure type most frequently rated as suboptimal was ‘identification error’. As this involves manual, human work which is prone to error, this is not altogether unexpected. While human failure can never be completely eliminated, measures can be taken to reduce the chance of error, minimise the consequences and maximise the chances of detection of failures, for instance by using the Human Reliability Analysis and the Skills, Rules, Knowledge approach. 18 Finally, the failure type ‘delayed processing or analysis’ was most frequently represented in the collective process steps. This underlines the importance of timeliness in the various pre-analytical and analytical laboratory processes.
The PRAs previously described for our fertility lab involved 49 separate process steps for our semen bank, and 45 for the processing of fresh semen for intrauterine insemination. 13 Such high numbers make these PRAs laborious and unclear. The PRA approach described here is less detailed, identifying only 15 (pre-analysis) to 20 (analysis) process steps. This more general approach makes the present PRA easier to perform and less labour intensive, while providing a better overview of the processes.
It is undoubtedly true that sub-steps can often be identified per process step. However, we purposefully viewed the steps from a broader perspective, based on the idea that employees familiar with a process normally have a good idea whether a certain step as a whole is risky with respect to a certain type of failure. A potential failure in a step was considered risky if sub-processes within it were assumed or known to be characterised by a greater Probability or Consequence of failure, resulting in a significant Risk score, together with a relatively low chance of Detection. In such cases, a further, more detailed risk analysis was conducted for the individual sub-steps relating to the potential failure. This can be done using the FMEA method described here. It is worth noting that, in addition to the more detailed inspection of potential failures (if considered necessary), the results of the PRA should also be considered at higher aggregation levels; that is, across multiple steps and potential failures. This helps to shed light on whether risks can be traced to more general factors influencing quality, such as equipment, working conditions or the immediate environment. The transparent presentation of our PRA results facilitates such a holistic perspective.
The separate evaluation of Probability and Consequences and their combination in an overall Risk score allows divergent potential failures to be assessed, irrespective of whether they are more or less likely or serious. Further, assigning scores for the Probabilities, Consequences and chances of Detection helps to make the results of the PRA comparable with other PRAs. The scoring method, which is characteristic of FMEA, is semi-quantitative and naturally somewhat subjective, as described. 19 We scored the Probabilities of potential failures in terms of time, as this is how laboratory staff are most used to thinking (as opposed to in terms of deviations per number of samples processed or analyses performed). This approach entails taking into account the number of issues involved in the process considered. For a failure in a process involving thousands of issues each week (e.g. 8000 samples for routine chemistry analysis, as in our lab), one failure per week might be scored with a 6 (a rather low probability), while the Probability of one failure per week in a process involving few issues each week (e.g. the 10 samples for DNA testing in our lab) might be rated 8 or 9 (high). In other words, the expression of Probability in terms of time requires the scoring to be adjusted to the process under inspection. This allows for comparison of the overall Risk scores – and thereby the results of the PRAs – of different processes.
In scoring Probabilities, one could of course consider using previously identified failures from retrospective risk analyses. However, it is by no means guaranteed that the scores of both analyses will agree, as has been shown. 20 One factor in particular, reporting bias, is difficult to control for. In PRA, processes are viewed differently than in retrospective risk analysis. Retrospective risk analysis is based on the registration of failures from everyday practice, which may lead to a distorted, overly detailed, view of the process as a whole. This highlights the added value of conducting PRA in addition to retrospective risk analysis: the two approaches are complementary. Note also that the ratings of the chances of Detection and the acceptability criteria for the overall Risk scores are unavoidably subjective. The present PRAs made use of acceptability criteria deemed reasonable elsewhere, 13 based on consideration by experienced staff well acquainted with the culture, rules and regulations in clinical laboratories in particular and healthcare in general. From the foregoing it should be clear, however, that laboratories must decide for themselves on the scoring and acceptability criteria to be used in their own PRAs, taking into account their specific environment, constraints and processes considered.
PRA is just one approach for gaining insight into laboratory processes. It is primarily aimed at preventing failures. The FMEA approach, on which the present PRA is based, is well suited for this. To reduce risks as far as possible, PRA should be applied in conjunction with retrospective risk analysis.4,21 From a broader perspective, risk analysis merges with risk management. 13 Risk management based on prospective and retrospective risk analyses should be an ongoing process, as indicated in ISO 15189.9 The complete elimination of failures may be impossible, but patients and society at large may expect medical professionals to have done their utmost to minimise them.
Footnotes
Acknowledgements
I am grateful to Alison Edwards, Cambridge, for her assistance with the text. A pre-version of the present manuscript appeared in Dutch (Janssens PMW, de Waard H, van Welt E, Lentink B, Staring W en de Geest A. Ned Tijdschr Klin Chem Labgeneesk 2012; 37: 247–251; no copy rights). In the present manuscript, new data have been incorporated and the approach to PRA, the view on its possibilities and limitations have been detailed and extended.
Declaration of conflicting interests
None.
Funding
This research received no specific grant from any funding agency in the public, commercial, or not-for-profit sectors.
Ethical approval
Not applicable.
Guarantor
PMWJ.
Contributorship
PMWJ sole author.