
Abstract
Background
Pharmacometabonomics is a new branch of science, first described in 2006 and defined as ‘the prediction of the effects of a drug on the basis of a mathematical model of pre-dose metabolite profiles’. Pharmacometabonomics has been used to predict drug metabolism, pharmacokinetics (PK), drug safety and drug efficacy in both animals and humans and is complementary to both pharmacogenomics (PGx) and pharmacoproteomics.
Methods
A literature review using the search terms pharmacometabonomics, pharmacometabolomics, pharmaco-metabonomics, pharmaco-metabolomics and the singular form of all those terms was conducted in October 2012 using PubMed and Web of Science. The review was updated until mid April 2013.
Results
Since the original description of pharmacometabonomics in 2006, 21 original publications and eight reviews have emerged, covering a broad range of applications from the prediction of PK to the prediction of drug metabolism, efficacy and safety in humans and animals.
Conclusions
Pharmacometabonomics promises to be an important new approach to the delivery of personalized medicine to improve both drug efficacy and safety for patients in the future. Pharmacometabonomics is particularly powerful as it is sensitive to both genetic and environmental factors such as diet, drug intake and most importantly, a person’s microbiome. PGx is now over 50 years old and although it has not achieved as much as some hoped, it is starting to have important applications in personalized medicine. We predict that pharmacometabonomics will be equally important in the next few decades and will be both valuable in its own right and complementary to pharmacoproteomics and PGx.
Introduction
Personalized or stratified healthcare is an important goal for medicine in the 21st-century in order to ensure that patients receive treatments that are safe and efficacious. Some progress has been made in this area through the use of pharmacogenomics (PGx), where the genetic profiles of patients, or of the agents that infect them, are used to predict the outcome of drug dosing in terms of efficacy, safety and pharmacokinetics (PK).1–7 Whilst PGx is not yet widely used, successful examples include the use of chip technologies to detect variations in patients’ CYP2D6, CYP2C19 and UDP-glucuronosyltransferase genes that are critical in drug metabolism and can influence PK and thereby safety and efficacy. 8 Tests for these gene variations are already licensed for PGx use by the Food and Drug Administration (FDA), USA.
A small amount of work has also emerged in the field of pharmacoproteomics, where the predose expressed protein profiles of patients could be used to predict the outcome of drug dosing, but this field is in its infancy. A complicating factor is that the definition of pharmacoproteomics appears unclear and does not always correspond to the proteome equivalent of PGx (see Appendix for Glossary).9,10
This review is focused on the new field of pharmacometabonomics, which is essentially the metabolite-level equivalent of PGx and is defined as ‘the prediction of the effects of a drug on the basis of a mathematical model of pre-dose metabolite profiles’. 11 The use of metabolic profiling is complementary to genomic or proteomic approaches, but has the key advantage that it is able to sample the impact of environmental factors such as diet, concurrent drug administration and critically, in humans and other animals, the role of the microbiome. It is clear that whilst the genome of an individual is fixed, the metabotype (metabolic phenotype) of an individual is highly responsive to time and the environment. We will first review the related field of metabonomics, provide an overview of the key analytical and data analysis methodologies used in both metabonomics and pharmacometabonomics and then move on to a review of pharmacometabonomics itself. The review takes a largely chronological approach unless coherent treatment of a particular topic requires otherwise.
Metabonomics
Metabonomics was first defined in 199912,13 by Jeremy Everett and Jeremy Nicholson, during the course of a collaboration between Pfizer R&D, UK and Imperial College London, in order to provide a conceptual framework for integrated preclinical metabonomics, proteomics and genomics studies used to generate early safety signals on novel therapeutic agents. The definition given was ‘The study of the metabolic response of organisms to disease, environmental change or genetic modification’. Studies of biofluids and their metabolites have a long history prior to the definition of metabonomics however.14–20
Metabonomic studies have been used to examine and understand the changes that occur in a huge variety of organisms as a result of drug administration, nutritional changes, microbiome alterations, genetic changes, environmental changes, clinical interventions and exercise.21–24 Metabonomic studies are typically done by comparing changes in biofluid profiles before and after an intervention such as, for example, drug treatment, using analytical technologies such as nuclear magnetic resonance (NMR) spectroscopy or mass spectrometry (MS), often in a hyphenated approach, i.e. ultra performance liquid chromatography – mass spectrometry (UPLC-MS), (see below). 25 The changes in metabolite profiles can then be interpreted in terms of the effect of the intervention on the test organism, often using advanced statistical and pattern recognition technologies to assist with the data analysis. 26 Metabonomic studies are employed at a systems biology level, in animals and humans, as well as in plants and cells. In animal and human studies on which we will focus, the studies have had a wide range of goals including the provision of information on drug metabolism, drug safety and drug efficacy, the aetiology, onset, progression, remission and treatment of disease, the effects of genetic modification (in animals), the effects of environmental factors such as the microbiome, nutrition and exercise and finally, the study of differences between subsets of animals or humans at a population level.21–24
A degree of confusion crept into the literature by the later introduction of the term metabolomics27,28 and whilst there was once a distinction in their usage, with metabolomics either: (i) being used for the analysis of plant and cellular metabolites, and metabonomics being used in an animal systems biology context, or (ii) metabolomics being associated with MS-based analyses and metabonomics being associated with NMR-based analyses, the two terms are now used interchangeably. Etymologically speaking, the term metabonomics is more compelling. 29 In this review, we will use the original term metabonomics throughout (see Appendix for Glossary).
NMR spectroscopy, MS and metabonomic data analysis methods
NMR spectroscopy
NMR Spectroscopy is the most powerful technology for the elucidation of the structures of molecules in solution.30,31 As such, NMR spectroscopy is a leading technology for the analysis of biofluids. Biofluid samples are placed in a strong, homogeneous magnetic field that causes the nuclei of certain isotopes that have magnetic moments, such as hydrogen-1 or carbon-13, to occupy one of two nuclear magnetic spin states, aligned with or against the magnetic field. A small excess of nuclear spins are in a low energy, aligned state. The application of short bursts of radiofrequency causes these nuclei to change their alignment with the magnetic field and the excess of nuclei in the low energy state are now forced into an excited state. The relaxation of this excited magnetization is observed as an induced electric current in receiver coils placed around the sample, and this signal is then mathematically (Fourier) transformed from a time-domain decay into a frequency-domain signal to give the NMR spectrum. NMR spectra can be obtained in this way for a huge range of nuclei such as fluorine-19, phosphorus-31 and nitrogen-15, in addition to hydrogen-1 and carbon-13. Hydrogen-1, also known as H-1, 1H or proton NMR spectroscopy is most commonly used as it has one of the highest sensitivities for detection, is almost 100% abundant and is ubiquitous in biological molecules, large and small. Each chemically distinct hydrogen atom will have a signal in the NMR spectrum at its own characteristic frequency. In addition, each signal area will be approximately proportional to the number of hydrogen atoms giving rise to it: hence a methyl group (–CH3) in a given molecule will have a signal three times the area of that of a C–H group in the same molecule.
In addition, groups of hydrogen atoms that are separated by two to three bonds (generally) in a molecule will spin-couple with each other, sometimes described as ‘talking to each other’. Spin coupling is caused by a given hydrogen nucleus ‘A’ sensing the two magnetic spin states of a neighbouring hydrogen ‘X’, which causes the resonance frequency of HA to split by an amount equal to the coupling constant JAX in Hz. This splitting of each other’s signals follows an N + 1 rule, where N is the number of adjacent hydrogens. Thus, a C–H group that is directly bonded to a methyl (CH3) group in the substructure – CH(CH3) – will have its signal split into four lines (3 + 1) and the CH3 group will have its signal split into two lines (1 + 1), (Figure 1). The intensity pattern of these splittings is 1:1, 1:2:1 and 1:3:3:1 for the coupling of a hydrogen to 1, 2 or 3 equivalent hydrogen neighbours, respectively. This spin–spin coupling, or J-coupling, operates through the chemical bonds, is field strength independent and gives NMR spectroscopy huge power in analysing molecular structures.30,31 When analysing samples such as biofluids, which are mixtures of hundreds or thousands of components, the quantitative nature of NMR is a key advantage, as the areas of signals from different molecules are approximately equal to the relative proportions of those components in the mixture. The key issue for NMR spectroscopy is low sensitivity, due to the small population difference between the two nuclear magnetic spin states. As a result of this issue, it is common to use NMR spectroscopy in concert with other technologies such as hyphenated MS, i.e. the MS detection of biofluid components separated by chromatographic techniques such as gas chromatography (GC) or UPLC.
(a) the 600 MHz 1H NMR spectrum of rat urine collected 0–7 h after the administration of isoniazid (400 mg/kg i.p.), from 0.8 to 4.7 ppm (top panel) and from 5.0 to 9.0 ppm (bottom panel) on the chemical shift scale, δH. Numerous signals are visible from endogenous metabolites such as lactate, citrate and glucose, microbiome-derived metabolites such as hippurate, as well as signals from isoniazid and its many metabolites and metabonates including acetyl isoniazid (AcINH), pyruvate isonicotinylhydrazone (INH-PA), 2-oxoglutarate isonicotinylhydrazone (INH-KA), β-glucosyl-isonicotinylhydrazide (INH-GLC) and isonicotinic acid (INA). Note that NMR spectroscopy is highly sensitive to subtle molecular structure features and detects separately the syn- and anti-isomers of INH-PA and INH-KA, both in a ca 2:1 ratio (designated with the suffixes A and B). The signals from lactate (see the chemical structure in Figure 1(b)) are particularly instructive: the methyl CH3 signal at δH ca 1.33 ppm is a large 1:1 doublet signal of relative signal area 3, whilst the C–H signal at δH ca 4.13 ppm is a 1:3:3:1 quartet of relative signal area 1. Reprinted with permission from Journal of Proteome Research. Copyright 2012 American Chemical Society.
32
(b) The chemical structure of S-lactic acid.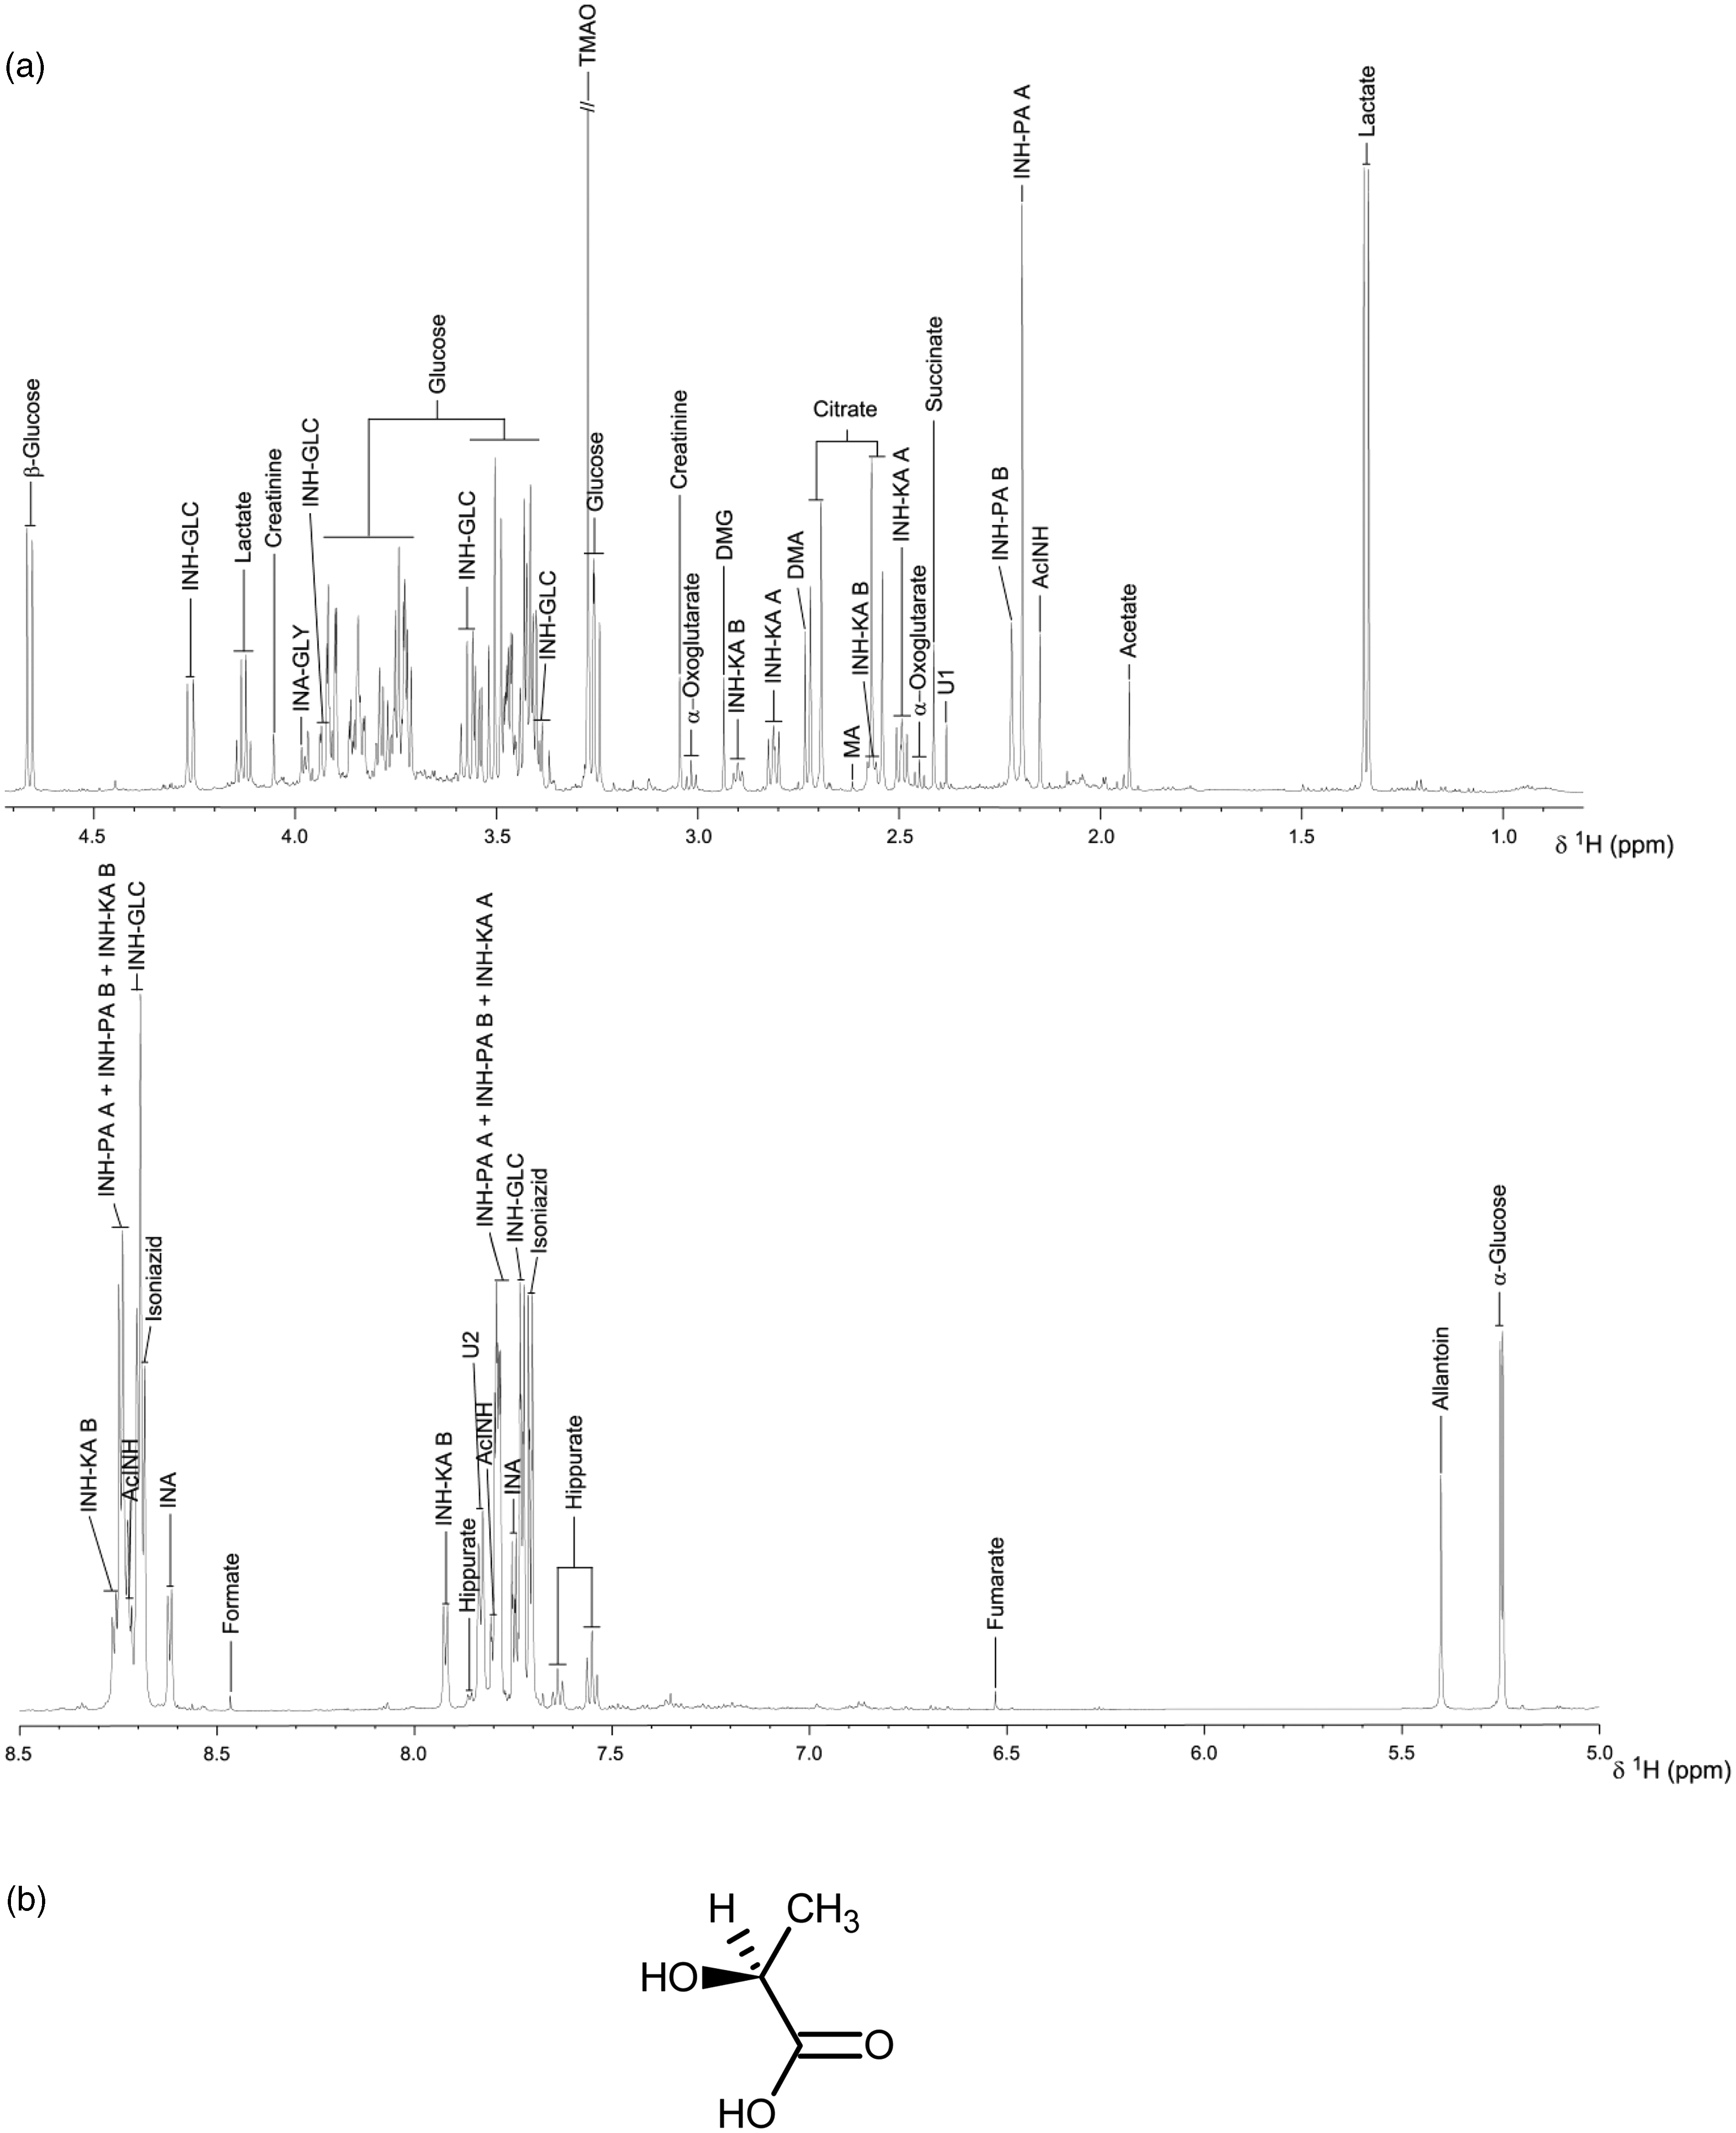
Mass spectrometry
Mass spectrometry 33 is an analytical technique that measures the mass-to-charge ratio of charged molecules or molecular fragments. It is used for determining the monoisotopic molecular mass of chemical entities and can also provide detailed information on molecular structure. 34 There are three main components to a mass spectrometer. Firstly, an ion source, which converts gas phase molecules into ions or, in the case of electrospray ionization, moves ions that exist in solution into the gas phase. Secondly, a mass analyser, which sorts ions by their mass-to-charge ratio, by applying an electromagnetic field or an oscillating direct current/radio frequency quadrupole field under high vacuum. Thirdly, an electron- or a photo-multiplier is used to detect the separated ions.
The combination of MS with a separation technique such as GC, or high performance or ultra performance liquid chromatography (HPLC or UPLC) provides an excellent analytical approach to the analysis of complex mixtures such as biofluids.35–38
Gas chromatography-mass spectrometry (GC-MS) combines the impressive separative capability of high-resolution gas capillary columns with the high sensitivity of MS detection and enables the analyst to obtain structural information on individual components in complex mixtures. The key limitation of GC-MS is the requirement for the components in the mixture to be volatile. However, by employing a rigorous sample preparation process together with chemical derivatisation, a significant number of compounds in urine and plasma can be volatilised and then separated and detected by GC-MS. A small aliquot of the mixture is injected onto the GC column that is swept by a carrier gas of helium. During its passage through the column, the mixture partitions into its various components prior to entering the mass spectrometer. A typical GC-MS trace of a derivatised human urine sample is shown (Figure 2). As can be seen, hundreds of components can be volatilised, separated, detected by MS and characterized.
39
The electron ionization (EI) mass spectra obtained from each component as it elutes can be used to confirm the structures of known compounds by peak matching against a reference spectral database such as the NIST/EPA/NIH Database of Electron Ionization Mass Spectra.
40
For unknown compounds, analysis of the pattern of molecular and fragment ions in the EI mass spectrum gives structural information that will assist with the identification of the compound.
Typical GC-MS profile of a trimethylsilyl (TMS)-derivatised human urine extract. The trace shows the complexity of the sample, with hundreds of components present, some of which were identified on the basis of their EI mass spectra (not shown). The nomenclature tetrakis-TMS indicates that four reactive hydrogens attached to oxygen and nitrogen atoms have been replaced with TMS groups.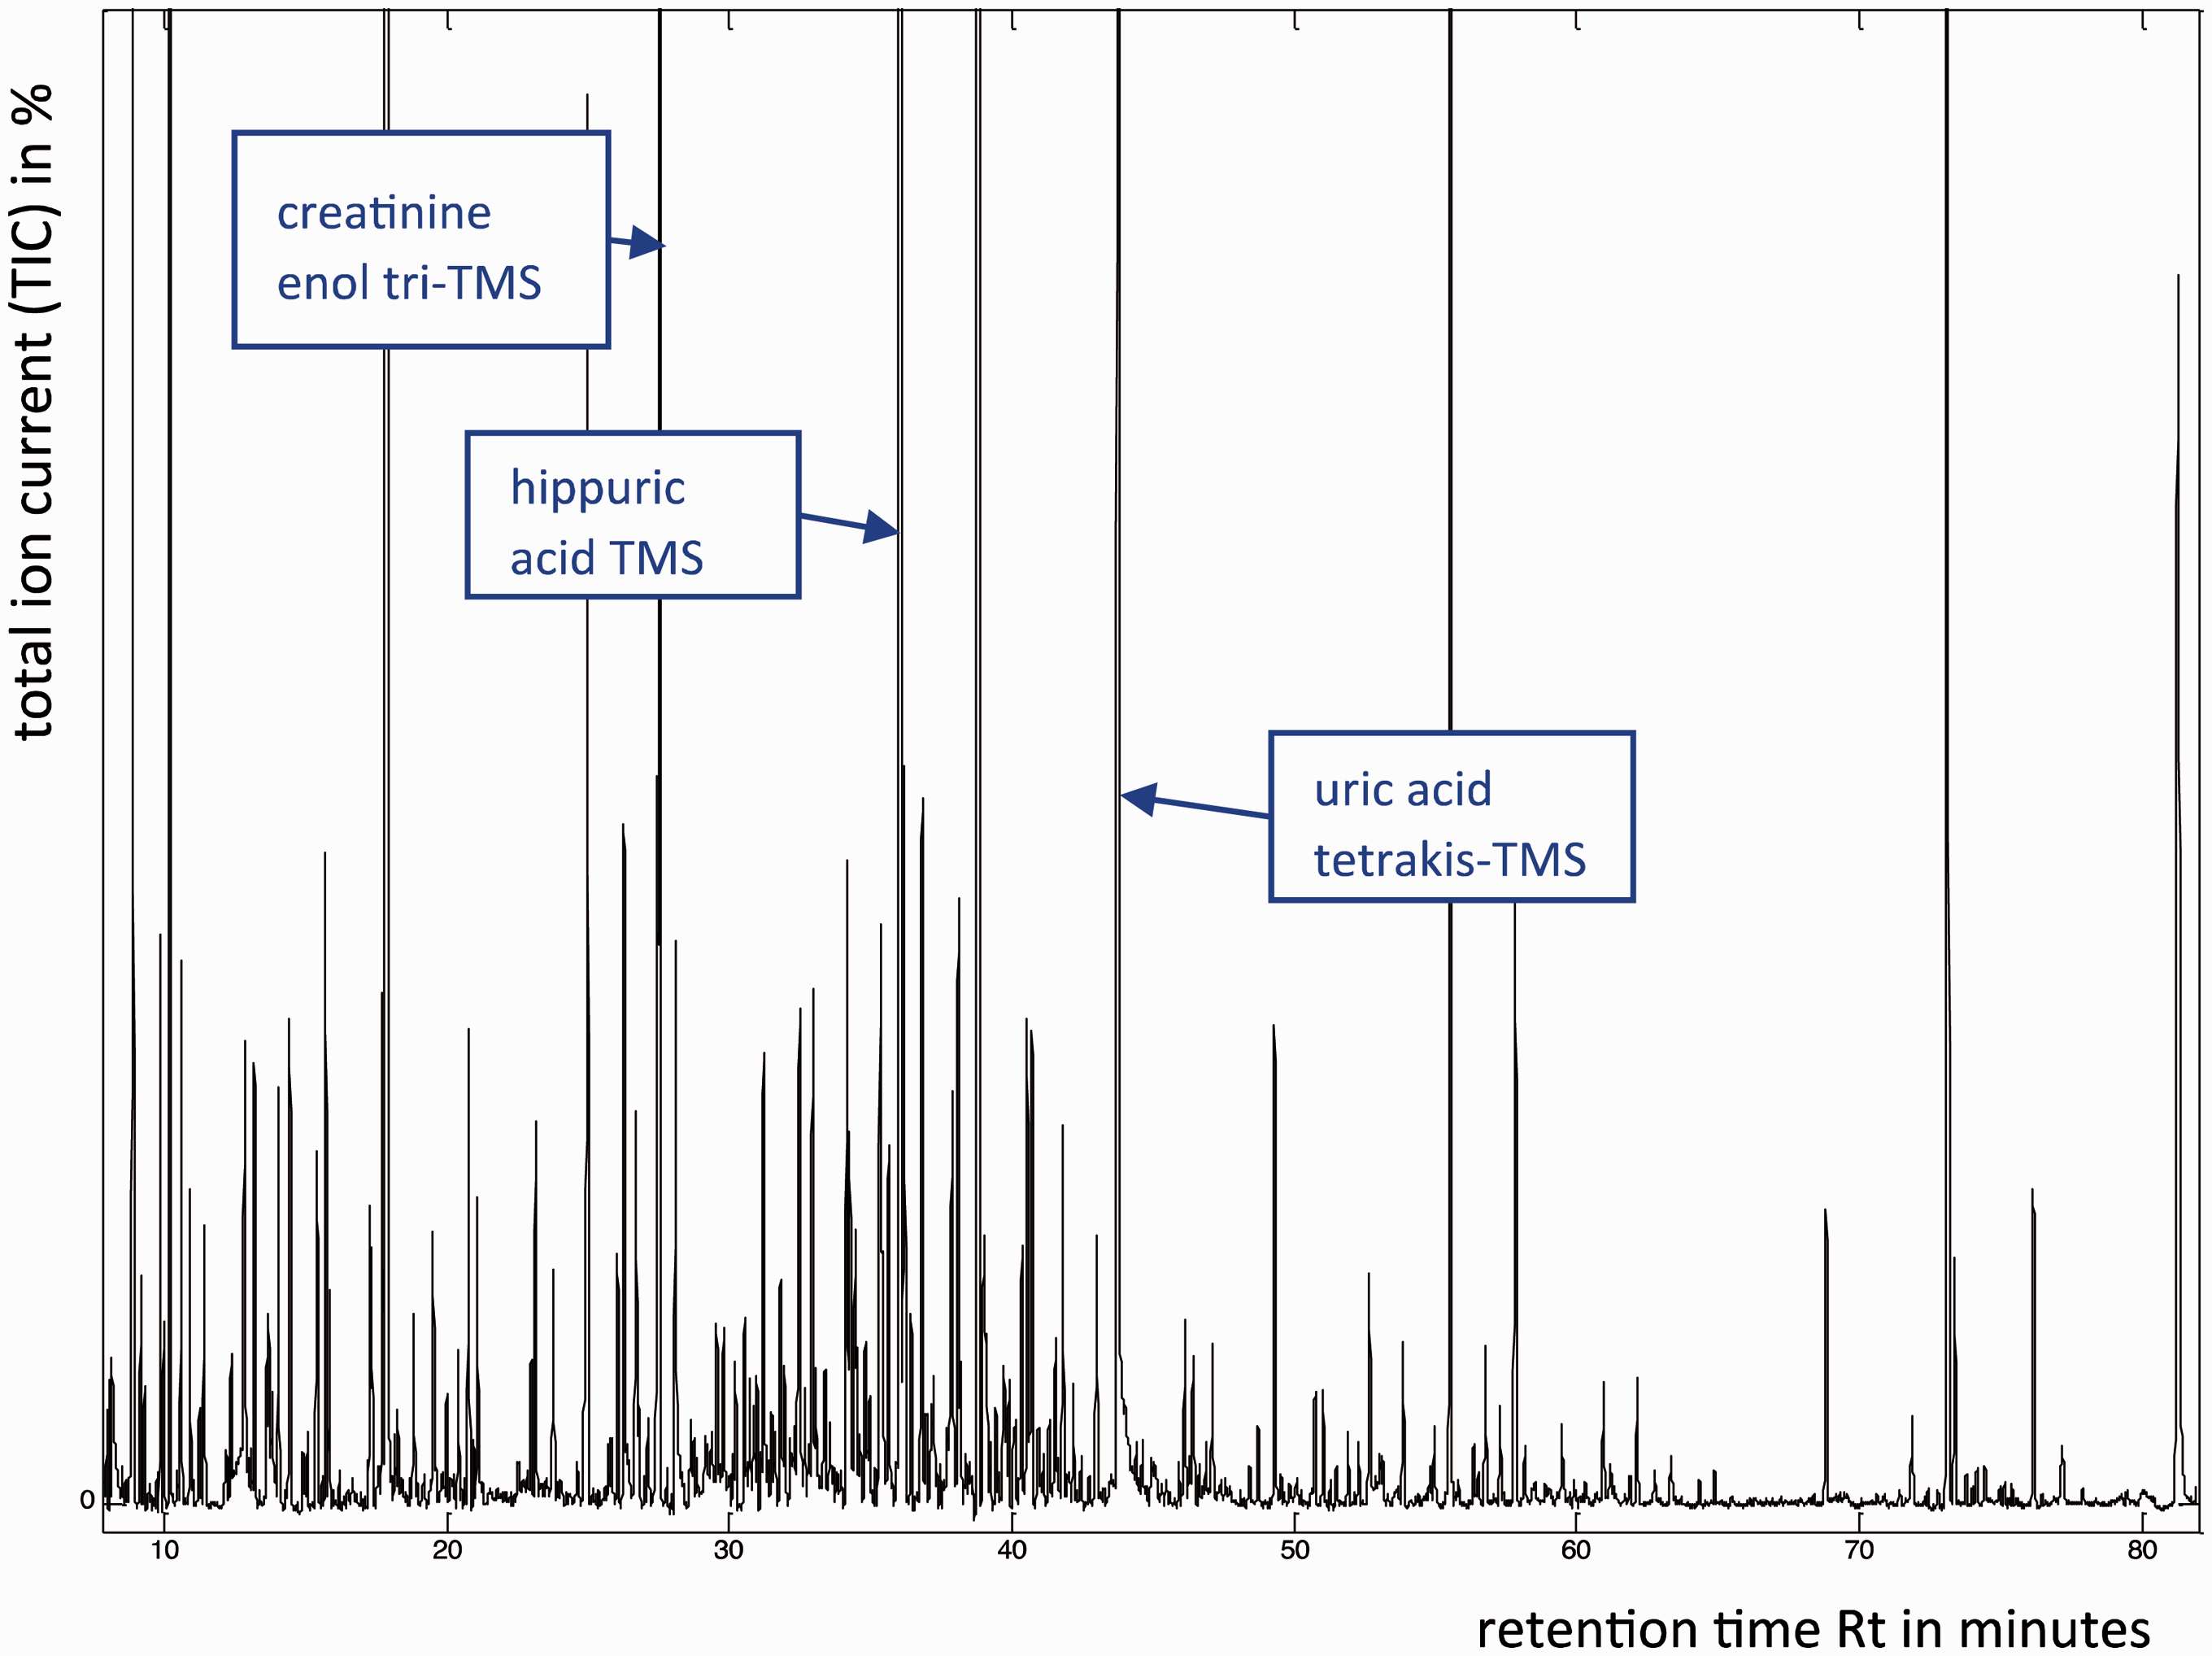
Liquid chromatography-mass spectrometry (LC-MS) uses reverse phase liquid chromatography to separate the metabolites in a biofluid sample, in combination with electrospray or atmospheric pressure chemical ionization (APCI) ionization MS to provide structural identification. Both ionization techniques are ‘soft’ in nature and, unlike EI, the predominant ion observed in the resulting spectrum is the protonated molecular ion (MH+) in positive ion mode and the hydrogen-abstracted molecular ion (M-H−) in negative ion mode. LC-MS enables the separation and detection of polar, non-volatile metabolites without the need for derivatisation. The main limitation of LC-MS arises from the poor resolution of liquid chromatography compared to GC. However, with the recent development of UPLC, chromatographic resolution has been significantly enhanced (Figure 3).
LC-MS trace of a human urine sample acquired using UPLC separation with electrospray ionization and detection. The mass spectrum of the component eluting at 1.26 minutes is inset confirming its identity as phenylacetylglutamine (molecular formula C13H16N2O4), as it shows a protonated molecular ion at m/z 265. The molecular structure of phenylacetylglutamine (also inset) was downloaded from ChemSpider on 18 January 2013: http://www.chemspider.com/Chemical-Structure.270643.html.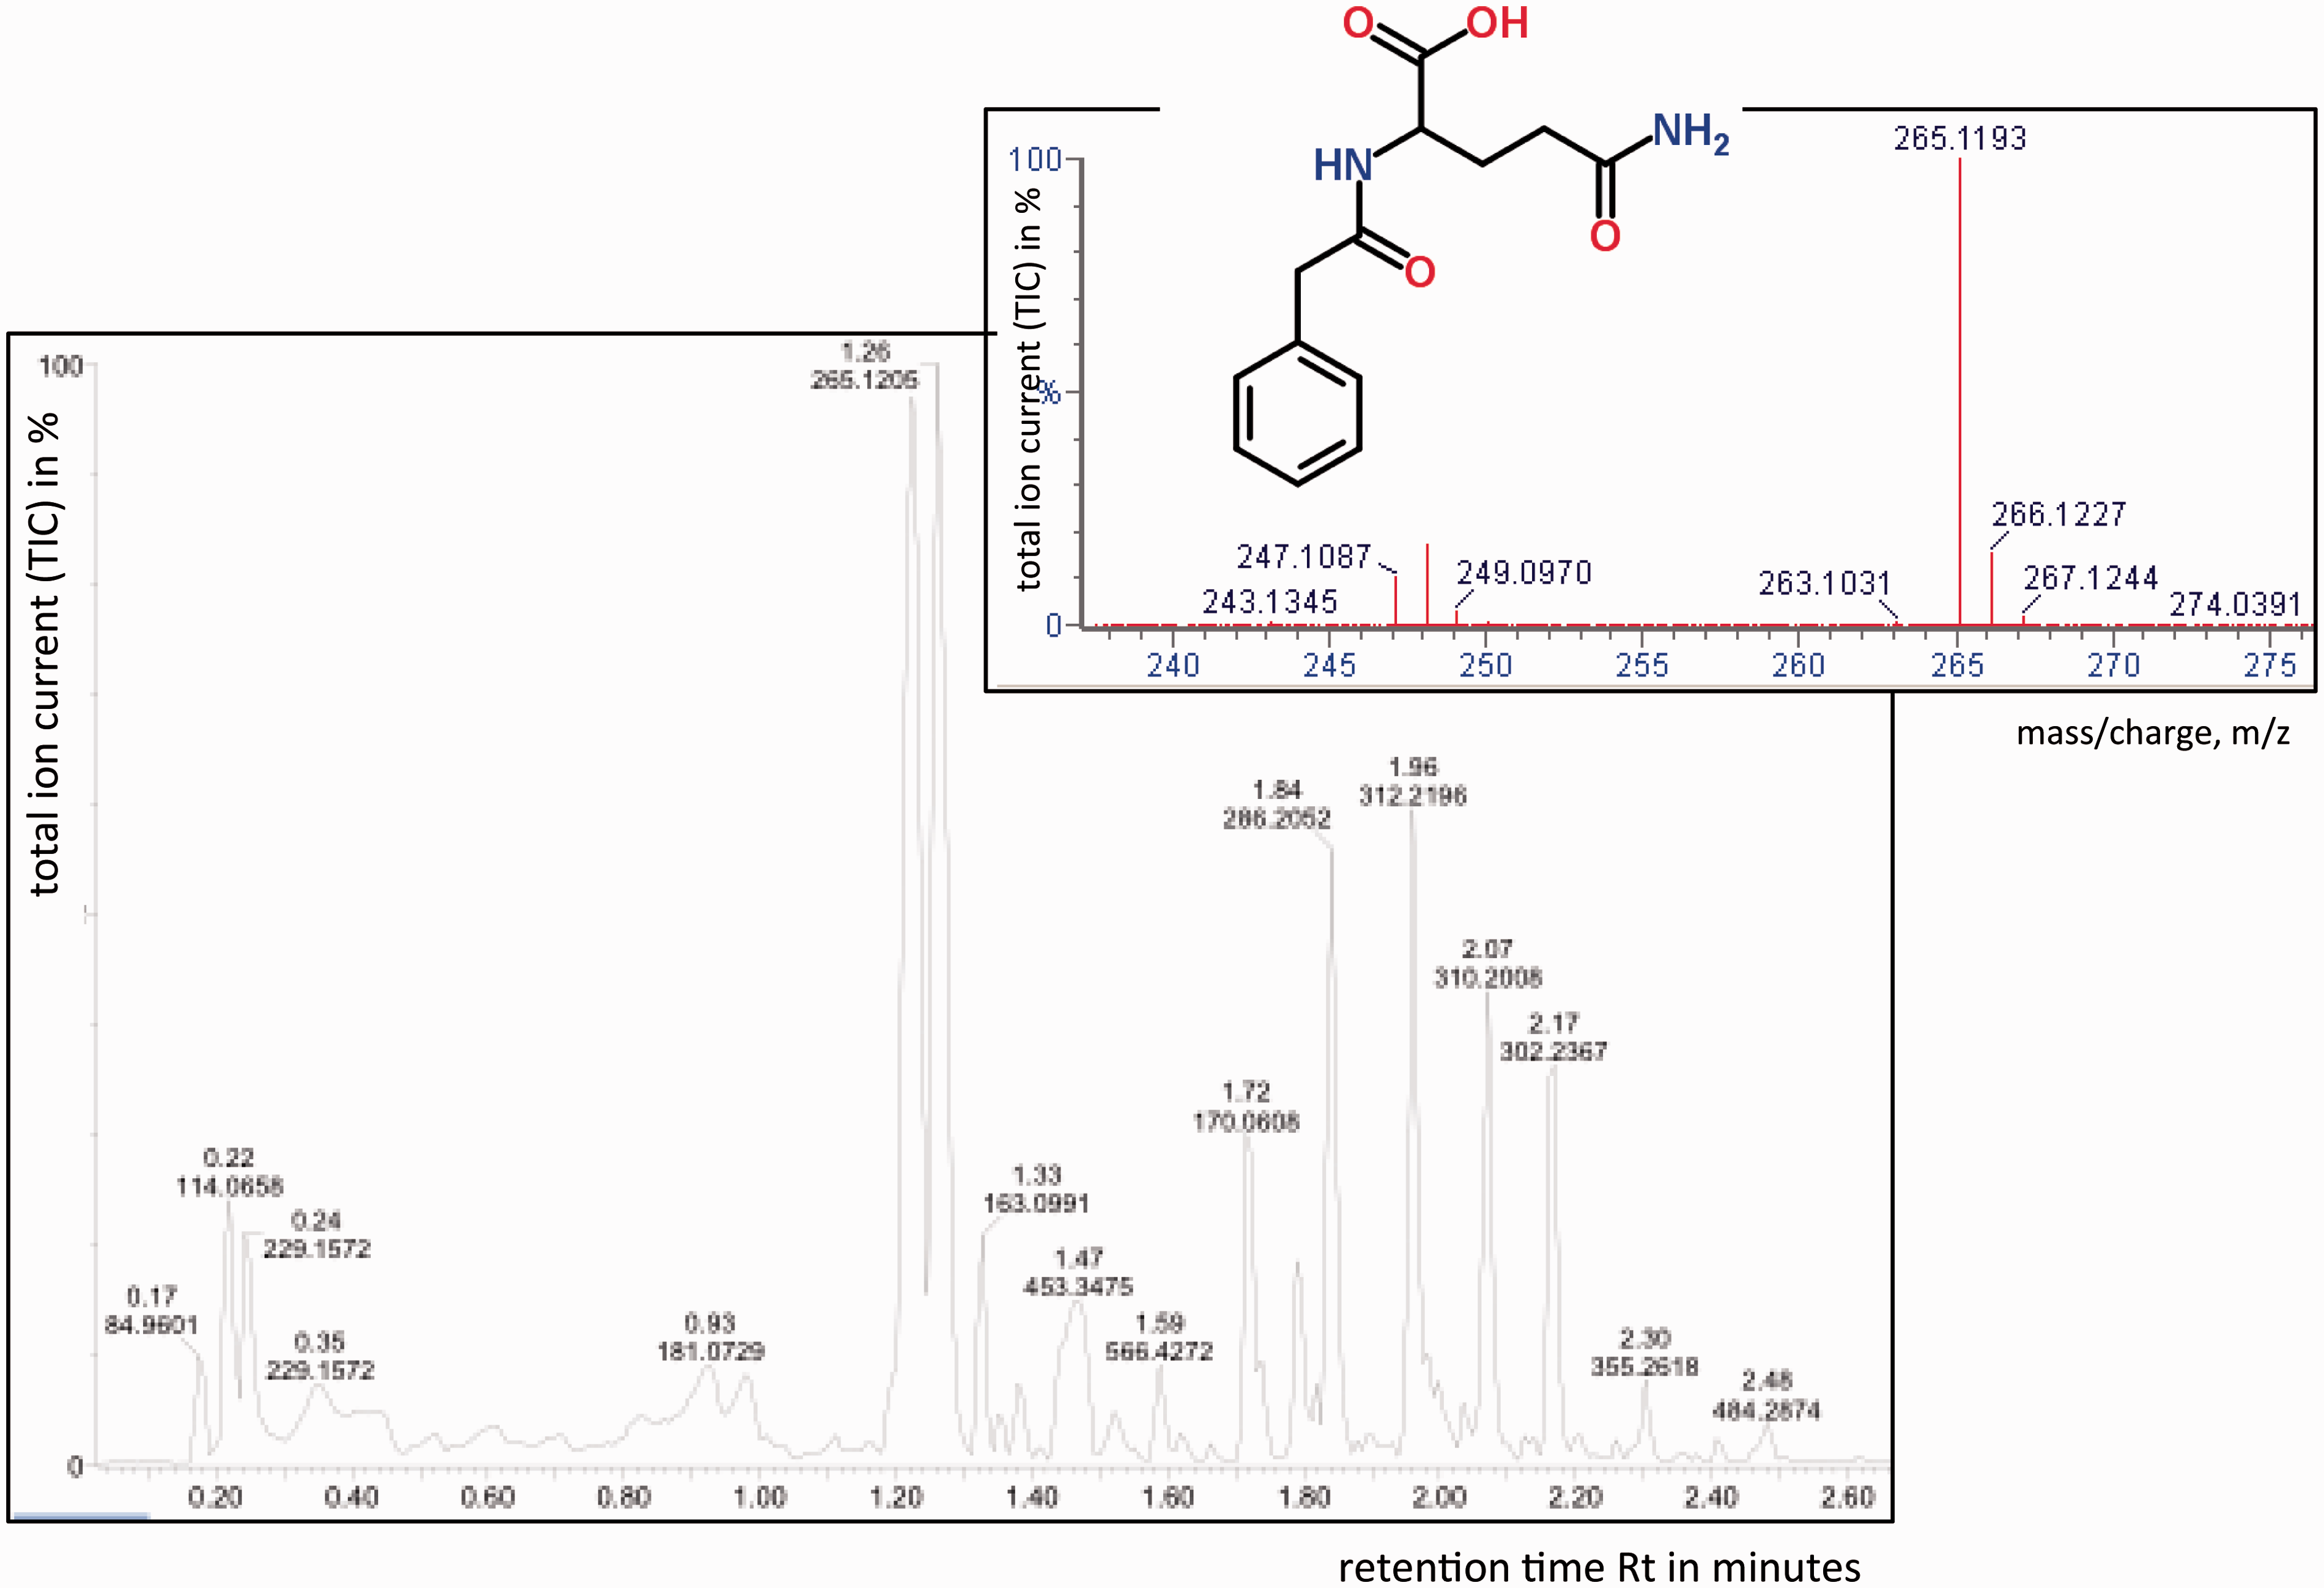
More recently, a new range of atmospheric pressure ionization techniques has been developed which can be grouped into a family called ‘ambient ionization techniques’, including Direct Analysis in Real Time (DART) and atmospheric pressure photo-ionization (APPI). These ambient ionization techniques are showing great promise in the analysis of biofluid and tissue samples, as they do not require any separative technique or any sample preparation. 41
Statistical analysis of metabonomic data
Metabonomic spectroscopic data are often analysed using multivariate statistical projection methods. Unsupervised techniques (i.e. the class information of the samples is unknown) are routinely used to reveal the similarities and differences in the metabolic features of samples. Two of the more commonly applied techniques are principal component analysis (PCA) and hierarchical clustering analysis (HCA).
42
Supervised techniques (i.e. the class information of the samples is known) are employed to determine the metabolic features that are responsible for the classifications. The classification can be categorical (e.g. disease versus healthy), in which case projection to latent structures (PLS)/partial least squares discriminant analysis (PLS-DA) can be carried out. When the response of an organism is quantitative (e.g. blood pressure level), PLS regression analysis can be performed.
42
Orthogonal PLS (OPLS) is an extension of the PLS method with a built-in orthogonal signal correction filter
43
. This simplifies the interpretation of PLS models as uncorrelated variations are removed. Typically, after multivariate modelling, the output of the analysis is summarized in plots that can be visualized and interpreted easily. In PCA, mathematical processes are used to transform the original, observed variables, e.g. NMR signal intensities, into a set of linearly uncorrelated variables called principal components. The first principal component (PC1) explains the most variance in the data: each succeeding principal component, i.e. PC2, PC3, etc. is orthogonal to each other and explains successively less of the variance. The PCA scores plot shows the patterns or relationships between different samples across two or more principal components, whilst the loadings plot explains the contribution of individual spectroscopic variables (e.g. NMR signal data) to the separations observed. In PLS, there are several ways to interpret the influence of spectroscopic or response variables. The regression coefficients plot is used commonly and an example of a regression coefficients plot is shown (Figure 4).
Orthogonal partial least squares discriminant analysis (OPLS-DA) regression coefficient plot related to the discrimination between human ibuprofen users and non-users. The metabolites projecting above the baseline correspond to drug metabolites present in the urines of ibuprofen users, whereas the metabolites projecting below the baseline correspond to those endogenous metabolites present at higher levels in the urines of non-ibuprofen users. The colour bar corresponds to the weight of the corresponding variables discriminating between the groups. The OPLS-DA regression coefficient plot shows that the differentiation between the two groups primarily results from the presence of ibuprofen and its related metabolites (highlighted in red). By multiplying the regression coefficients by their respective standard deviation before plotting each variable, the plot preserves the appearance of a 1H NMR spectrum and is thus immediately interpretable by an NMR spectroscopist.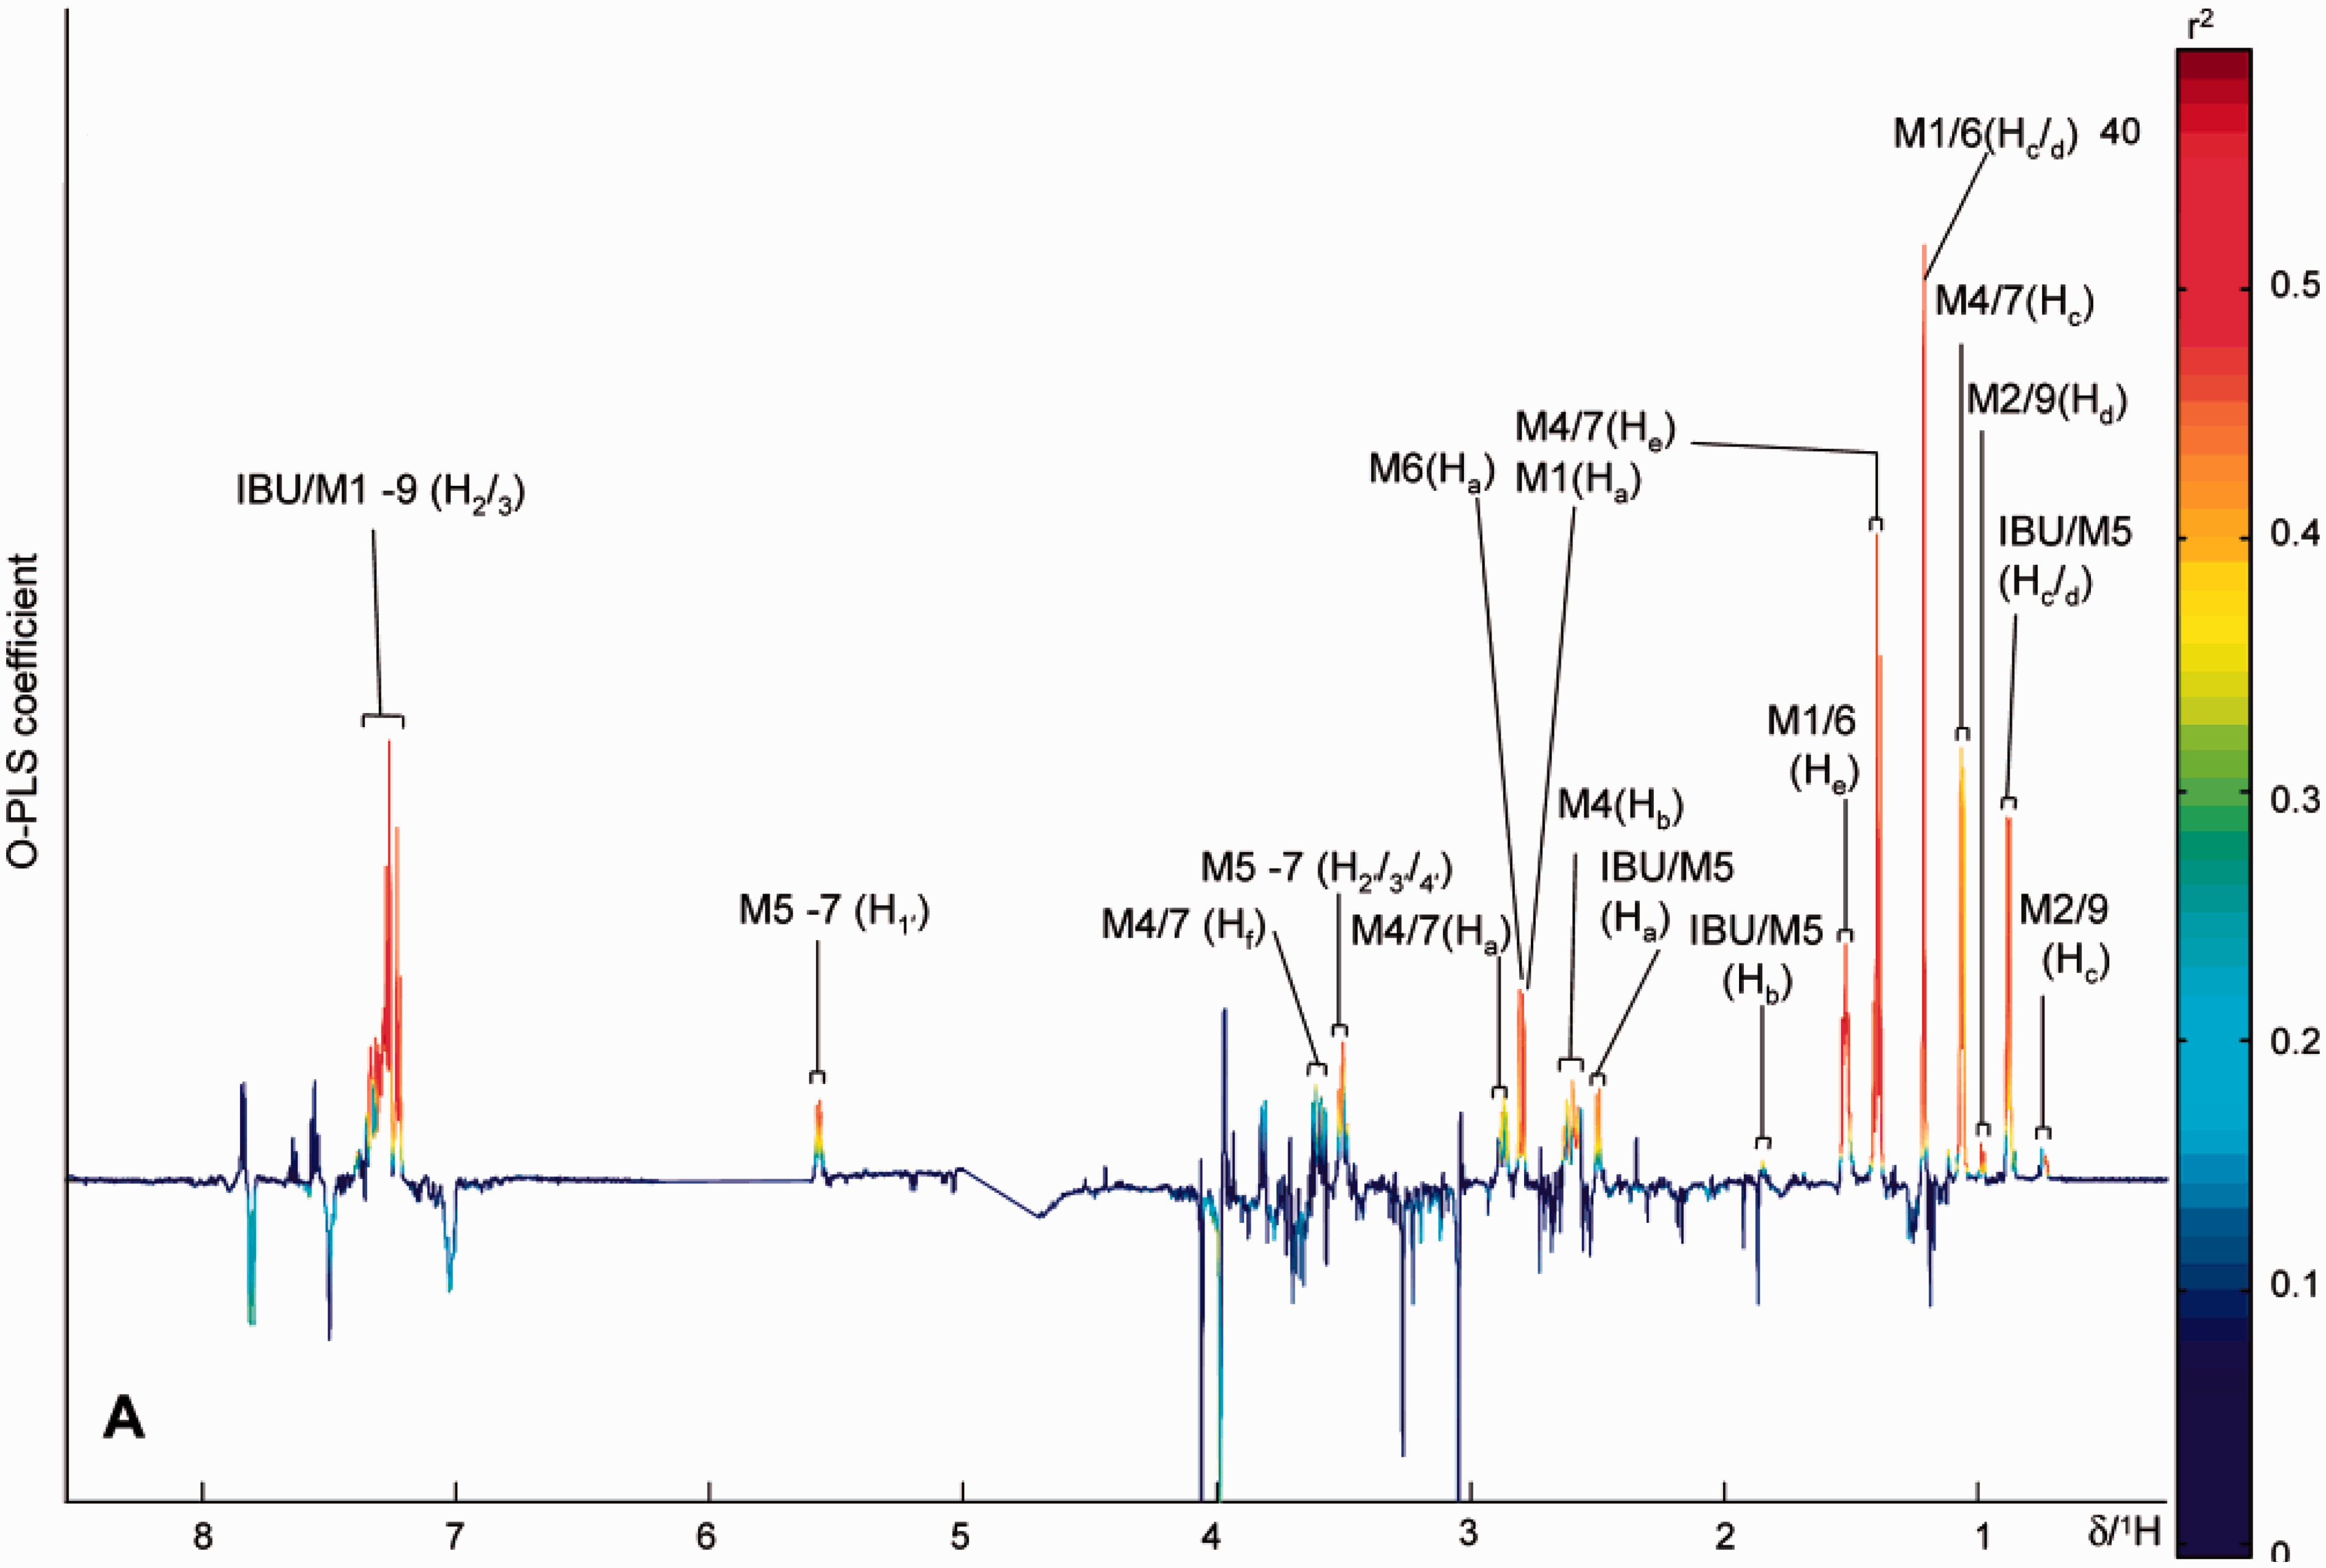
For supervised methods, it is possible to over-fit the data and therefore it is important to validate the results. A number of different approaches have been used. Some use n-fold cross-validation, where n samples are iteratively left out to construct the model until all samples have been used once. Alternatively, a statistical model can be constructed using a subset of the data (training set), and this training set can then be tested with an independent data-set (test set) to confirm the validity of the model.
The origin of pharmacometabonomics
The new discipline of pharmacometabonomics arose in the course of the collaboration between Pfizer R & D, UK and Imperial College. For some time, going back to the 1980s, unexplained results had been obtained in preclinical metabonomic studies. Typically, these would involve markedly different responses to drug treatments in subgroups of animals. At a Pfizer/Imperial College metabonomics group meeting in Amboise, France on 18 October 2000, the issue of inconsistent results amongst subgroups of animals dosed identically with isoniazid and/or galactosamine had arisen again. The hypothesis was proposed that the differences in postdose outcomes might be linked to predose differences between subgroups of animals and that these differences might be reflected in their predose biofluid profiles (JR Everett, JK Nicholson, J Lindon, C Charuel and TA Clayton, personal communication, 2000). This was a radical proposal considering that the animals were gender-, age- and weight-matched and treated in exactly the same fashion. A set of experiments were designed that culminated in a definitive study of the metabolism and toxicity of paracetamol in rats in 2003, in order to test whether postdose drug metabolism and safety outcomes were related to predose metabolic profile differences: they were and this was the birth of pharmacometabonomics. 11 Pharmacometabonomics was defined as the ‘prediction of the outcome (for example, efficacy or toxicity) of a drug or xenobiotic intervention in an individual based on a mathematical model of preintervention metabolite signatures’. 11 Pharmacometabonomics is thus related to both pharmacoproteomics and PGx2,3,5,6 which are concerned with the influence of individual genomes and proteomes, respectively, on drug efficacy and safety.
Preclinical pharmacometabonomics
The origin of preclinical pharmacometabonomics
The first published demonstration of pharmacometabonomics came in a preclinical study of the effects of paracetamol administration in a group of 75 Sprague-Dawley rats.
11
The aim of the study was to determine if the analysis of predose biofluid profiles could be used to predict postdose histopathology and the metabolism of paracetamol (Figure 5).
The molecular structure of paracetamol and its main metabolites observed in urine.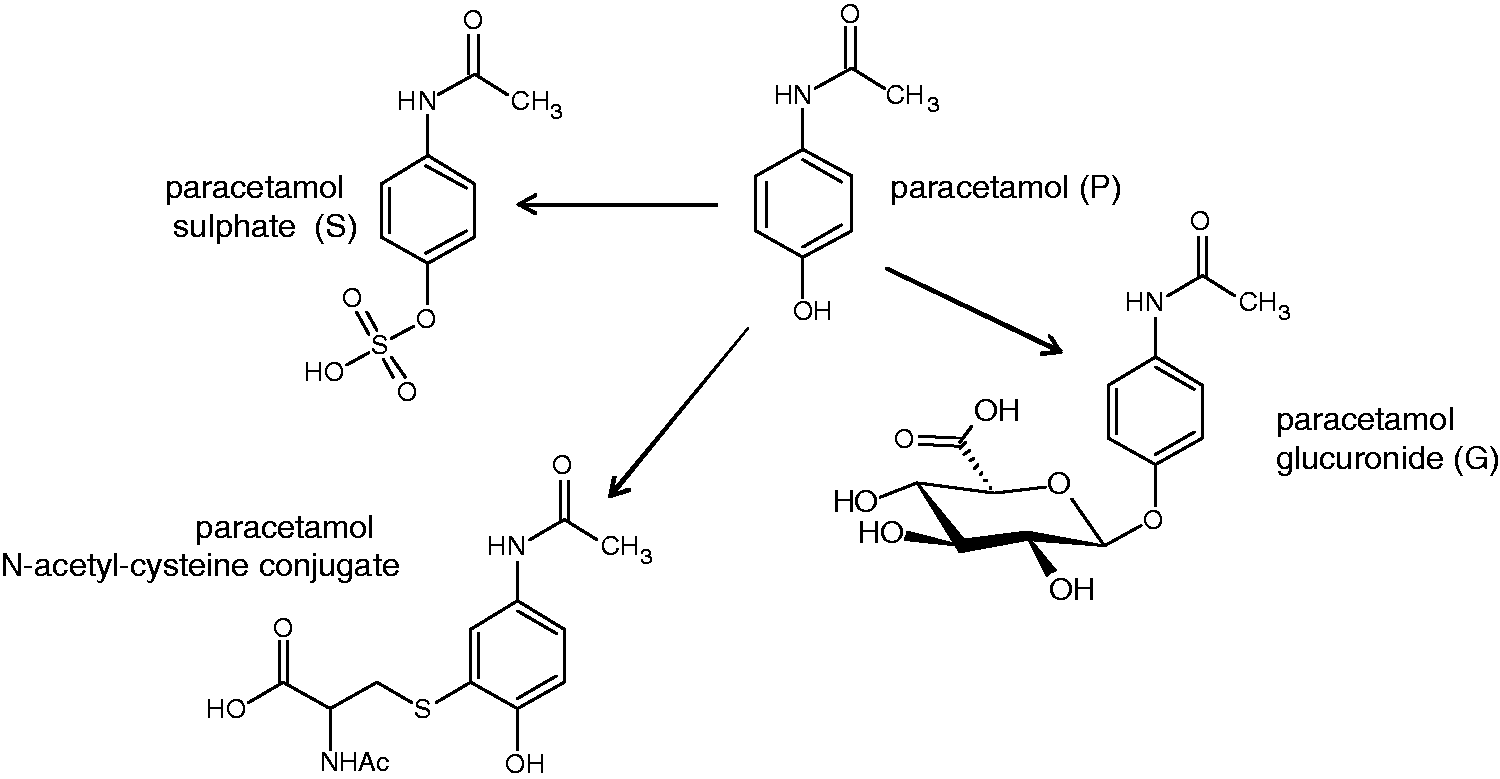
In order to achieve this aim, the variations in postdose pathology and drug metabolism were modelled against the multivariate, endogenous metabolite profiles of the predose rat urines. Histopathology scores from 10 liver samples across the five lobes were averaged to give a mean histopathology score (MHS). Principal components analysis (PCA, see the section on Statistical analysis of metabonomic data)21,42 of the predose urine samples revealed a partial separation between histology classes 1 and 3 along the second principal component, PC2 (Figure 6(a)).
Predose urinary discrimination of postdose histopathology in rats dosed orally with paracetamol at 600 mg/kg, (a) A scores plot of a principle component analysis (PCA) of the multivariate predose NMR data. Each diamond represents a different animal, colour-coded by postdose histopathology classification: Class 1 (no or minimal necrosis) is green; Class 2 (mild necrosis) is blue and Class 3 (moderate necrosis) is red. There is a partial separation across PC2 between histology classes 1 and 3. (b) A plot of MHS postdose against the predose PC2 score from Figure 6(a). A weak but significant correlation is observed. (c) A scores plot of a PCA with the same colour coding as above for the animals in histopathology classes 1 and 3 only. (d) A loadings plot corresponding to the PCA in Figure 6(c), showing the variables in the predose NMR spectra that most influenced the differentiation of the animals’ predose urine scores across PC2, and the direction of that influence. Variables are listed by the mid-point of the chemical shift range of the spectral region they represent or by their names: Tau, taurine; Citr, citrate; Oxog, 2-ketoglutarate; TMAO + Bet, trimethylamine-N-oxide (TMAO) and betaine. Figure reproduced from Nature Publishing Group.
11
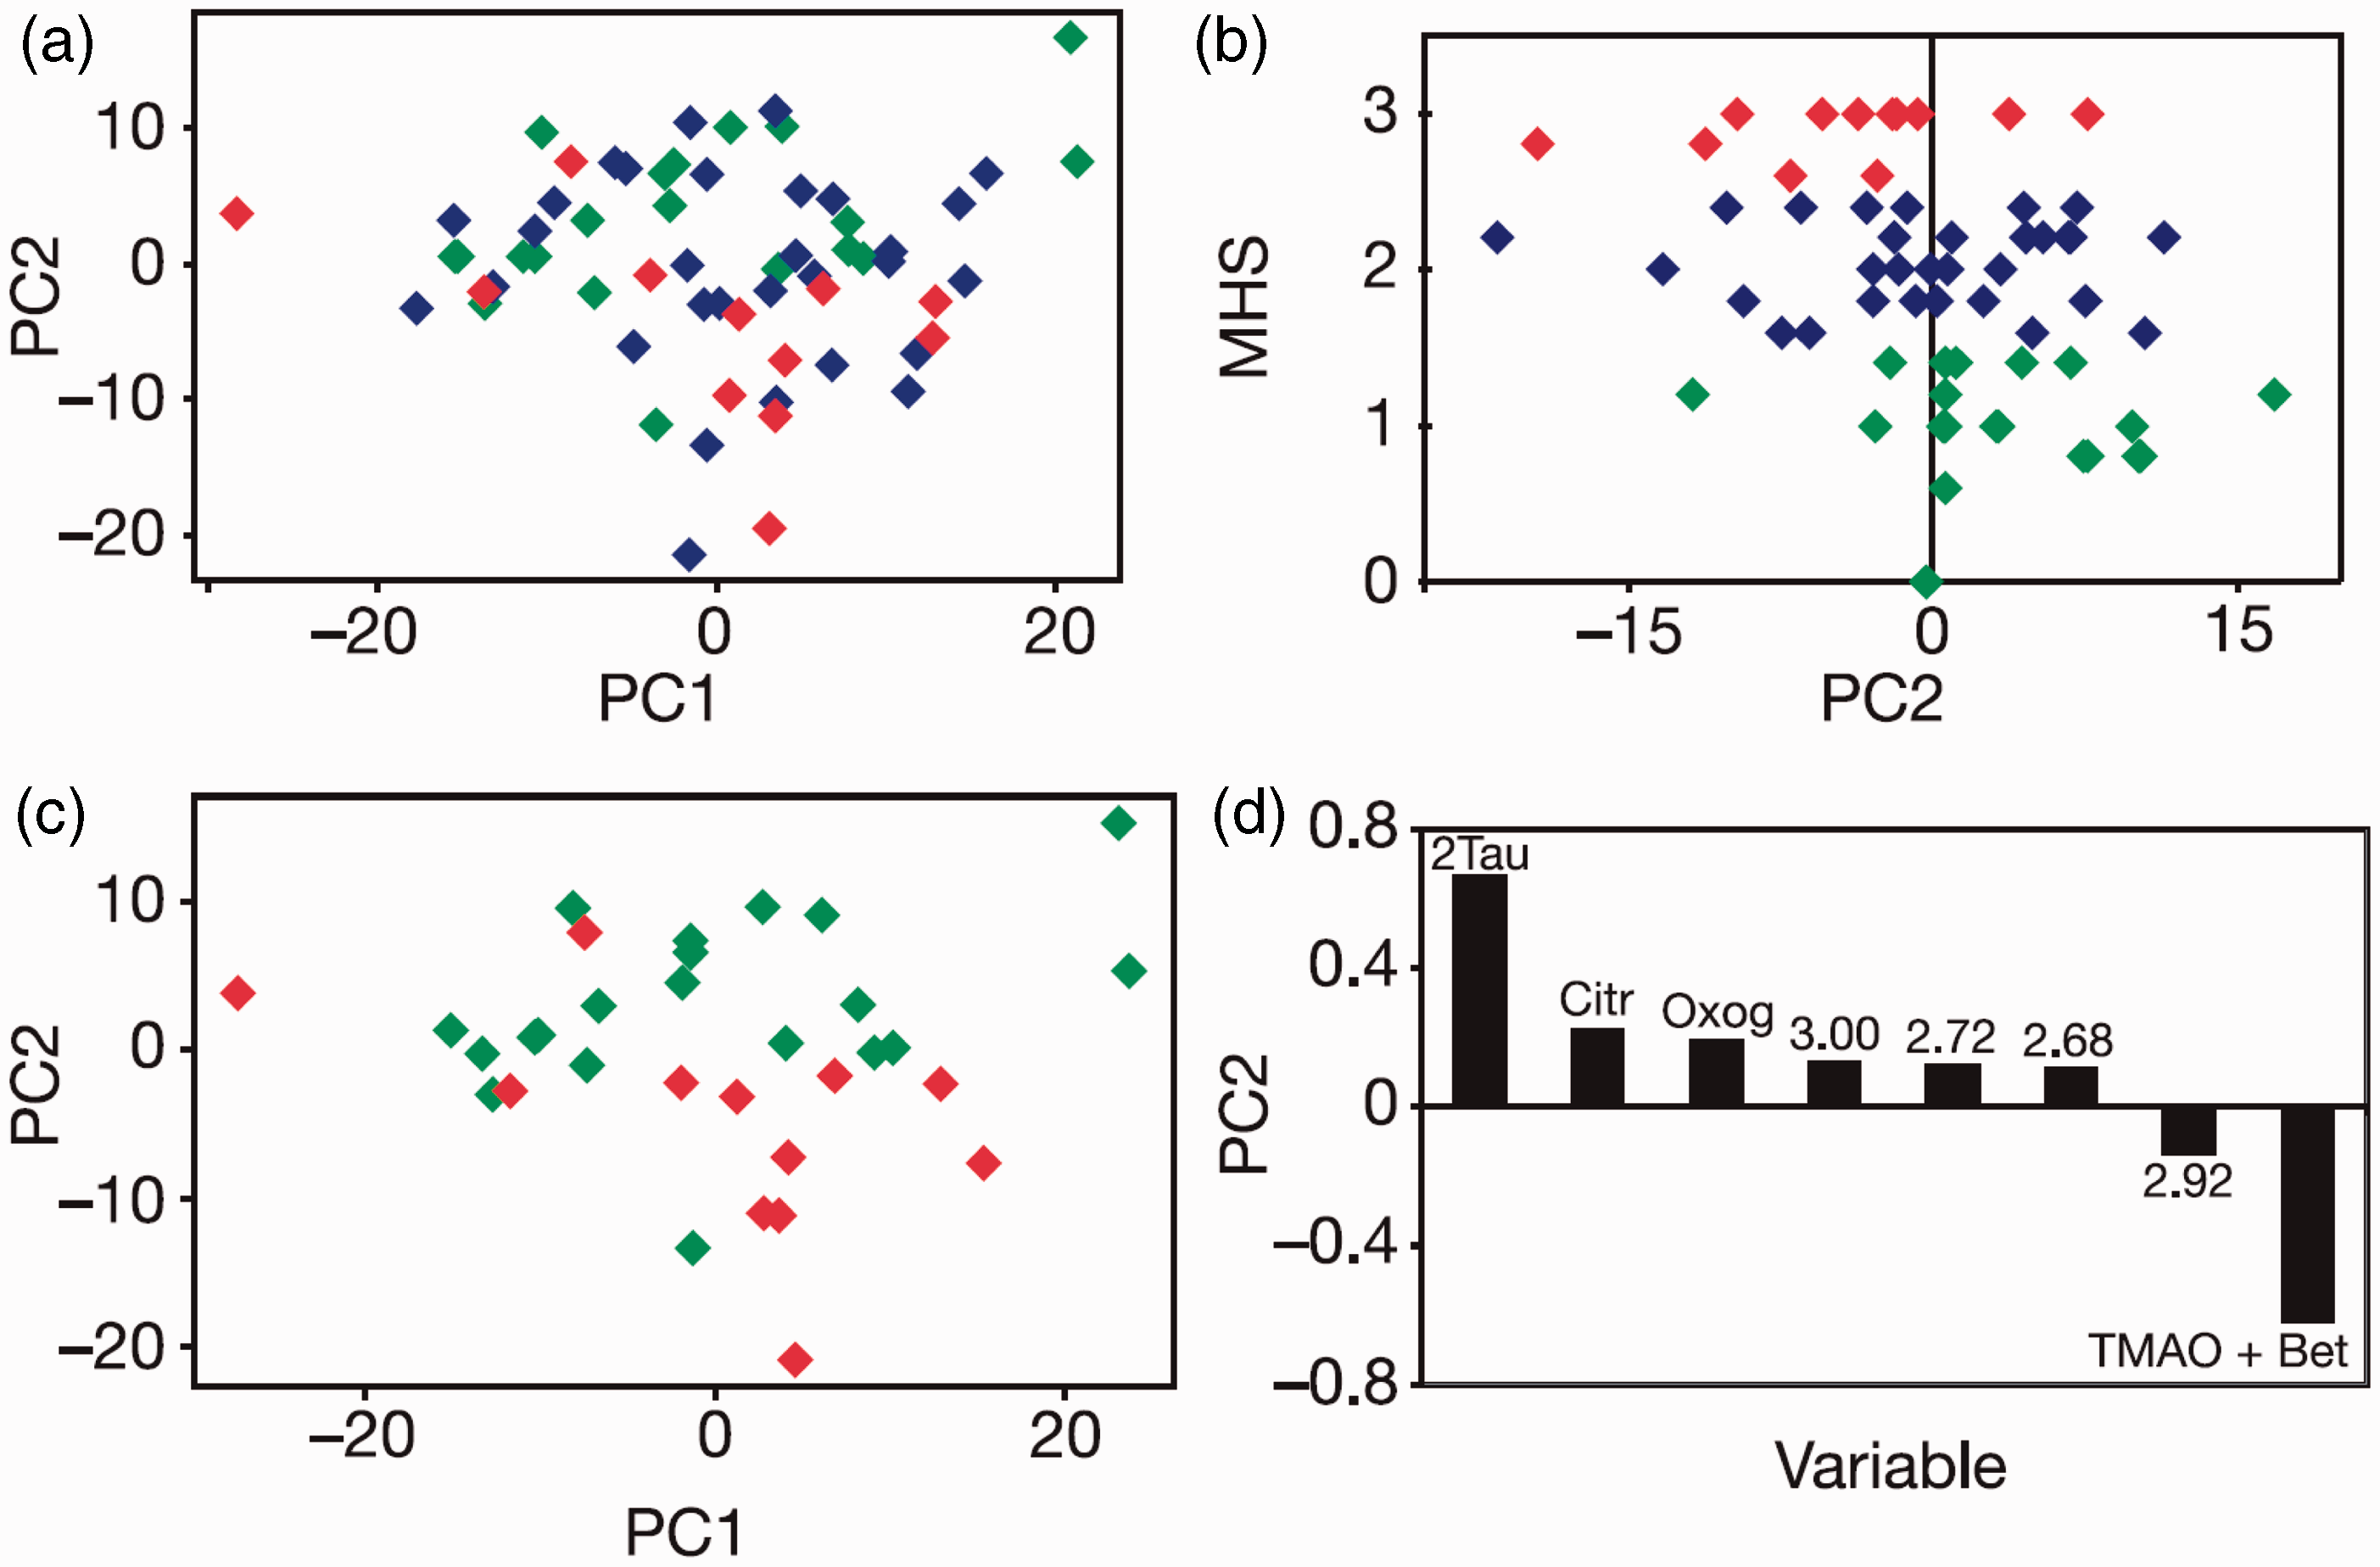
A weak but statistically significant correlation was found between the MHS and the PC2 scores (Figure 6(b), r = −0.34, p = 0.007). PCA of the predose urines only from subjects in classes 1 and 3 also showed a partial separation on PC2 (Figure 6(c)) that was statistically significant (Mann–Whitney U-test, p = 0.002). 11 From the loadings plot (Figure 6(d)), the most significant predose variables giving rise to the separation of postdose histopathology classes 1 and 3 were taurine (2-aminoethane sulphonic acid) and trimethylamine-N-oxide (TMAO) and betaine. A higher level of taurine in the predose urine was associated with a lower degree of histopathology postdosing, which may be due to either (i) a known protective effect of taurine to mitigate paracetamol liver damage45–47 or (ii) the availability of inorganic sulphate (metabolically linked to taurine), which in turn influences the production of phosphoadenosinephosphosulphate (PAPS), 48 the paracetamol sulphating agent. The association between higher predose concentrations of TMAO and increased histopathology may indicate an influence of the gut microbiome on the extent of liver damage. These results demonstrated for the first time that predose biofluid metabolite profiles could provide a degree of prediction of post-dose pathology in an animal. 11
The mole ratio of paracetamol glucuronide metabolite to parent paracetamol drug (G/P, Figure 5) excreted in the postdose urine was also modelled against variations observed in the predose urine. A PLS model was built and subject to validation that demonstrated that it was robust. One of the most significant factors underpinning this model was a positive correlation between G/P and the integral of the predose 1H NMR spectrum between 5.06 and 5.14 ppm (r = 0.48), a region of the 1H NMR spectrum where the signal for G occurs in postdose samples and contains a number of small signals in predose urine that were attributed to endogenous ether glucuronides. It is logical that the propensity to form endogenous ether glucuronides in individuals should correlate with the propensity to form larger quantities of paracetamol glucuronide. This result represented the first demonstration of the prediction of drug metabolism based on the analysis and modelling of predose biofluid profiles. 11 On the basis of these findings, the exciting possibilities for pharmacometabonomics being used in conjunction with PGx and pharmacoproteomics were reviewed by Nebert and Vesell 49 and by Kaddurah-Daouk, Kristal and Weinshilboum. 50
Progress in pre-clinical pharmacometabonomics
Streptozotocin
A study by Li et al. 51 showed that GC-MS-based measurements of predose (baseline) urine metabolites were differentiated between diabetic-resistant (DR) and diabetic-prone (DP) Wistar rats dosed with streptozotocin. The predose urine samples of the DR rats and DP rats were differentiated using PCA and O-PLS-DA methods.
Development of obesity
A parallel experiment showed that Sprague-Dawley rats fed a high energy diet split into obesity-resistant (OR, n = 4) and obesity-prone (OP, n = 4) animals with significant differences in body weight after as little as one week. Again, PCA and O-PLS-DA analyses of GC-MS-based, predose urine metabolite profiles of these animals showed differences between the OP and OR animals. It was concluded that in both the diabetes and obesity experiments, the metabolites exhibiting significantly different concentrations in the predose urines were either microbially derived or involved in energy metabolism pathways.
Platinum chemotherapy
Kuen et al. 52 conducted a retrospective analysis of published transcriptomic and metabonomic measurements on the NCI60 tumour-derived cell line panel to show that metabolic phenotyping could be useful in predicting response to platinum chemotherapy. A positive correlation was observed between platinum chemosensitivity and the following factors: increased glucose uptake and glycolysis to lactate (the Warburg effect), increased glutaminolysis and increased fatty acid and lipid metabolism.
Cisplatin
Kwon et al. conducted a study on the nephrotoxicity of cisplatin in male Sprague-Dawley rats, which showed differences in response between different subgroups of animals. 53 In the pharmacometabonomic arm of the study, it was found that predose concentrations of allantoin, creatinine and succinate were higher in the subgroup resistant to nephrotoxicity, whilst 2-oxoglutarate was at a higher level in the group that was susceptible to nephrotoxicity. A leave-one-out analysis showed that the accuracy of predicting toxicity was 66%.
Isoniazid
One of the original pharmacometabonomic studies conducted on isoniazid by the Pfizer-Imperial College group in 2000 has just been published.
32
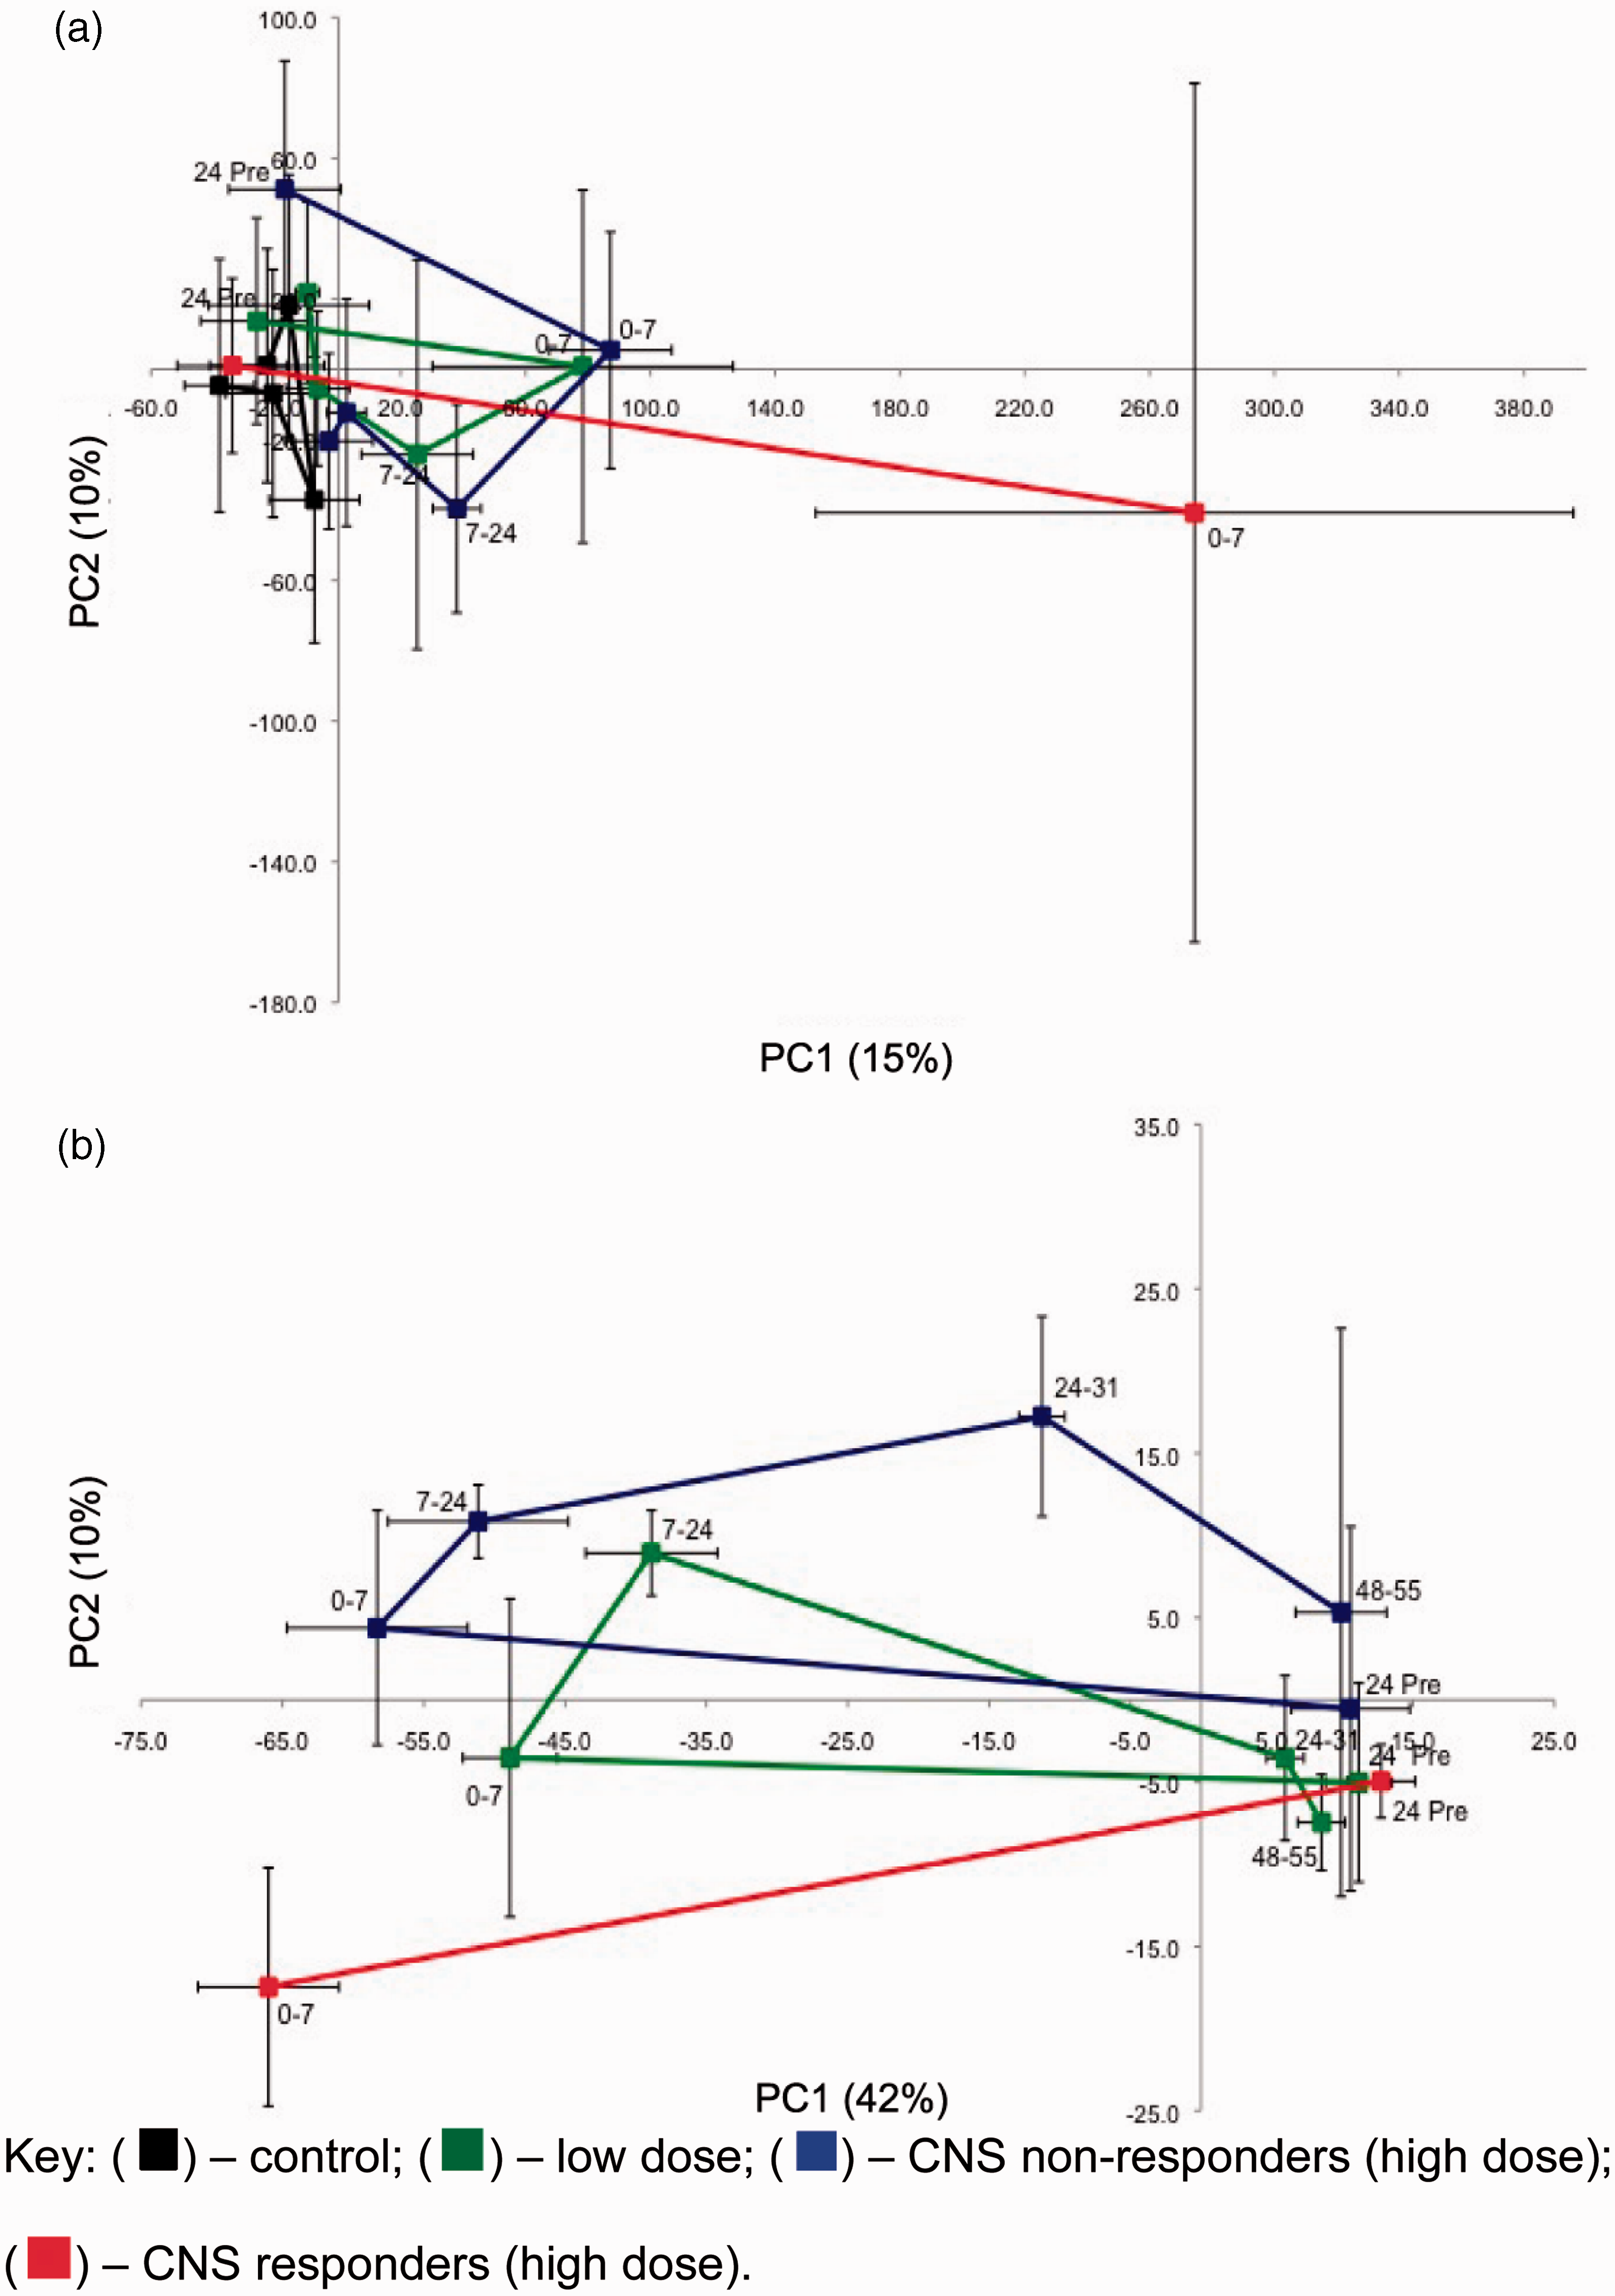
Sprague-Dawley rats were administered saline or isoniazid (at high dose, HD and low dose, LD) and monitored using 1H NMR analysis of predose and postdose urine, clinical chemistry and histopathology. The 1H NMR spectrum in Figure 1 is taken from this study. In the classical metabonomics part of the study, PCA demonstrated differential endogenous metabolite trajectories between the control, low-dose and high-dose animal groups (Figure 7(a)). However, in addition, there was a clear split between subgroups of the HD animals which were classified as CNS responders or CNS non-responders on the basis of clinical observations of adverse CNS effects. A similar distinction was observed between the xenobiotic metabolic trajectories of the low-dose, high-dose CNS responder and high-dose CNS non-responder animals (Figure 7(b)).
Metabonomics of isoniazid in the rat. (a) PC2 versus PC1 scores trajectory plots from a principle component analysis (PCA) of the urinary 1H NMR data for rats dosed with isoniazid. Each point represents mean values (with standard deviation error bars) for the control, low dose and high dose cohorts across a time trajectory from −24 h predose to 55 h postdose. (a) endogenous metabolite data-set and (b) xenobiotic metabolite data-set. The high-dose cohort split into CNS responders and CNS non-responders. No late time point samples are available from the high-dose responder cohort (red points and lines). Reprinted with permission from Journal of Proteome Research. Copyright 2012 American Chemical Society.
32
In the pharmacometabonomic arm of the study, a cross-validated O-PLS-DA model showed a clear separation between the high dose isoniazid CNS responders and non-responders, with elevations of peaks at 5.11 and 6.72 ppm, due to a 1,2,4-trisubstituted phenolic ether glucuronide, in the predose urine of the CNS responders (Figure 8).
The orthogonal partial least squares discriminant analysis (O-PLS-DA) pairwise model of predose rat urine 1H NMR spectra comparing high dose isoniazid CNS responders (n = 4) with CNS non-responders (n = 5: one animal excluded due to abnormal metabolic response).
32
(a) O-PLS-DA scores plot showing cross-validated scores for class: 1 = CNS responders, red and 0 = non-responders, blue; (b) and (d) Portions of the O-PLS-DA loadings plot showing NMR spectral regions responsible for the discrimination between the CNS responders and non-responders. The spectral colour scale represents the correlation coefficient of the variables: see the scale on the right hand side. Positive signals in these plots represent metabolites that are elevated in the predose urine of CNS responders; (c) and (e) Predose urine 1H NMR spectra from the high dose animals in those same regions, colour coded for postdose CNS response: red, CNS responders; blue, CNS non-responders; (f) and (g) corresponding predose 1H NMR spectra of the urine samples from the low dose animals colour coded according to their postdose concentrations of acetylisoniazid (AcINH) in their 0–7 h urine: red, AcINH integral < 3 × 10⁸, n = 3: blue AcINH integral > 3.5 × 10⁸, n = 7). NMR spectral integrals in arbitrary units (a.u.). O-PLS = DA Model statistics: predictive power Q2Y = 0.34; goodness of fit R2Y = 0.76. Reprinted with permission from Journal of Proteome Research. Copyright 2012 American Chemical Society.
32
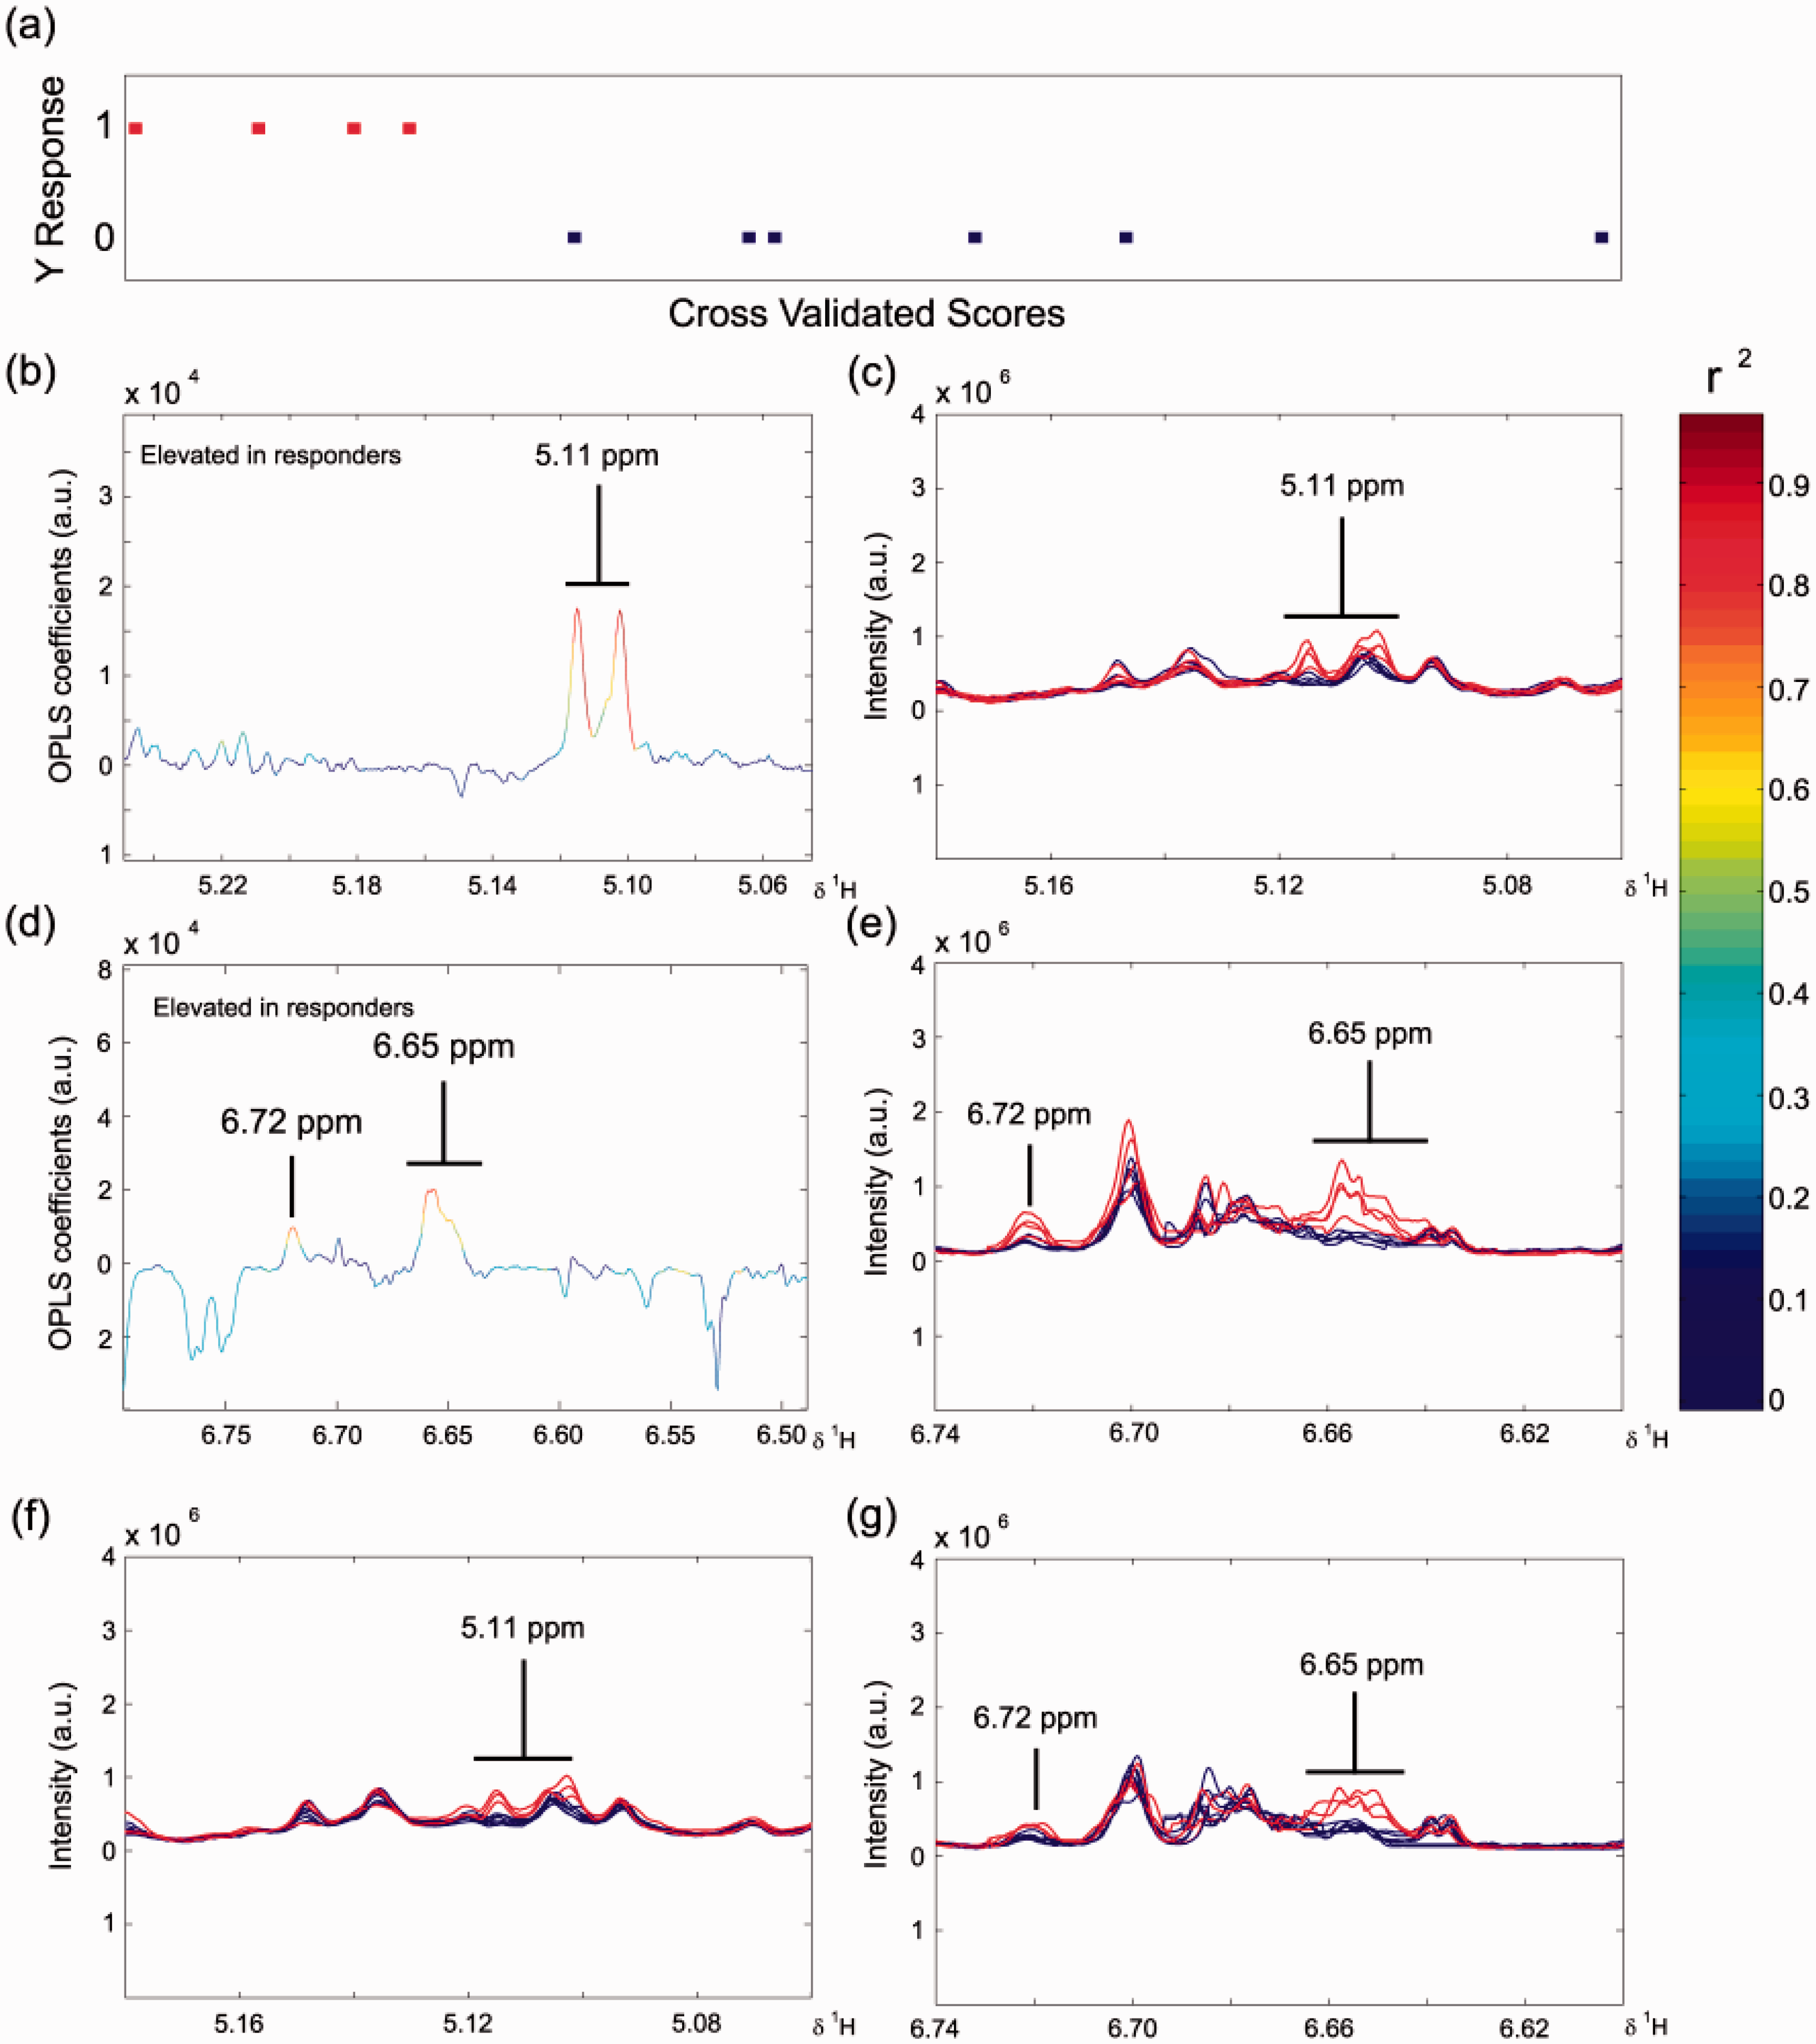
The high dose CNS responders also had relatively low concentrations of AcINH in their postdose urine samples compared to the CNS non-responders. Remarkably, even in the low dose animals, the concentrations of the signals at 5.11 and 6.72 ppm in the predose urine were negatively correlated with their postdose concentrations of AcINH metabolite excretion (Figure 8(f) and (g)). The predose metabolic signature found in this preclinical study might have utility in a clinical setting for the prediction of isoniazid CNS toxicity, which is a major issue with the drug. 32
Galactosamine
Coen et al. have just published a new 1H NMR-based pharmacometabonomic study of variability in response to galactosamine administration. 54 Male Sprague-Dawley rats were dosed either with saline or with galactosamine hydrochloride. Following this first dose on day 1, the animals were separated according to their clinical pathology results into responders and non-responders, ahead of a second dose of galactosamine on day 12. Animals were sorted into phenotypic subgroups by clinical chemistry and later by histopathology and metabonomics. The serum alanine aminotransferase (ALT) activity for galactosamine responders was significantly different from non-responders and the controls. Four primary responders and nine primary non-responders were selected for a second dose of galactosamine. The primary non-responders all now responded to galactosamine (induced responders, iR2, p < 0.01 relative to controls), but the primary responders now had a reduced response relative to the induced responders (secondary responders, R2, p < 0.1 relative to iR2) as assessed by serum ALT activity. The discrimination of response phenotypes was based on the presence of galactosamine and its metabolites in the postdose urine of responders and in the postdose faecal extracts of non-responders. Pharmacometabonomic analyses enabled discrimination of the predose urinary and faecal extract metabolic profiles of non-responders prior to dose 1 relative to induced responders prior to dose 2, but not of non-responders versus responders prior to dose 1. This is the first demonstration of differentiation between a non-responsive and an induced-responsive phenotype. The involvement of the gut microbiome in the phenotypic differences is highlighted by the finding of γ-aminobutyrate (GABA) as a discriminator between the non-responder and induced-responder phenotypes in the faecal extract analysis. GABA is synthesized from glutamate in the gut microbiome by colonic bacterial decarboxylase. 55 It was concluded that gut microbiome differences between the non-responders and induced-responders accounted for the GABA faecal extract differentiation.
Triptolide
Finally, Liu et al. 56 published a pharmacometabonomic study using GC/Time of Flight Mass Spectrometry (TOFMS) analysis of predose serum to predict the PK of triptolide 57 in Sprague Dawley rats on one of three diets: control, calorie-restricted or high fat diet. Across all three diet groups at each dose level, the predose serum concentrations of creatinine and glutamate were linearly and negatively correlation to postdose triptolide maximal concentration, Cmax and total area under the curve (AUC) in plasma. Given the safety concerns over triptolide administration, 56 prediction of PK could be very important in a personalized healthcare setting if these preclinical results are confirmed in studies in humans.
Clinical pharmacometabonomics
The origin of clinical pharmacometabonomics
The first validated demonstration of pharmacometabonomics in humans was published in 2009 as part of the Pfizer, UK – Imperial College collaboration and demonstrated the prediction of the metabolism of paracetamol. 58 We note that a report was published of a lipidomic study of 50 patients with schizophrenia in 2007 5 9 which discussed an association between predose biofluid profiles and postdose treatment outcomes. However, the authors noted many limitations of the study and concluded that the results were best treated as ‘hypotheses generating rather than as definitive conclusions’. We will therefore not consider this work further.
The ethically approved paracetamol study was conducted in the spring of 2003 in a cohort of 99 fit, healthy, males (mainly firemen from Canterbury, Kent, UK), who took a standard oral dose of paracetamol. 58 Predose, 0–3 h and 3–6 h postdose urine samples were collected and subject to analysis by 1H NMR spectroscopy.
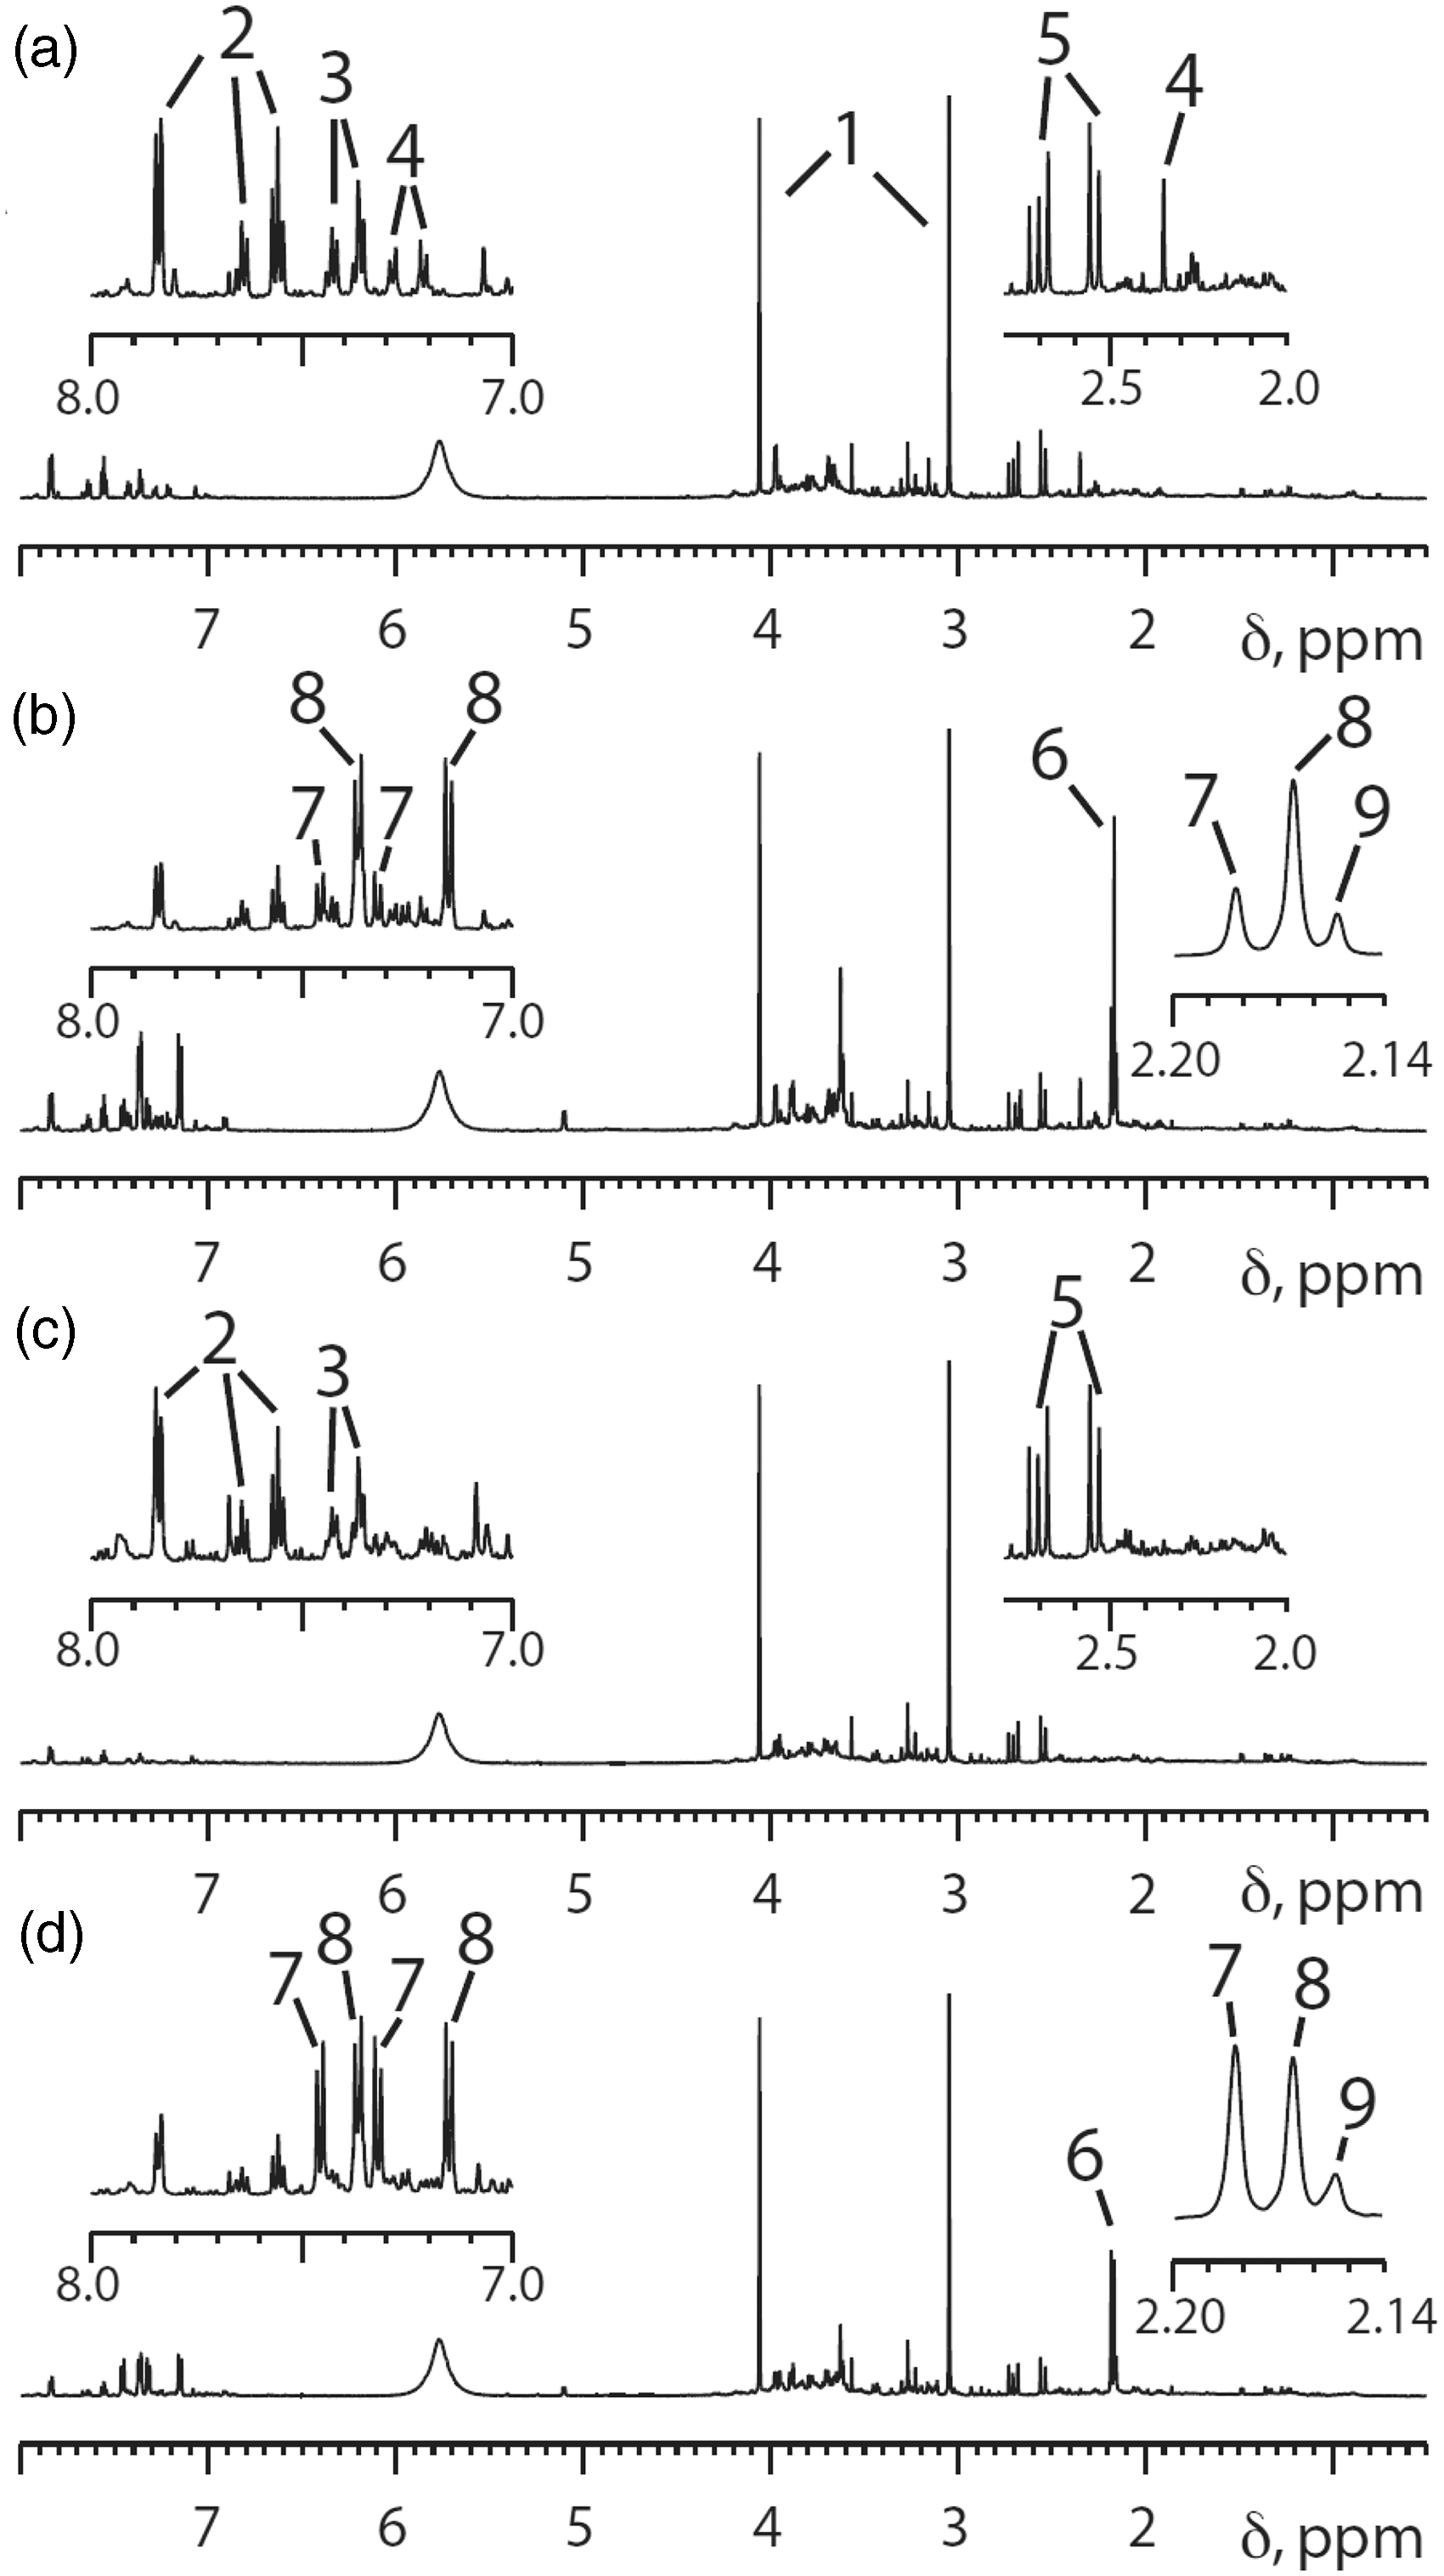
An array of sophisticated statistical and pattern recognition methods were used to analyse the 297 1H NMR spectra resulting from this study. In fact, however, the key finding is visible by eye. Figure 9 clearly shows that the volunteer who had a lower paracetamol sulphate (S) to paracetamol glucuronide (G) ratio in his postdose urine (Figure 9(b) compared with 9(d)) also had a much higher level of compound 4 in his predose urine (Figure 9(a) versus 9(c)) than the volunteer excreting a higher ratio of S/G. This finding for these two volunteers turned out to be more general (Figure 10) and so the key unknown biomarker 4 was isolated from predose urine and determined to be para-cresol sulphate (PCS).
58
Representative 600 MHz 1H NMR spectra from two human volunteers. Spectra (a) and (b): predose and 0–3 h postdose urines from a volunteer excreting a relatively low amount of paracetamol sulphate (S), peak 7, relative to paracetamol glucuronide (G), peak 8. Spectra (c) and (d): corresponding predose and 0–3 h postdose urines from a second volunteer whose excreted ratio of S/G was much higher. Note that the key difference between the predose and postdose spectra (a versus b and c versus d) is the appearance of the acetyl and aromatic signals for paracetamol and its metabolites in the postdose spectra. The insets are expansions of selected high frequency and low frequency regions of the NMR spectra. Key to peak numbers: 1, creatinine; 2, hippurate; 3, phenylacetylglutamine; 4, p-cresol sulphate (PCS); 5, citrate; 6, cluster of N-acetyl groups from paracetamol-related compounds; 7, paracetamol sulphate; 8, paracetamol glucuronide; 9, other paracetamol-related compounds. Reproduced from PNAS.
58
Selected regions of the 600 MHz 1H NMR spectra of the predose urines from the 99 human volunteers taking an oral dose of 1 g of paracetamol and colour-coded by postdose drug metabolism outcome. Red: the 25 subjects with the lowest postdose paracetamol sulphate (S)/ paracetamol glucuronide (G) ratios. Blue: the 25 subjects with the highest postdose S/G ratios. Green: the remaining 49 subjects with intermediate postdose S/G ratios. (a), (b) and (c) illustrate the regions of the predose urine NMR spectra showing the resonance of the methyl group in PCS, the metabolite labelled ‘4’ in Figure 9. (d) The region of the predose urine NMR spectrum showing the resonances of the aromatic protons of compound 4, PCS. In (a) only the predose spectra for the volunteers with the 25 lowest (red) and highest (blue) postdose S/G ratios are shown. In (b) all spectra are shown. In (c) and (d), the average spectra for each of the red, blue and green groups are shown. Reproduced from PNAS.
58
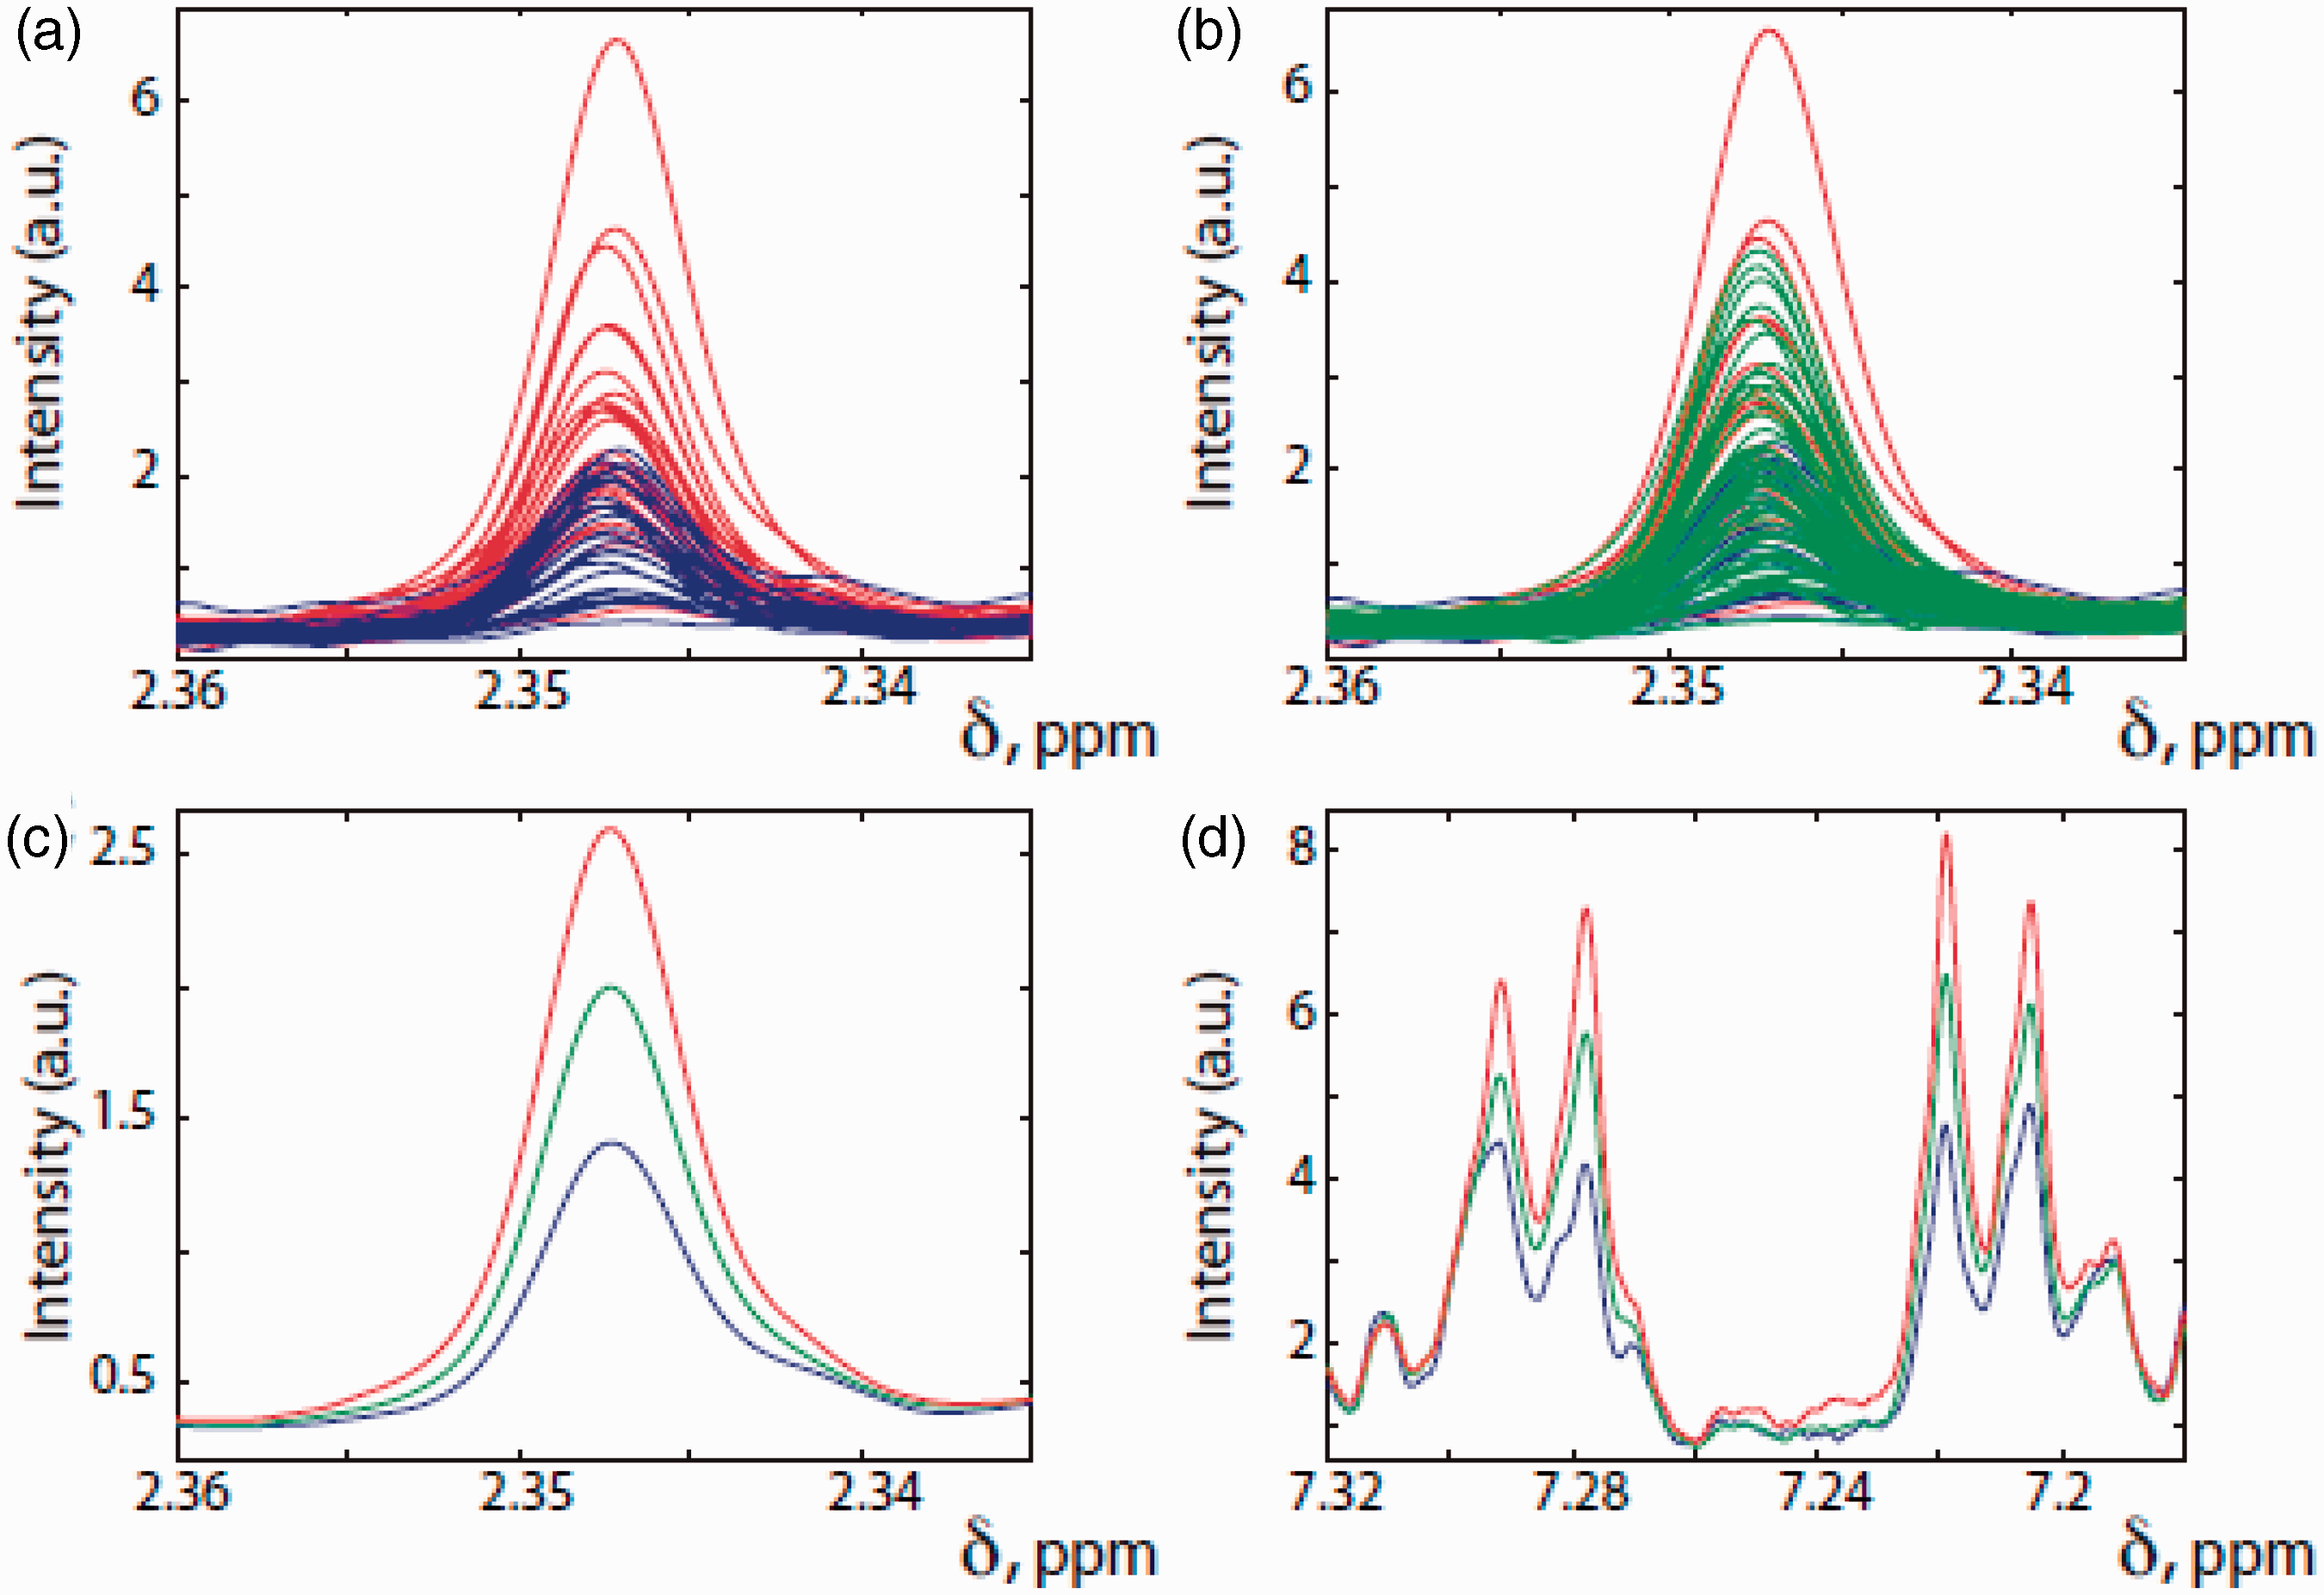
It is clear from inspection of Figure 10 that in general, those subjects with the lowest postdose ratio of paracetamol sulphate (S) to paracetamol glucuronide (G) (S/G) had the highest amounts of PCS in their predose urines and vice versa. A Mann–Whitney U test in conjunction with a Bonferroni correction
60
of 100 (to counter the multiple hypothesis testing inherent in this multivariate data analysis) confirmed the statistical significance of the association of high predose PCS/creatinine ratios with low postdose S/G ratios for the 25 subjects with the highest predose PCS/creatinine ratios at both postdose timepoints. Another key view of all the data is shown (Figure 11).
Plots of the ratios of paracetamol sulphate (S) to paracetamol glucuronide (G) (S/G) in the postdose urine of 99 human volunteers against the ratios of PCS to creatinine in the predose urine. (a) Data for 0–3 h and (b) data for 3–6 h postdose urine. Each volunteer is represented by an individual black diamond. Reproduced from PNAS.
58
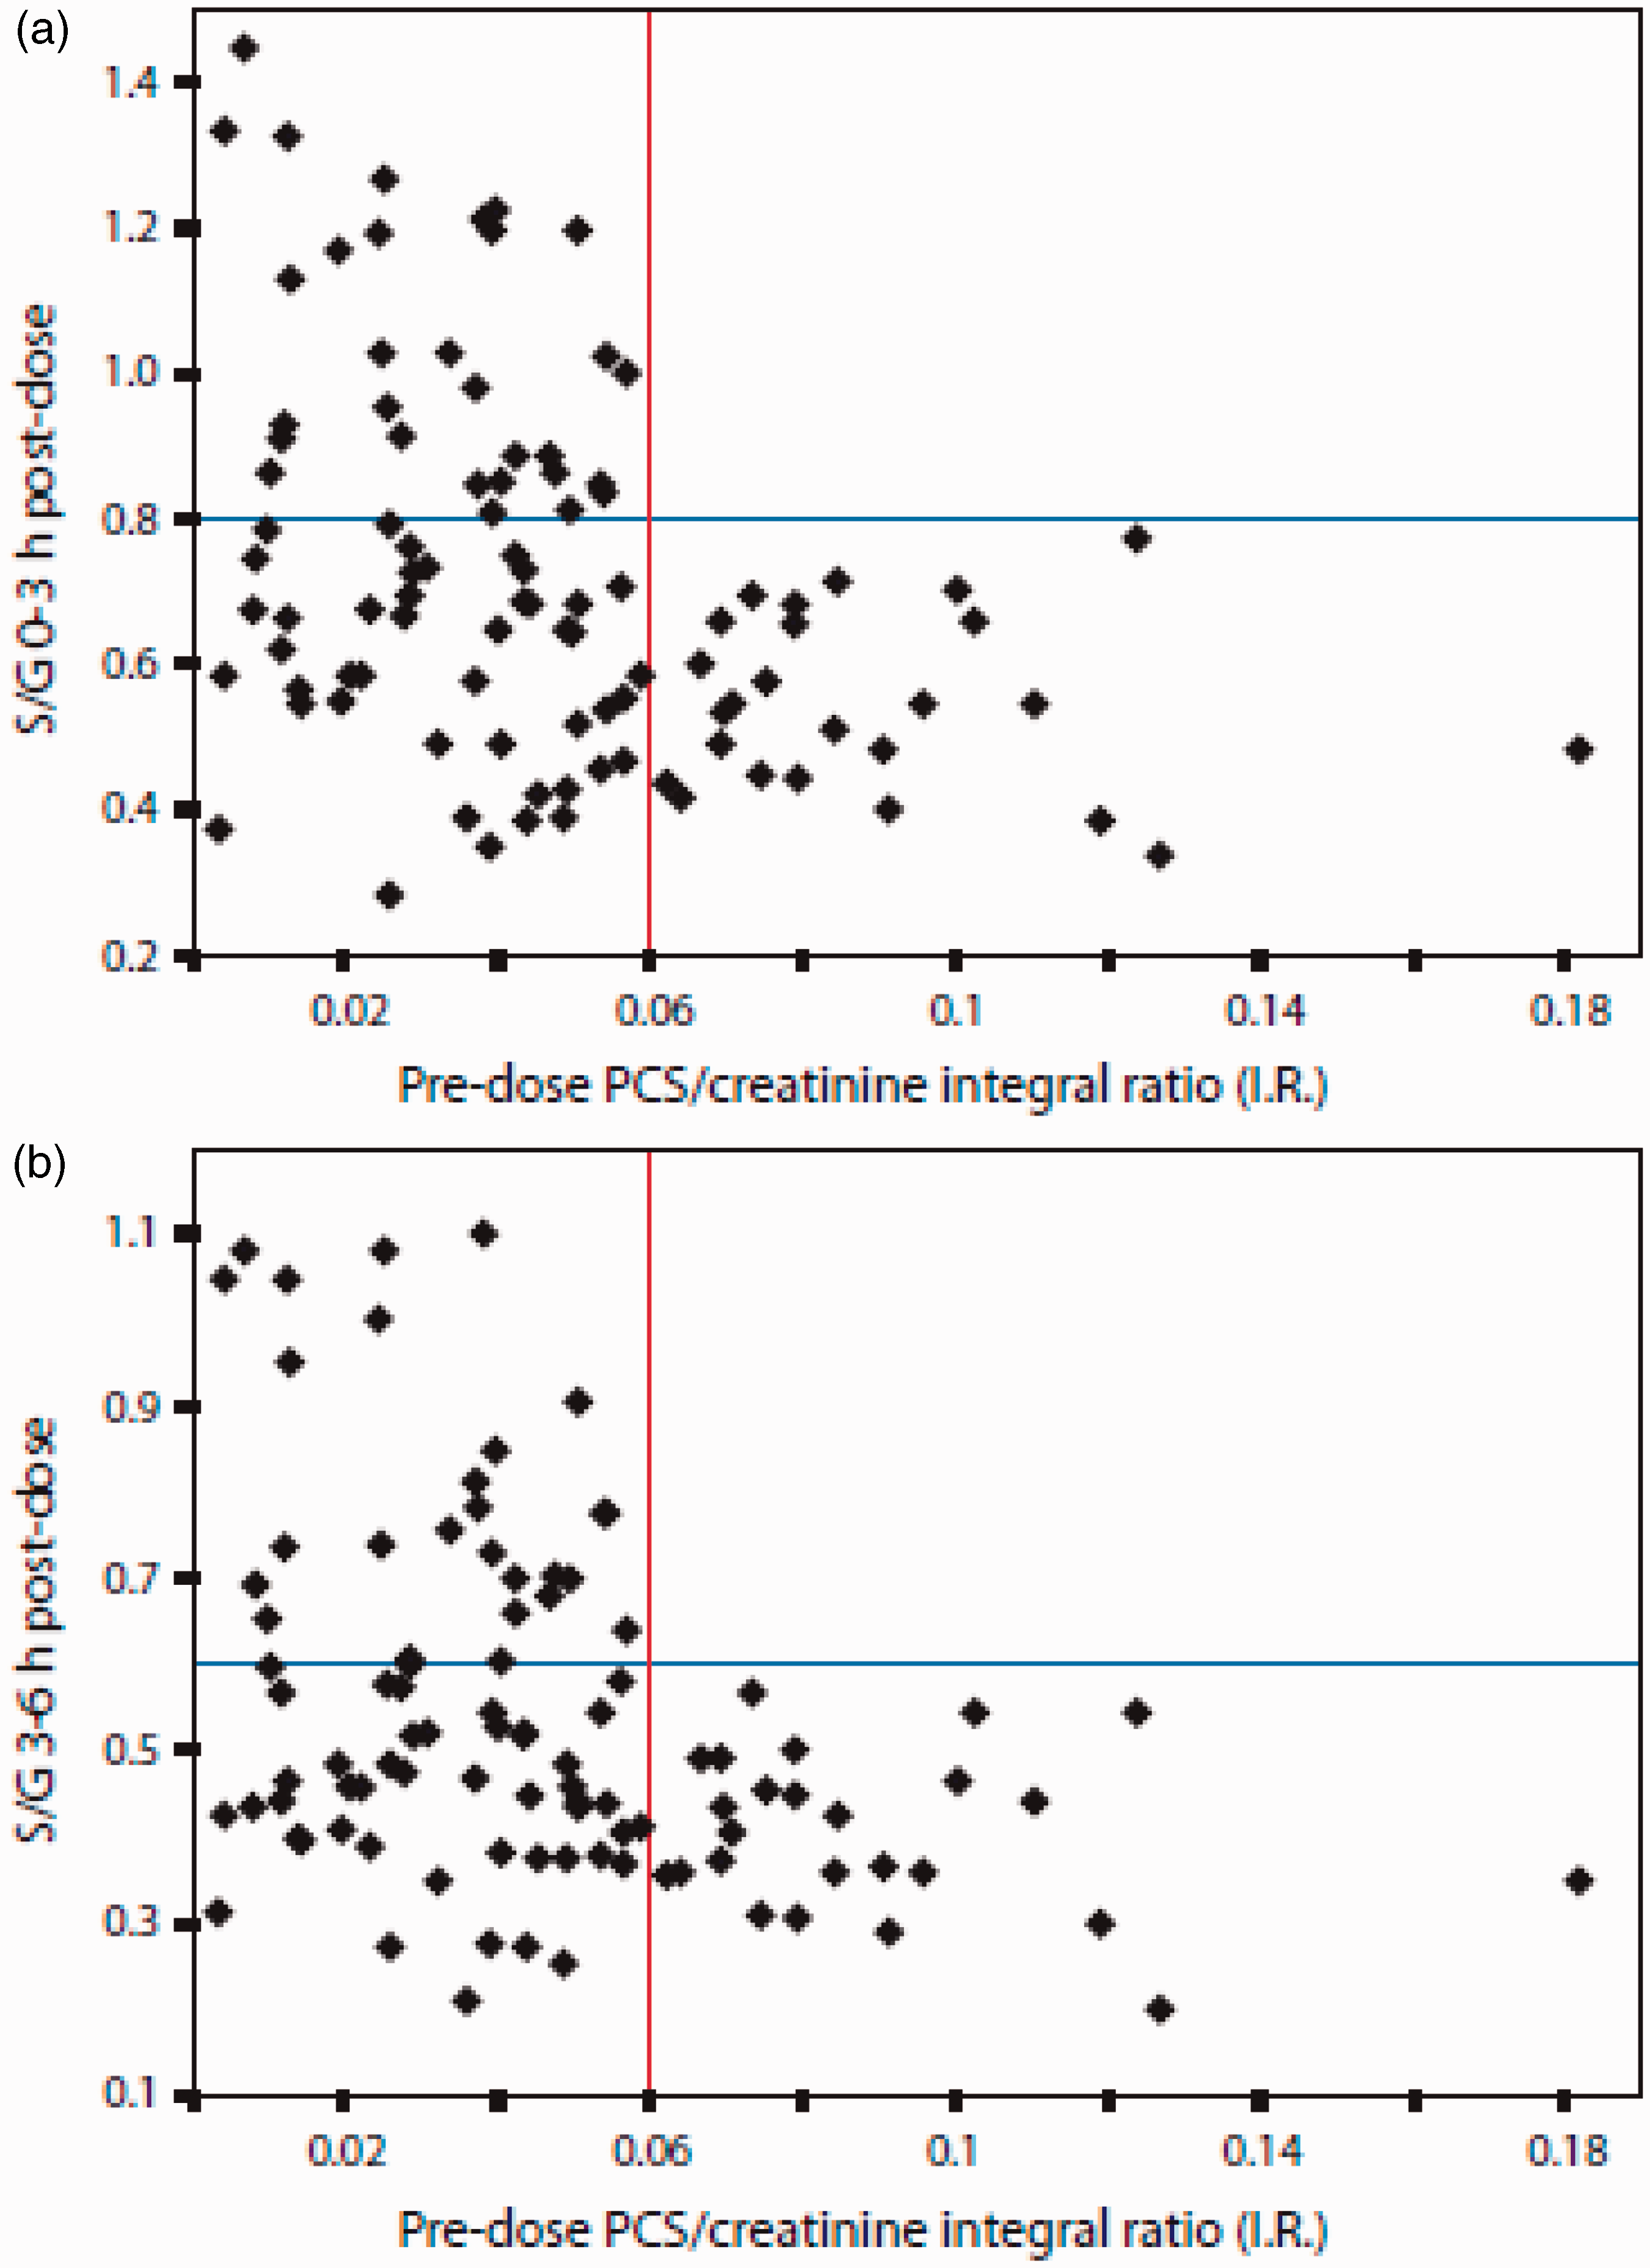
This illustrates that for all volunteers, if the predose ratio of PCS to creatinine is high (>0.06), then the postdose ratio of paracetamol sulphate to paracetamol glucuronide, S/G, excreted is always low (<0.6). On the other hand, if the predose ratio of PCS to creatinine is low (<0.06), then the postdose ratio of paracetamol sulphate to paracetamol glucuronide, S/G cannot be predicted and may take a wide range of values.
The findings from this first human pharmacometabonomic study were interpreted as follows. PCS arises from the sulphation of para-cresol using exactly the same sulphotransferase (SULT1A1) responsible for the sulphation of paracetamol to paracetamol sulphate (Figure 12).
The molecular structures of para-cresol (PCS) and paracetamol and their sulphate metabolites produced by transformation with the same sulphotransferase enzyme in the human body.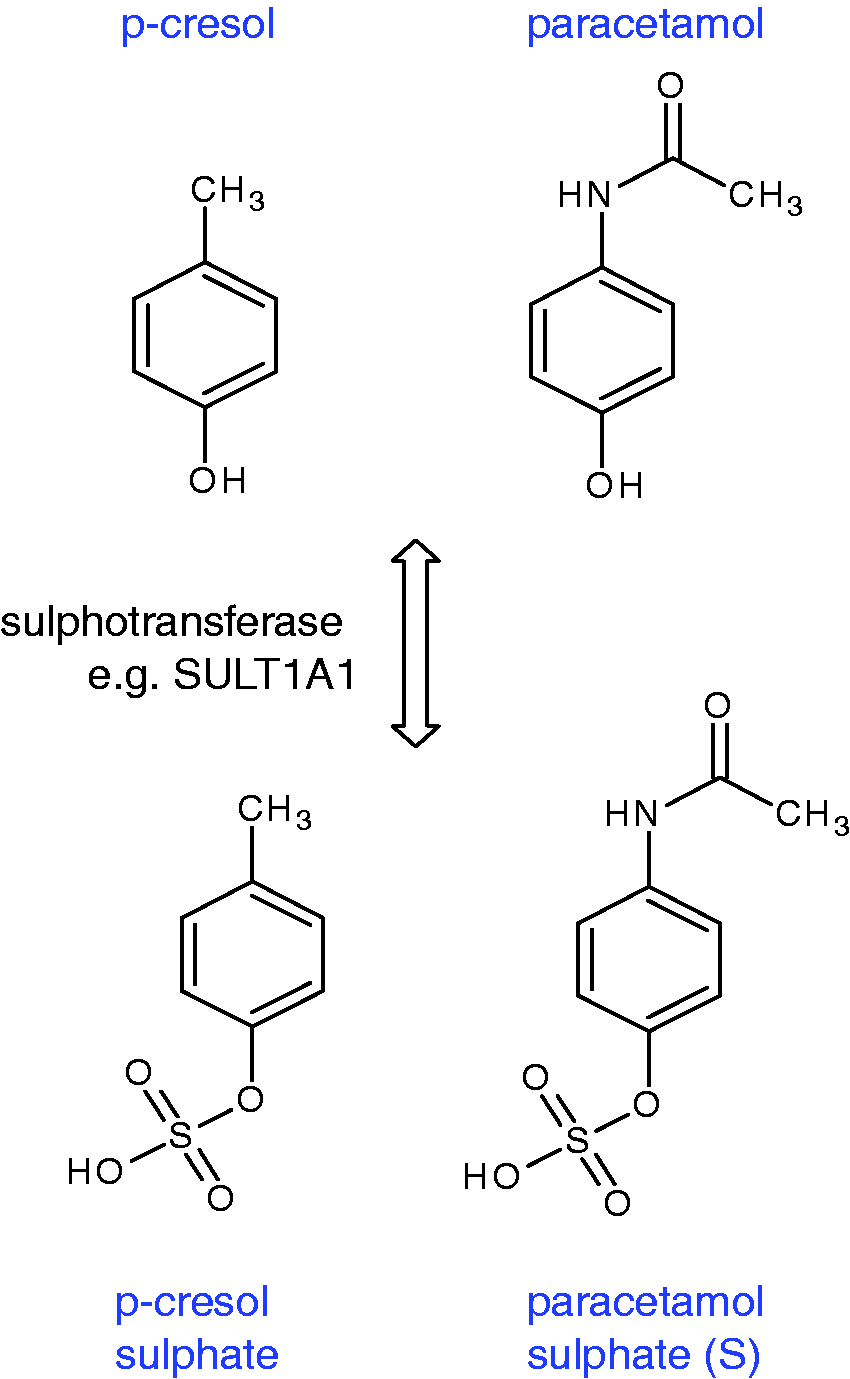
Strikingly, para-cresol is largely produced by bacteria in the gut microbiome, particularly Clostridium species,61,62 and in humans is extensively sulphated 63 to enhance its elimination from the body. Since the sulphation capacity of humans is limited,64,65 a high level of para-cresol excretion from gut bacteria will demand the use of a significant part of the body’s sulphation capacity to transform para-cresol to PCS. Then, if a drug is administered that requires sulphation as part of its metabolism, the body’s sulphation capacity could be exceeded and alternative pathways such as glucuronidation may be utilized instead. Several points are noteworthy. First, this very first human pharmacometabonomic study showed that the human metabolism of paracetamol is influenced by gut microbiome composition and excretion. Second, the key biomarker for the prediction of the metabolic fate of paracetamol in humans is not a human molecule in origin. Third, many drugs are conjugated by sulphation in order to increase their excretion, so this result may have wider implications than for paracetamol alone. Fourth, sulphation is an important regulatory process in the body and is used to modulate the activity of a variety of hormones and neurotransmitters. Therefore, alterations in sulphation capacity may have broader health implications, especially as several disease states such as autism are associated with altered PCS concentrations or altered ratios of S/G after paracetamol administration. 58
The publication of this work 58 was accompanied by a Commentary entitled ‘Drugs, bugs, and personalized medicine: Pharmacometabonomics enters the ring’ from Ian Wilson, 66 who noted the importance of the work and the potential for its use in personalized healthcare. Other reviews also appeared.67,68
Progress in clinical pharmacometabonomics
Weight gain in breast cancer chemotherapy
Keun and coworkers demonstrated in 2009 that serum biomarkers could be used to predict weight gain in women undergoing chemotherapy for breast cancer. 69 This represents the first validated pharmacometabonomic study with patients as opposed to volunteers. PLS-DA analysis of 600 MHz 1H NMR spectra of serum established that pretreatment concentrations of lactate, alanine and percentage of body fat were significantly predictive of weight gain in individuals.
Tacrolimus
The Korean group led by Yoon and Hwang 70 showed that pharmacometabonomics could be used to predict the PK of the immunosuppressant drug, tacrolimus. This drug has a narrow therapeutic index combined with a high degree of variability in blood levels in patients, and therefore the ability to predicts its PK is important. An LC-MS-based PLS model using predose concentrations of cortisol, 1-methylguanosine, acetylarginine and phosphoethanolamine, could classify subjects into low, medium and high Area Under Curve groups with respect to postdose tacrolimus PK.
Paracetamol revisited
A group led by Paul Watkins at the University of North Carolina published a study of the effects of dosing paracetamol (acetaminophen) at 4 g per day 71 on serum ALT activity and followed this up with an additional pharmacometabonomic study of paracetamol in 2010 72 in 71 male and female volunteers (age 18–55 years; dose: 2 × 500 mg tablets every 6 h for seven days). This high dose led to the development of reversible liver injury in some of the volunteers (responders). Analysis of predose urine metabolite profiles by 1H NMR spectroscopy was not able to produce a model that distinguished responders from non-responders. However, analysis of urine profiles obtained shortly after the start of treatment but before the serum ALT activity started to rise, did lead to statistically significant discrimination between the two groups and this was termed ‘early-intervention pharmaco-metabonomics’. The models were dependent upon the concentrations of the toxic metabolite N-acetyl paraquinone imine (NAPQI) and other endogenous metabolites. 72
Simvastatin
A series of papers including metabonomics and pharmacometabonomics work has been published by the Duke University group of Rima Kaddurah-Daouk et al. A 2010 paper demonstrated that pharmacometabonomics could be used to predict clinical response to the statin simvastatin, based on a lipidomic analysis of predose patients’ plasma from the existing Cholesterol and Pharmacogenomics (CAP) study (n = 944 patients). 73 Response to therapy was defined by the postdose % reduction in LDL-cholesterol (LDL-C) concentration. Predose concentrations of the phosphatidylcholine metabolite PC18:2n6, the cholesterol ester CE18:1n7 and the free fatty acid FA18:3n3 in addition to some related molecules were predictive of the degree of LDL-C reduction (p < 0.05).
Targeted GC-MS and LC-MS analysis of 12 sterols and 14 bile acids extracted from the predose plasma of subsets of patients from the same CAP study was reported later. 74 Two groups of patients were studied: 100 individuals representing the full range (FR) of patients’ responses in terms of % LDL-C change and two sub-groups of 24 individuals each, selected from the patients with the top and bottom 10% of LDL-C % change (Good and Poor Responders (GPR) group). Analysis of the FR predose plasma samples showed statistically significant correlations between postdose LDL-C lowering and lower predose concentrations of taurocholic acid (TCA), glycocholic acid (GCA), taurochenodeoxycholic acid (TCDCA), glycochenodeoxycholic acid (GCDCA) and glycoursodeoxycholic acid (GUDCA). In the GPR group, a strong relationship was observed between the level of reduction in LDL-C and higher predose concentrations of the secondary bile acids lithocholic acid (LCA), taurolithocholic acid (TLCA) and glycolithocholic acid (GLCA), as well as coprostanol (COPR), all produced by gut bacteria. The authors concluded that the FR results may be generally applicable, but the GPR results may only be applicable to a small subset of patients. Predose metabolite correlations with postdose simvastatin concentrations were also achieved. Very significantly, a complementary genetic analysis revealed associations between the predose concentrations of seven bile acids, including LCA, TLCA, TCDCA, TCA and GCA mentioned above, and a single nucleotide polymorphism (SNP), rs4149056, in the gene encoding the organic anion transporter SLCO1B1, known to be involved in simvastatin transport: it was concluded that these results demonstrated that it is also involved in hepatic uptake of bile acids. It was also concluded that competition between simvastatin and various bile acids for this transporter might influence both the PK and the pharmacodynamics of simvastatin and thus influence both the efficacy and safety profiles of the drug.
A third publication 75 used GC-TOF MS-based metabonomic and pharmacometabonomic analysis of extracted and derivatised plasma samples from the same patients reported previously.73,74 Lower predose concentrations of xanthine, 2-hydroxyvaleric acid, succinic acid and stearic acid and higher predose concentrations of galactaric acid (hexaric acid) were all significantly correlated with greater LDL-C response in the GPR sub-group.
Citalopram
A remarkable 2011 publication from the Mayo Clinic and others in collaboration with the Duke University group used GC-MS based pharmacometabonomics to show that predose glycine plasma concentrations were negatively associated with successful citalopram/escitalopram treatment of patients with major depressive disorder (MDD). 76 The exciting element of this study was that a pharmacometabonomics-informed genomics study was then initiated. Single-nucleotide polymorphisms (SNPs) in the genes encoding for glycine biosynthesis and degradation were analysed using 529 DNA samples from SSRI-treated MDD patients on the large PGx trial (Mayo-PGRN SSRI study) on which the pharmacometabonomics study had been conducted. Of the 135 SNPs analysed, the four most statistically significant SNPs were within the glycine dehydrogenase (GLDC) gene on chromosome 9. Of these four, the rs10975641 SNP was most strongly associated with disease remission. The presence of this SNP was shown to be significant for treatment outcome in DNA taken from 1245 white, non-Hispanic MDD patients on the Sequenced Treatment Alternatives to Relieve Depression (STAR*D), as well as in all subjects when the data were adjusted for ethnicity.
Using pharmacometabonomics to inform PGx studies in this way is an exciting development and a powerful way to develop personalized healthcare strategies for the future. This is a potentially important result, as the reason for the non-responsiveness of some patients to SSRI treatment has been elusive for many years.
The tag SNP genotyping approach outlined above was followed up by an approach involving SNP imputation using genome-wide association study (GWAS) data from the same 529 MDD patients on the Mayo PGRN SSRI trial. 77 HapMap and ‘1000 Genomes’ SNP imputation was performed for genomic regions containing the six genes for glycine biosynthesis and degradation identified in the previous SNP study. These results showed that GLDC was still the most important of the six genes for the prediction of patients’ outcome. It was concluded that the use of GWAS data to impute SNPs for genes in pathways identified by pharmacometabonomics or other ‘omics’ is an effective way to accelerate PGx studies.
Sertraline
A report on pharmacometabonomics in MDD patients randomly assigned to treatment with sertraline or to placebo has appeared.
78
The study was complicated as, in addition to variable drug responses from patients, the placebo effect is strong in MDD patients. However, a liquid chromatography electrochemical analysis of predose serum was undertaken. Multivariate data analysis gave a partial separation of responders from non-responders for either sertraline or placebo treatment. An overall correct classification rate of 81% for sertraline responders and 72% for placebo responders was achieved. Key predose serum metabolites contributing to the partial separation of the responders and non-responders on sertraline treatment included dihydroxyphenylaceticacid (DOPAC), 4-hydroxyphenyllacticacid (4-HPLA), serotonin (5-HT) and gamma tocopherol. For the placebo-treated group, the key metabolites contributing to the partial separation were hypoxanthine, xanthine and uric acid, 5-methoxytryptophol (5-MTPOL), serotonin (5-HT), 3-hydroxykynurenine (3-OHKY) and 5-hydroxyindoleacetic acid (5-HIAA), DOPAC, cysteine and several tocopherols. Thus, the metabolic profiles leading to the partial separation of responders and non-responders in the sertraline and placebo-treated groups were partially overlapping. It was noted that 5-MTPOL is produced from serotonin (Figure 13) and that 4-HPLA belongs to the phenylalanine pathway but is linked to the tyrosine pathway and catecholamine production. Hence, a biochemical rationale was presented for these two metabolites.
78
It was not commented upon that 5-HIAA is a direct metabolite of serotonin and is used as a surrogate to measure serotonin in man.
79
The chemical structures of serotonin, 5-methoxytryptophol and 5-hydroxyindole acetic acid.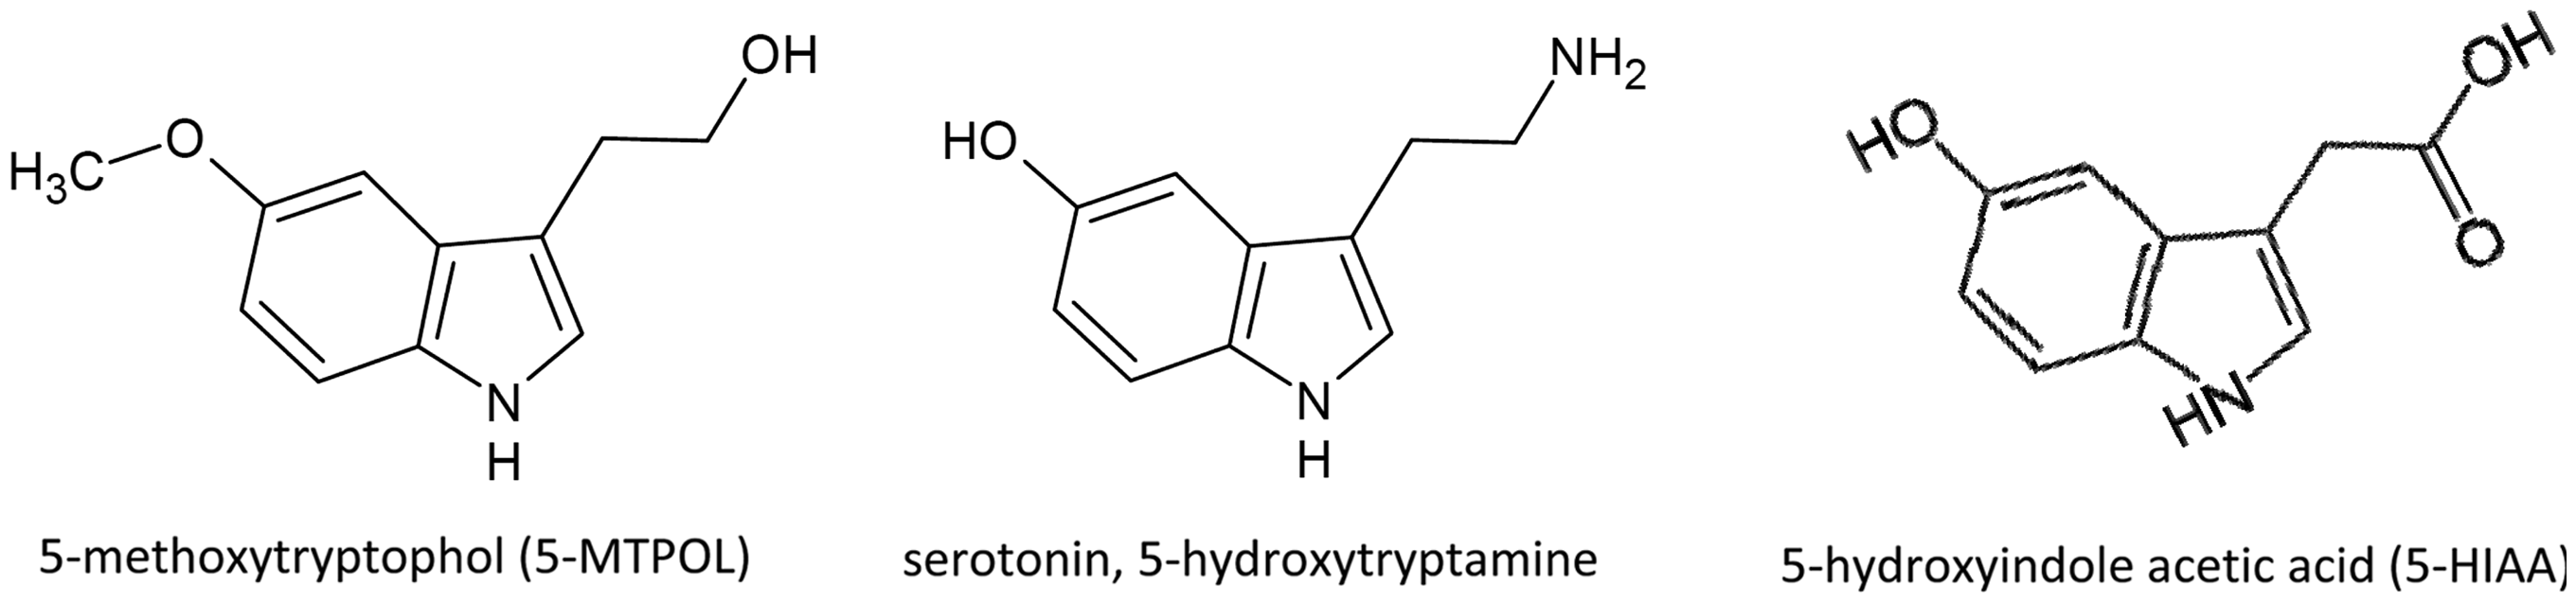
Schizophrenia
A study by the Pittsburgh group of Yao in collaboration with Duke University and others 80 found a statistically significant relationship between the predose concentrations of 3-hydroxykynurenine (3-OHKY) and clinical outcome in a group of 25 first episode neuroleptic-naive schizophrenic patients treated with five different drugs. The model successfully accounted for 41%, 35% and 38% of the variances associated with the change in total symptoms, in psychosis symptoms and in mood symptoms, respectively, over the four-week treatment period of this study. Lower plasma concentrations of 3-OHKY before treatment predicted greater improvement in total, psychosis and mood symptoms at four weeks.
Capecitabine
The group of Hector Keun at Imperial College London conducted a pharmacometabonomic experiment in a group of 54 colorectal cancer patients 81 treated with capecitabine. The most common side effects observed in the patients were fatigue, hand-foot syndrome and diarrhoea. Analysis of the predose serum for patients in each of four adverse effect groups showed that the concentrations of lipid fatty acid methyl groups and methylene groups, polyunsaturated fatty acid methylene groups and choline phospholipid –N(CH3)3+ groups were all significantly and positively correlated with the grade of toxicity, even after correction for multiple hypothesis testing (p < 0.05).
Atenolol
A large group led by Wikoff and Kaddurah-Daouk published a study entitled ‘Pharmaco-metabolomics Reveals Racial Differences in Response to Atenolol Treatment’. 82 However, this study contained no pharmacometabonomic data and instead presented pharmacogenomic results conjoined with metabonomics results.
A review of pharmacometabonomics was published by the Imperial College and AstraZeneca group in late 2010. 83 The concept of metabolome-wide association studies (MWAS) was introduced in addition to a discussion of the promise of combining pharmacometabonomic approaches with gut microbiota metagenomics in order to understand at much greater depth the interplay between the human genome and the microbiome in determining the metabotype of an individual. 84
A review of pharmacometabonomics with a focus on the future personalization of oncological treatments appeared recently from the group of Giuseppe Toffoli et al. 85
Future prospects for pharmacometabonomics
It is now around 13 years since pharmacometabonomics was discovered (JR Everett, JK Nicholson, J Lindon, C Charuel and TA Clayton, personal communication, 2000), 10 years since it was definitively demonstrated in 2003 and seven years since the first publication. 11 Since that first paper, 21 primary publications and eight reviews have emerged concerned with clinical or preclinical pharmacometabonomics. The original definition of pharmacometabonomics: ‘the prediction of the effects of a drug on the basis of a mathematical model of predose metabolite profiles’ 11 still holds and papers demonstrating the prediction of PK, drug metabolism, drug safety and drug efficacy have all emerged. Pharmacometabonomics holds great promise for improving personalized or stratified healthcare in the future, as we envisage that clinicians will be able to use these data, in combination with PGx and pharmacoproteomics data to help choose the optimal treatments for subsets of patients.
The development of personalized healthcare is a necessary path for medicine to take, as it is increasingly clear that for many medicines, efficacy is only achieved in a subset of the patient population.
86
Equally, many otherwise efficacious medicines are withdrawn from the market because of safety concerns in a small subset of the population.
87
For a long time, there has been an expectation that PGx would deliver personalized medicine.
88
However, a recent analysis of 289 cardiovascular PGx trials showed a significant gap between the promise of PGx and the reality in clinical practice.
89
This latter article opined: it seems increasingly less likely that genes will have a major clinical effect on the prognosis of common complex diseases.” and also that “Although it is possible that some yet undiscovered pharmacogenomic associations may provide actionable predictive information, this is likely to be a rare exception. More generally, individual SNPs will provide only a small piece of a much larger puzzle dominated by abundant (though often underused) clinical or phenotypic information.
89
As originally envisaged, 11 however, the use of pharmacometabonomics to predict future events, which occur after the passage of time, or after a broader range of interventions than just drug dosing, is likely to become equally important. A good example of this is the recent large study by Wang-Sattler et al. 103 of subjects in the population-based Cooperative Health Research in the Region of Augsburg (KORA) cohort. Of 641 individuals who had normal glucose tolerance (NGT) at baseline, 118 developed impaired glucose tolerance (IGT) seven years later. Glycine, lysophosphatidylcholine (LPC) (18:2) and acetylcarnitine all had significantly altered concentrations in IGT when compared with NGT individuals. Metabolite–protein network analysis was used to identify seven Type 2 diabetes (T2D)-related genes that were linked to the three metabolites via four associated enzymes. Remarkably, it was found that low concentrations of glycine and LPC at baseline were predictive for the development of IGT and or T2D.
This work 103 is another excellent example of the combined use of genetic and metabolic information, and an excellent example of what is actually predictive metabonomics, rather than pharmacometabonomics (see Appendix for Glossary). In the original description of pharmacometabonomics, it was envisaged that the outcome of interventions such as medical, dietary, microbiological or physiological challenges could be made. 11 Pharmacometabonomics is thus just a special case of the broader class of experiments called predictive metabonomics. The same nomenclature framework could be applied to proteomic or genomic experiments.
Another emerging area for pharmacometabonomics or predictive metabonomics is in the monitoring of surgical patients 104 in order to provide quasi-real-time diagnostic information to guide surgeons in their decision-making. This area is in its infancy but is emerging and could use information from biofluids, tissues or the metabolite-rich smoke from surgical electrocautery devices105,106 to provide biomarkers to inform decisions on tissue viability, tissue characteristics (e.g. normal versus cancer) and physiological state. In addition, these methodologies could inform the broader care of patients in preoperative, perioperative and postoperative settings.107,108 This has led to the emergence of the concept of longitudinal pharmacometabonomics to assist with the prediction of patients’ responses over time as they progress through a treatment regime. 97
Conclusions
It is clear that although pharmacometabonomics is in its infancy compared with PGx, a huge amount of progress has been made in the last 13 years since its discovery and it holds much promise. There are now clear demonstrations of its ability to help predict the PK, metabolism, efficacy and safety of drugs in clinical and preclinical settings. 109 The fact that pharmacometabonomics is able to sample events influenced by the microbiome and the environment, as well as the human genome is a major advantage of the technology. On the basis of existing results, we can predict that pharmacometabonomics will help to deliver the promise of personalized medicine that is so much needed at the present time. In order to deliver this promise, we anticipate that pharmacometabonomics will be used together with other technologies such as PGx, pharmacoproteomics and metagenomics.
It is also clear that pharmacometabonomics is just one example of a broader range of technologies that we call predictive metabonomics and that the prediction of interventions other than drug treatment, such as medical, dietary, physiological or microbiological challenges, will become increasingly important in the future. Indeed, the first examples of these approaches are emerging, such as the prediction of disease onset and also prediction of surgical outcomes.
We are certain that exciting new findings will emerge from new, well-designed pharmacometabonomic studies that will generate new biological sets of samples, or retrospective studies that make use of the wealth of biological samples stored in the ever-increasing number of biobanks worldwide. We look forward to the next decade of metabonomics, pharmacometabonomics and predictive metabonomics research with much excitement and anticipation.
Footnotes
Acknowledgements
JRE would like to acknowledge an extremely fruitful, 30-year collaboration on metabonomics and pharmacometabonomics with Professor Jeremy Nicholson, Imperial College London, UK. He would also like to thank Dr Claude Charuel, Dr Andy Clayton, Professor Elaine Holmes, Professor John Lindon and Professor Ian Wilson for their scientific insights, stimulation and advice on metabonomics over many decades. RLL is supported by Medical Research Council New Investigator Grant Award G1002151. The production of the figures in this article was facilitated through a donation from Clinical Biochemistry Conferences.
Declaration of conflicting interests
JRE is a co-inventor on a recently granted patent on pharmacometabonomics (EP1540560). No writing assistance was used in the production of this Review.
Funding
Not Applicable.
Ethical approval
Not Applicable.
Guarantor
JRE.
Contributorship
JRE researched the literature and wrote the first draft of the manuscript. All authors reviewed and edited the manuscripts and approved the final version of the manuscript.