
Abstract
Background
Ionized calcium (iCa) is the biologically active form of this micronutrient. Serum determination of iCa is measured via ion-electrode potentiometry (IEP) and reporting iCa relative to pH 7.4 is normally utilized to avoid the potential confounding effects of ex vivo changes to serum pH. Adjustment of iCa for pH has not been adequately justified.
Methods
In this study, utilizing carefully standardized protocols for blood collection, the preparation of serum and controlling time of collection-to-analysis, we determined serum iCa and pH utilizing an IEP-analyser hosted at an accredited diagnostic laboratory.
Results
Regression analysis of unadjusted-iCa (iCaraw) concentration versus pH was described by linear regression and accounted for 37% of serum iCaraw variability. iCaraw was then expressed at pH 7.4 by either adjusting iCaraw based on the linear regression equation describing the association of iCa with serum pH (iCaregr) or using IEP coded published normative equations (iCapub). iCaregr was comparable to iCaraw, indicating that blood collection and processing methodologies were sound. However, iCapub yielded values that were significantly lower than iCaraw. iCapub did not identify 15% subjects who had greater than desirable serum concentration of iCa based on iCaraw. Sixty percent of subjects with low levels of iCaraw were also not detected by iCapub. Determination of the kappa value measure of agreement for iCaraw versus iCapub showed relatively poor concordance (κ = 0.42).
Conclusions
With simple protocols that avoid sampling artefacts, expressing iCaraw is likely to be a more valid and physiologically relevant marker of calcium homeostasis than is iCapub.
Introduction
Calcium has multiple biological effects influencing cell function and systems physiology.1,2 Plasma calcium concentration is tightly regulated and in healthy subjects, is kept within a range of between 2.2 and 2.6 mmol/L. Half of the total plasma calcium is bound to proteins or anions. Ionized or ‘diffusable’ calcium (iCa) is the biologically active fraction.1–3 The plasma concentration of iCa in healthy subjects is ordinarily maintained between 1.12 and 1.30 mmol/L. However, disruptions to this homeostatic system lead to disorders of calcium metabolism that may precipitate, or exaggerate progression of several chronic disease conditions.1–5
Primary hyperparathyroidism (h-PTH) is the third most commonly reported endocrine disorder and is characterized by frank clinical features including markedly elevated serum iCa. 6 However, some h-PTH subjects are reported with normal or mildly elevated serum calcium. 7 Elevated PTH in the absence of hypercalcaemia may be a consequence of secondary mediators such as vitamin D deficiency, insufficient dietary intake of calcium or hypercalciuria. 7 However, when secondary causes of h-PTH have been excluded, serum total calcium may still paradoxically remain within normal limits.7,8 While it is presently unclear whether there is an obligatory increase in total serum calcium in response to PTH hypersecretion, a greater proportion of serum calcium nonetheless tends to be ionized, emphasizing the importance of regulating the concentration of the biologically active form.
Chronically low levels of serum total calcium are also a risk factor for chronic disorders including osteoporosis, nephrolithiasis, cardiovascular and neurodegenerative conditions. 9 Hypocalcaemia is commonly a consequence of inadequate dietary intake, or insufficient vitamin D, which stimulates PTH secretion to achieve normocalcaemia through calcium reabsorption via kidney, bone resorption and calcium absorption via the bowel.3,6
The physiological relevance of determining iCa was established decades ago. 10 However, until the advent of ion-selective electrode direct potentiometry (IEP), measures of serum iCa were not common because of technical difficulties in adjusting for confounders. 11 The advent of IEP analysers with contemporary measures of endocrine modulators of calcium metabolism and vitamin D homeostasis provide a platform for more detailed distinction of calcium metabolic disorders. 12
The measure of iCa in serum can be significantly affected by pH due to the competition for protein binding sites between calcium and hydrogen ions.11,13 Therefore, to avoid potential confounding effects due to pre-analytical collection and transport of blood specimens, iCa is normally referenced relative to a serum pH of 7.4. The iCa value is typically adjusted based on published algorithms which describe the correlation of iCa and serum pH.14,15
The validity and clinical relevance of reporting iCa adjusted to pH 7.4 has not been justified. In controlled animal models, Wolfe and Weir 16 showed significant intergenerational strain differences in mean serum pH, suggesting that variability in serum pH is a naturally occurring phenomenon. Several studies including that of Barth et al. 17 also reported significant non-linear and regression differences between laboratories when adjusting total serum calcium for albumin concentration according to published normative data. Moreover, others have reported that up to one-third of subjects measured via IEP-based iCa analysis may have venous-serum samples that fall outside the pH reference limits utilized in published algorithms to adjust iCa relative to a serum pH of 7.4. 18
The ABL800 FLEX auto-analyser produced by Radiometer is a reputable product used by many accredited diagnostic laboratories. When calculating iCa, the ABL800 FLEX auto-analyser utilizes a linear regression correction for pH, claimed to be valid for pH values between 7.2 and 7.6.14,19 In this study, we determined the putative validity of the calculated corrected value for iCa generated by the ABL800 FLEX auto-analyser (iCapub). The findings suggest that a linear adjustment of iCa relative to a pH of 7.4 may result in an under-estimation of subjects with hyper- or hypo-calcaemia. Uncertainty in the validity of expressing iCa adjusted for pH may contribute to paradoxical observations of calcium homeostasis in subjects with parathyroid hormone disorders and our understanding of the role of iCa in physiological function and disease risk.
Methods
Subjects
A total of 285 otherwise healthy participants aged between 18 and 80 y of age were recruited for the study approved by the Curtin University Human Research Ethics Committee (approval number HR97/2011). Potential participants completed a medical history and medications questionnaire and were interviewed to confirm the information provided. Subjects who had major surgery or a clinical event ‘in the last six months’; haemophilia; cancer/chemotherapy or with HIV were not included in the study.
Blood sampling
Participants arrived for provision of fasting blood samples between 8:00 and 10:00 in collection rooms adjacent to the accredited diagnostic centre following an overnight fast (minimum 8 hours). Participants were asked to avoid prolonged strenuous exercise and to limit alcohol intake to two standard drinks 24 h prior blood sampling.
Fasting blood samples were collected and handled under standardized preanalytical conditions to prevent interference of sampling artefacts that may affect pH and iCa values.20,21 A venous sample was drawn from each subject after being seated for 10 min into serum separator Vacutainer™ tubes (Becton Dickinson, Franklin Lakes, NJ, USA). All specimens were collected under consistent conditions where tourniquet use was avoided where possible, care was taken to avoid muscular contraction in the limb and blood tubes were filled to capacity without the ‘ingress’ of air into the tube at the end of sampling. In cases where a tourniquet was used, a discard tube was drawn before the sample after release for 30 s prior sampling. Samples were allowed to clot for 30 min and immediately centrifuged at 3800 rpm for eight minutes at room temperature and thereafter analysed on the ABL800 FLEX series auto-analyser as described by the manufacturer. The average total time of sampling-to-analysis was 60 min. Samples exceeding two hours since collection were excluded.
iCa determination
The analyser algorithm for pH adjustment to 7.4 programmed into the ABL800 FLEX auto-analyser is based on algorithm provided by Fogh-Andersen et al. 15 and commonly used in many IEP devices. The equation is: Corrected iCa2+ (pH 7.4) = Measured iCa2+ [1–0.53 × (7.40–measured pH)]. Note that this equation is only applicable to samples with pH values within 7.2–7.6, otherwise the conversion of the measured iCa concentration to pH 7.4 is considered invalid. Samples outside the indicated reference range were not included in the analyses presented.
Statistical analysis
Regression analysis was performed using unadjusted-iCa (iCaraw) as the dependent variable and pH as the independent variable. In addition to the linear effect of pH, the deviations from the linear were assessed by adding in the square of pH into the regression model. The linear model was considered to be an adequate fit if the deviations or the quadratic effect was not significant (P > 0.05). The predicted values from the regression model were determined (iCaregr). Adjusted R2 was calculated to represent the percentage of variance in iCaraw that was accounted by the independent variable pH.
Comparisons between the iCaraw, iCaregr and iCapub were performed using paired t-tests, since each subject had all three measurements. Cohen's kappa measure of agreement between the two measures iCaraw and iCapub was determined. The equation for κ is
A frequency distribution of iCaraw and iCapub were each expressed into three categories: below 1.20 mmol/L (Hypo-iCa); within the desirable reference range of 1.20 mmol/L ≤ iCa ≤ 1.29 mmol/L (Normal-iCa); or with serum iCa ≥ 1.30 mmol/L, were compared. The three reference ranges indicated were selected for consistency with other studies in the absence of consensus-based values.6,22 P-values less than 5% were considered as statistically significant. All analyses were conducted using SPSS version 10.
Results
The cohort of 285 subjects investigated had a mean serum pH of 7.367, but despite strict blood collection protocols to avoid sample collection artefacts, the pH range was nonetheless significant (7.08–7.75; Figure 1). The association of unadjusted serum ionized calcium (iCaraw) versus pH of serum measured by the ABL800 FLEX auto-analyser is depicted in Figure 1. The association of iCaraw with pH was significant and best described by linear regression analysis. However, it was notable that serum pH only described 37% of subject iCaraw variability.
Correlation of unadjusted ionized calcium (iCaraw) and serum pH in 285 otherwise healthy subjects. The regression equation describing the association of iCaraw with serum pH in this cohort is indicated. The mean of iCapub was significantly different from iCaraw at P < 0.0001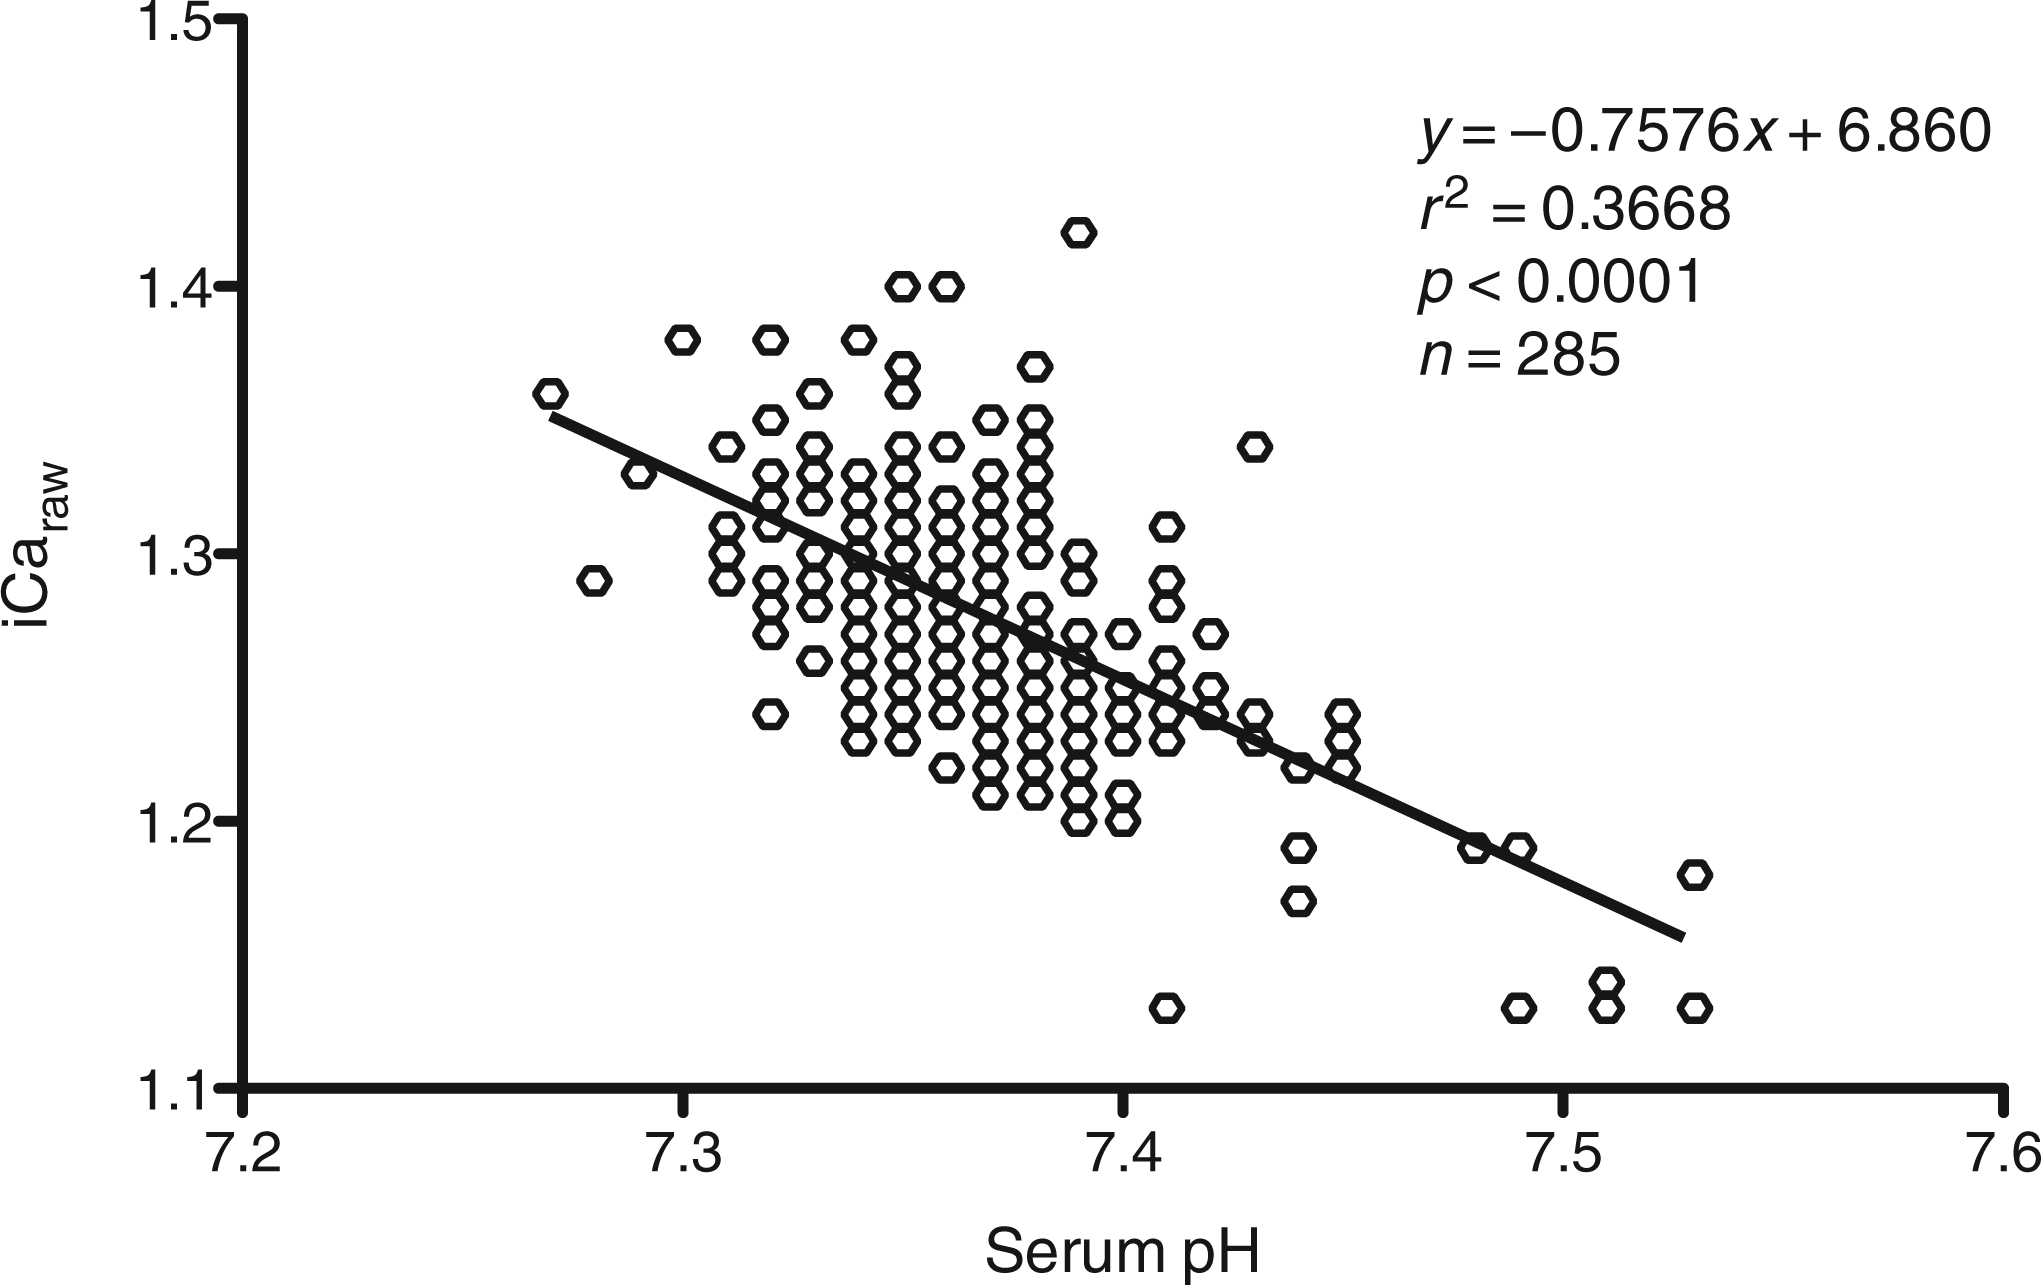
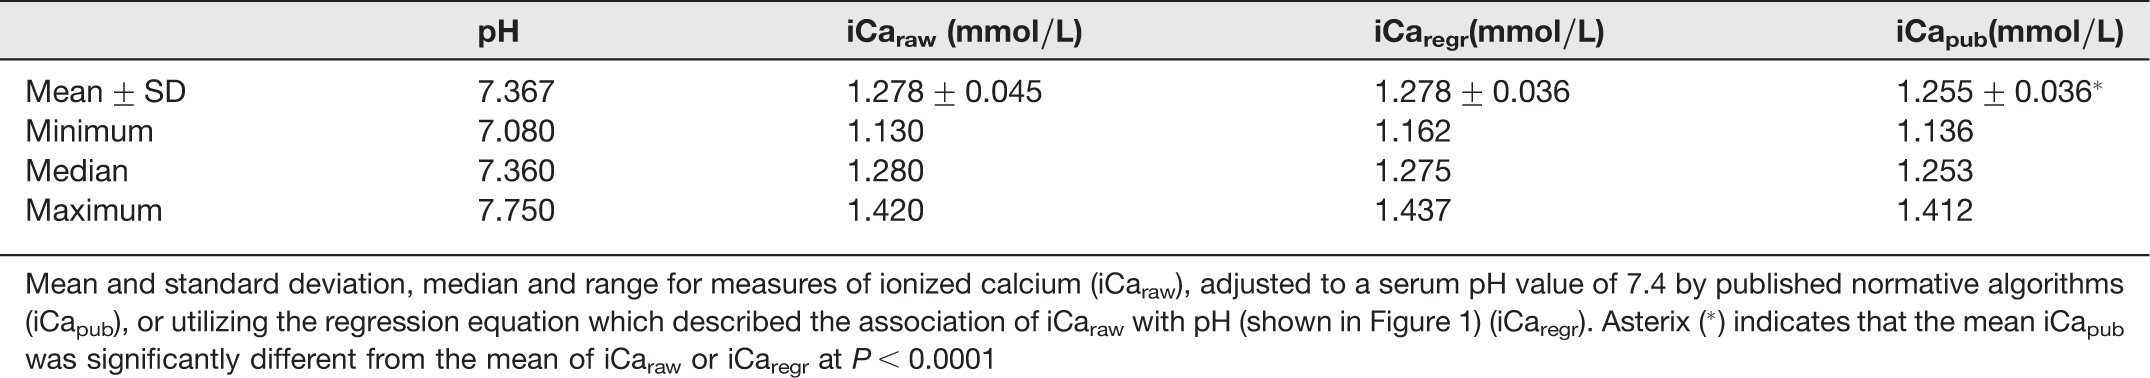
Table 1 lists the mean + SD, the median and range for iCaraw; following adjustment based on the linear regression analysis depicted in Figure 1 (iCaregr); or based on the published normative corrections utilized in the adjustment settings of the ABL800 FLEX auto-analyser (iCapub). The mean and median of iCaraw versus iCaregr were not significantly different for this cohort. However, in contrast the mean and median of iCa adjusted to pH 7.4 according to published normative equations was significantly lower than the unadjusted value (iCaraw), or iCaregr. Figure 2 depicts the subject frequency distribution of the delta difference between iCapub versus iCaraw. Paired analysis found that iCapub was significantly different from iCaraw by approximately −0.22 mmol/L. In contrast, the frequency distribution of the delta difference between iCaregr versus iCaraw shown in Figure 2 frame B, was not significantly different (0.00018 mmol/L).
Subject frequency plot of the delta between the alternate measures of ionized calcium (iCa). The top frame depicts a subject frequency plot of the delta between the alternate measures of iCa. iCaraw adjusted to pH 7.4 based on published normative corrections (iCapub), or the equation describing the association of iCaraw versus serum pH (shown in Figure 1) (iCaregr) are indicated. The table depicts the mean delta difference and significance versus iCaraw Mean and standard deviation for measures of ionized calcium (iCa) Mean and standard deviation, median and range for measures of ionized calcium (iCaraw) adjusted to a serum pH value of 7.4 by published normative algorithms (iCapub), or utilizing the regression equation which described the association of iCaraw with pH (shown in Figure 1) (iCaregr). Asterix (*) indicates that the mean iCapub was significantly different from the mean of iCaraw or iCaregr at P < 0.0001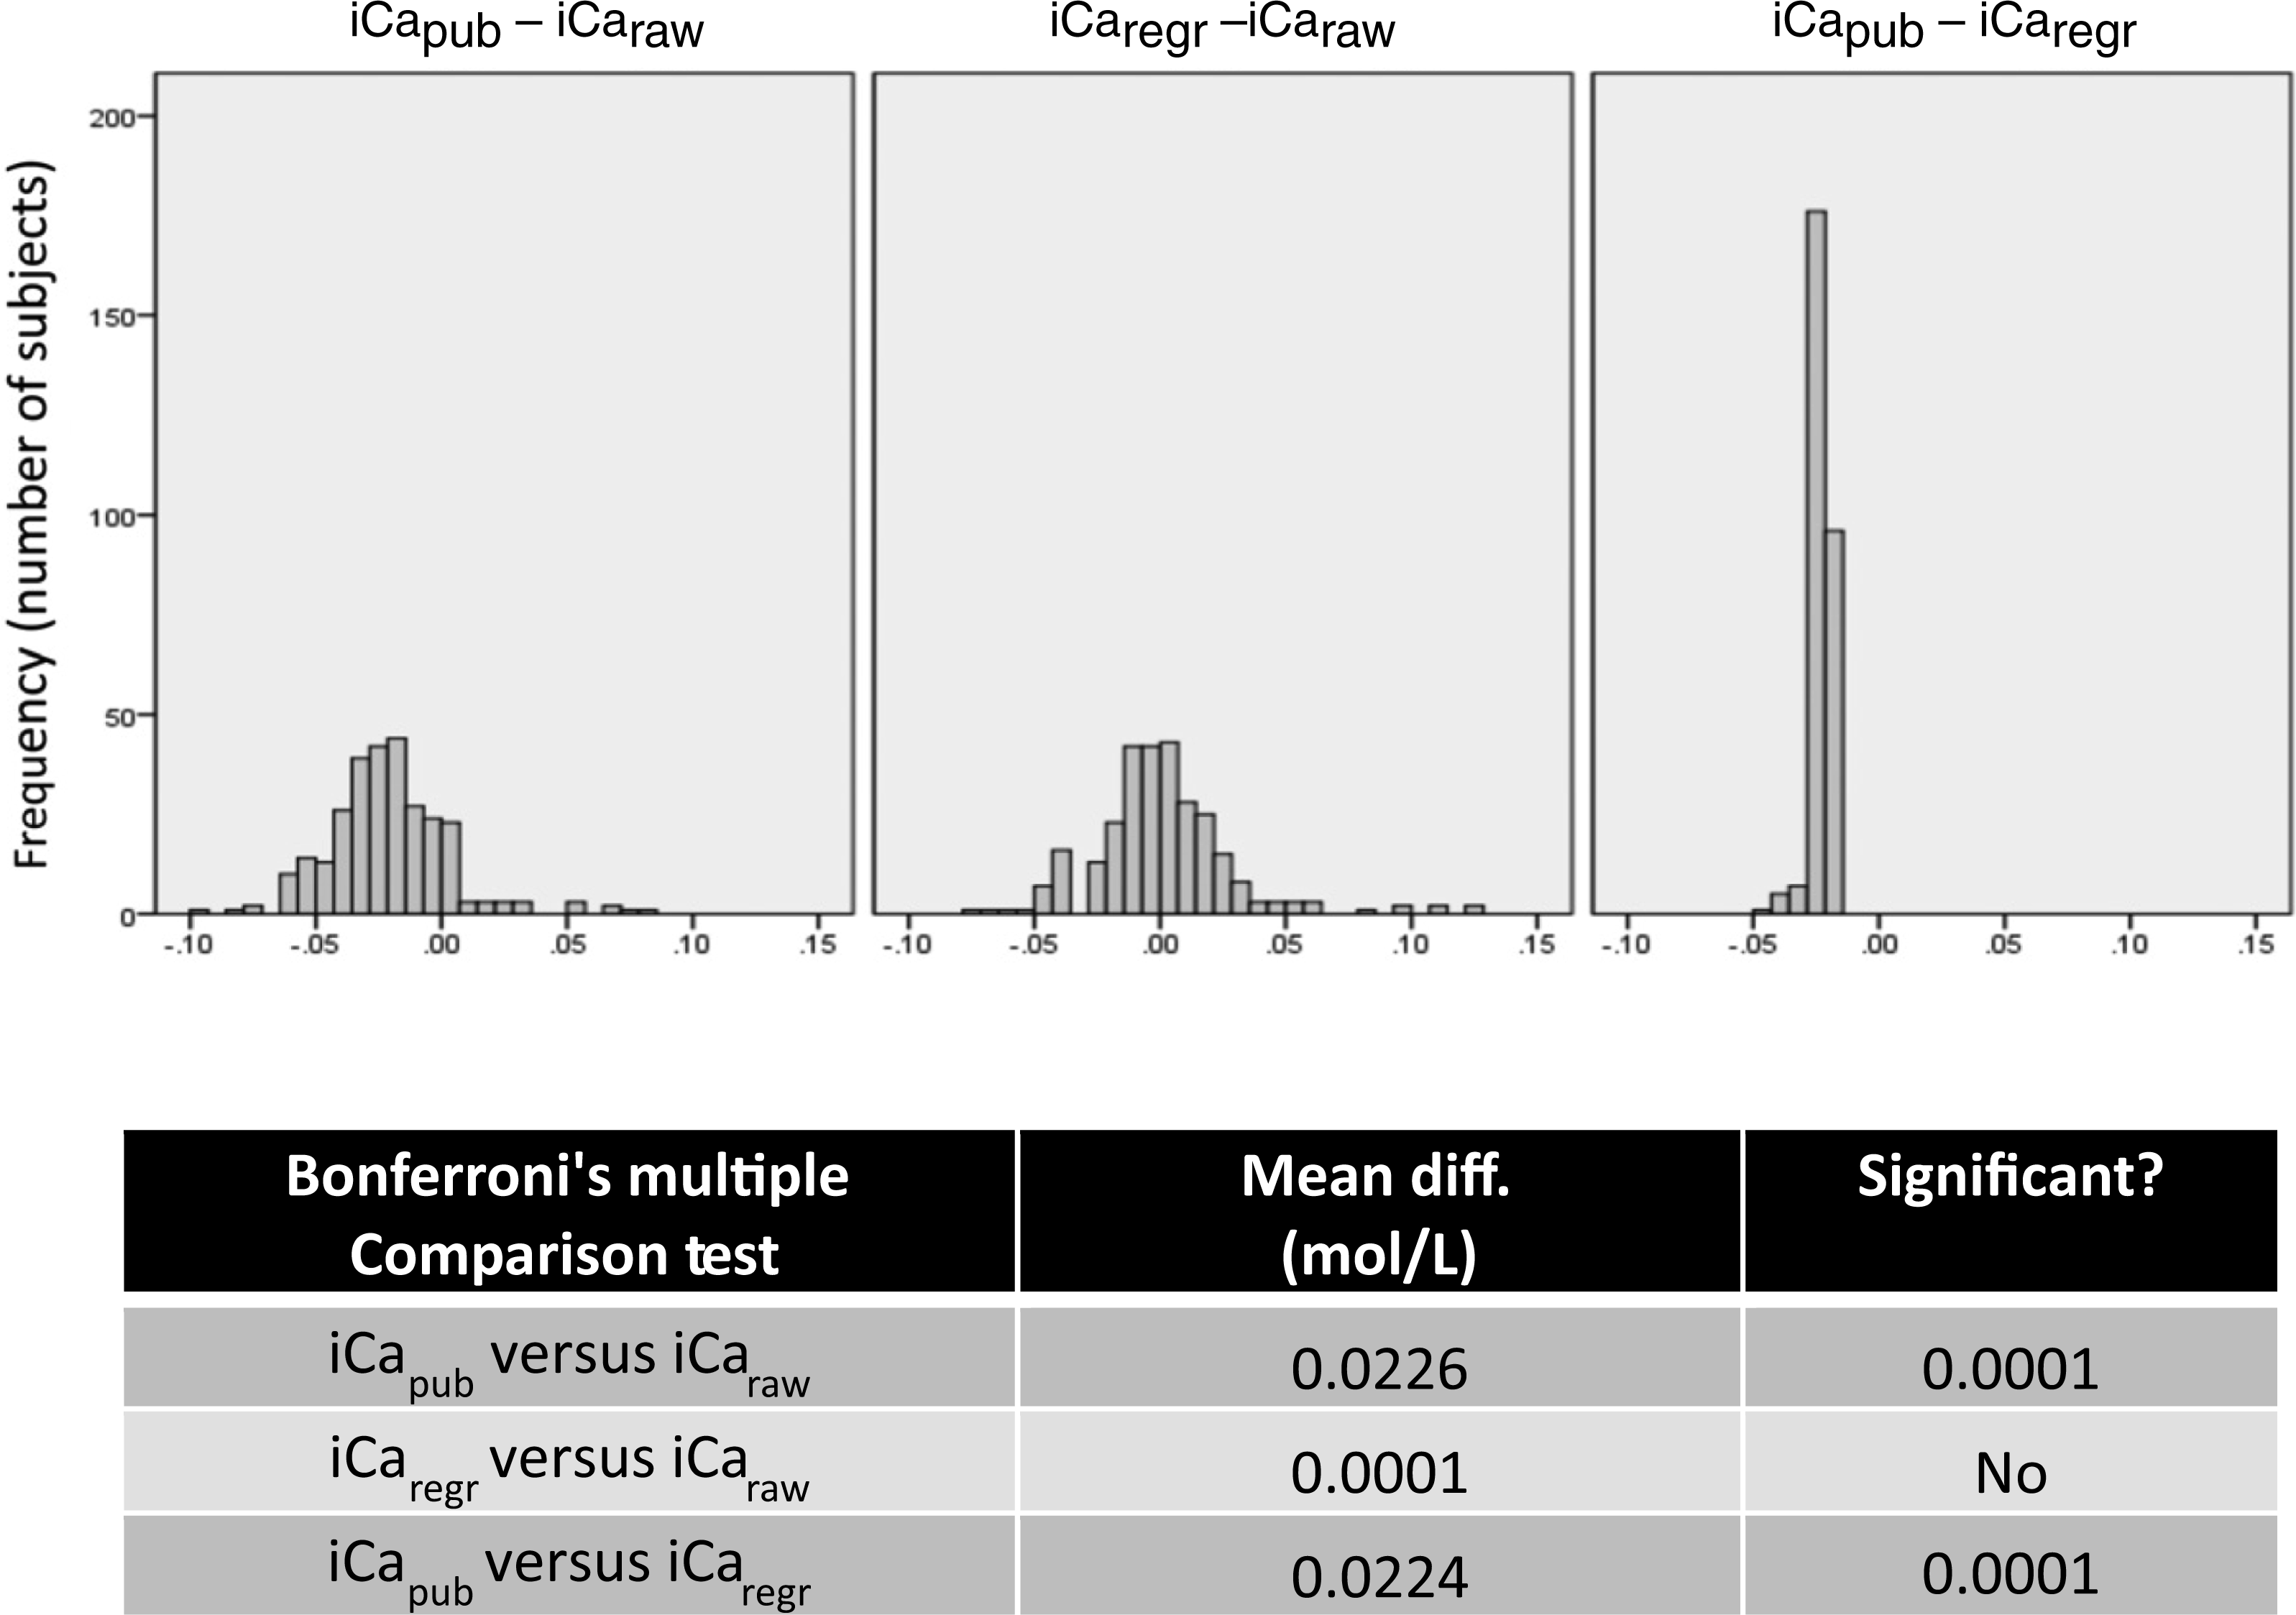
Consideration of iCa adjusted to pH 7.4 is illustrated in Figure 3 as a scatter plot relative to individuals iCaraw value. The data demonstrated that irrespective of an individual's serum pH, iCapub consistently underestimates the serum concentration of iCa.
Scatter plot depicting the difference in iCapub and iCaregr relative to iCaraw. Scatter plot for subjects depicting the difference in ionized calcium adjusted to a serum pH value of 7.4 by published normative algorithms (iCapub), or utilizing the regression equation which described the association of iCaraw with pH (shown in Figure 1) (iCaregr), relative to the unadjusted value (iCaraw)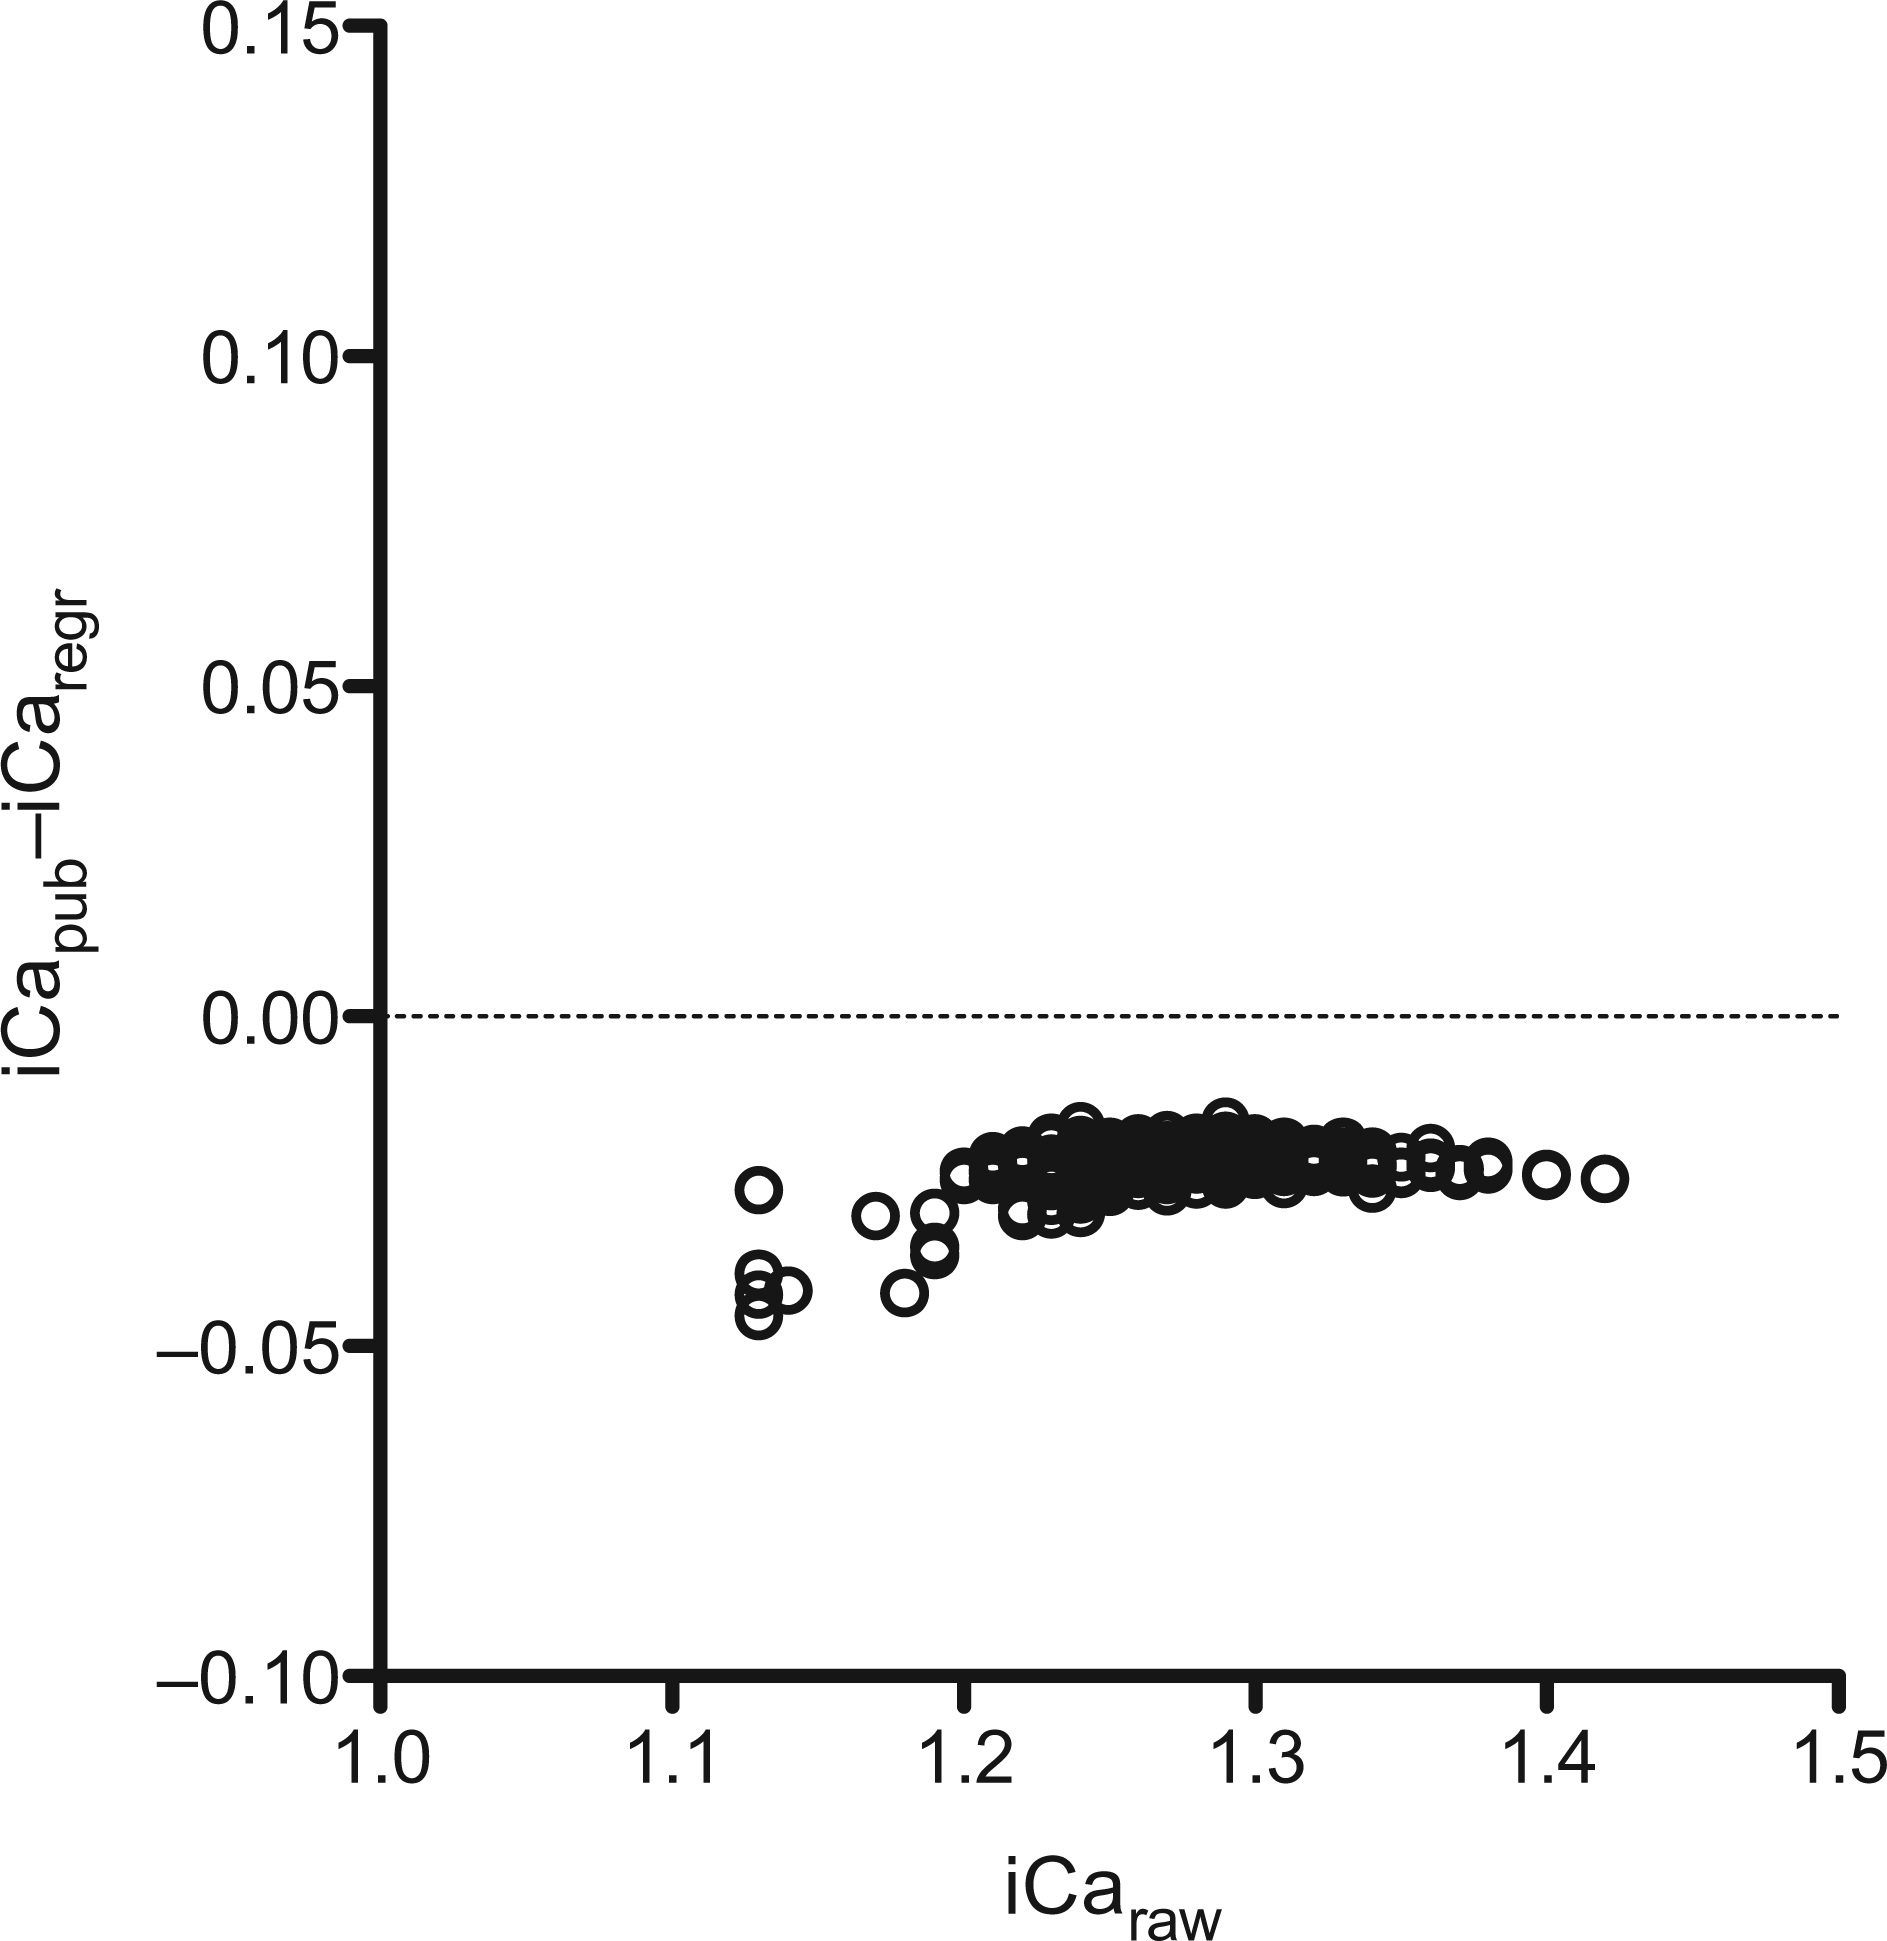
Frequency of subjects identified as having serum iCaraw and iCapub below (Hypo), within (Normal); or above (Hyper) the normal reference range
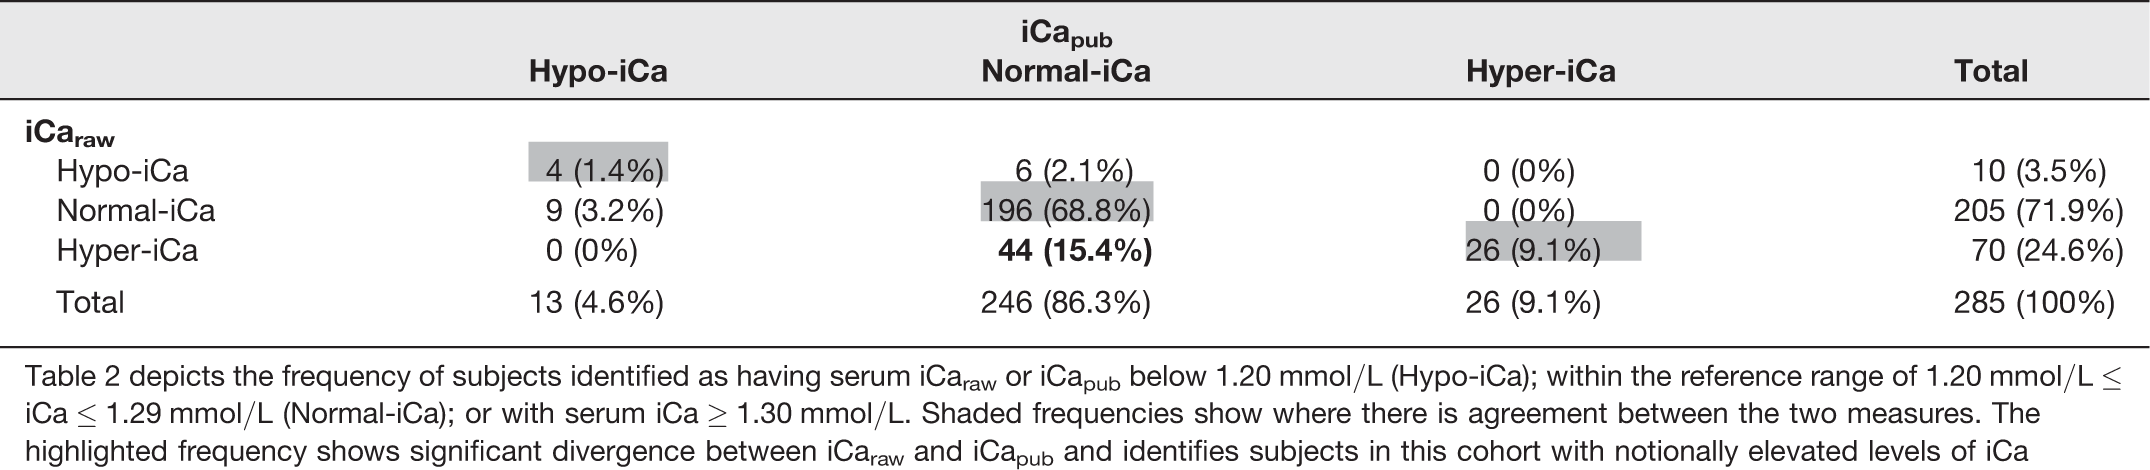
Table 2 depicts the frequency of subjects identified as having serum iCaraw or iCapub below 1.20 mmol/L (Hypo-iCa); within the reference range of 1.20 mmol/L ≤ iCa ≤ 1.29 mmol/L (Normal-iCa); or with serum iCa ≥ 1.30 mmol/L. Shaded cells show where there is agreement between the two measures. The highlighted cell shows significant divergence between iCaraw and iCapub and identifies subjects in this cohort with notionally elevated levels of iCa
Discussion
This study determined the best-fit association of uncorrected iCa versus serum pH, generated by a commonly used IEP-analyser, the ABL800 FLEX auto-analyser by Radiometer. The association of iCa versus the independent variable (pH) was significant but only accounted for approximately 37% of the measures recorded in a cohort of 285 subjects. The findings reiterate that serum iCa is significantly regulated by factors other than serum pH.
In this study, the cohort had an unsurprising mean serum pH of 7.367, but despite controlling for potential sample collection confounders, variability around the mean serum pH nonetheless was as high as 5.2% (pH 7.08–7.75). Serum samples with 7.1 > pH > 7.6 were not included in the analyses; however, if variability in serum pH does indeed represent natural biological variation between individuals, then in absolute terms this would reflect in this cohort potential differences of iCaraw of 0.51 mmol/L (estimated on the linear regression equation generated). The findings suggest that if there is confidence in the integrity of blood sample collection and analysis, then adjustment of measured iCaraw relative to an ex vivo pH cannot be justified. Indeed, in a physiological context it is the absolute tissue exposure to iCaraw that needs to be considered.
Stratification of subjects based on iCaraw identified that approximately 25% of subjects (70 of 285 individuals) had a serum iCa above the upper reference limit of 1.29 mmol/L, whereas the adjusted value based on published algorithms (iCapub) identified just 9.1%. All of the latter individuals were confirmed as being in the hyper-iCaraw category. Although fewer in number than the hyper-iCaraw group, six out of 10 individuals identified by iCaraw as having lower than desirable levels of iCa, were within the normal range of 1.20–1.29 mmol/L according to the iCapub adjustment. Clearly, utilizing iCaraw rather than iCapub may alter clinical management of individuals. Moreover, utilizing a robust measure of iCaraw may alter our understanding of how iCa influences physiological systems and disease risk.
Sustained hyper- or hypocalcaemic disorders have significant physiological effects that can contribute to onset and progression for a range of chronic disorders.6,9 Confidence in the validity of iCa measures are therefore pivotal to optimize clinical management. Our data suggest that adoption of published generalized linear models to adjust the raw measured value of iCa is not appropriate. Rather, standardizing blood sampling and management protocols will provide confidence that IEP measures of iCaraw are biologically relevant. If an adjusted value of iCa relative to serum pH 7.4 is to be considered, then the data suggest that adjustment should be at the very least reiterated per IEP-unit to ensure comparability of research findings. In this study, the linear regression equation that described iCaraw versus pH (iCaregr) was significantly different from the commonly utilized algorithm (iCapub). Nowadays, it would be relatively simple to analyse the association of iCaraw with sample pH and provide an iCaregr that is specific for the model of IEP used and site of testing.
The findings of this study do not support the utilization of iCa adjusted to a mean serum pH of 7.4. Moreover, utilization of published normative equations describing the correlation of serum iCa with serum pH is a historic practice that may lead to significant confounders when considering research reports. Thode et al. 14 suggested otherwise and found consistent agreement between iCa adjusted based on published algorithms and actual values with relatively careful sampling techniques. While a comparison of iCa determined based on regression analysis versus sample pH was not reported by Thode et al., the difference in findings emphasizes the uncertainty of normalization between alternate IEP devices, utilizing the same algorithm. Limitations of this study include only a single measure per subject. However, the coefficient of variation for single measures was found to be <2% per sample (data not shown). The Australian population cohort was multi-ethnic and this may have contributed to the variability in serum pH reported.