
Abstract
Background
Bile acids (BAs) play an important role in releasing incretin hormones via the enteroendocrine L-cell surface TGR5 receptors. The aim of this study was to investigate the difference in BA concentration at baseline and in response to a meal stimulus between type 2 diabetes mellitus (T2DM) and a matched normoglycaemic group.
Materials and methods
A cross-sectional study of 12 patients with known T2DM and 12 matched normoglycaemic controls compared BA fractions after an overnight fast and following a standard meal.
Results
The T2DM group had higher baseline glucose (P < 0.001), but baseline total BA, total glycine conjugated BAs (GCBA) and total taurine conjugated BA (TCBA) were similar between both groups. The T2DM group compared to the normoglycaemic group had a higher post-prandial peak change in total BAs 4.28 (3.51–5.38) µmol/L vs. 0.88 (0.60–1.57) µmol/L (P < 0.001) and peak total GCBA 2.77 (1.07–4.19) µmol/L vs. 0.94 (0.34–1.15) µmol/L (P < 0.0001), but similar peak total TCBA 0.36 (0.02–0.76) µmol/L vs. 0.08 (0.04–0.22) µmol/L (P=0.91).
Conclusion
The post-prandial bile acid response is elevated in obese patients with T2DM compared to matched normoglycaemic individuals.
Introduction
Bile acids (BAs) have been increasingly studied for their metabolic regulatory roles in addition to their well-known function in lipid digestion. 1 By triggering different signalling pathways, BAs are involved in the metabolism of lipids as well as glucose homeostasis. 1,2 Furthermore, modulation of BA metabolism by intestinal sequestrants such as cholestyramine leads to improved glycaemic control in type 2 diabetes mellitus (T2DM). 3
BAs are synthesized from cholesterol by cholesterol 7α-hydroxylase (CYP7A1) – the rate-limiting enzyme – as primary BA, cholic acid (CA) and chenodeoxycholic acid (CDC). 4 The majority of primary BAs are then conjugated with either glycine (75%) or taurine (25%). 5 The ingestion of fat and protein rich food stimulates the release of cholecystokinin (CCK), which results in the release of primary BAs from the liver and gallbladder into the duodenum. 6 Anaerobic bacteria residing in the colon are responsible for the formation of the secondary unconjugated BA; deoxycholic acid (DC), lithocholic acid (LCA) and ursodeoxycholic acid (UDC). 6 In the terminal ileum, 95% of BAs are reabsorbed back into the liver via ileal apical sodium-dependent bile salt transporters. The remaining 5% is lost in faeces or excreted in urine. 1 Reabsorbed BAs exert a negative feedback control on CYP7A1, regulating their own synthesis. 7,8
BAs are ligands for the G-protein coupled receptor TGR5 (or ‘membrane bile-acid receptor’) as well as for nuclear hormone receptors such as farnesoid X receptor-α (FXR). 1 Metabolomic studies suggest BAs may regulate insulin sensitivity in response to a meal. 9,10 Lucio et al. 11 identified 22 metabolites of BA synthesis that were associated with insulin resistance. BAs exert differential regulatory functions via nuclear and membrane receptors as well as via receptor-independent signalling pathways.
BAs and the incretin hormone, glucagon like peptide-1 (GLP-1), responses are correlated in non-diabetic subjects, with glycochenodeoxycholic acid (GCDC) and glycodeoxycholic acid (GDC) stimulating GLP-1. 12 It is not known whether the TGR5 signalling cascade to BA is altered in patients with T2DM. Cariou et al. 13 showed that plasma chenodeoxycholic acid (CDC), cholic acid (CA) and to a lesser extent DC negatively correlated with insulin sensitivity in healthy individuals, obese and T2DM patients. Furthermore, T2DM patients have been shown to have lower post-prandial GLP-1 responses compared to non-diabetic individuals. 14
Glucose stimulates CYP7A1, the rate-limiting enzyme in BA synthesis. 15 Thus, we hypothesized that T2DM patients may have up-regulation of BA due to excess glucose stimulus. The aim of this study was to investigate the difference in BA at baseline and in response to a meal stimulus between T2DM and matched normoglycaemic individuals.
Research design and methods
Recruitment
This cross-sectional study recruited 12 patients with T2DM and 12 matched individuals with normoglycaemia. Exclusion criteria were age <18 or >70 years, type 1 diabetes, exenatide or dipeptidyl peptidase IV (DPP-IV) inhibitor treatment, pregnancy, substance abuse, more than three alcoholic drinks per day, psychiatric illness, weight loss medication or chronic medical conditions that would have made it unsafe to perform the standard investigations involved in the study. The study was approved by the King’s College Hospital NHS Foundation Trust Research Ethics Committee (reference number 05/Q0703/4) and the University of Gothenburg Research Committee (reference number 583-07).
Study protocol
All subjects were studied after an overnight fast. Patients with T2DM on insulin were asked to omit the morning dose of insulin during fasting. Written consent was obtained and a venous cannula was placed for sample collection. Following a baseline (time zero) samples (EDTA-plasma and fluoride oxalate), a standard test meal (157 mL, 400 kcal, carbohydrate 31.1 g, fat 26.7 g and protein 7.4 g) 16 was ingested over 5–10 min. Further samples (EDTA-plasma) were taken at every 30 min for 120 min. All samples were stored at −80℃ until analysis.
Analysis
Bile acid fractions
Extraction of BAs from plasma was performed as described previously. 17 BA fractions were analysed using high-performance liquid chromatography (Jasco, Essex, UK) tandem mass spectrometry (Applied Biosystems, Cheshire, UK). The method was linear between 0.1 and 10 µmol/L for all BA and their conjugates with coefficients of variation (CV%) of 1.5–6.8% at the lower limit of quantitation (0.1 µmol/L). The inter-assay CV was 3.6–8.0%.
Glucose
Glucose was measured on the ADVIA 2400 Chemistry analyser (Siemens Healthcare Diagnostics, Frimley, UK).
Statistical analysis
Statistical analysis was done using Analyse-It® (version 2.21, Leeds, UK) software. The distribution of all variables was tested using Shapiro–Wilk W test and analysed using Mann–Whitney U test. P value of <0.05 were considered to be statistically significant. Results are reported as median (interquartile range).
Results
Demographic data and biochemical results of the control and T2DM groups.
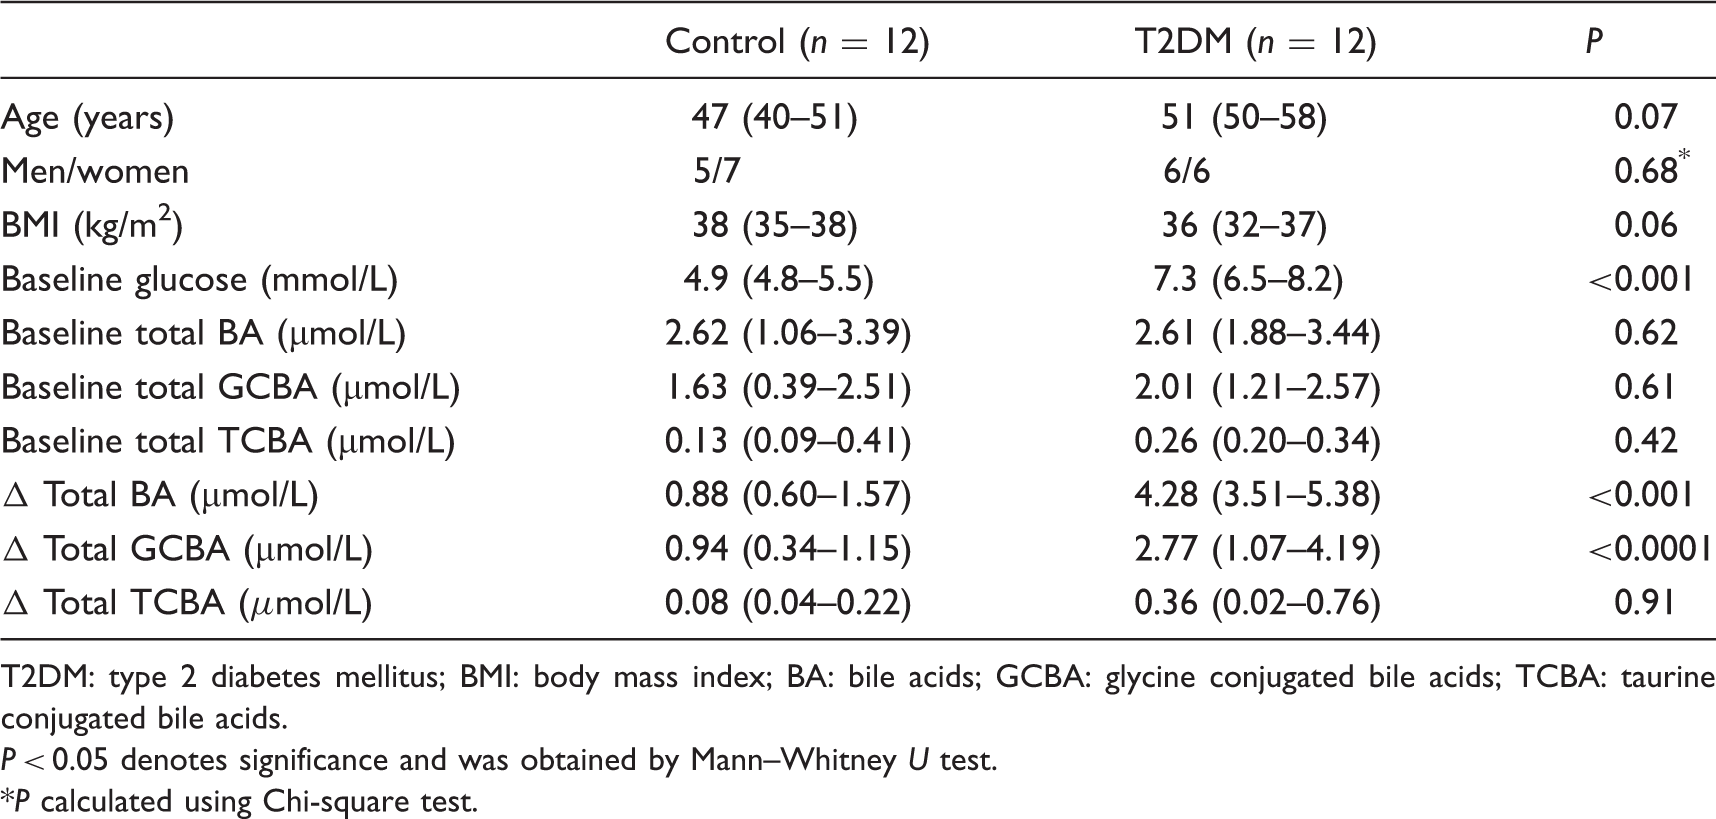
T2DM: type 2 diabetes mellitus; BMI: body mass index; BA: bile acids; GCBA: glycine conjugated bile acids; TCBA: taurine conjugated bile acids.
P < 0.05 denotes significance and was obtained by Mann–Whitney U test.
P calculated using Chi-square test.
Post-prandial change was defined as the difference (Δ) between the baseline and the maximum concentration attained after the standard test meal. The T2DM group showed exaggerated responses compared to the normoglycaemic group, with Δ total BAs 4.28 (3.51–5.38) µmol/L vs. 0.88 (0.60–1.57) µmol/L (P < 0.001) and Δ total GCBAs 2.77 (1.07–4.19) µmol/L vs. 0.94 (0.34–1.15) µmol/L (P < 0.0001). The Δ total TCBAs were similar between the T2DM and the normoglycaemic group 0.36 (0.02–0.76) µmol/L vs. 0.08 (0.04–0.22) µmol/L (P=0.91). The T2DM group had higher total BA concentrations at 90 min and 120 min compared to the normoglycaemic group (P < 0.05; Figure 1).
The post-prandial total bile acid response (median and interquartile ranges) for the normoglycaemic and type 2 diabetes mellitus (T2DM) groups. Open circles with dotted line, normoglycaemic group; closed circles with solid line, T2DM group. *denotes significance (P < 0.05).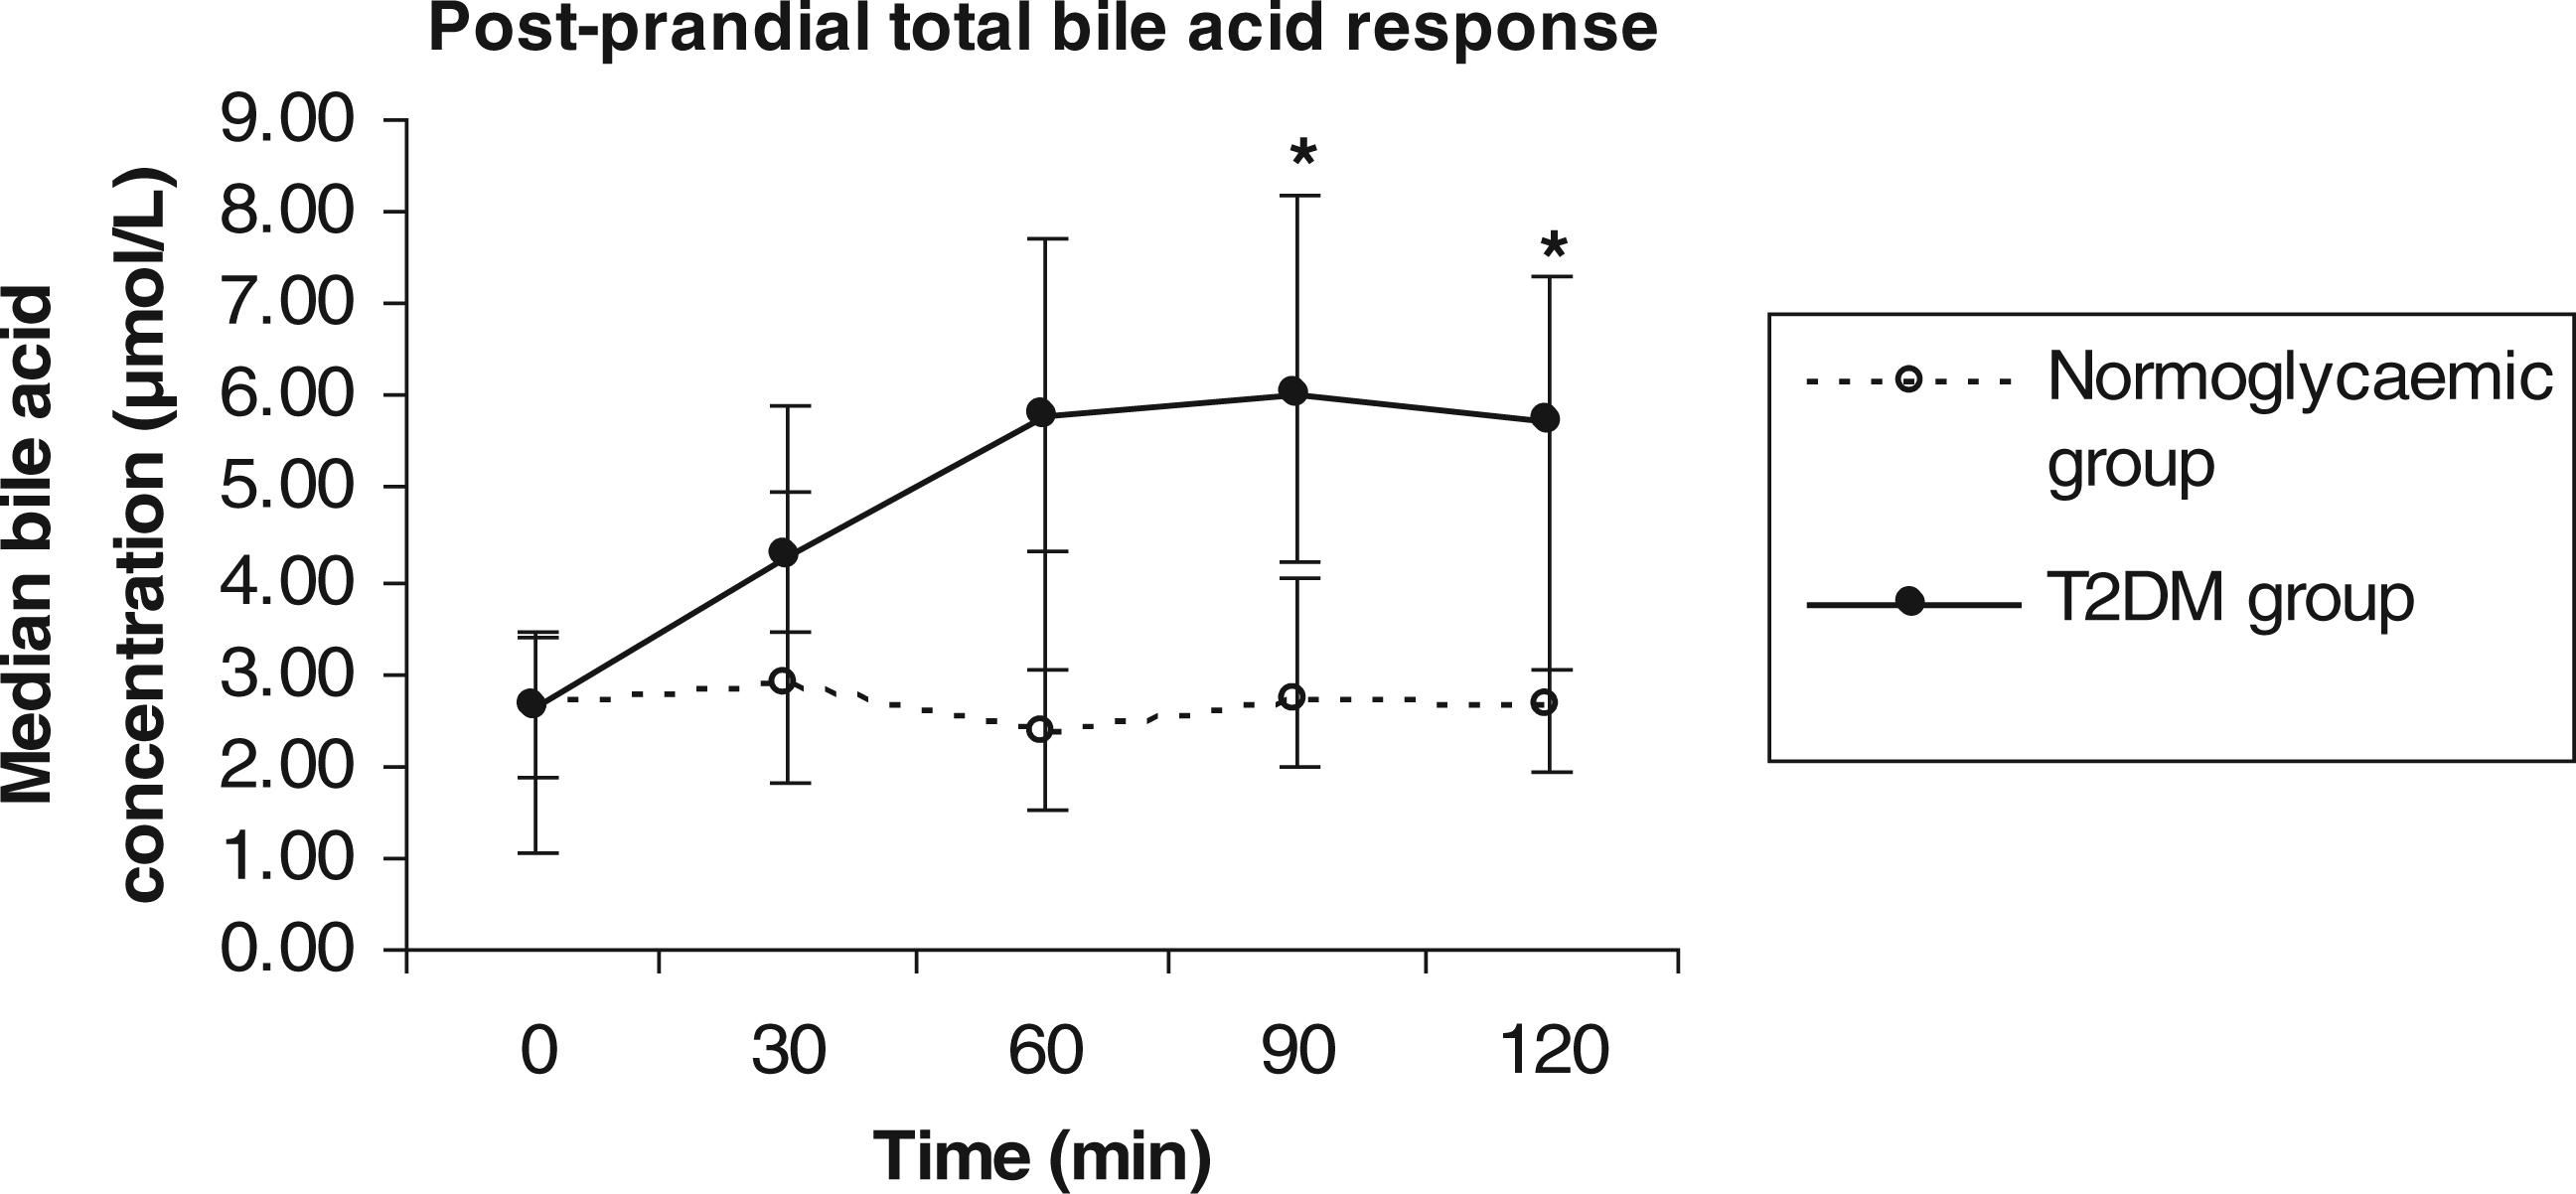
Discussion
BAs play an important role in the regulation of lipid, glucose and energy homeostasis. 1 Li et al. demonstrated that glucose induces mRNA expression of CYP7A1 in human hepatocytes which is the rate limiting enzyme of BA synthesis. 15 We have shown for the first time that in T2DM, post-prandial BA response is exaggerated compared to patients who are nomoglycaemic.
Plasma fibroblast growth factor-19 (FGF19) produced by enterocytes in the ileum in response to BA absorption also regulates hepatic BA synthesis by inhibiting CYP7A1. 18 Other factors that have been shown to inhibit CYP7A1 are insulin, 19 leptin, 20 cytokines 8 as well as BAs themselves, 8 whereas glucose stimulates CYP7A1. 15
We have previously shown that obese individuals have an attenuated post-prandial BA response to a meal stimulus compared to lean individuals. 12 The results obtained in our present study are comparable with our previous findings. In our present study despite both groups being obese, the T2DM group had an exaggerated post-prandial BA response. One possible explanation could be that glucose stimulation of BA overrides the other inhibiting factors of BA synthesis in T2DM to maintain GLP-1 concentrations as a compensatory mechanism. Other groups have demonstrated attenuated post-prandial GLP-1 concentrations in T2DM 14 compared to normoglycaemic individuals. Therefore, it is also possible that in T2DM higher BA concentration is required to stimulate GLP-1 release from the L-cells suggesting resistance to BA at the enteroendocrine L-cells. One of the limitations of our study is the small cohort thus our findings need to be confirmed in a larger cohort including normal weight patients with T2DM.
In this preliminary study, we have demonstrated a higher post-prandial BA concentration in T2DM compared to normoglycaemic individuals. Thus, BA metabolism appears up-regulated in T2DM.
Footnotes
Declaration of conflicting interests
None declared.
Funding
This research received no specific grant from any funding agency in the public, commercial, or not-for-profit sectors.
Ethical approval
The study was approved by the King’s College Hospital NHS Foundation Trust Research Ethics Committee (reference number 05/Q0703/4) and the University of Gothenburg Research Committee (reference number 583-07).
Guarantor
RPV.
Contributorship