
Abstract
Vibrational sum-frequency spectra encode information on the orientation and population of molecules at surfaces. Although orientation information can be extracted by simultaneously analyzing spectra acquired in two different beam polarization combinations, it is more difficult to isolate information on the surface population of adsorbed species when their orientation also changes. This is critical for the widespread adoption of this technique, as many systems are known to change their adsorbed structure in response to variation of the bulk concentration. Here we demonstrate that reconstructed sum-frequency spectra using the first principal component from a principal component analysis (PCA) markedly diminishes the spectral contributions due to molecular orientation. We show that the reconstructed spectra are excellent candidates for a subsequent surface-bulk heterospectral analysis to reveal the preference for a particular species to be adsorbed from a binary mixture.
This is a visual representation of the abstract.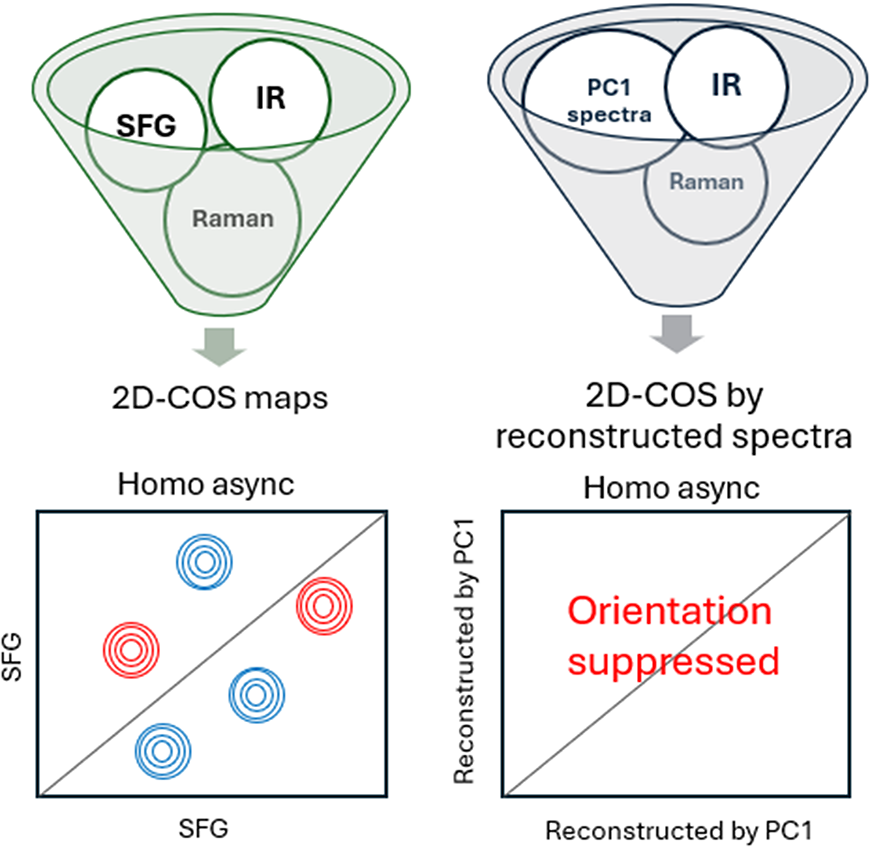
Keywords
Introduction
Technologies for sensing, promoting biocompatibility, and filtration rely on the selective adsorption of specific molecules from the ambient gas or liquid–solution phase.1–3 Although a perfect selectivity is not necessary achieved or desired, surfaces are often inherently or intentionally tailored to exhibit a preference for a particular analyte. The mechanism of selectivity is often linked to non-bonded interactions resulting from charge or hydrophobicity.4–6 Over the last few decades, vibrational sum-frequency generation (SFG) has been developed into a versatile technique for studying surfaces and buried interfaces with remarkably specificity for interfacial species that are distinguished from the bulk on the basis of symmetry.7–9 Since the generation of light at the sum-frequency is a second-order nonlinear optical effect, it requires a break in the inversion symmetry found in isotropic achiral phases. 10 However, even though the non-centrosymmetric requirement forms the basis of the sought surface-selectivity, it also results in the measured signals being extremely sensitive to the orientation and conformation of molecules on surfaces. Although this is a bonus overall, as SFG has been proven to be a capable method to extract quantitative surface orientation information,11–14 it also means that the effects of surface population (i.e. the surface number density) and molecular orientation need to be separated. If the ultimate goal is to comment on the orientation, the most common approach is to perform the analysis based on ratios of signals obtained using two different beam polarization combinations, thereby effectively canceling the effect of the population of molecules. However, the opposite study is more challenging, as there are not many techniques that can restore the linearity of the signal with respect to population from the overall nonlinear variation due to re-orientation of surface-adsorbed species.
We previously described a technique whereby SFG spectra collected under varying concentrations of species in the bulk are analyzed together with bulk infrared (IR) and/or Raman spectra.15–17 Heterospectral two-dimensional correlation spectroscopic (2D-COS) analysis provides an ideal platform for this comparison.18–20 Using heterospectral 2D-COS, the relative changes in surface and bulk signals can be used to reveal the surface preference for a particular species. However, in consideration of the above points, this can be true only if all of the SFG signal can be attributed to changes in surface population. In other words, we need to be sure that, at least for the moiety associated with a particular vibrational mode, there are no contributions to the changing SFG signal from reorientation. Fortunately, 2D-COS also provides a sensitive means for this check, as the asynchronous component of the SFG homospectral 2D-COS readily reveals any reorientation.15,16 Although we have demonstrated that this is a useful analysis procedure, it still leaves a large number of cases where molecules accumulate on the surface and reorient as they become more crowded, and are therefore excluded from surface preference analysis. We therefore have been looking for a way to modify this method so that it is more universally applicable.
It has been recognized that the power of 2D-COS can be extended when combined with chemometric methods such as principal component analysis (PCA).21–25 PCA is known for its ability to capture the most dominant features in revealing trends across datasets, and is therefore an attractive option for assisting our desire to uncover trends in surface population when the bulk population changes. Here we demonstrate that a reconstructed SFG spectrum using only the first principal component (PC1) obtained from PCA is an ideal candidate for a heterospectral 2D-COS-based procedure that includes bulk IR and/or Raman data. We will first demonstrate this using model spectra whose surface population is known from the simulation parameters. This is also an opportunity to illustrate that the technique works because PC1 is highly correlated to the surface population. We then show that this can be applied to the analysis of surface preference using experimental spectra from a binary mixture of heptane and toluene in contact with a hydrophobic surface, resolving previous ambiguities regarding this system.
Background and Methods
Model Spectra
Model IR, Raman, and SFG spectra were created for methanol and glycerol from density functional theory using B3LYP/6-311G(d,p) and a Lorentzian profile with a half-width at full maximum (HWFM) of 10 cm−1. An empirically-determined frequency scaling factor of 0.935 was used, which is lower than the gas-phase value recommended for this basis set,
26
but provides better agreement with experimental results in the condensed phase. To characterize the bulk solution phase, either IR or Raman spectra can be used, but we prefer to construct a hybrid IR
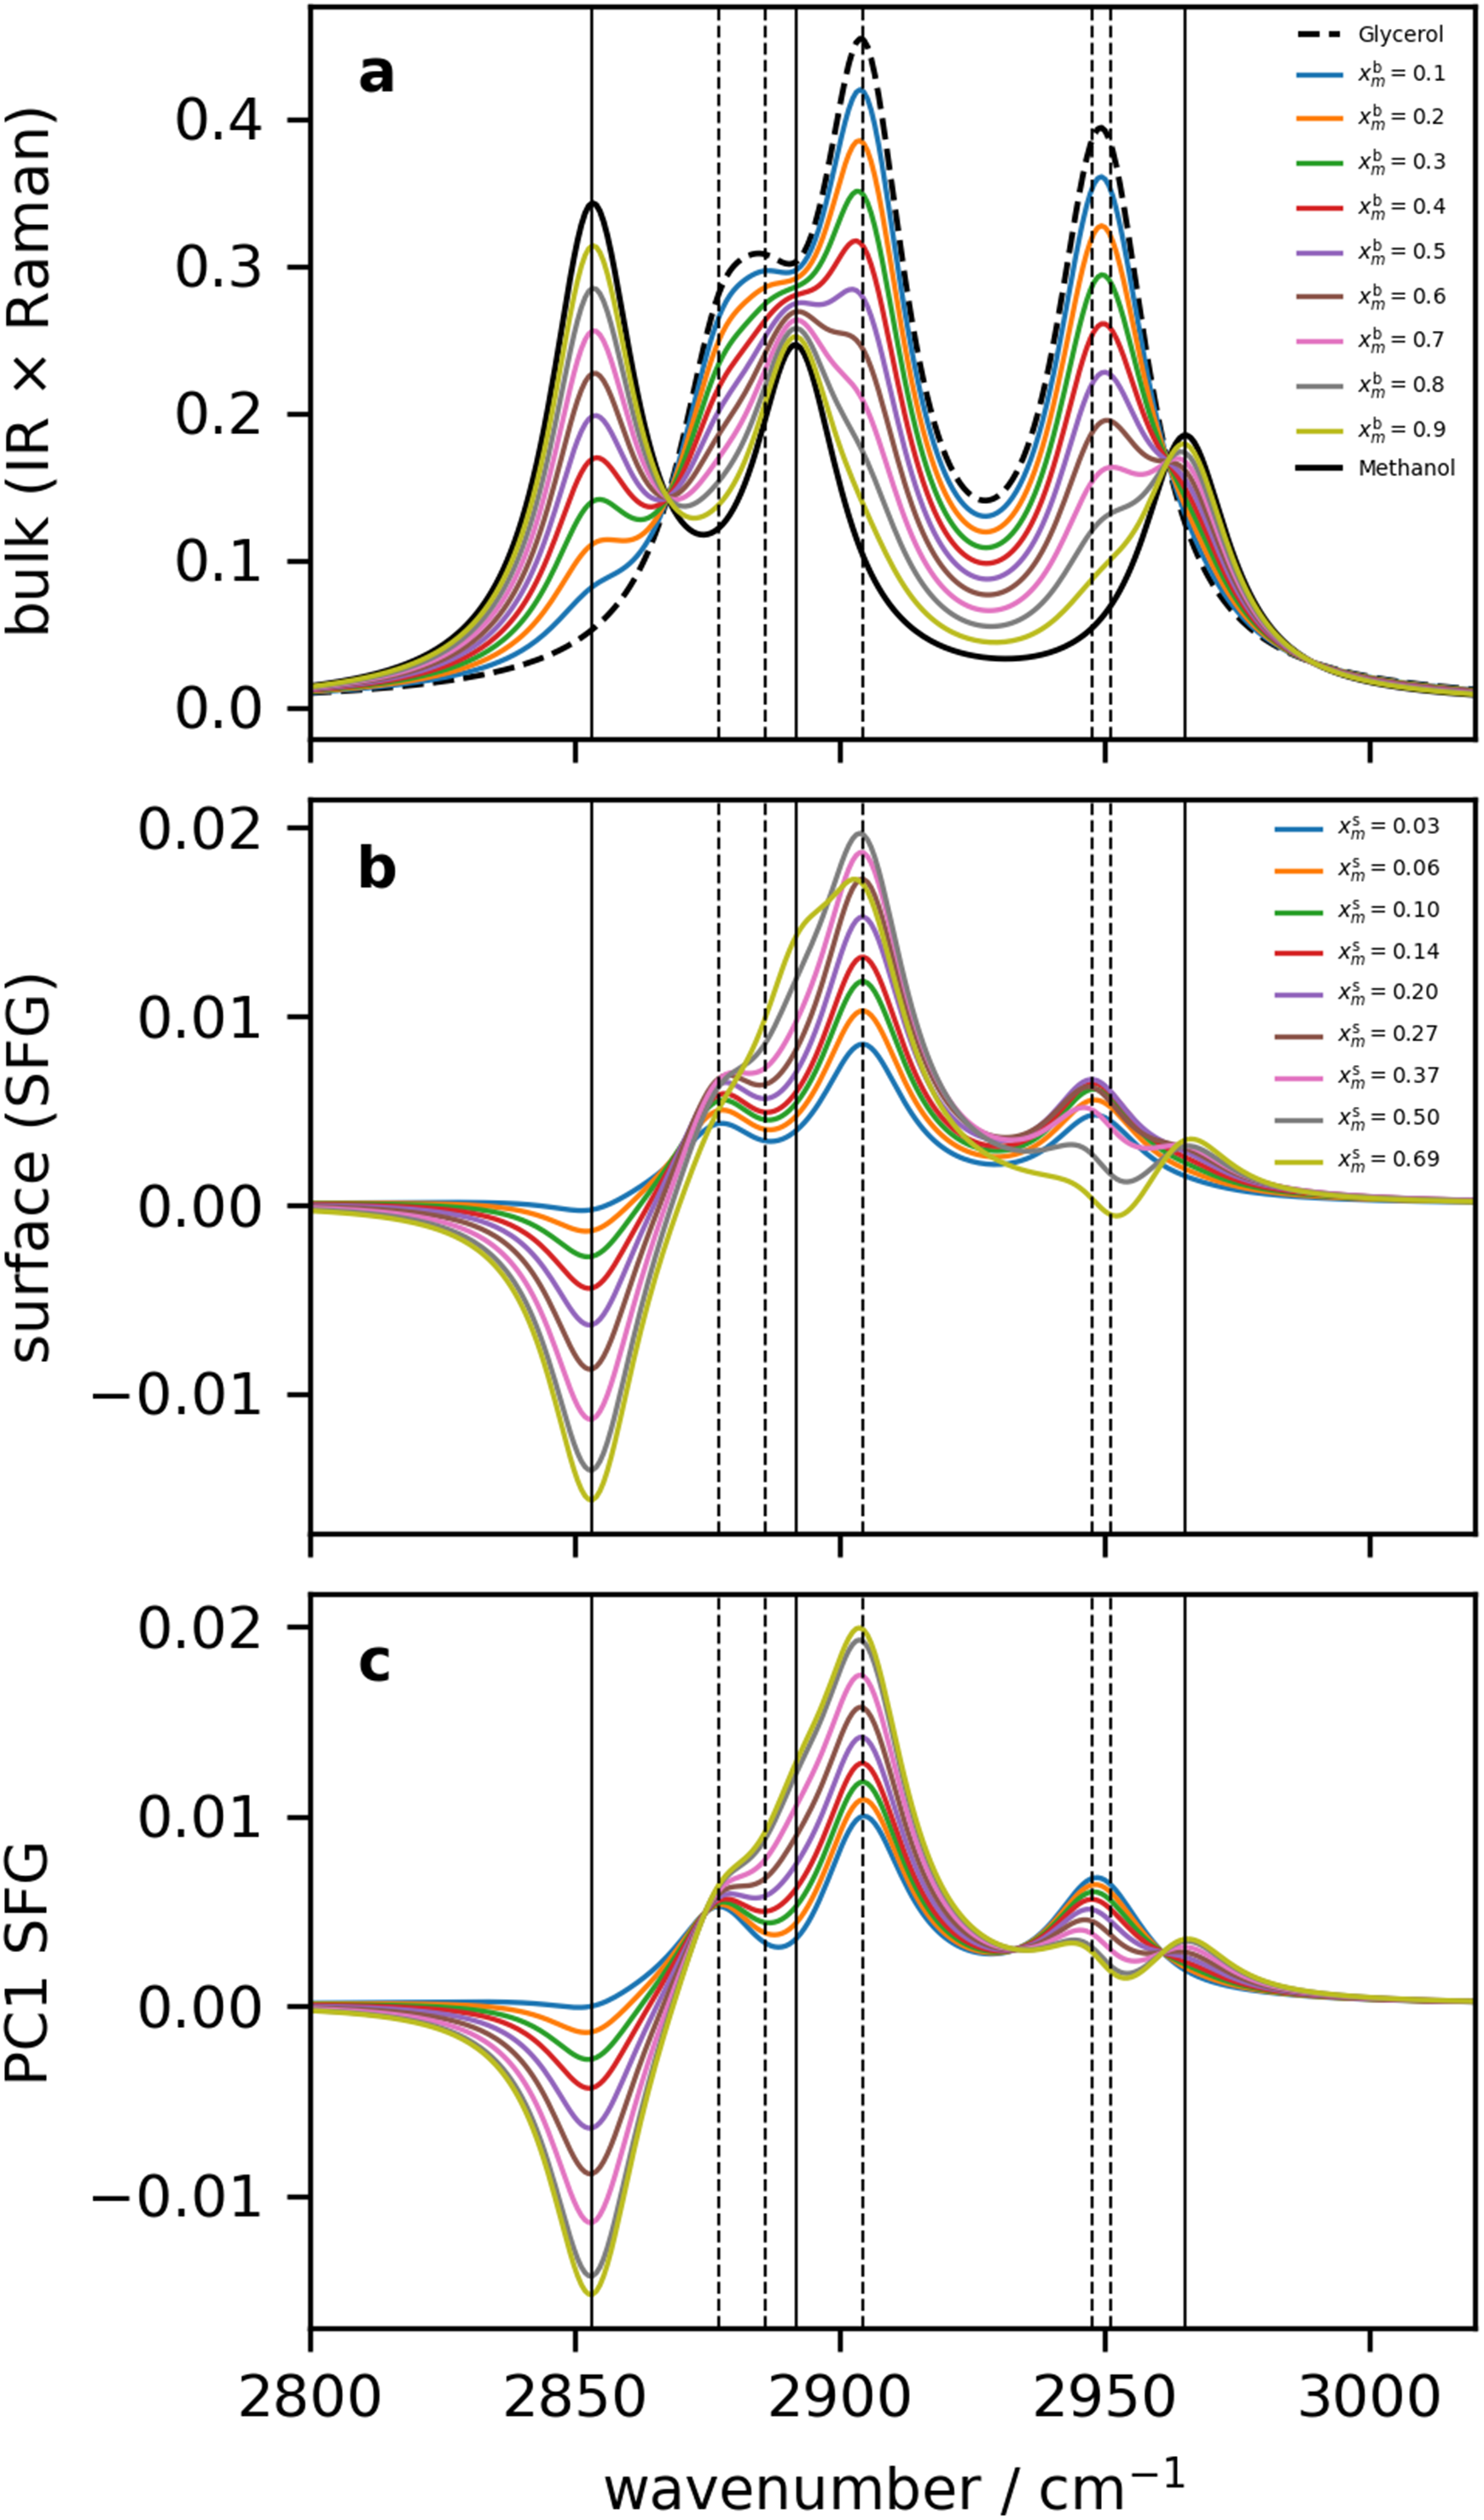
Model spectra for methanol–glycerol mixtures generated for (a) the bulk solution phase using a combination of the IR and Raman response, (b) the surface SFG response, and (c) the SFG response reconstructed from PC1. The pure methanol spectrum is shown with the solid black trace, and its characteristic frequencies are indicated by solid vertical black lines. The pure glycerol spectrum is shown with the dashed black trace, and its features are highlighted with vertical dashed black lines. The mixtures are indicated by colors described in the inset legends. The perturbation proceeds in the direction of increasing bulk methanol mole fraction.
We next construct

Experimental Spectra
Full details of the sample preparation and the experimental conditions have been described previously.
16
In brief, high-performance liquid chromatopgraphy (HPLC) grade heptane and toluene (Fischer Chemicals) were used to prepare mixtures of the two liquids. Bulk Raman spectra were collected using a commercial Raman spectrometer (Renishaw InVia) with 532 nm excitation using a custom liquid cell. Bulk IR absorption spectra were collected using Fourier transform infrared (FT-IR) (Perkin-Elmer Spectrum Two) on the surface of a single-bounce diamond ATR crystal. The hybrid IR
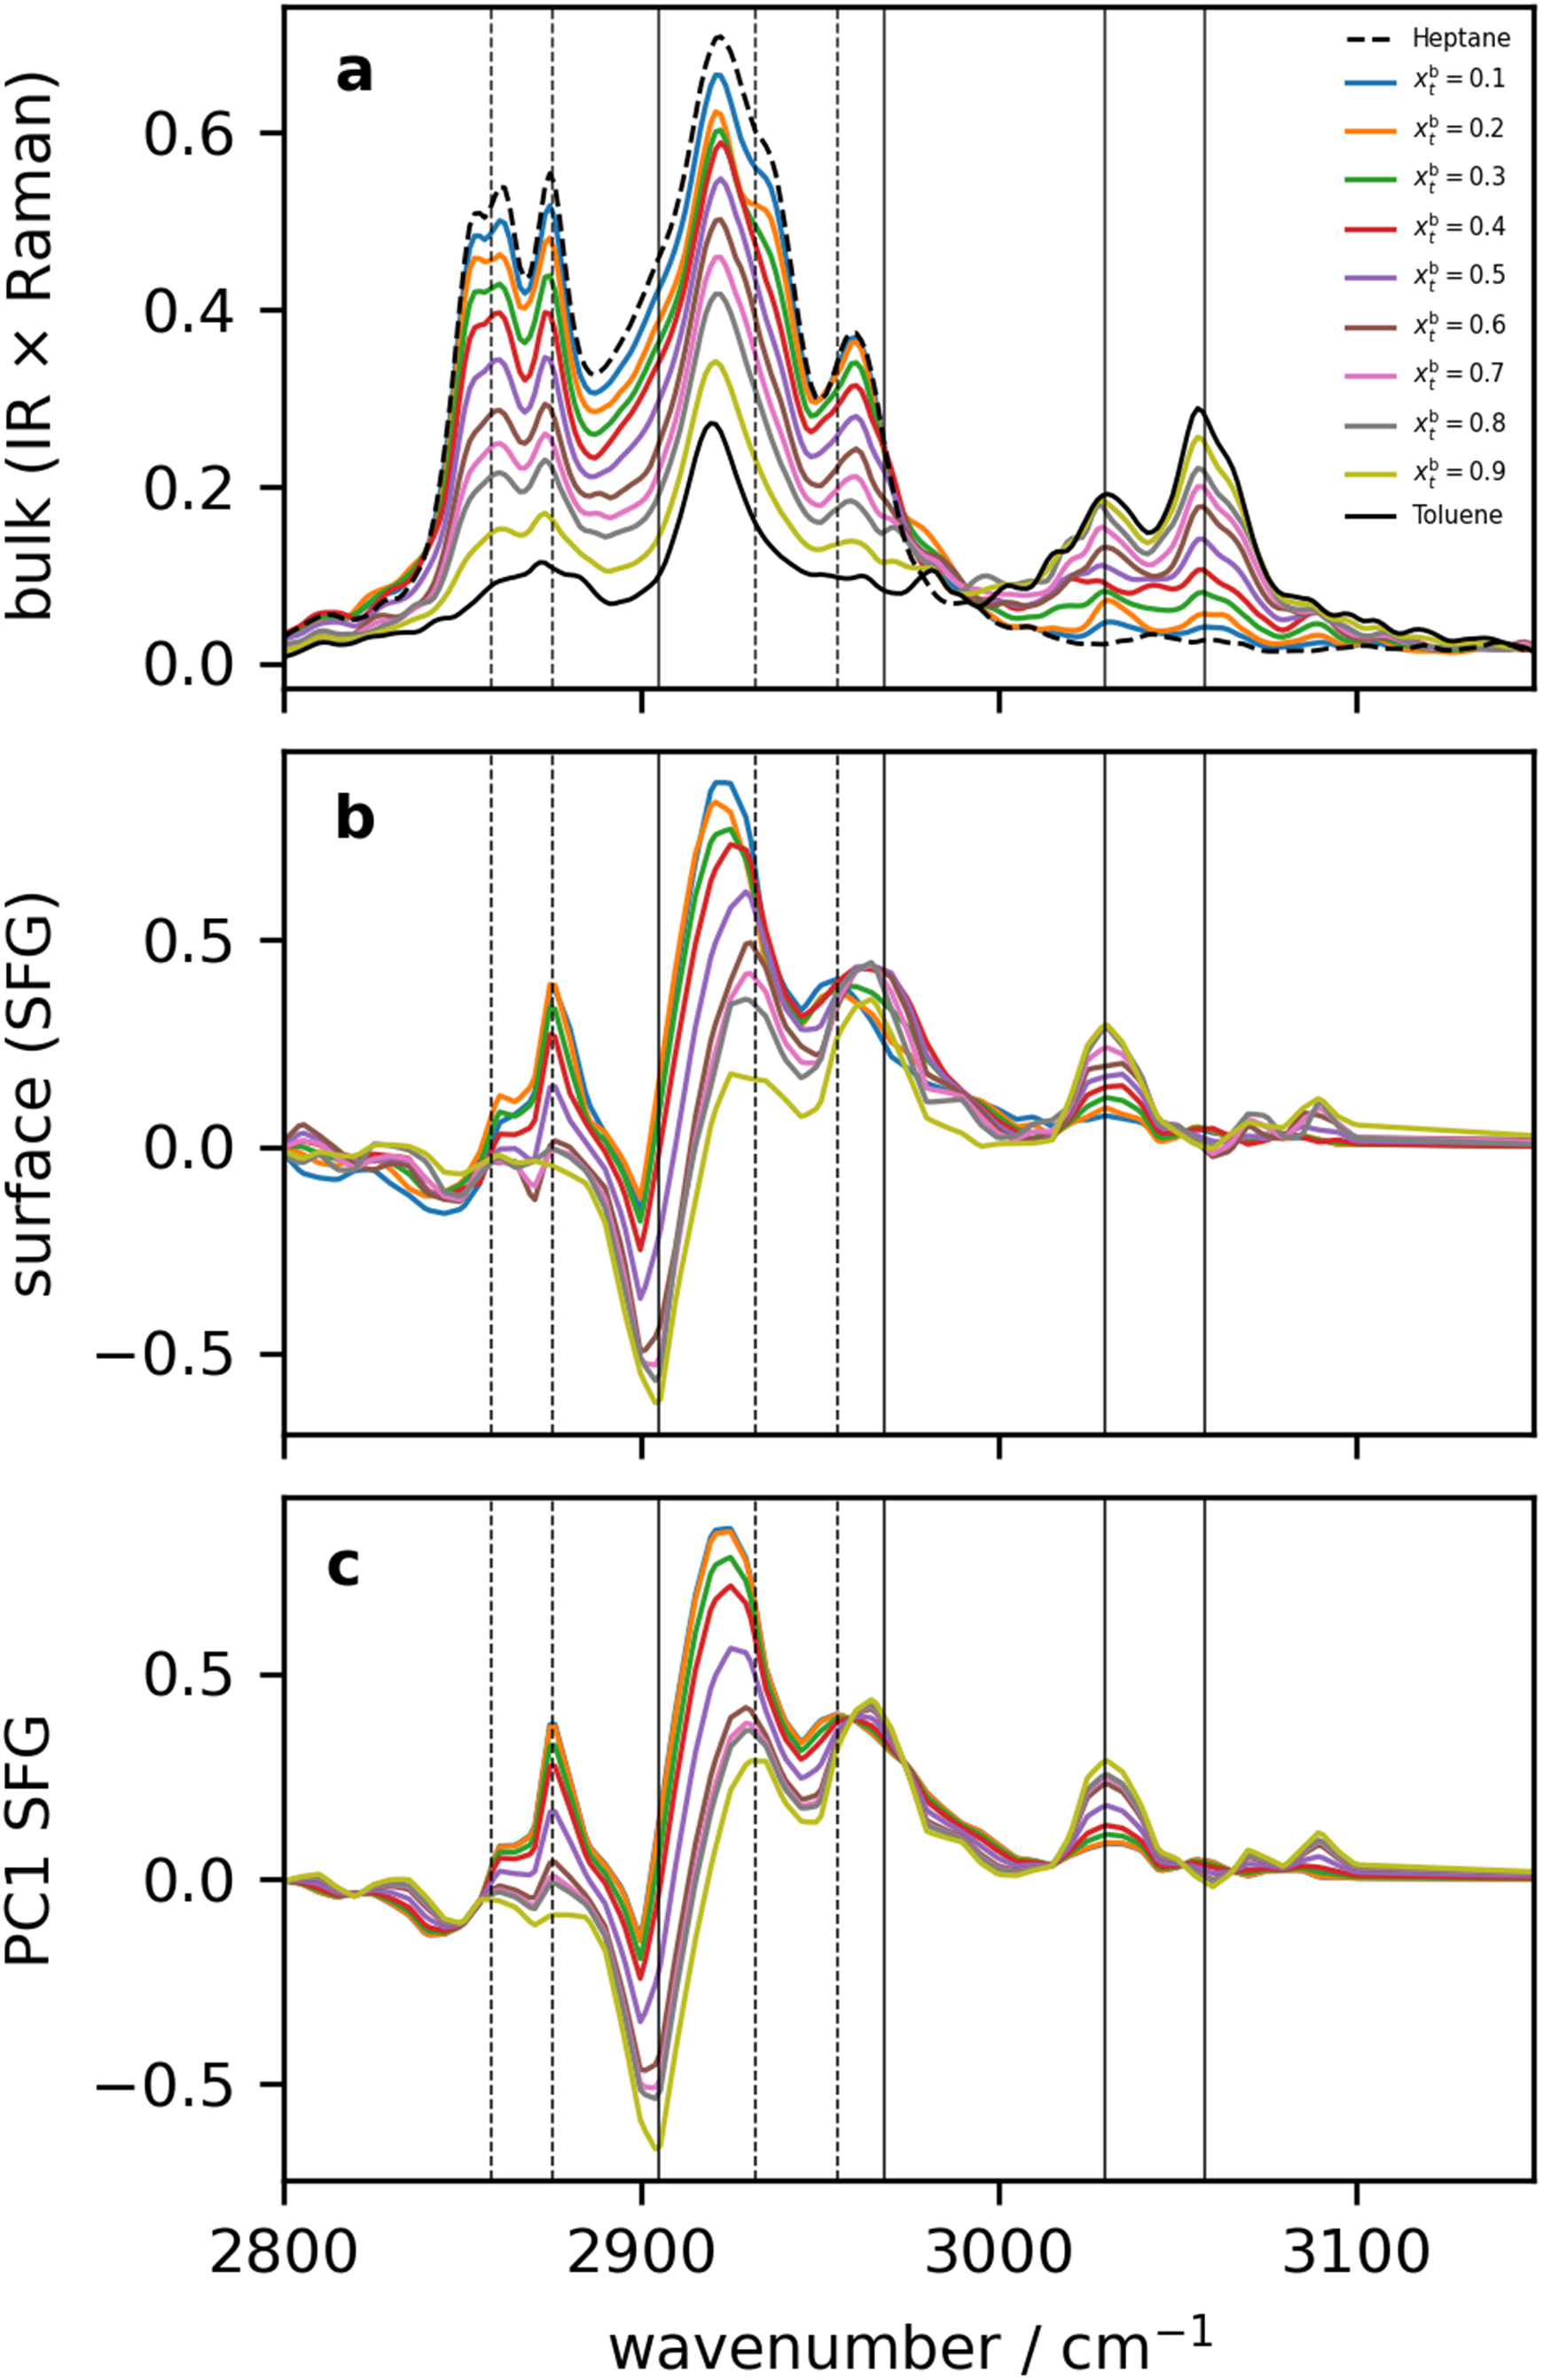
(a) Bulk hybrid IR
For the surface studies, a thin film of Teflon-AF (Chemours, USA) was spin coated from FC-40 (Sigma Aldrich, Canada) onto the surface of a prism. The film side of the prism was pressed against the opening of a custom liquid cell that we have designed for use with our sum-frequency generation (SFG) setup. 28 In the SFG experiments, a 1064 nm picosecond yttrium aluminum garnet (YAG) laser (Ekspla PL2241A) was doubled to create a 532 nm visible beam and an OPA (Eskpla PG501) was used to create tunable mid-infrared light. SFG spectra were processed to determine the imaginary component of the susceptibility (for better linear additivity of the contributions of the two liquids) using a maximum entropy (MEM)-based method described previously,16,29 resulting in the profiles shown in Figure 2b.
Principal Component Analysis
Even so-called “1D” vibrational spectroscopies (IR, Raman, SFG, etc.) produce high-dimensional data in the sense that an absorption spectrum may have hundreds of data points along the wavenumber axis. Such rich spectral datasets contain valuable chemical information, but the sheer number of variables (wavenumbers) and the overlap of broad spectral peaks make direct interpretation challenging. PCA is a multivariate analysis technique that addresses this challenge by reducing data dimensionality while preserving most of the variance and information in the dataset.30,31 This approach is often used to simplify complex datasets by transforming them into a new coordinate system that highlights their most significant features. PCA finds a set of new orthogonal axes, called principal components, which successively capture the major patterns in the data.
32
These new axes are linear combinations of the original variables, capturing the most important patterns in the data while discarding noise and redundancy. The first principal component is the line that best fits the data in a least-squares sense (maximizing the variance of projective distances).33,34 The second component is the next best-fitting line perpendicular to the first, and so on, each capturing as much remaining variance as possible while being orthogonal to earlier components.
35
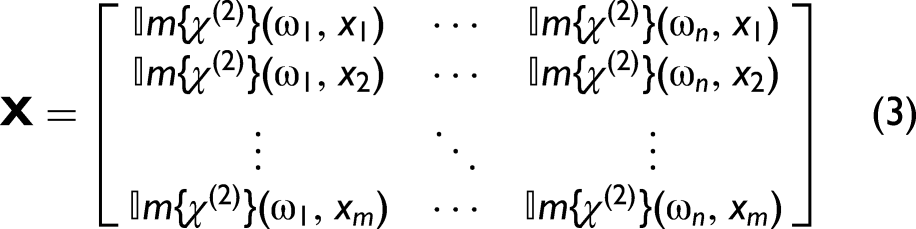
PCA outputs two key sets of parameters for the dataset: scores and loadings. Each principal component is defined by a loading vector, which contains the coefficients by which the original variables are linearly combined to form that component. The loadings indicate the weight or influence of each original spectral variable (wavenumber) on that PC. While loadings describe the PCs in terms of variables, the scores describe each sample in terms of the PCs. Every sample gets a numerical score for each principal component, computed by projecting the sample’s data onto that PC axis. In summary, scores tell us how much of each principal component each sample contains, whereas loadings tell us what each principal component represents in terms of original variables. In our system the SFG data set


Results and Discussion
Model System
To illustrate the challenge in interpreting the surface preference, we first inspect the homospectral 2D-COS obtained using SFG data. As we have described previously,
15
the SFG homospectral synchronous map (Figure 3a) does not provide any information useful for surface preference determination. The analysis therefore starts by a careful examination of the asynchronous map. In order to subsequently interpret the heterospectral signals in terms of surface populations, we require that the molecules don’t reorient as their surface population changes. Figure 3b displays many strong homospectral SFG asynchronous cross-peaks, indicating that reorientation of both methanol and glycerol significantly contribute to their SFG response. We have previously described that, if only one molecule (or part of a molecule) reorients, it may still be possible to continue with the population analysis if the other species or a different part of the molecule doesn’t produce homospectral SFG asynchronous modes.
15
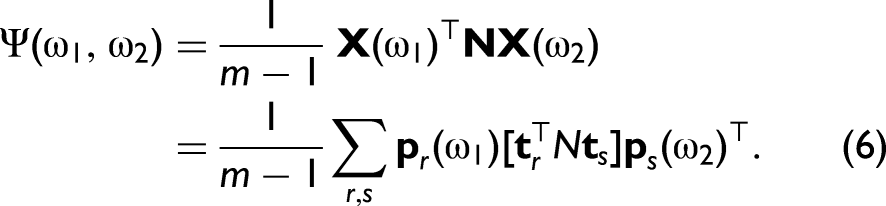
In the present study, however, we have intentionally modeled a situation where both species reorient. A cautious approach would therefore stop at this stage, with no conclusion about the surface preference possible. However, we briefly consider proceeding to look at the heterospectral surface-bulk 2D-COS to explore the possibility that the spectral changes might be dominated by surface populations. Looking at the glycerol peak at (2904, 2951 cm−1) in the heterospectral synchronous (Figure 3c) and asynchronous maps (Figure 3d), the corrected async cross-peak sign is positive, indicating that the decrease in bulk glycerol occurs before the surface glycerol response decreases. This would normally be an indication that the surface prefers glycerol. Since we know that
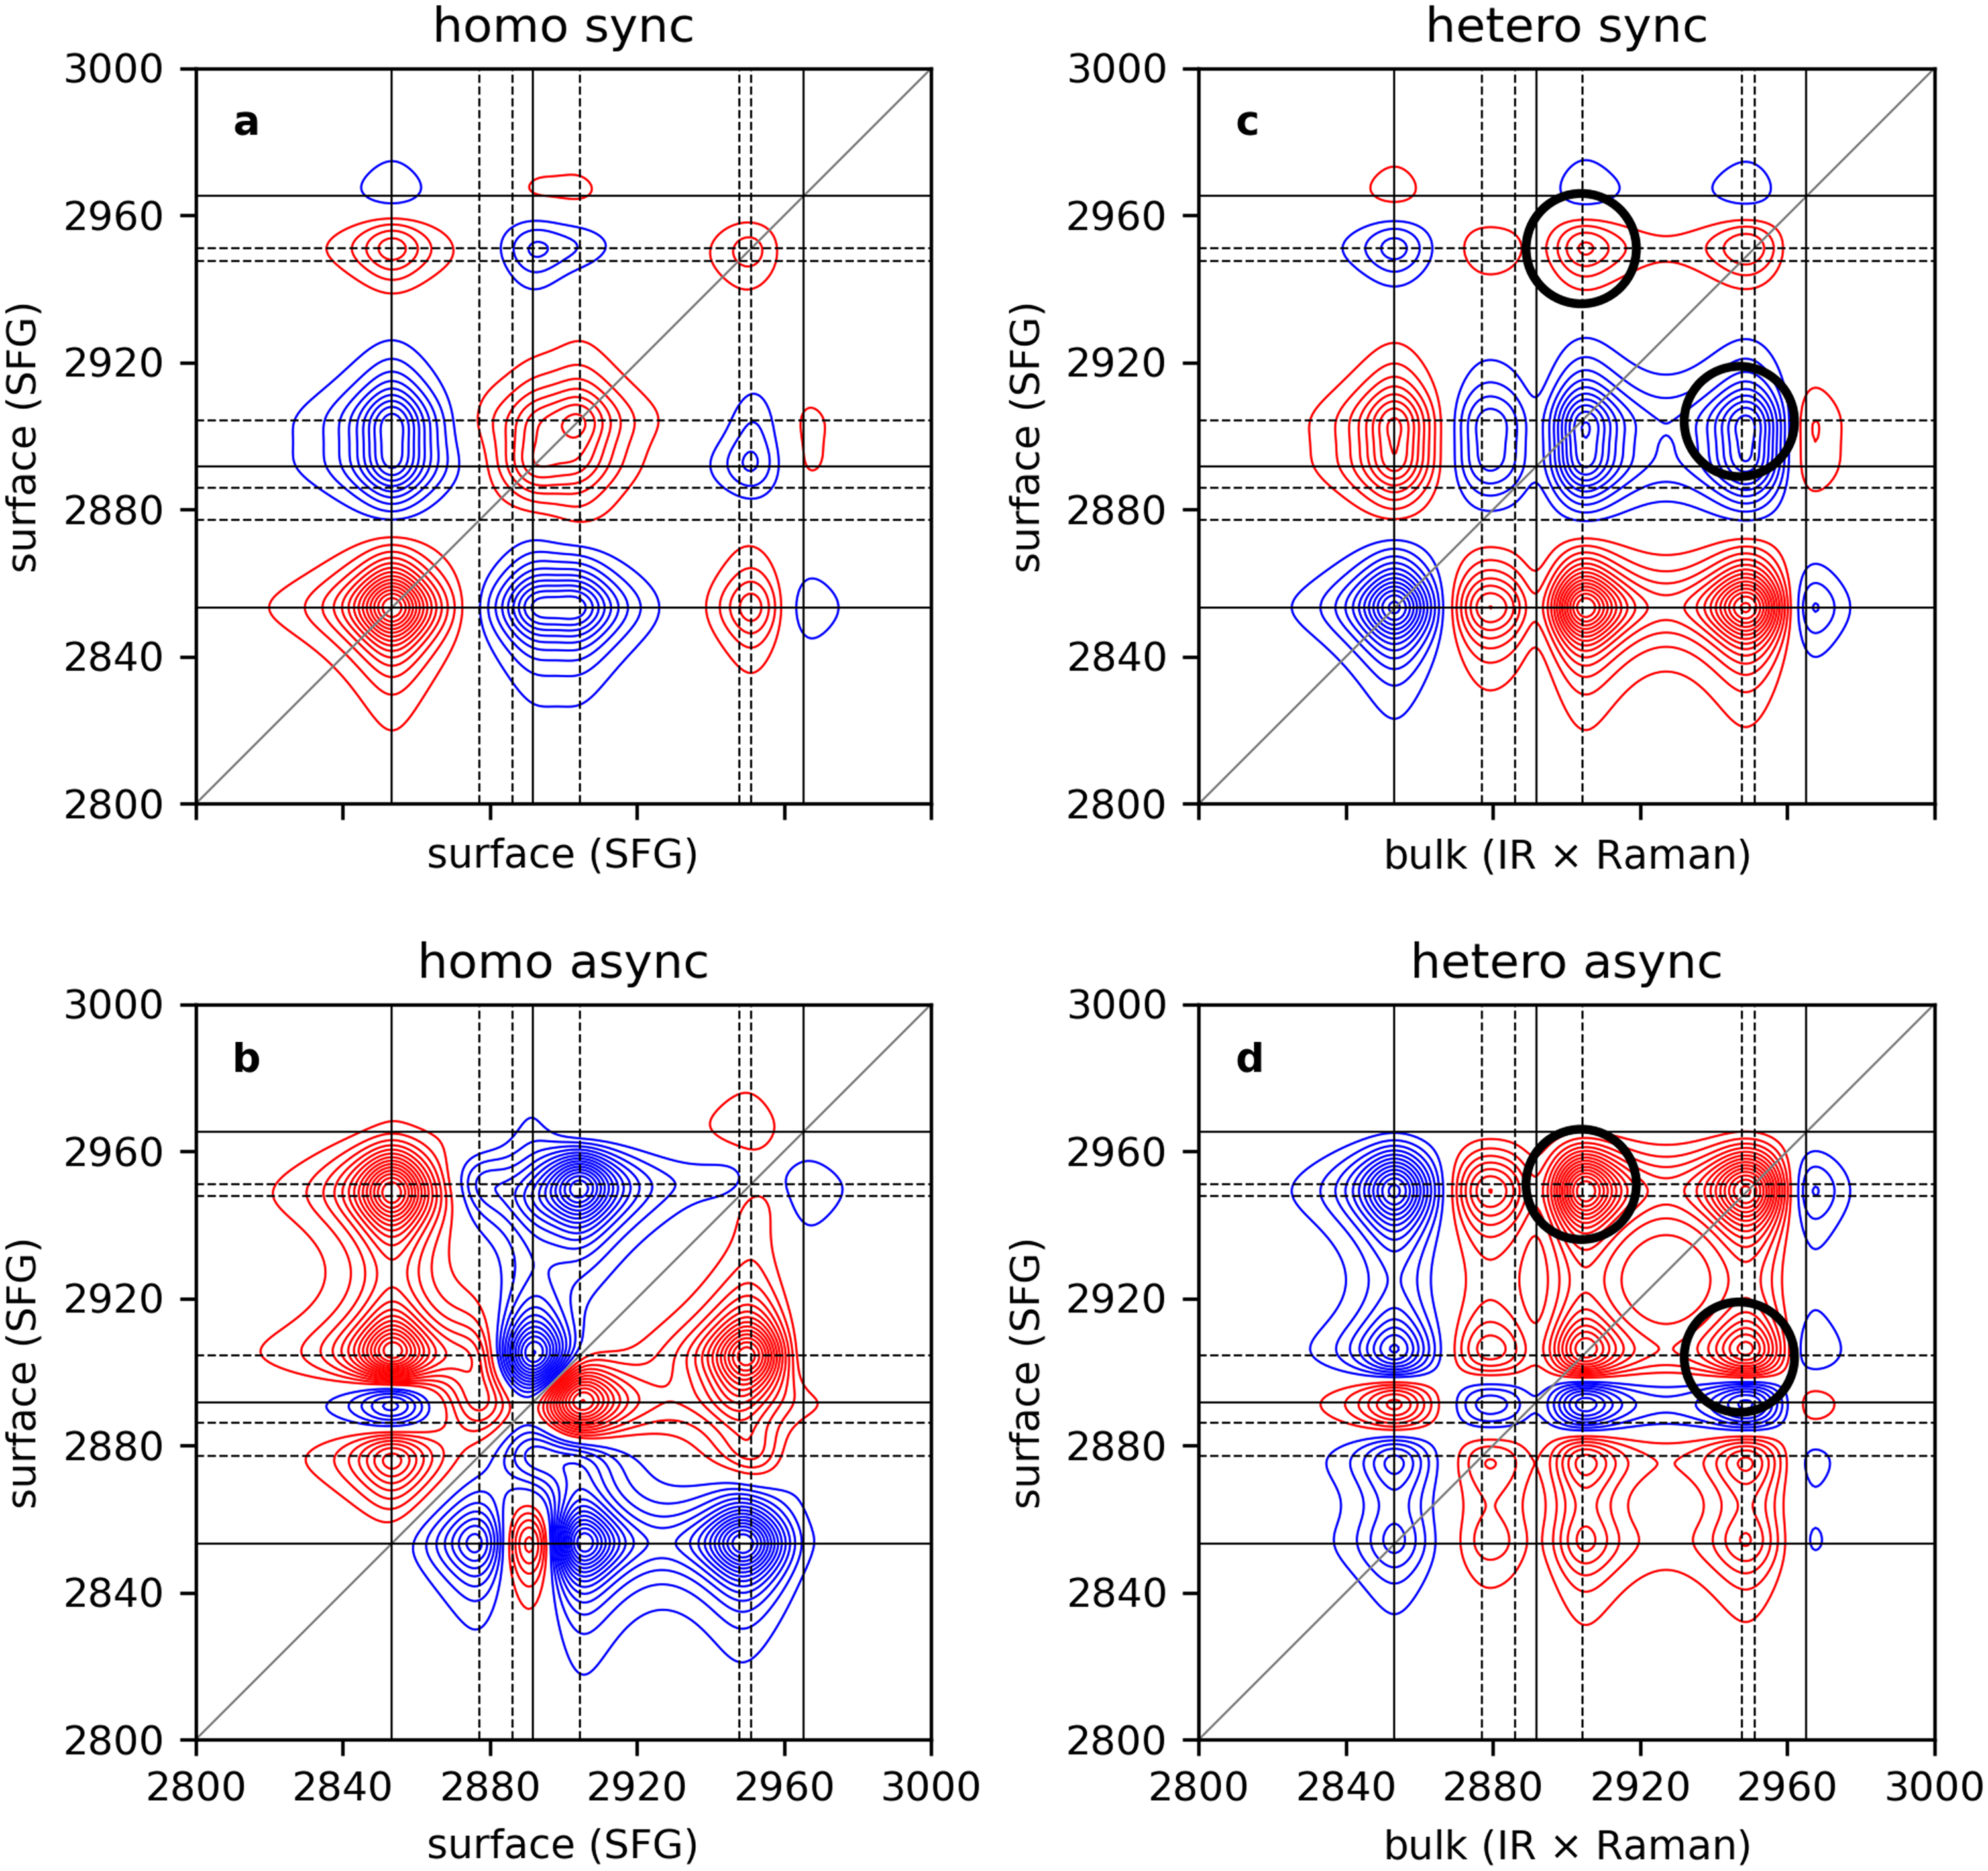
(a) Synchronous and (b) asynchronous homospectral 2D-COS obtained from the SFG spectra. (c) Synchronous and (d) asynchronous heterospectral 2D-COS constructed using IR
To find a general solution to this problem, we look for a way to separate the effects of population-dependent surface reorientation from the sought surface population changes. Since our perturbation changes the bulk concentrations in a drastic manner (
We now use these PC1 SFG spectra in place of the raw SFG spectra for our 2D-COS analysis. The similarity in the SFG homospectral synchronous response (comparing Figures 3a and 4a) is reassuring, as we don’t want to perturb the spectral lineshape significantly. The first striking observation is the absence of any SFG asynchronous peaks in Figure 4b. Although this appears to be a success, we need to be careful before reaching any conclusions about the degree to which we have removed reorientation effects, as it is known that any homospectral correlation between principal components (PC
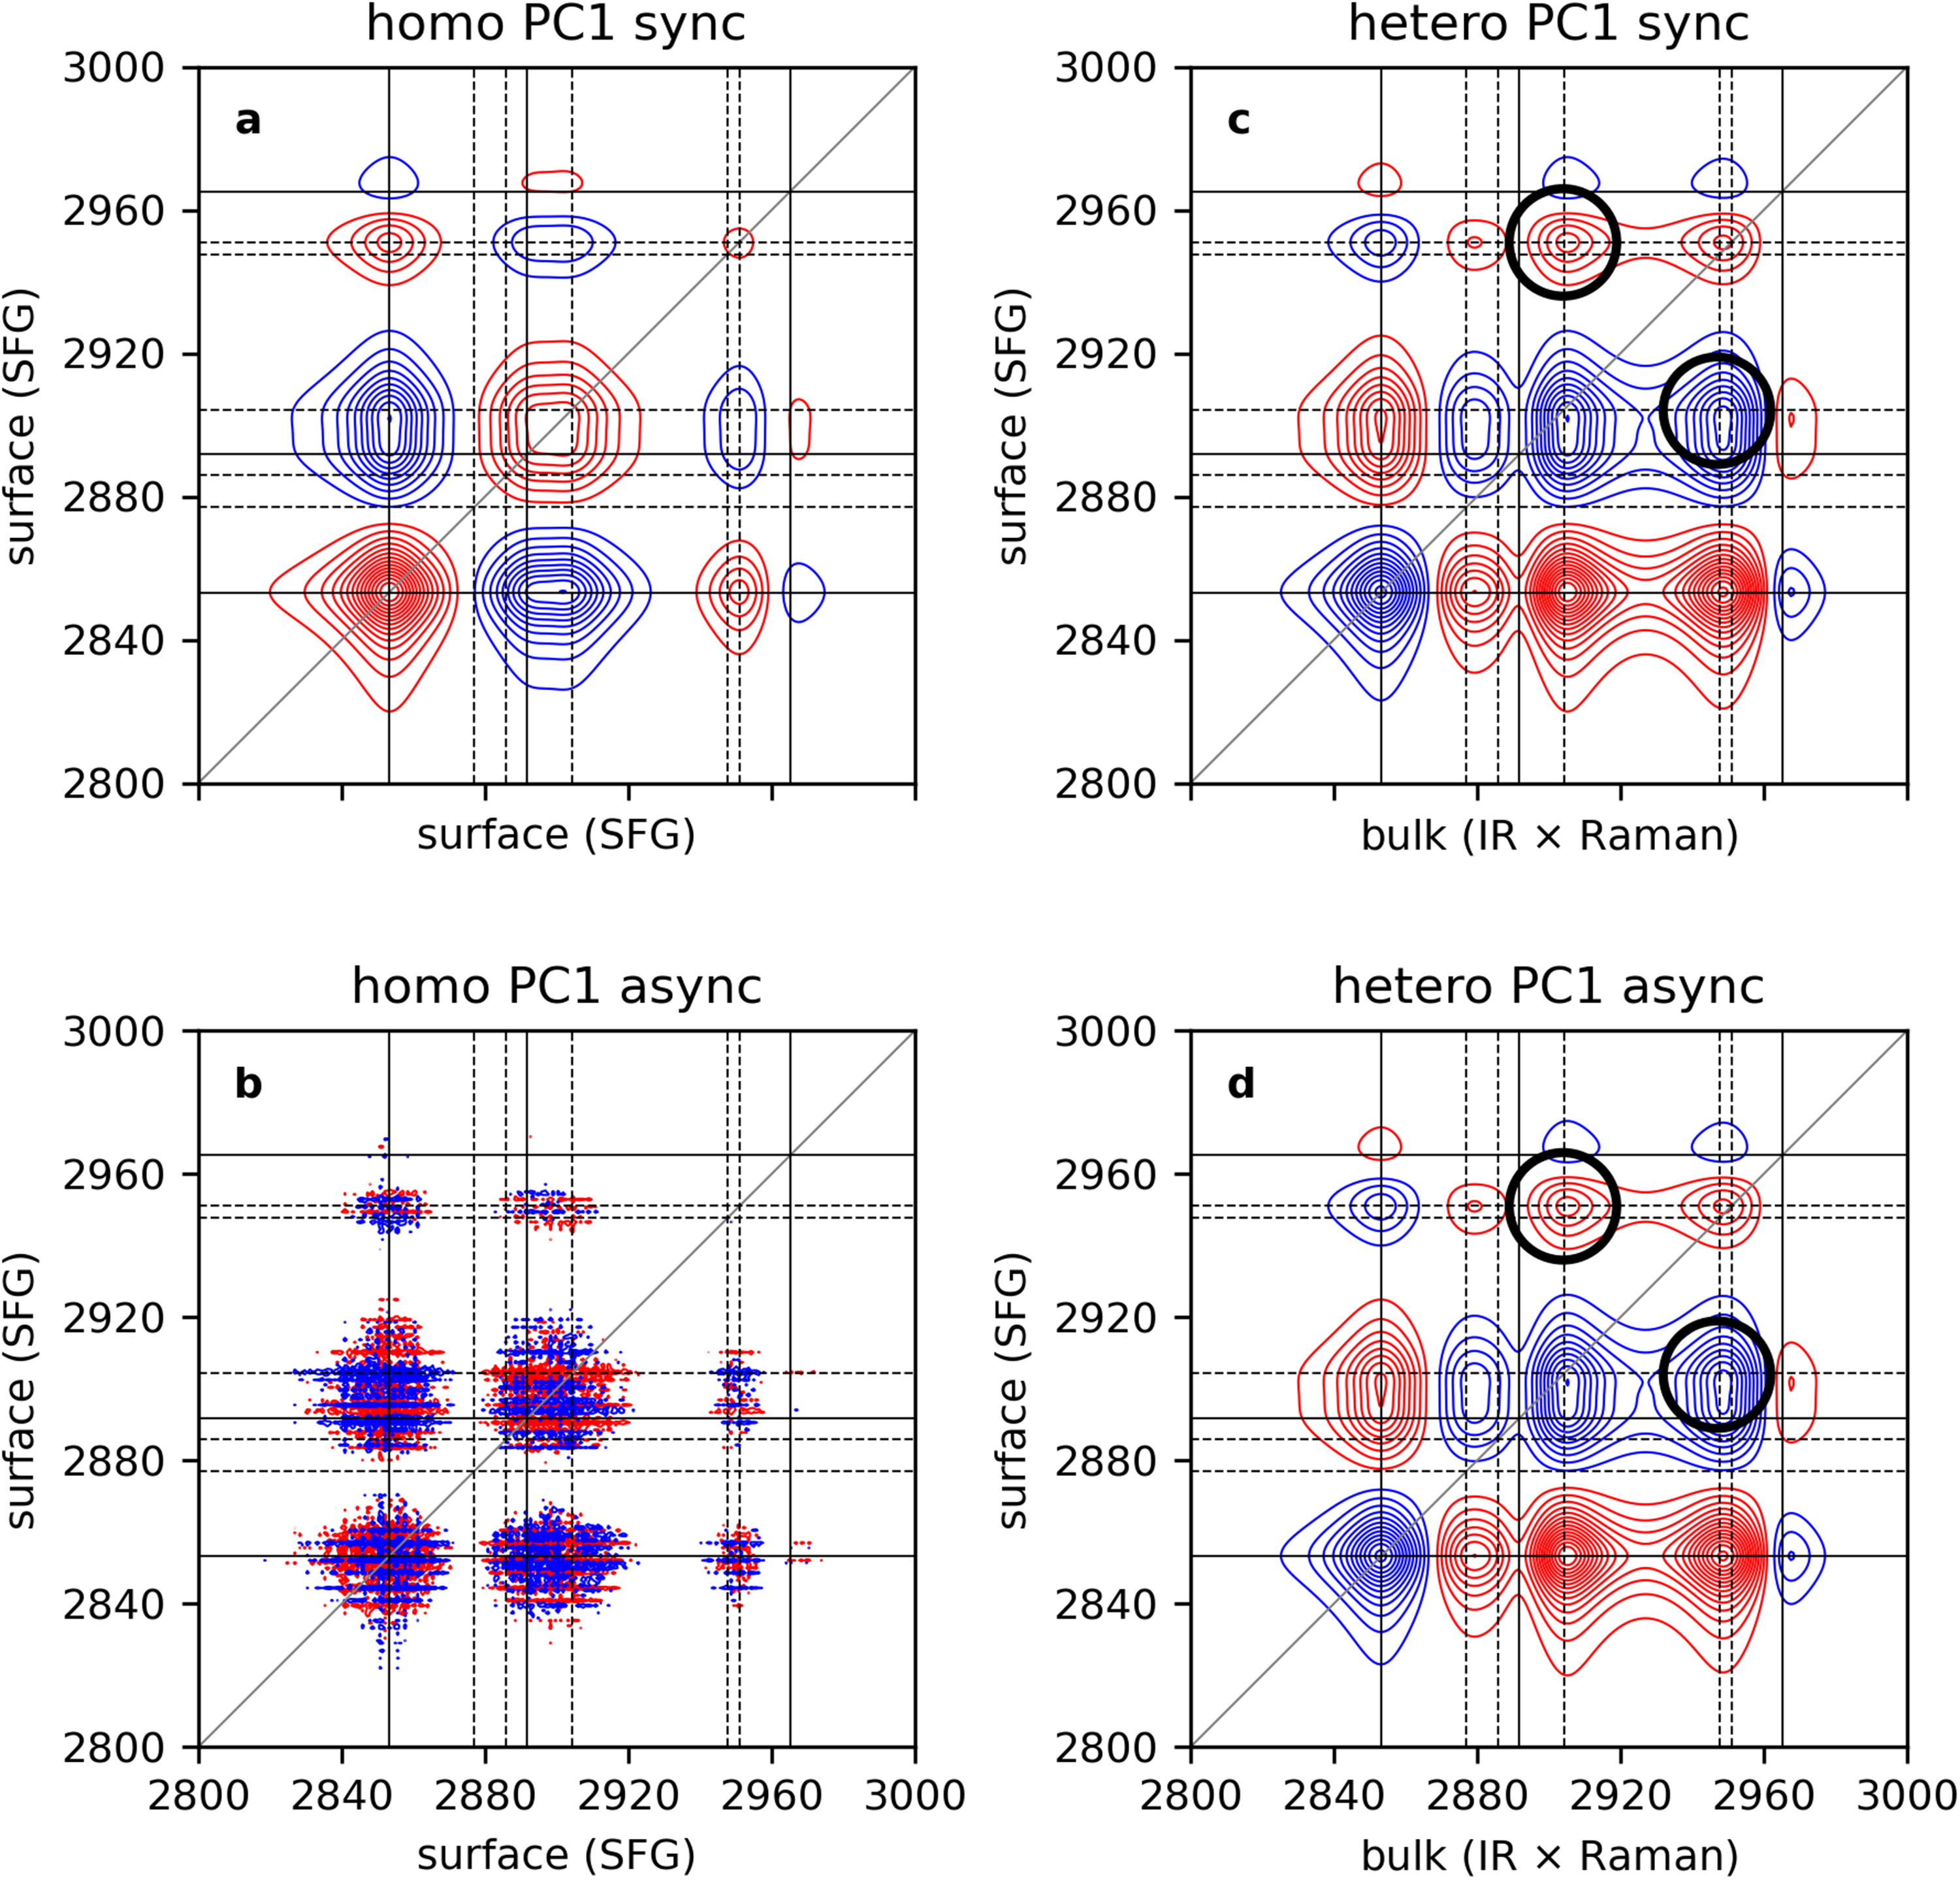
(a) Synchronous and (b) asynchronous homospectral 2D-COS obtained from SFG spectra reconstructed using PC1 only. (c) Synchronous and (d) asynchronous heterospectral 2D-COS constructed using IR
We therefore examine the result of our action based on the correlation of the original and PC1 SFG spectra with the surface populations. Initially, the SFG dataset consisted of a matrix of size

In the case of the SFG spectra reconstructed using the first principal component (PC1), applying the same procedure shows that the slopes at each wavenumber,
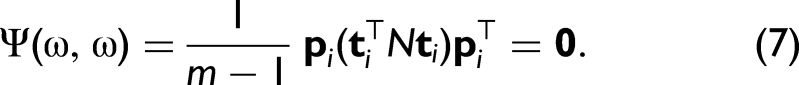
Now using the heterospectral surface(PC1)-bulk correlation synchronous signs in Figure 4c to interpret the signs of the asynchronous cross-peaks observed in Figure 4d, we see that the (2947, 2904 cm−1) peak has become positive. In fact, all modes in the asynchronous map now have the correct signs, consistent with our knowledge (
Experimental Demonstration
We now provide a demonstration using experimental data that we previously collected for binary mixtures of heptane and toluene that are co-adsorbing on a hydrophobic fluropolymer surface. We have previously shown that the homospectral SFG asynchronous spectrum showed cross-peaks for both heptane and toluene, technically eliminating the possibility of further analysis to obtain the surface preference if we were to adhere to the rules strictly. However we noted that the evidence of heptane reorientation was weak, so we decided to continue with the analysis of the heterospectral 2D-COS shown in Figure 5. Observing the negative heptane (2858 cm−1 CH
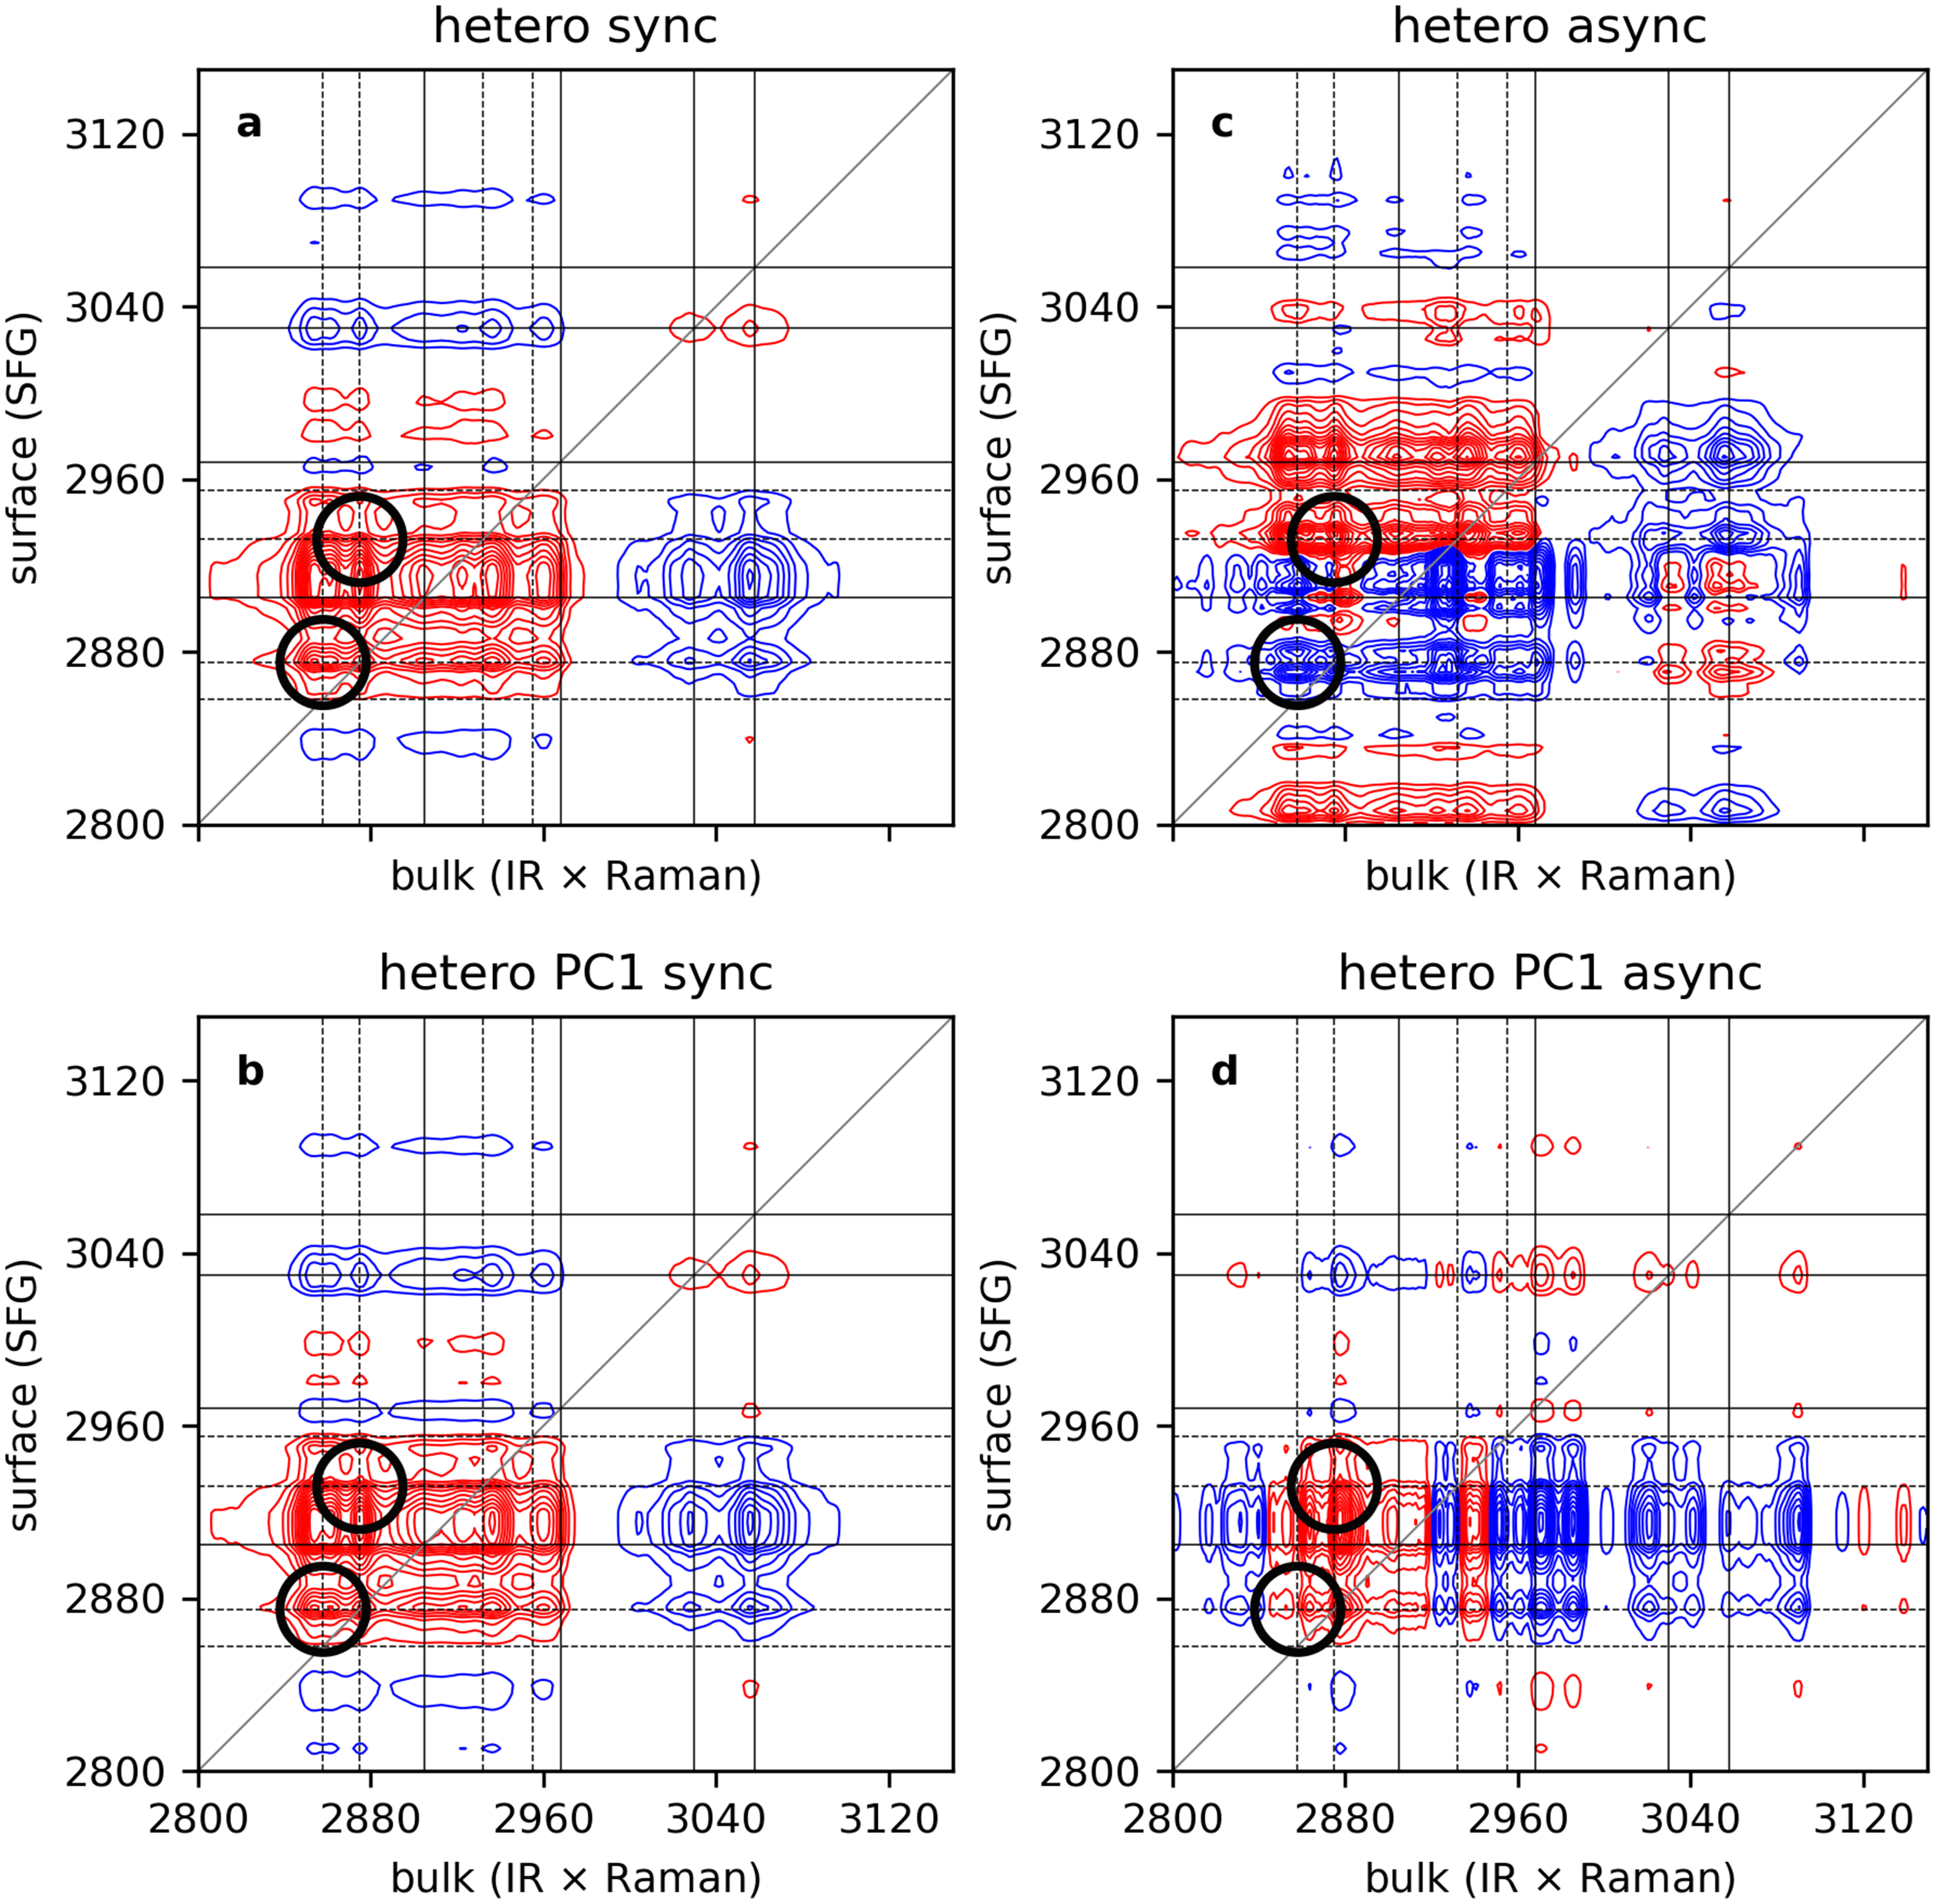
Heterospectral correlation showing the (a) synchronous and (b) asynchronous maps constructed from experimental data for the heptane-toluene mixtures, using the original SFG spectra. (c) Synchronous and (d) asynchornous heterospectral correlation with the SFG data reconstructed from PC1 alone.
These examples illustrate although SFG spectra reconstructed from PC1 still have some residual traces of re-orientation contributing to the response, the PC1 spectra are now dominated by surface population changes, to the point where they make excellent candidate for a heterospectral 2D-COS analysis with bulk IR and/or Raman data. Furthermore, the fact that the homospectral PC1 SFG synchronous maps look practically identical to the raw SFG homospectral synchronous maps is a good indication that this method has not significantly altered the surface population with respect to the bulk concentration perturbation. This brings up an interesting possibility for future investigation, to determine whether such heterospectral PCA-2D-COS can offer a more quantitative description of the adsorption behavior, in a manner that is connected to the equilibrium constants and adsorption isotherm.
To summarize our proposed procedure, the overall workflow involves
Preparing solutions of the (in this case two) components with varying bulk concentrations. Collecting IR and/or Raman spectra for each concentration in the series. In the event that both IR and Raman data are available, hybrid IR-Raman spectra can be created as described previously. Collecting SFG spectra when each of the solutions are placed in contact with the surface of interest. Ideally, phase resolved SFG measurements are performed to determine Performing SFG homospectral correlation to investigate the extent of surface reorientation based on the presence of asynchronous cross-peaks. If both species are found to reorient, PCA is performed on the SFG dataset to obtain scores, which describe how each spectrum changes along each principal component, and loadings, which describe the characteristic spectral patterns associated with each component. The explained variance is then used to determine which principal components carry the dominant spectral changes. Reconstructing the SFG dataset using PC1 only to adjust spectral contributions associated with reorientation (captured in higher PCs). Optionally reconstruct PC2 to visualize orientation-dominated contributions and identify spectral regions most affected by reorientation. Constructing heterospectral 2D-COS maps using the original bulk spectra (IR and/or Raman) and the PC1-reconstructed SFG spectra. Interpret the heterospectral cross-peak (or suitable diagonal peak) signs to infer whether the surface composition changes in the same direction as (or opposite to) bulk composition, allowing determination of surface adsorption preference.
Conclusion
Heterospectral 2D-COS provides a convenient and simple method of determining the preferential absorbance of components from a mixture. However, the analysis previously required knowledge that species were not reorienting when the surface population changed. This could be verified by confirming the absence of cross-peaks in the homospectral asynchronous correlation of SFG data. However, that procedure left little recourse in situations where surface reorientation did occur. We have demonstrated that this situation can be remedied by using the first principal component of the SFG spectra in the surface–bulk heterospectral correlation. Our model result demonstrated that this works because the PC1 spectrum was strongly correlated to the surface populations. We then applied this method to experimental data of heptane–toluene mixtures in contact with a hydrophobic surface, and were able to unambiguously determine the slight adsorption preference of heptane. This technique resolved previous challenges in understanding this data due to complex reorientation behavior of both species. These illustrations demonstrate that the PCA-2D-COS method has the potential to be applied to a wide range of surface adsorption phenomena.
Supplemental Material
sj-pdf-1-asp-10.1177_00037028261433545 - Supplemental material for Heterospectral Principal Component Analysis Two-Dimensional Correlation Spectrosocpy as a Robust Method for Determining Surface Adsorption Preference
Supplemental material, sj-pdf-1-asp-10.1177_00037028261433545 for Heterospectral Principal Component Analysis Two-Dimensional Correlation Spectrosocpy as a Robust Method for Determining Surface Adsorption Preference by Mahsa Torkamanasadi and Dennis K. Hore in Applied Spectroscopy
Footnotes
Acknowledgments
This work was enabled by facilities at the University of Victoria Centre for Advanced Materials and Related Technologies (CAMTEC).
Declaration of Conflicting Interests
The author(s) declared no potential conflicts of interest with respect to the research, authorship, and/or publication of this article.
Funding
The author(s) disclosed receipt of the following financial support for the research, authorship, and/or publication of this article: This work was supported by Discovery (RGPIN-2020-06030) and Discovery Accelerator (RGPAS-2020-00049) grants from the Natural Sciences and Engineering Research Council of Canada.
Supplemental Material
All supplemental material mentioned in the text is available in the online version of the journal.