
Abstract
Soil reflectance spectroscopy is a powerful tool for rapid, non-destructive assessment of soil properties and the foundation for data-driven soil science applications. However, systematic discrepancies during routine spectral measurement procedures, particularly those arising from contamination or deterioration of white reference (WR) calibration panels, may compromise spectral data stability and hinder harmonization practices across laboratories. This study investigates the impact of using a non-contaminated WR panel as a calibration target to measure soil reflectance across the visible (Vis), near-infrared (NIR), and short-wavelength infrared (SWIR) spectral regions. The study evaluates the effectiveness of an internal soil standard (ISS) Lucky Bay sand to correct discrepancies within a controlled laboratory setting. Twelve soils from the Israeli Legacy Soil Spectral Library were analyzed using a contact-probe setup that was calibrated with both a clean and a contaminated WR. The spectral correction method, based on IEEE P4005 protocols and the ISS calibration, significantly reduced spectral inconsistencies, especially in the Vis region where contamination effects were most pronounced. Results show that the ISS effectively harmonized spectra acquired under different WR conditions, reducing the modified average spectral difference stability (mASDS) measure across all samples. While ISS correction is commonly employed for cross-laboratory harmonization, our findings highlight its critical role in enhancing intra-laboratory consistency under routine operational variability. We recommend that every WR calibration process will be accompanied with ISS measurements. The continuous use of a well-maintained WR and ISS improves the reliability of soil spectral datasets and supports the long-term harmonization of soil spectral libraries.
This is a visual representation of the abstract.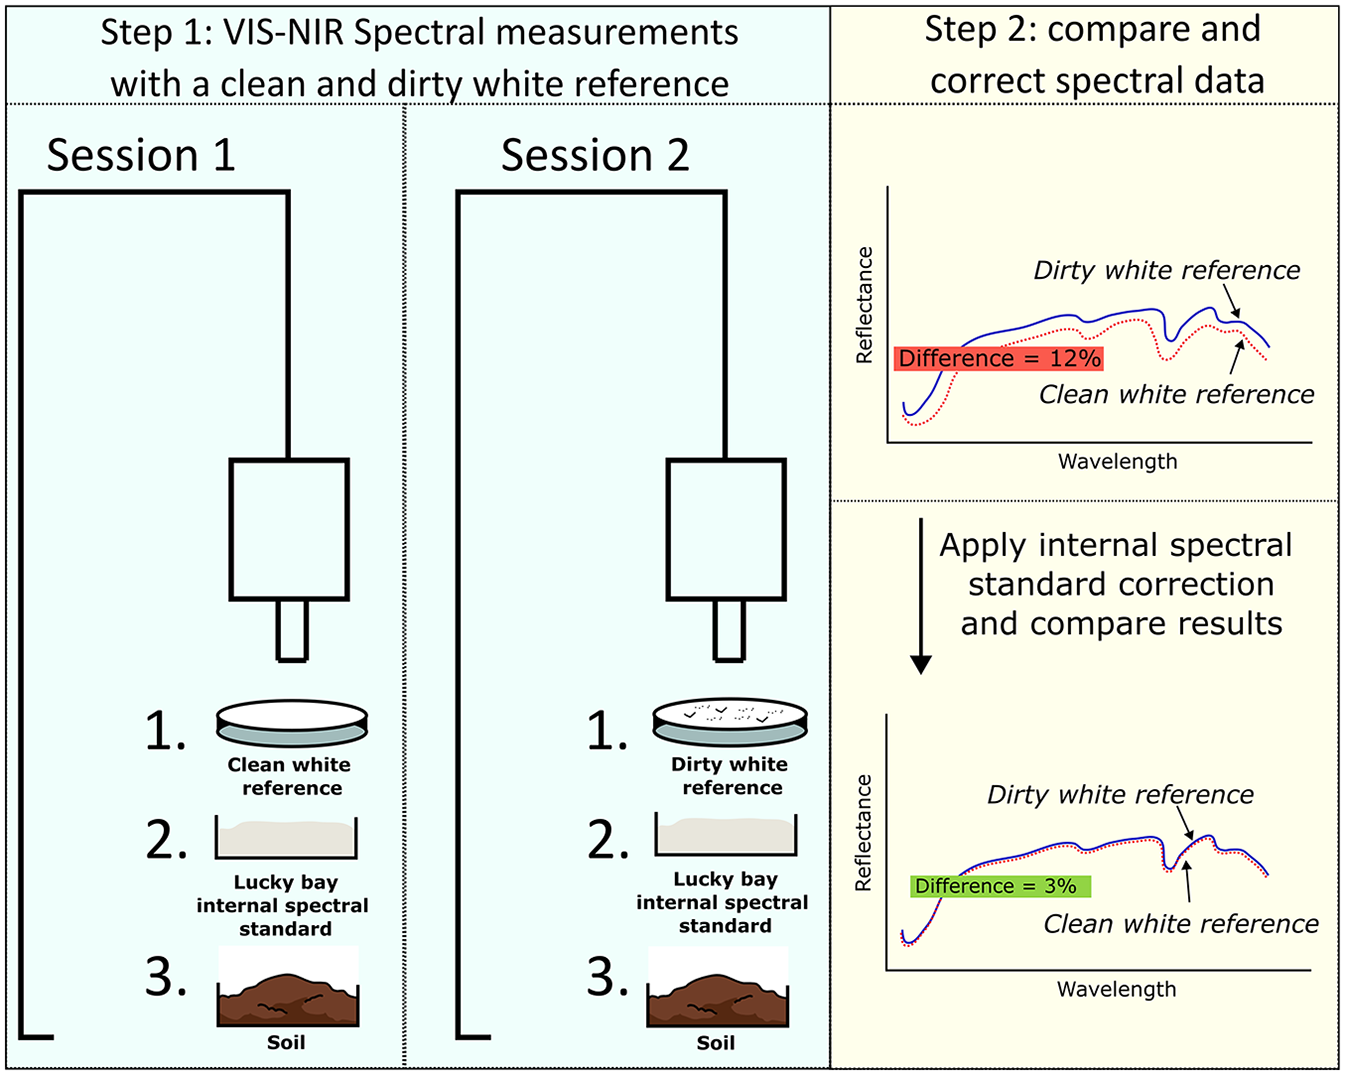
Keywords
Introduction
Soil spectroscopy has emerged as a transformative tool in soil science, enabling the rapid, non-destructive assessment of a wide range of soil properties.1–3 By analyzing soil reflectance across the visible, near-infrared, and shortwave-infrared (Vis-NIR-SWIR) regions (0.35–2.5 µm), it is possible to accurately infer critical physical, chemical, and biological characteristics of soils.4–6 This capability supports the development of modern data-driven applications in agriculture, environmental monitoring, and land management, where timely and precise soil information is essential.
Soil spectral libraries (SSLs) are fundamental to these advances. They consist of collections of air-dried soil samples (sieved to <2 mm), paired with both wet chemistry reference data and corresponding spectral measurements.7,8 SSLs are critical for developing proximal and remote sensing models which allow for the rapid, non-destructive prediction of various soil attributes. Soil reflectance spectroscopy captures the interaction of light with soil materials and their chemical chromophores, such as organic matter, iron oxides, clay minerals, and moisture, across the 0.35–2.5 µm Vis-NIR-SWIR range, producing distinctive absorption features that fingerprint key soil properties. Soil reflectance is also influenced by physical chromophores, including particle size distribution, shape, and surface packing, with intercorrelations often occurring between chemical and physical chromophores.9–11
Typically, soil reflectance across the Vis-NIR-SWIR region is measured relative to a standard white reference (WR), often made of materials such as Spectralon, which is characterized by Lambertian properties, spectral featurelessness, and stable high reflectance across the spectral range, calibrated to represent 100% reflectance.12–14 Ideally, a calibrated WR is used to ensure accurate absolute reflectance measurements. However, in many practical cases, especially outside controlled laboratory environments, uncalibrated WRs are employed, and only relative reflectance values are recorded. 15
When using soil as a measurement target, WR panels are known to deteriorate both in short and long timescales.16–19 In the short term, WR panels can become contaminated by dust, fine soil particles, or micro-scratches, often caused by inadequate cleaning of the panel surface between measurements. Short-term contamination is particularly significant when working with fine soil fractions (<2 mm), which generate dust invisible to the naked eye that cause small particles to adhere to the WR surface via electrostatic forces. 20 Additionally, WR ageing effects can occur within several hours of exposure to low levels of irradiance, and their degradation has been shown to continue even when stored in the dark after the exposure. 21 Over the long term, exposure to environmental conditions, especially outdoor conditions, can gradually degrades their ideal reflectance properties. 22 For example, degradation effects were demonstrated with differences of 5% to 23% in wavelengths under 550 nm, between a WR used in field conditions and a pristine, freshly calibrated WR panel. 23 WR panels in soil laboratory settings are typically not absolutely calibrated and are used as relative reflectance references. Even under controlled laboratory conditions, they may degrade over very short periods of time. As a result, reflectance measurements collected in one session may differ from those collected in another, even when taken by the same laboratory using identical procedures. 22
To address systematic errors arising from inconsistencies in soil spectral measurements both in laboratory and field conditions, it was proposed to use an Internal Soil Standard (ISS). 24 This approach was later adopted by the IEEE P4005 working group, which is establishing international standards and protocols for soil reflectance measurements across the 0.4–2.5 μm spectral range. 25 The ISS reduces systematic variability, allowing harmonization of spectral data across sessions, operators, and even different spectroradiometers, despite minor procedural differences. 26 While the ISS method has demonstrated strong performance across various instruments and protocols,1,27,28 its effectiveness in correcting WR degradation within a single laboratory setting over short timeframes, i.e., during one measurement session, has not yet been thoroughly examined. Unlike other systematic effects, such as spectrometer variability or protocol differences, which can be corrected periodically, WR contamination is dynamic and can occur during the measurement process itself, introducing non-systematic errors. Therefore, the WR must be treated as a potential source of systematic error to be controlled and corrected in real time to ensure harmonization. This kind of progressive deterioration provides an ideal scenario to test how the ISS can serve as a stable internal benchmark to support spectral harmonization.
This study presents a detailed assessment of WR panel behavior during routine soil spectral measurements in a single laboratory and aims to examine the use of the ISS for intra-laboratory correction of a contaminated WR. Since WR calibration is a critical step in any soil reflectance protocol, understanding the effects of WR within a single measurement set is essential. We aim to demonstrate best practices for WR maintenance and demonstrate how the ISS can be used to correct measurements taken with a contaminated (dirty) WR, aligning them with those taken using a clean WR.
Experimental
Materials and Methods
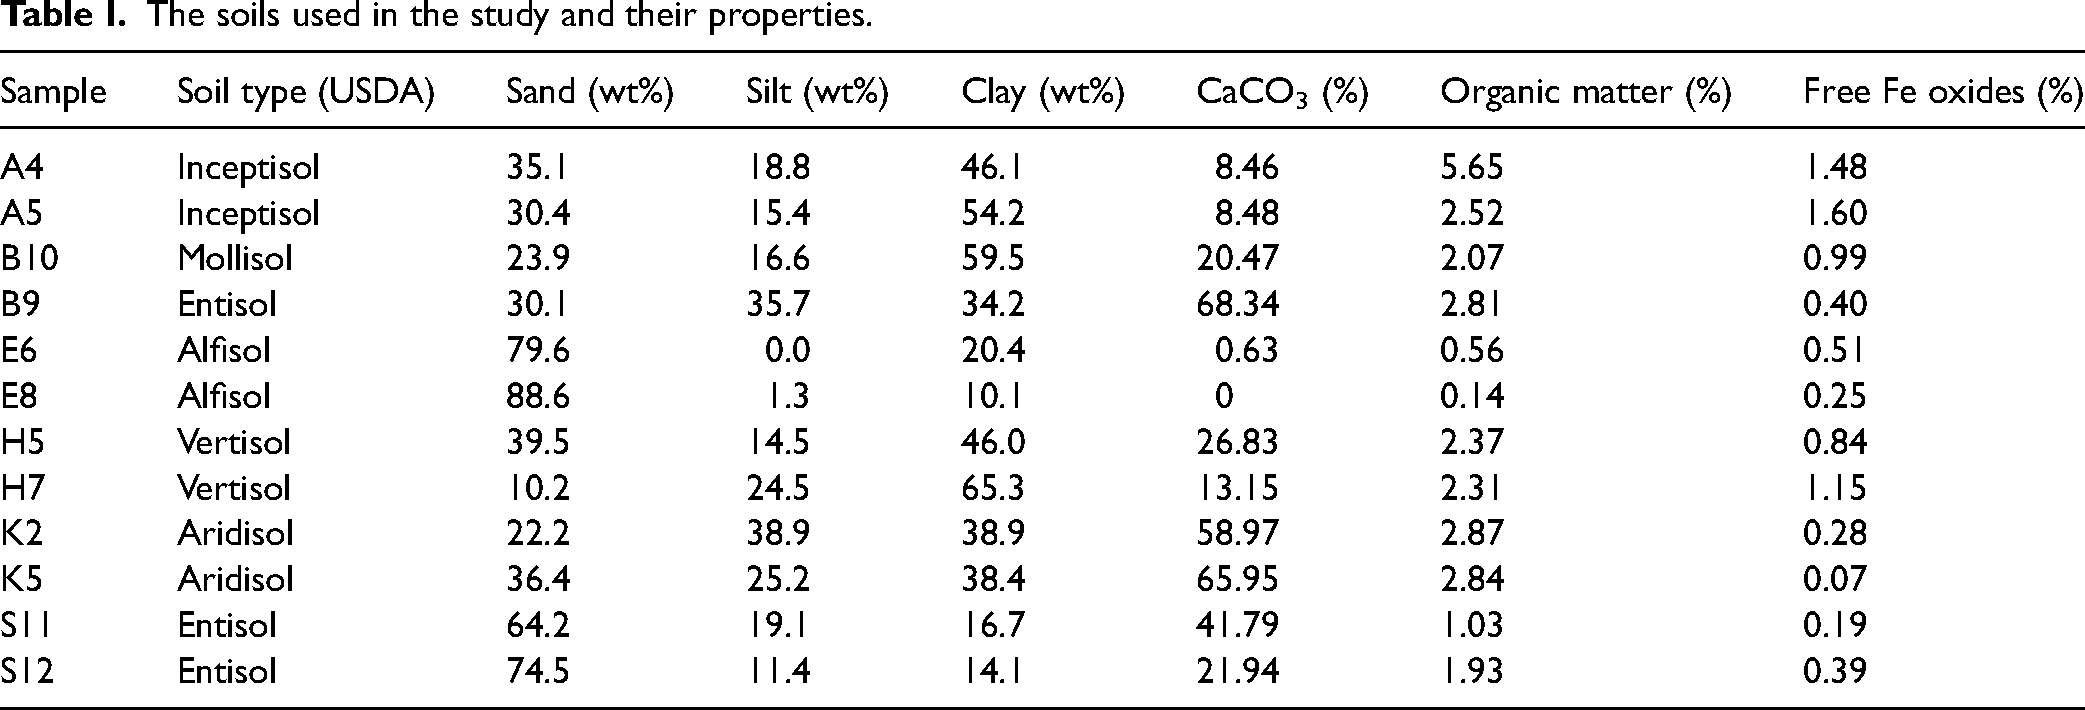
Twelve soils from the Israeli Legacy SSL were selected for the study (Figure 1). 9 These soils were chosen as they vary in their texture, organic matter content (OM), free iron oxides (FED) and carbonates (CaCO3) and were suitable for examining the effect of calibration with a clean and dirty WR and the subsequent correction with the ISS. They represent common and widespread soil types and include Inceptisol, Mollisol, Entisol, Alfisol, Vertisol, and Aridisol (USDA soil orders). Table I provides the soils’ chemical and physical data (after Ben Dor and Banin 11 ). The soils were air-dried, gently crushed and sieved to <2 mm. Soil texture was measured using the hydrometer method, OM (%) was determined by the loss-on-ignition method, calcium carbonate (CaCO3) was determined by the gasometrical method, and FED was determined by dithionite citrate bicarbonate extraction. All references for these traditional wet analyses are provided in Ben Dor et al. 9 Figure 1 shows the soil samples alongside two WRs from LabSphere (Spectralon, USA): A used (dirty) WR and a seldom-used (clean) WR. Also shown in this figure is the Lucky Bay (LB) ISS (Figure 1). 26 Note that typically, laboratories maintain one WR in pristine condition for high-precision measurements (clean), while another WR is used for routine daily work (dirty). The clean and dirty WR were imaged with a phone camera (iPhone 11) to visually examine their cleanliness.
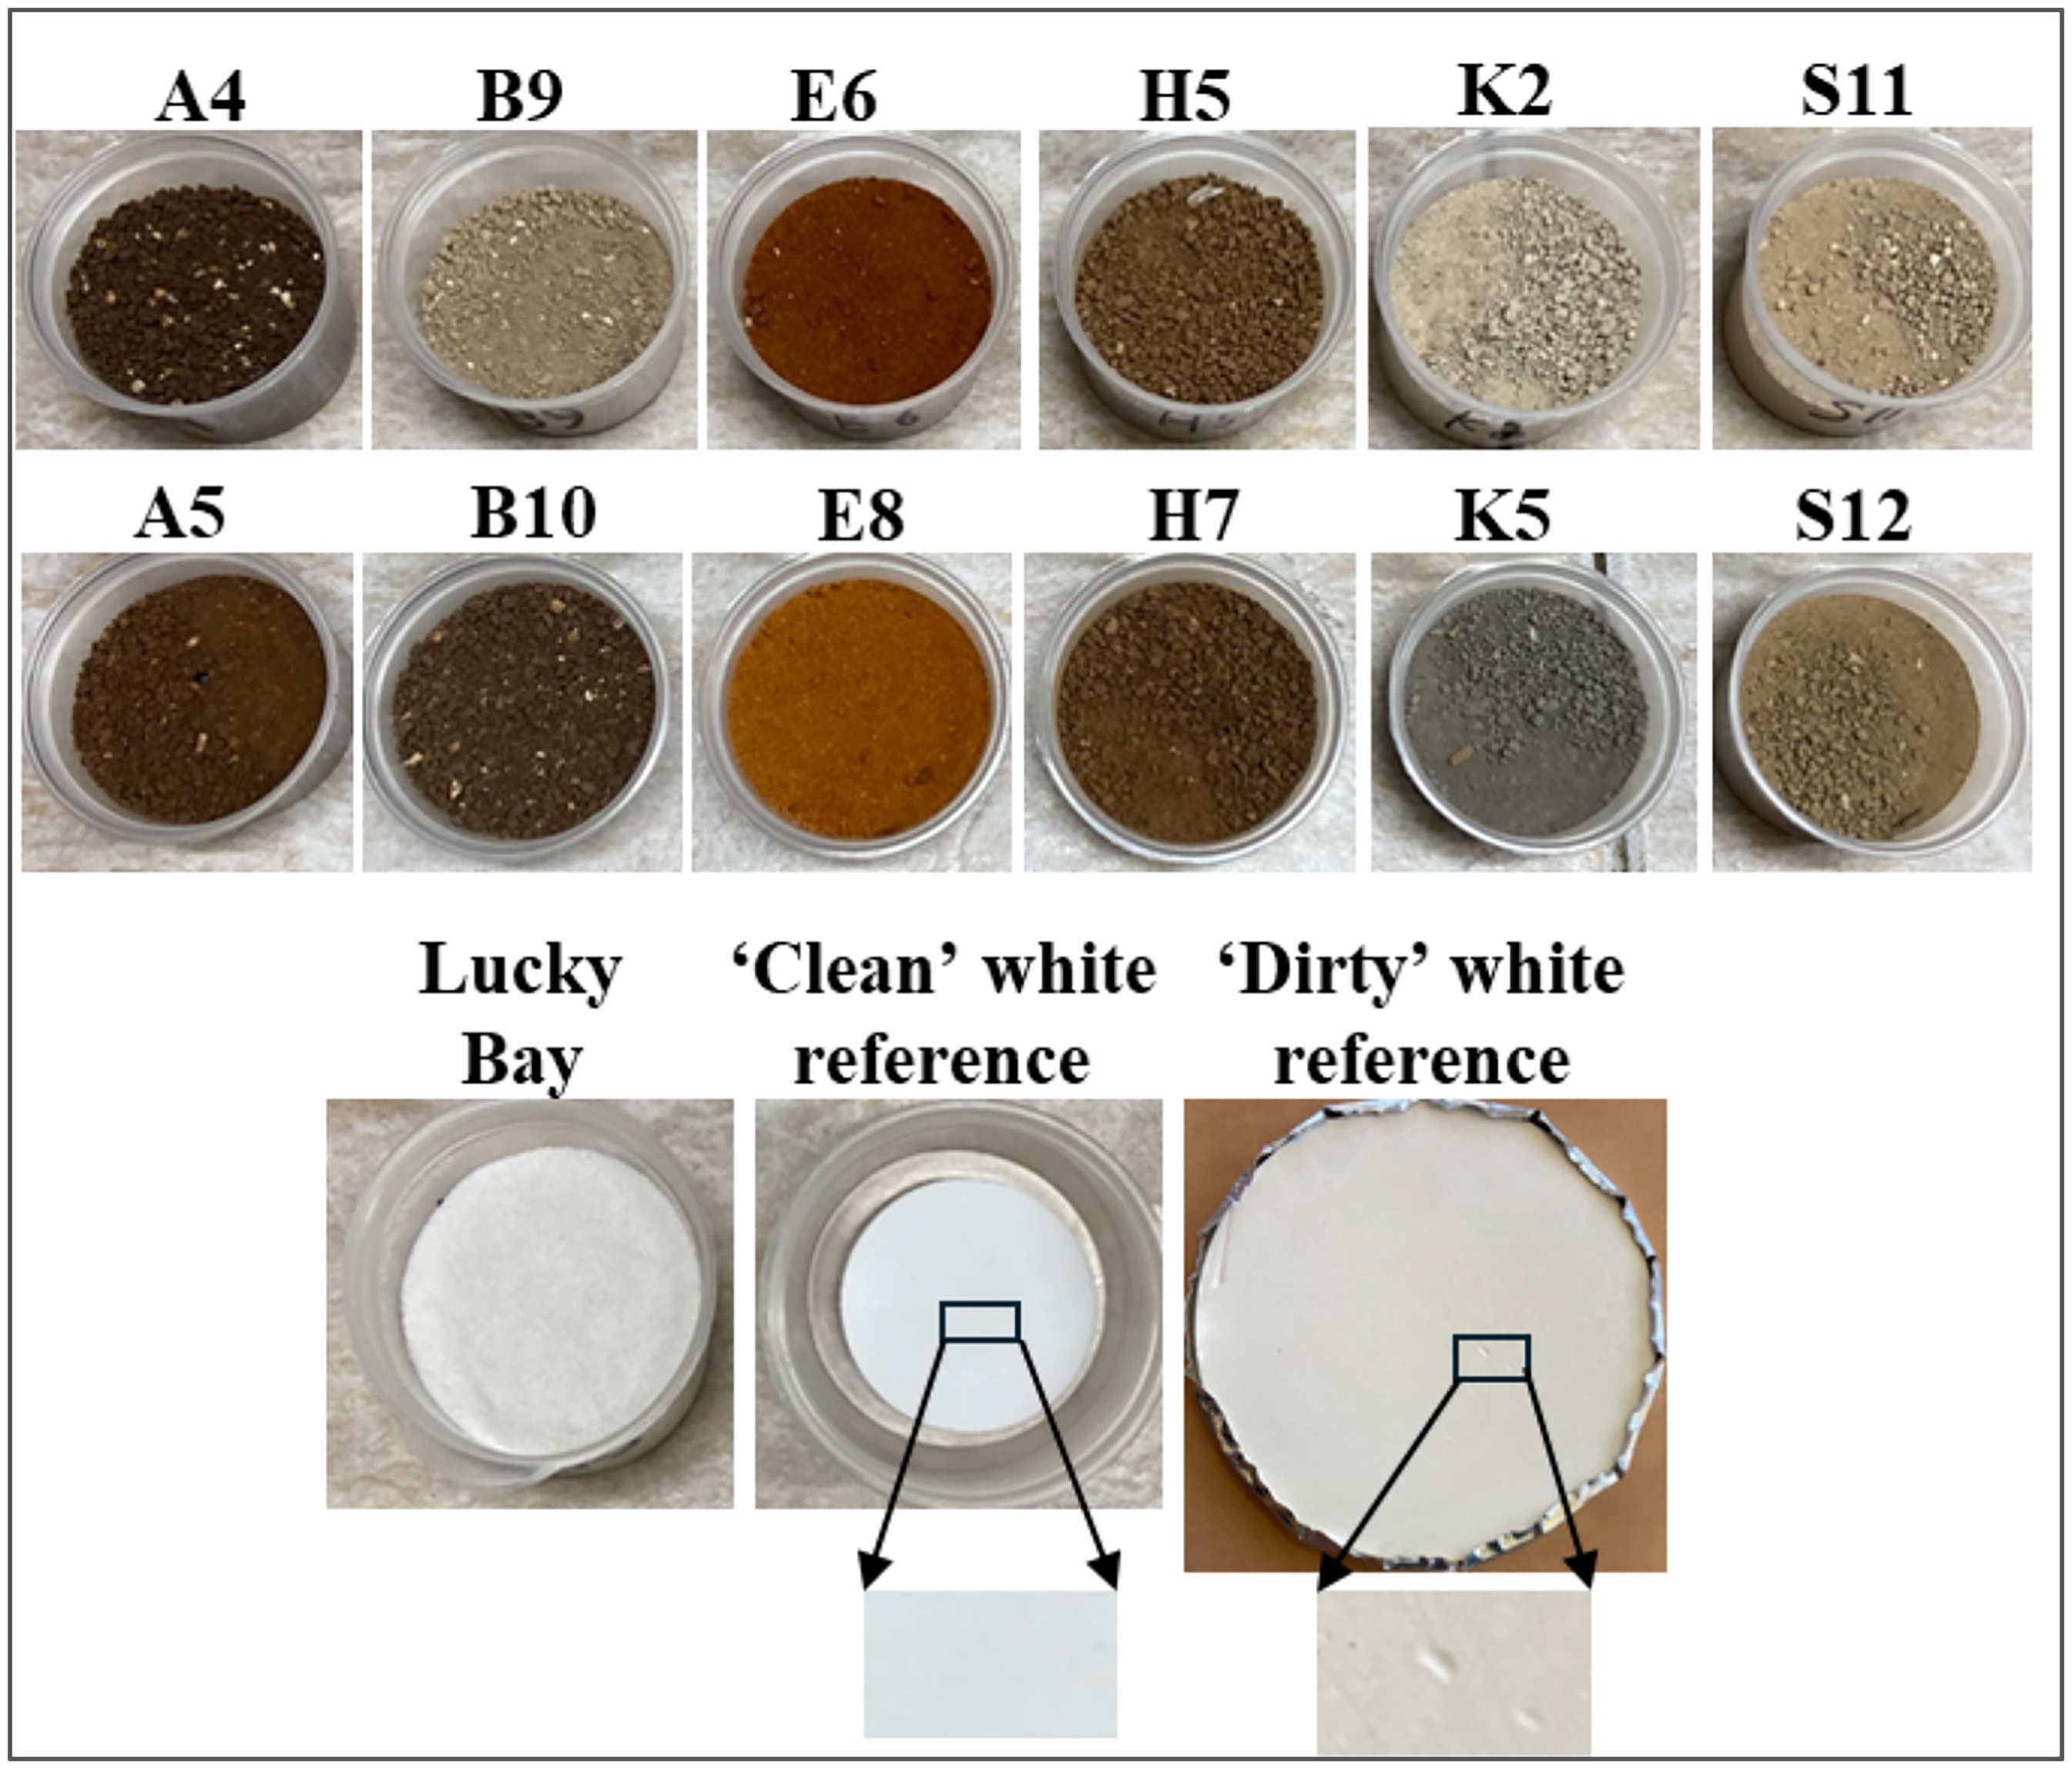
The top two rows are the soils selected for this study and the third row (left to right) is the Lucky Bay (LB) internal soil standard (ISS) used to harmonize the measurements, and a clean and dirty white reference panels used to calibrate the spectrometer.
The soils used in the study and their properties.
Soil Spectroscopy Measurements
Soil spectral measurements were acquired using an ASD FieldSpec-4 Hi-Res following the IEEE Standards Association P4005 measurement protocol on air dried <2 mm sieved samples with a contact-probe assembly. 25 Prior to any spectral measurement session, the ASD spectrometer was warmed up for 60 minutes as well as the illumination bulb for 30 minutes according to the P4005 protocol. In order to test whether the ISS (Lucky Bay) can correct measurements acquired with a dirty WR compared to a clean WR, two sets of measurements were conducted, each using a different WR panel as a 100% relative reference (clean and dirty). In all measurements a manual elevator was used to bring the sample to the contact probe, to ensure measurement stability. Firstly, the same optimization and calibration was done with the WR for each session (clean and dirty) and the LB ISS measurements along with the soils. The following stages were conducted: (i) Calibration and optimization for WR (clean or dirty), (ii) three-times measurement of LB ISS, (iii) three-times measurement of five soils, and (iv) three-times measurement of LB ISS. Each replication was done by mixing the soils with a stirrer and preparing the soil surface as homogenously as possible. The first session was carried out with the clean WR and then the second session used the dirty WR.
Spectral Data Correction Using the ISS
Following both WR sessions (clean and dirty), the LB corrections were applied following
29
and the IEEE protocol,
25
that was applied to the relative WR (Spectralon) reflectance. The ISS protocol was used to correct the spectral reflectance of all the soils, with the following equation:

Comparing the Spectral Signatures of the Soil Measured with a Clean and Dirty White Reference
Two metrics were used to determine to what extent the LB ISS can correct soil spectra measured with a dirty WR: The modified average spectral difference stability (mASDS); dividing spectra by each other. The mASDS is a widely used metric for assessing the consistency of spectral measurements across all wavelengths. The Calculation of the mASDS is performed as follows:
The mean reflectance at each wavelength across all measurements is calculated as follows:
First, the mean reflectance for each wavelength across all measurements is calculated (mean value between replicates of the same ID for each wavelength, one for the sample measured with a dirty WR, and one for the sample measured with a clean WR) (Eq. 3):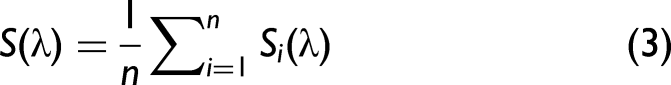
Next, the absolute difference between the spectral reflectance of each wavelength of each measurement and the mean spectral reflectance (Eq. 3) is calculated (Eq. 4):
Using Eqs. 3–4, the mASDS is calculated and used to quantify the average absolute difference spectral reflectance across all wavelengths and measurements (Eq. 5):
Lower mASDS values indicate a better match between spectra. In this study, we first used mASDS to evaluate the spectral differences between measurements taken with clean and dirty WRs. Then, we applied the LB ISS correction to assess whether it mitigated those differences.
Results and Discussion
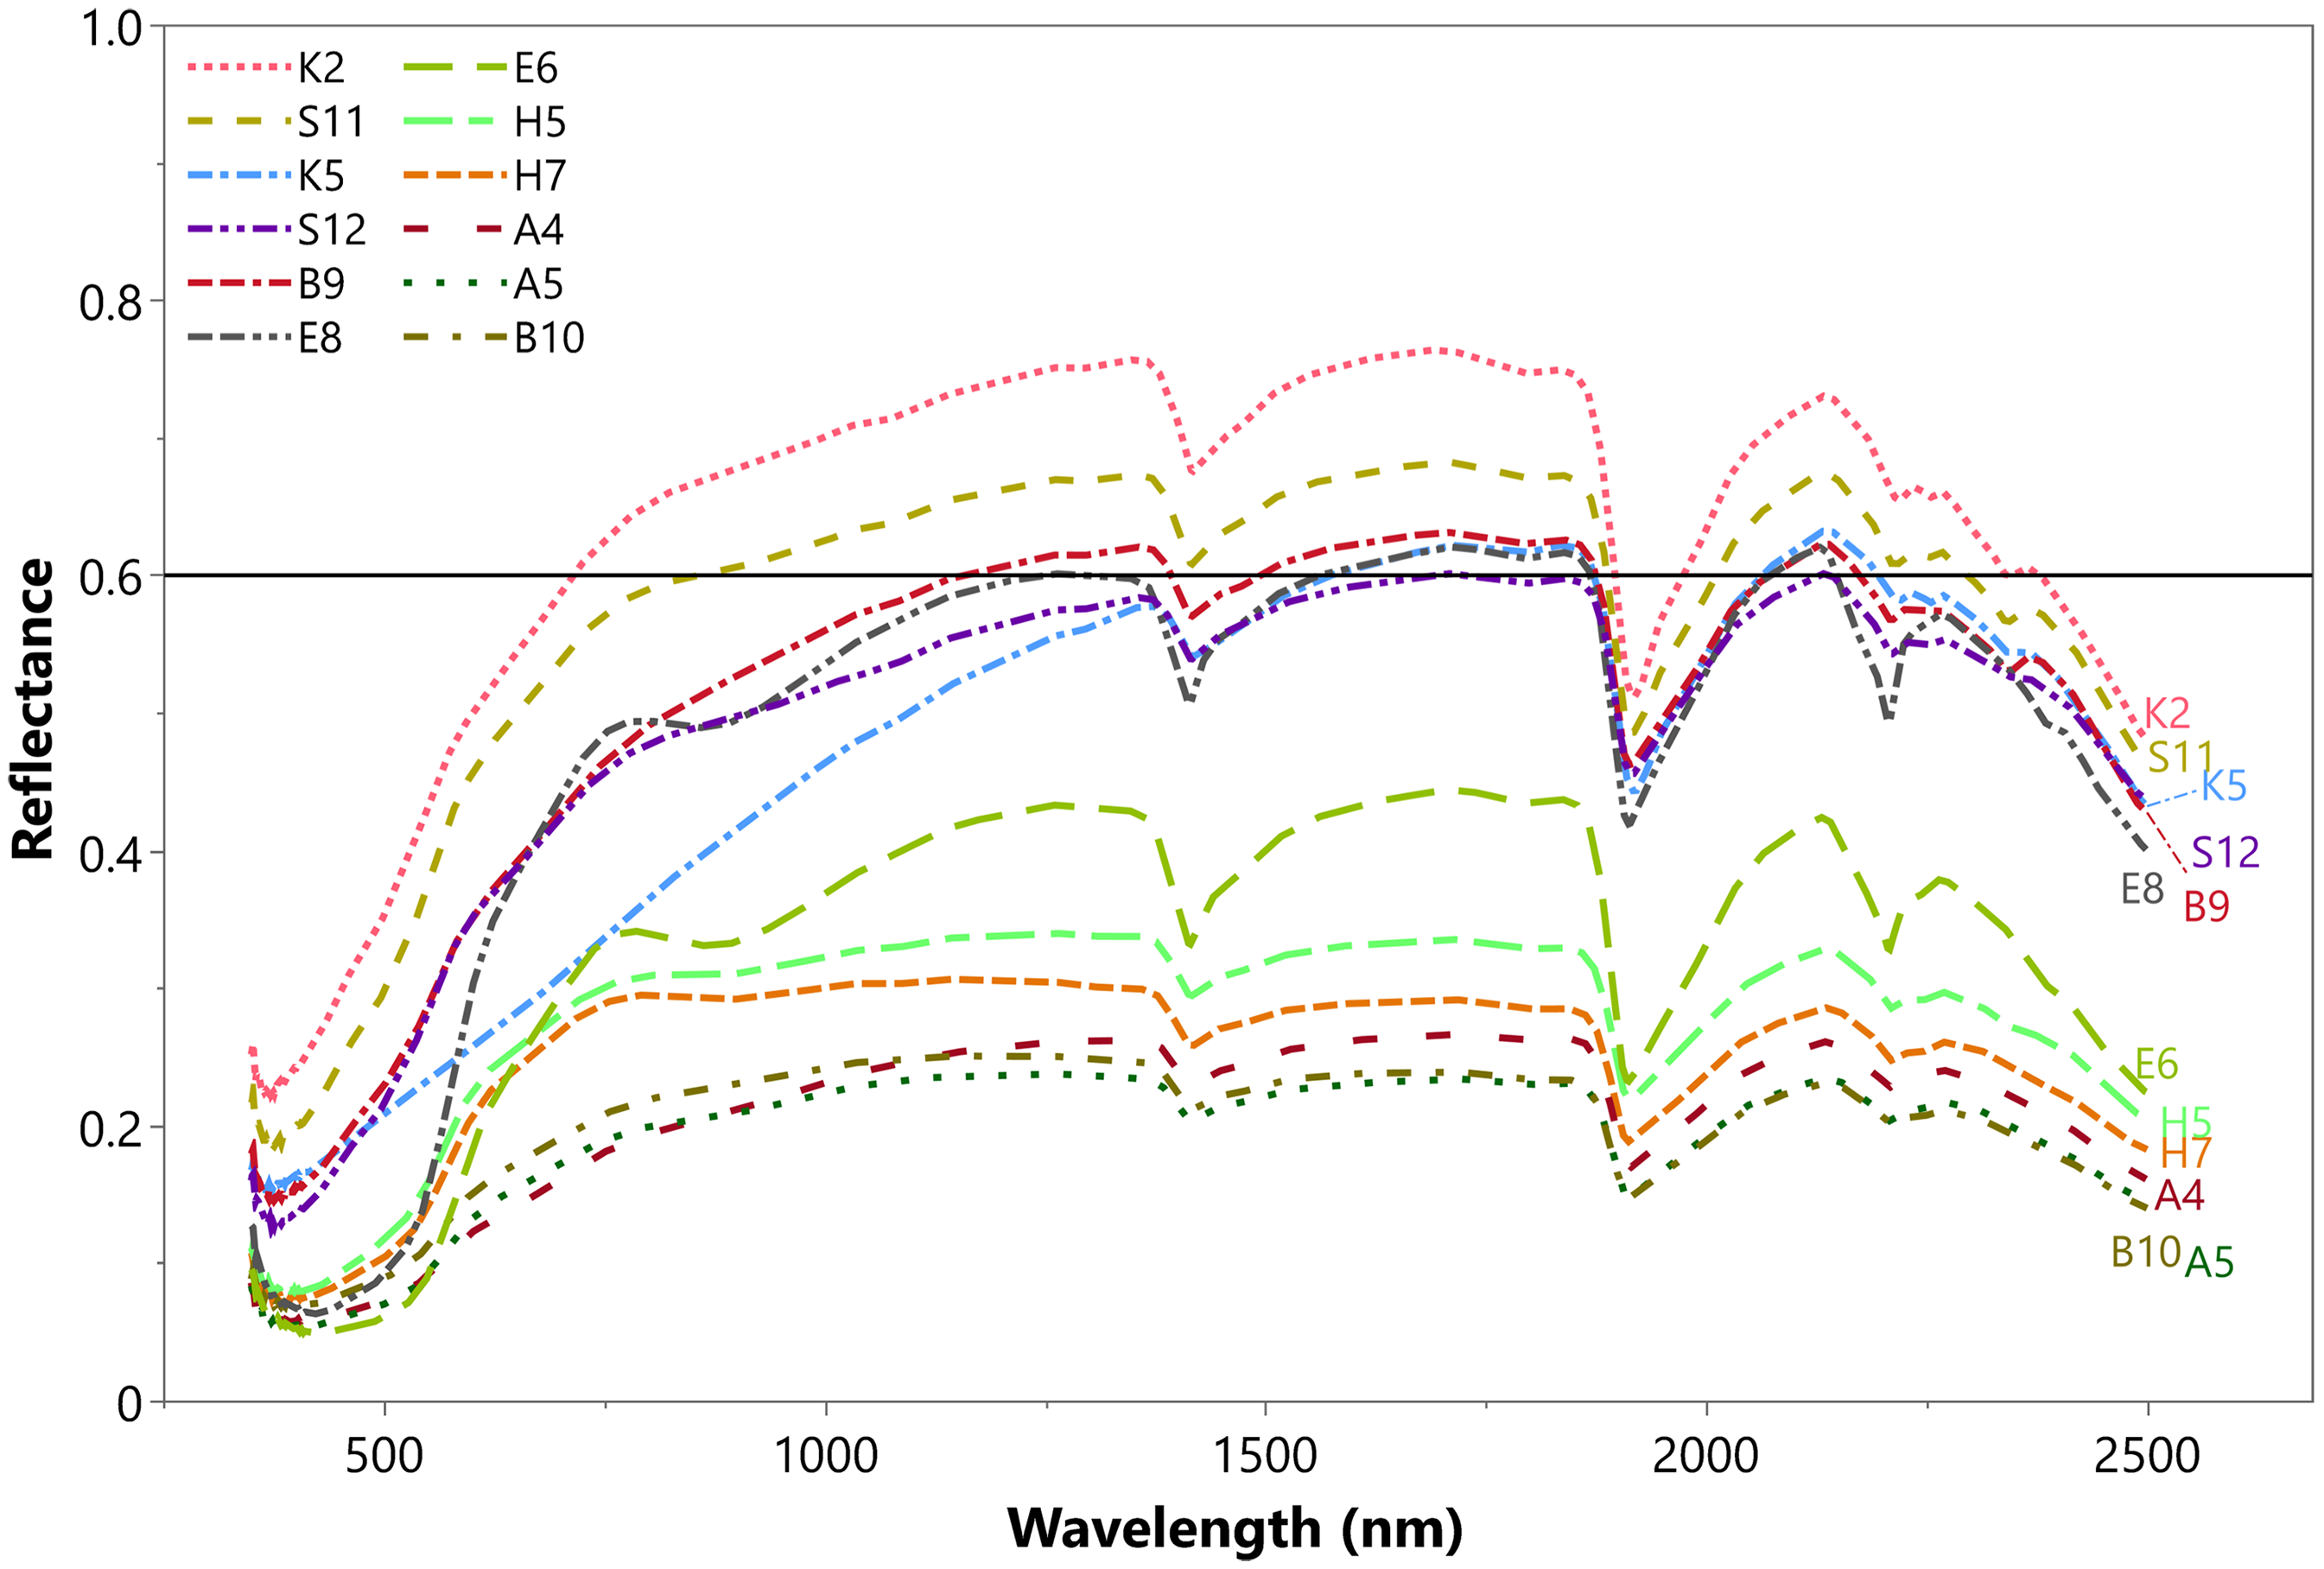
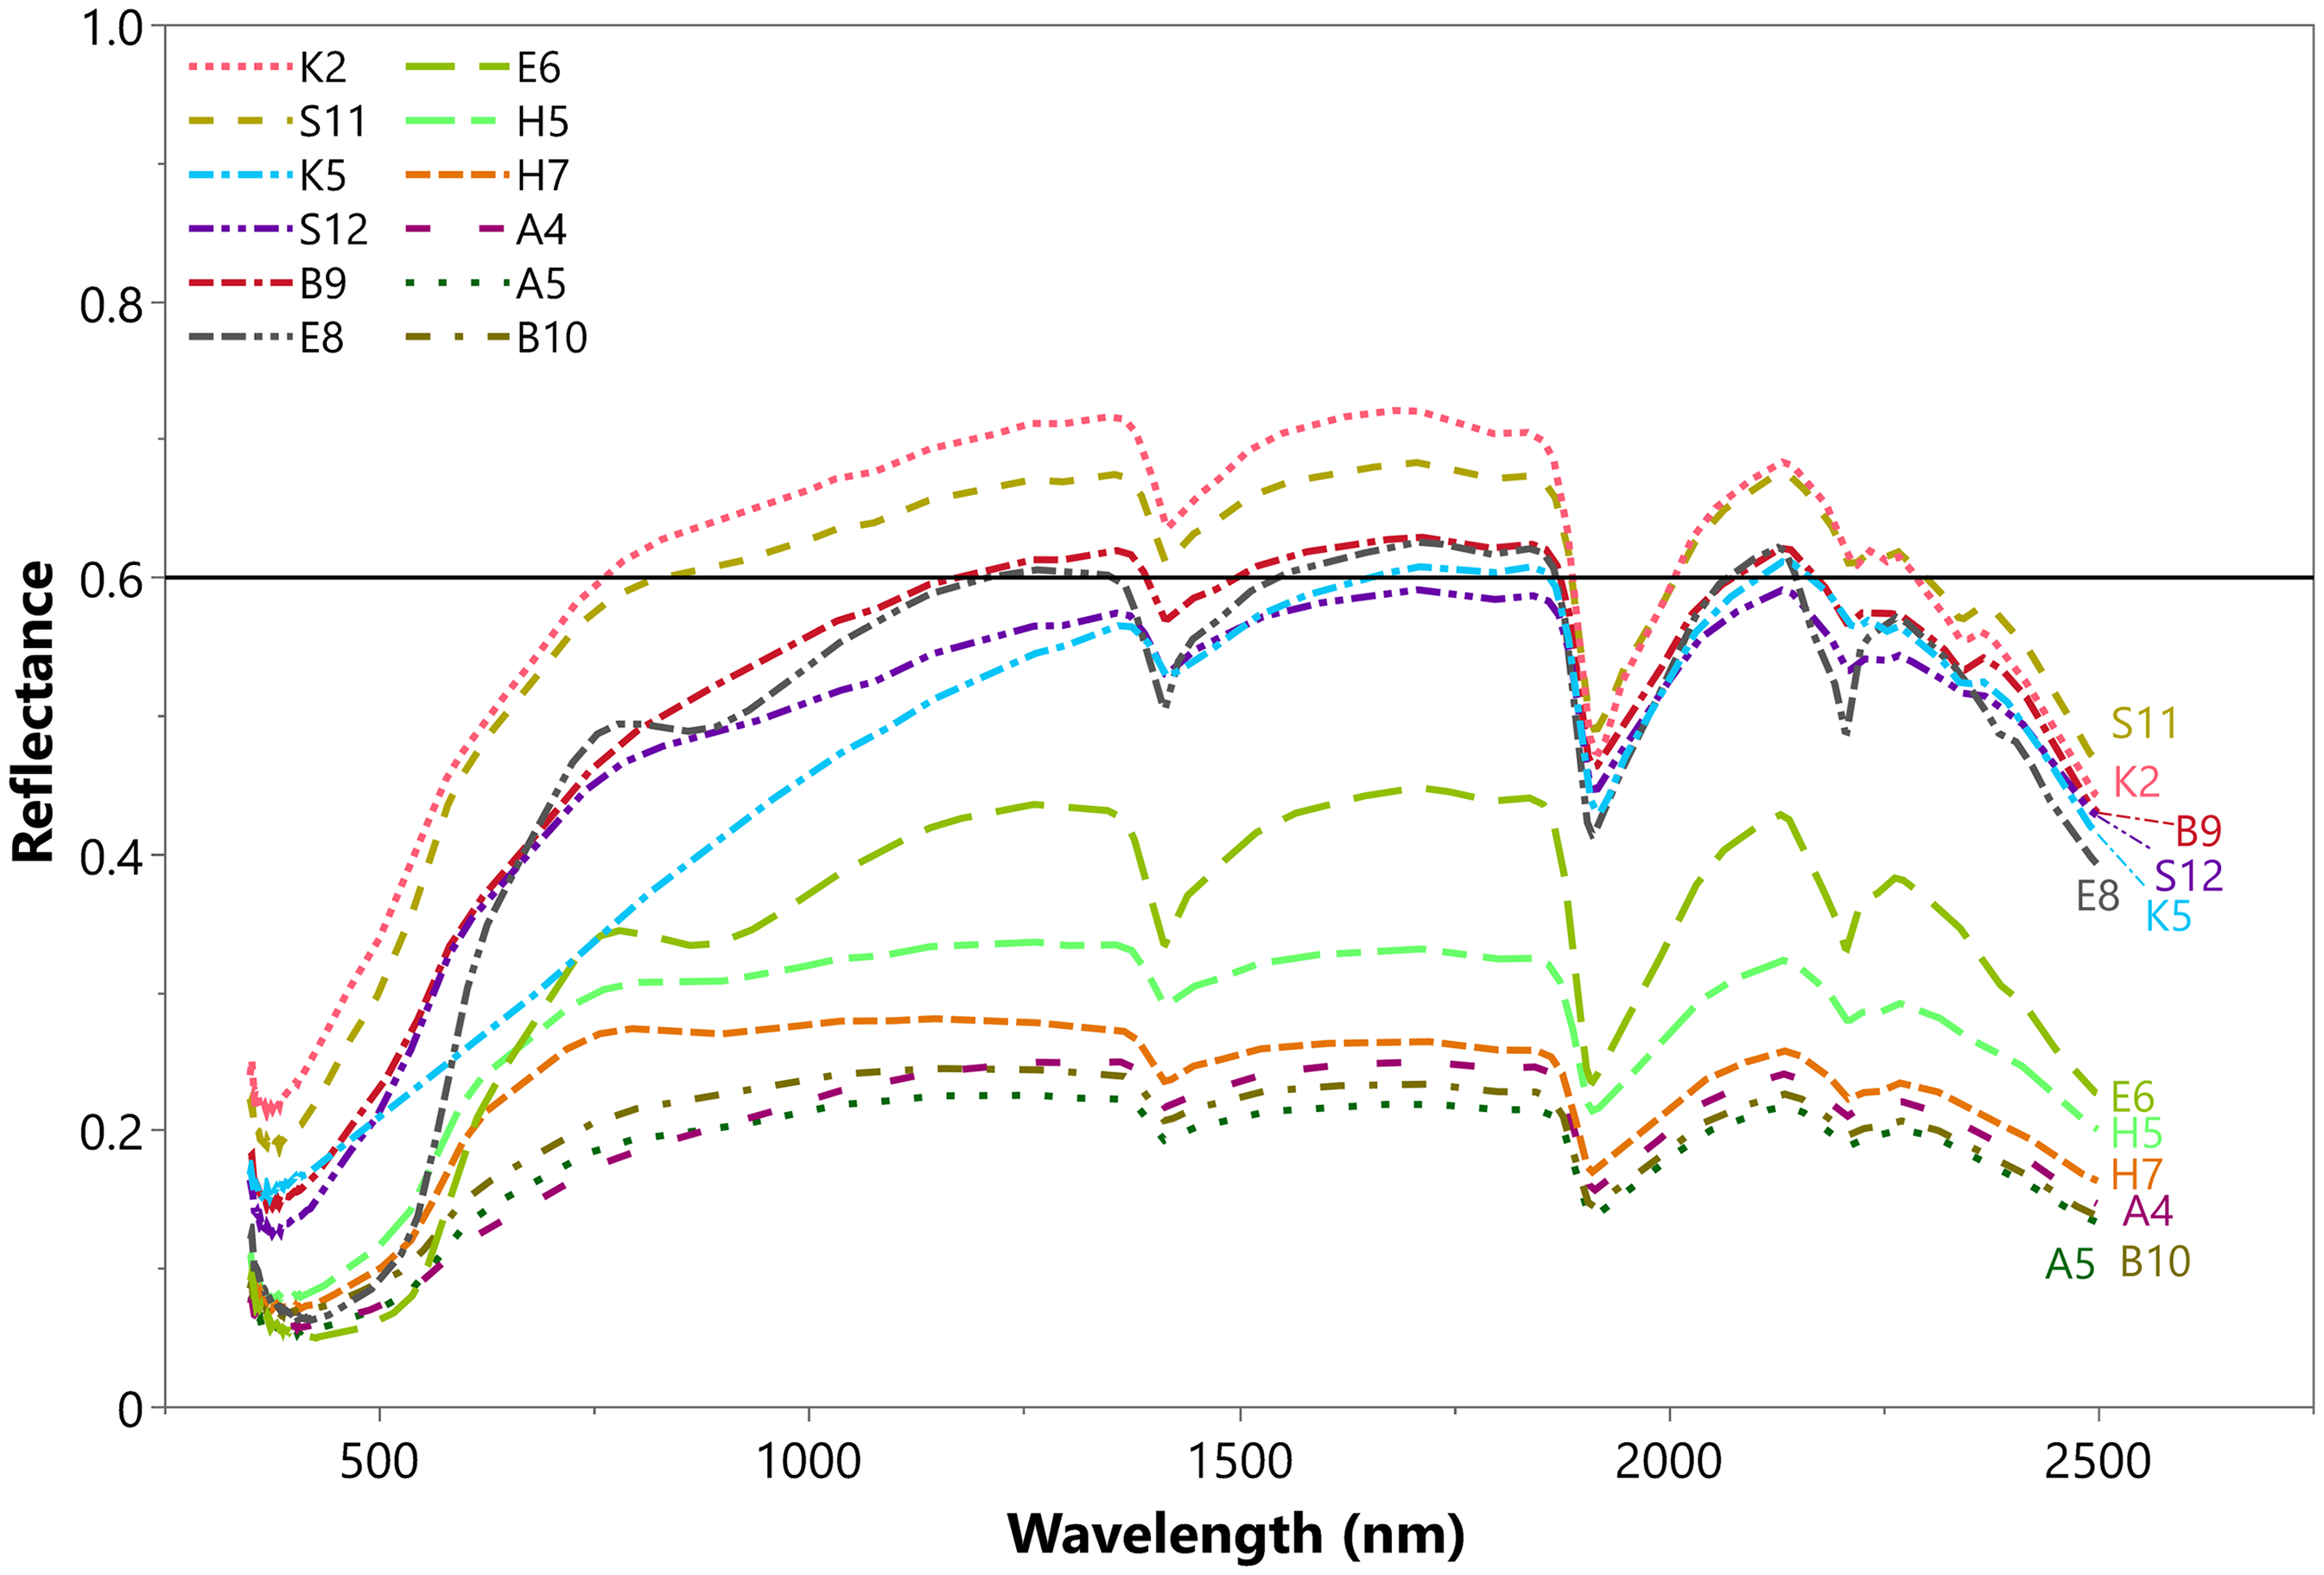
From Figure 1, it is apparent that the clean WR is slightly whiter than the dirty WR. Moreover, micro-scratches are also visible on the surface of the dirty WR. Figures 2 and 3 show the soil spectra obtained using both the clean and dirty WR. Visually, the differences between them are minor and not easily detectable to the naked eye. A straight line at 60% is provided to enable better comparison between the two data sets. However, when dividing the spectrum measured with the dirty WR by the spectrum measured with the clean WR (Figure S1, Supplemental Material), the discrepancies become apparent, especially in the visible (Vis) region.
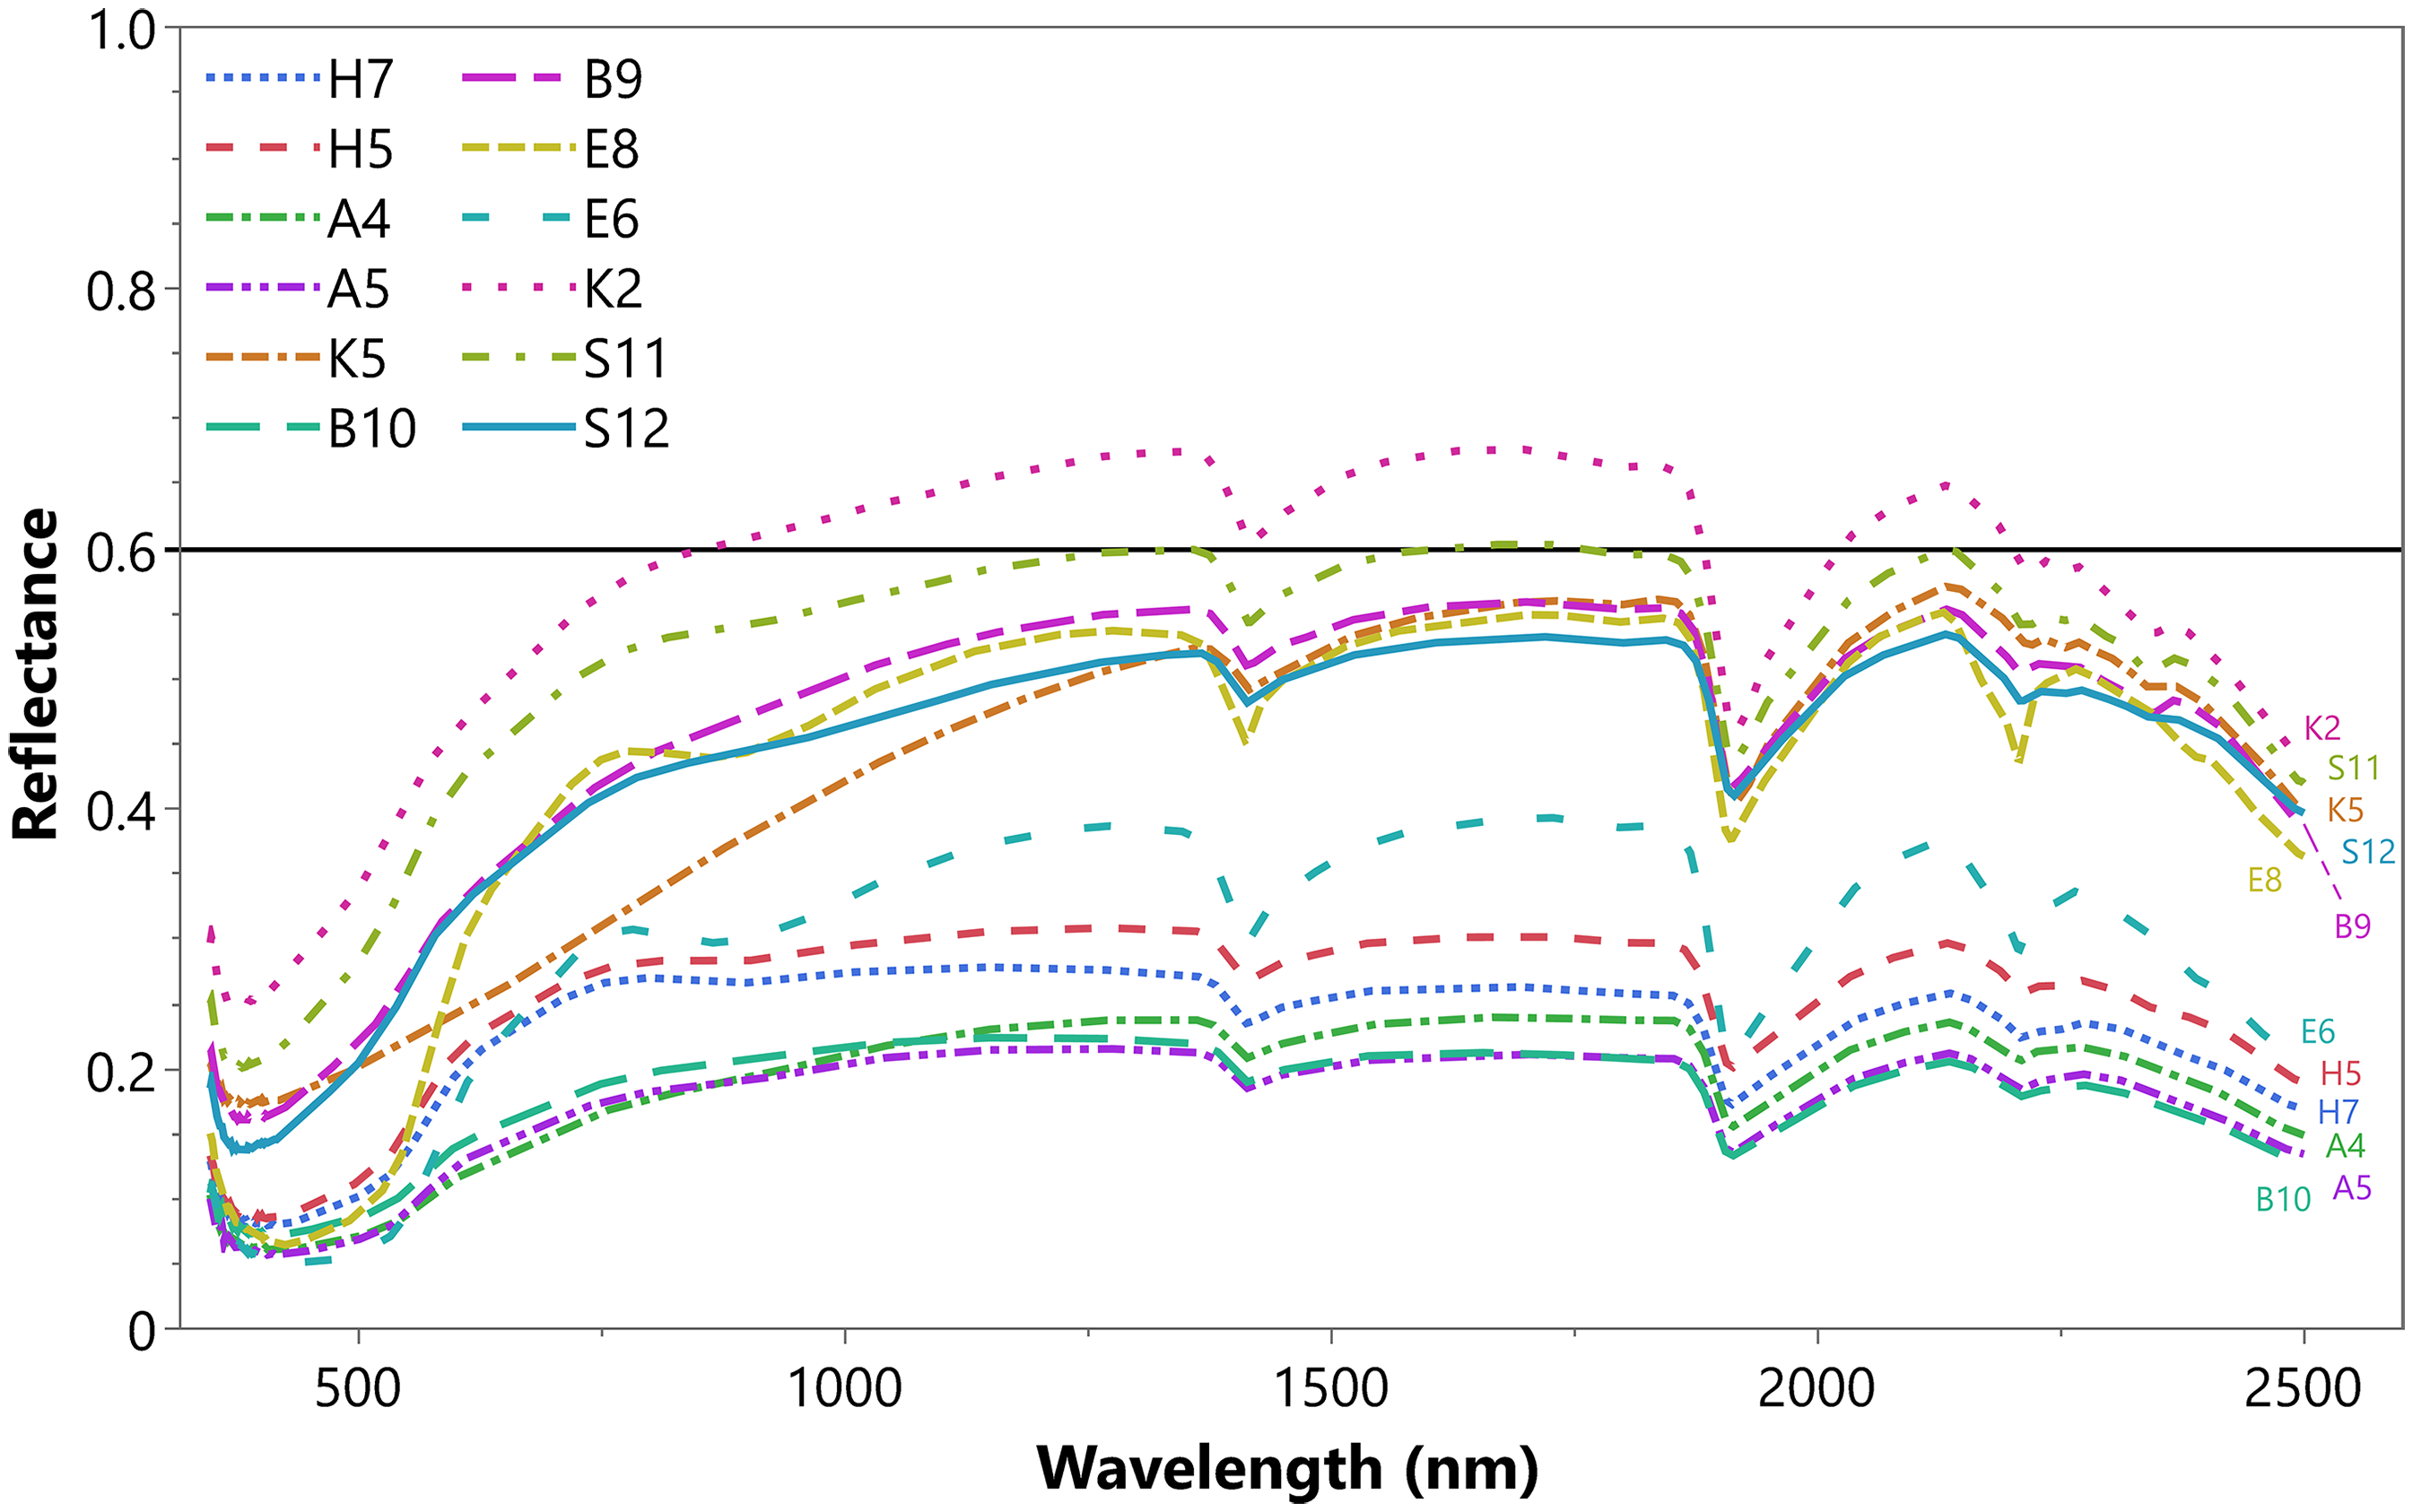
Reflectance of all soils measured with a dirty white reference. The straight line at 0.6 reflectance is a reference to compare changes with Figure 3.
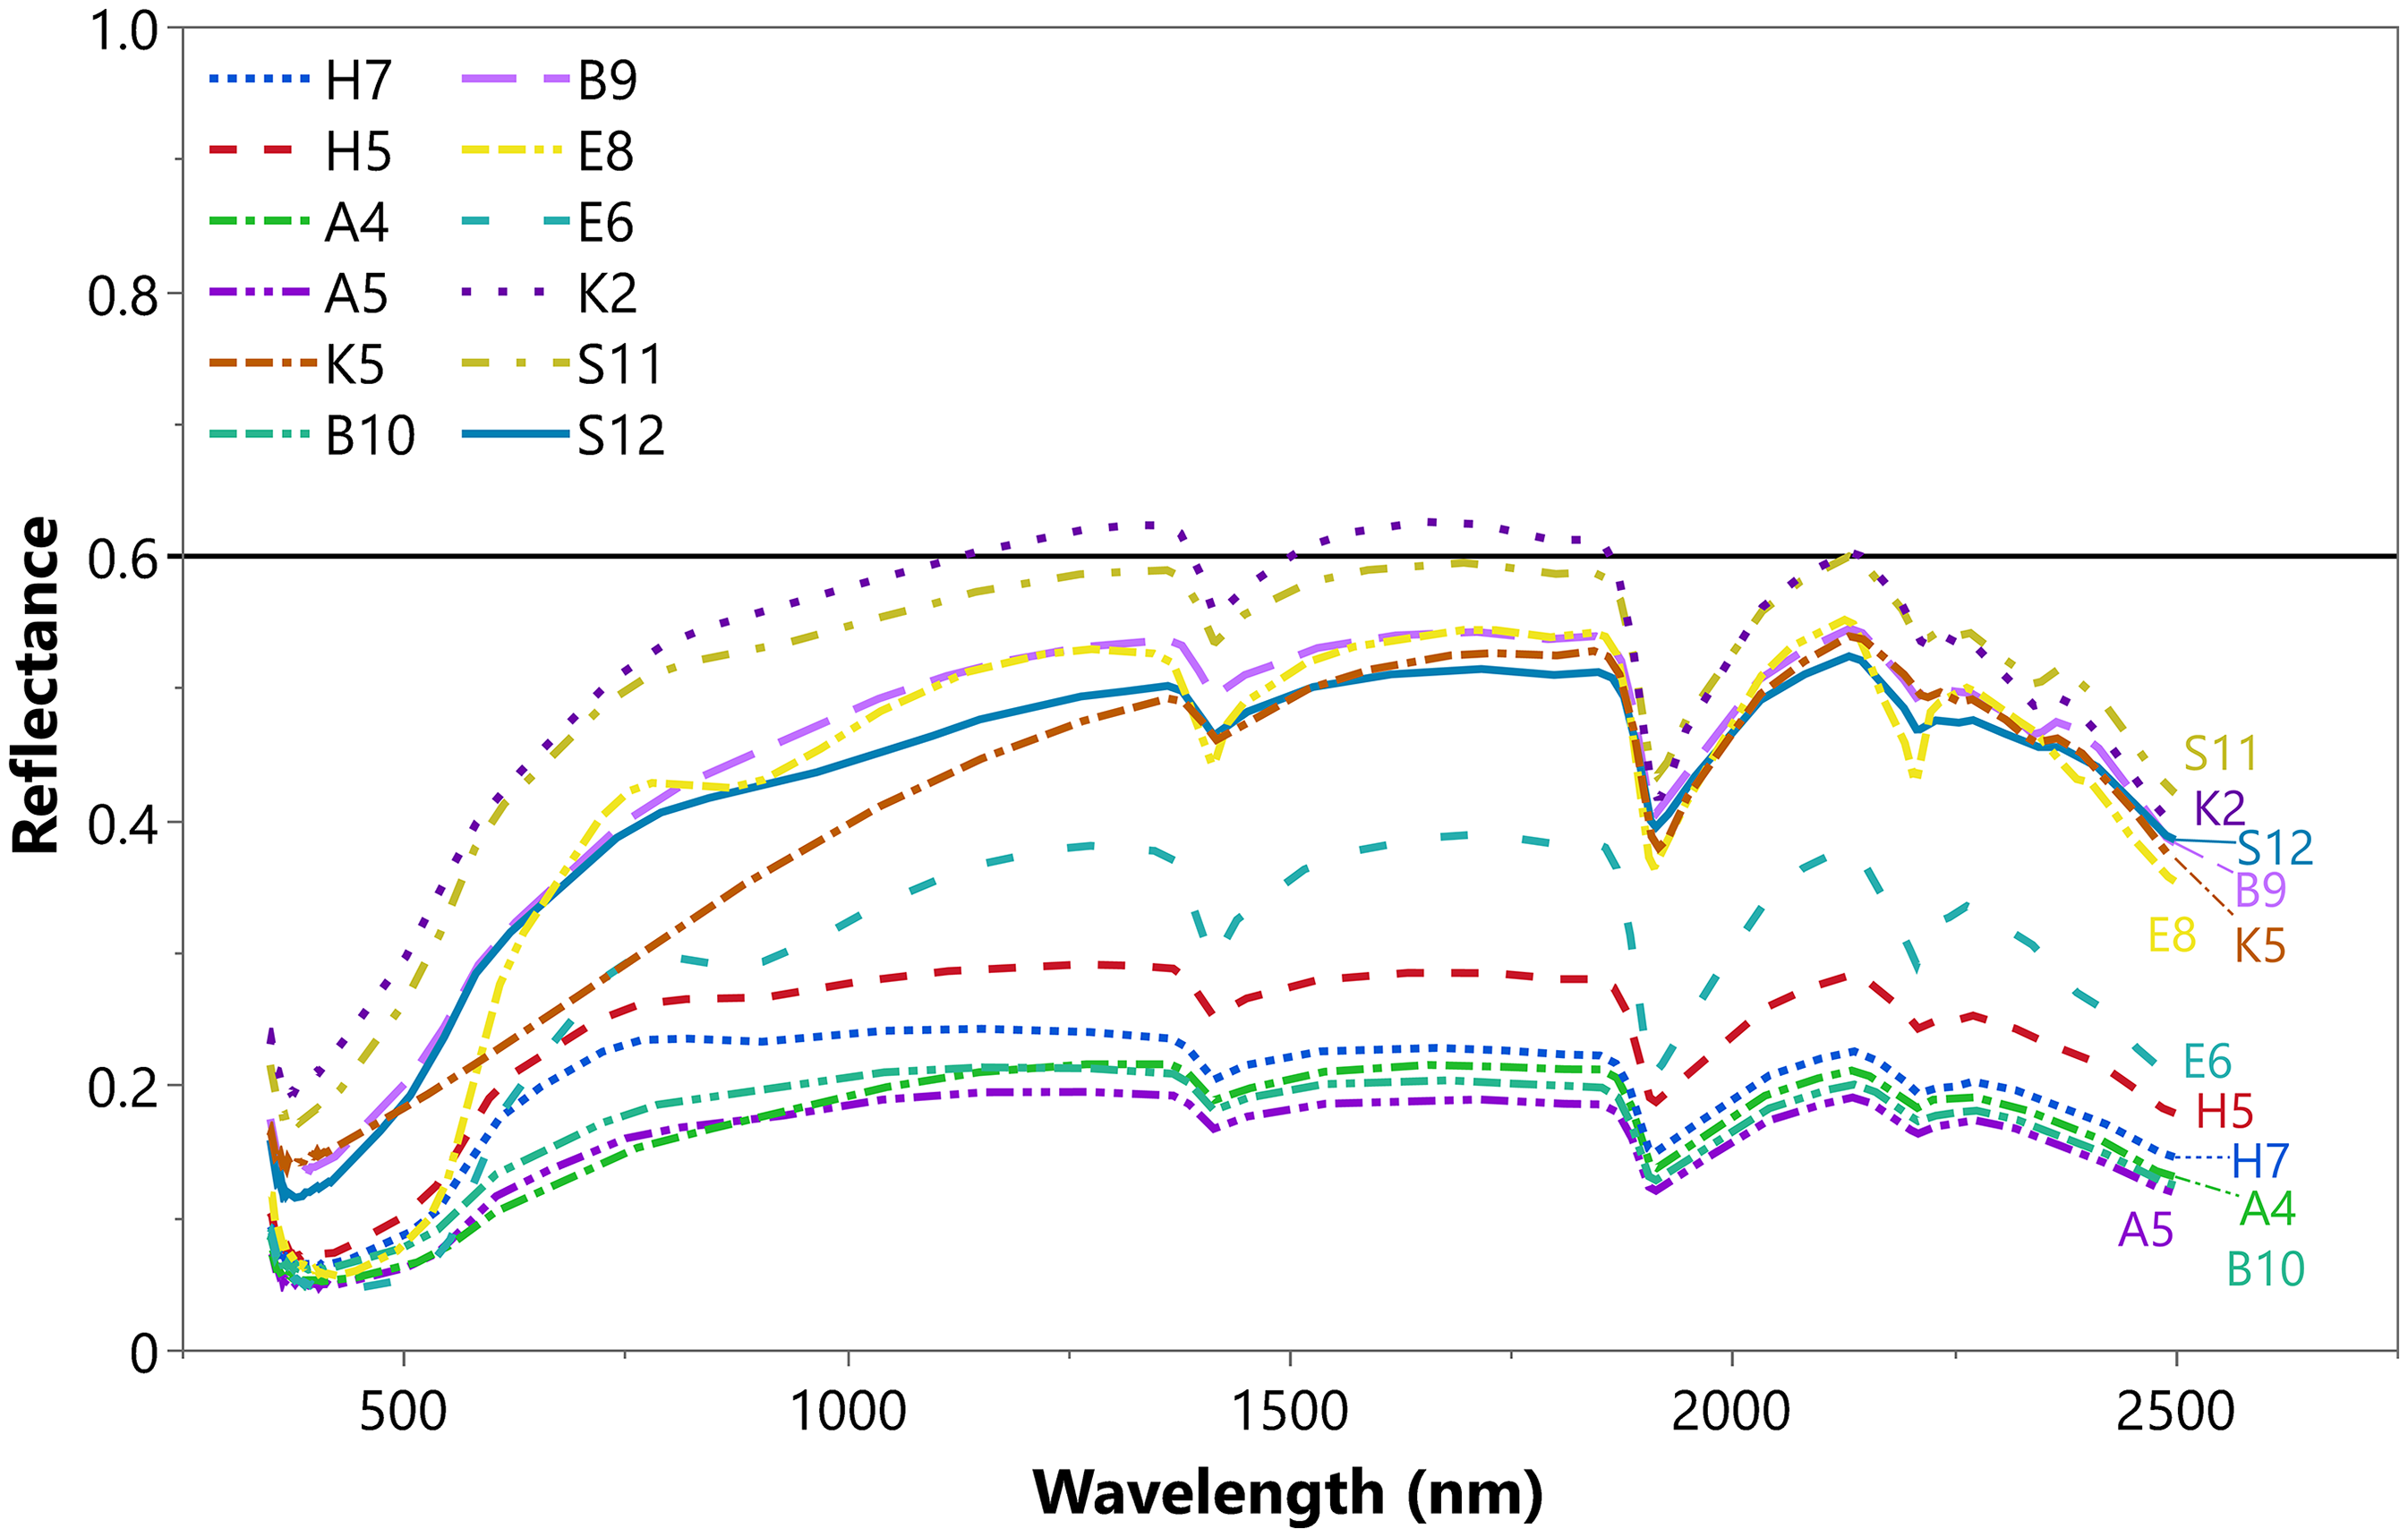
Reflectance of all soils measured with a clean white reference. The straight line at 0.6 reflectance is a reference to compare changes with Figure 2.
Figure 4 presents the LB ISS measurements obtained with both the dirty and clean WRs, along with the LB measurement provided by CSIRO. It is clearly seen that the dirty WR significantly affects the Vis region, altering its spectral slope.
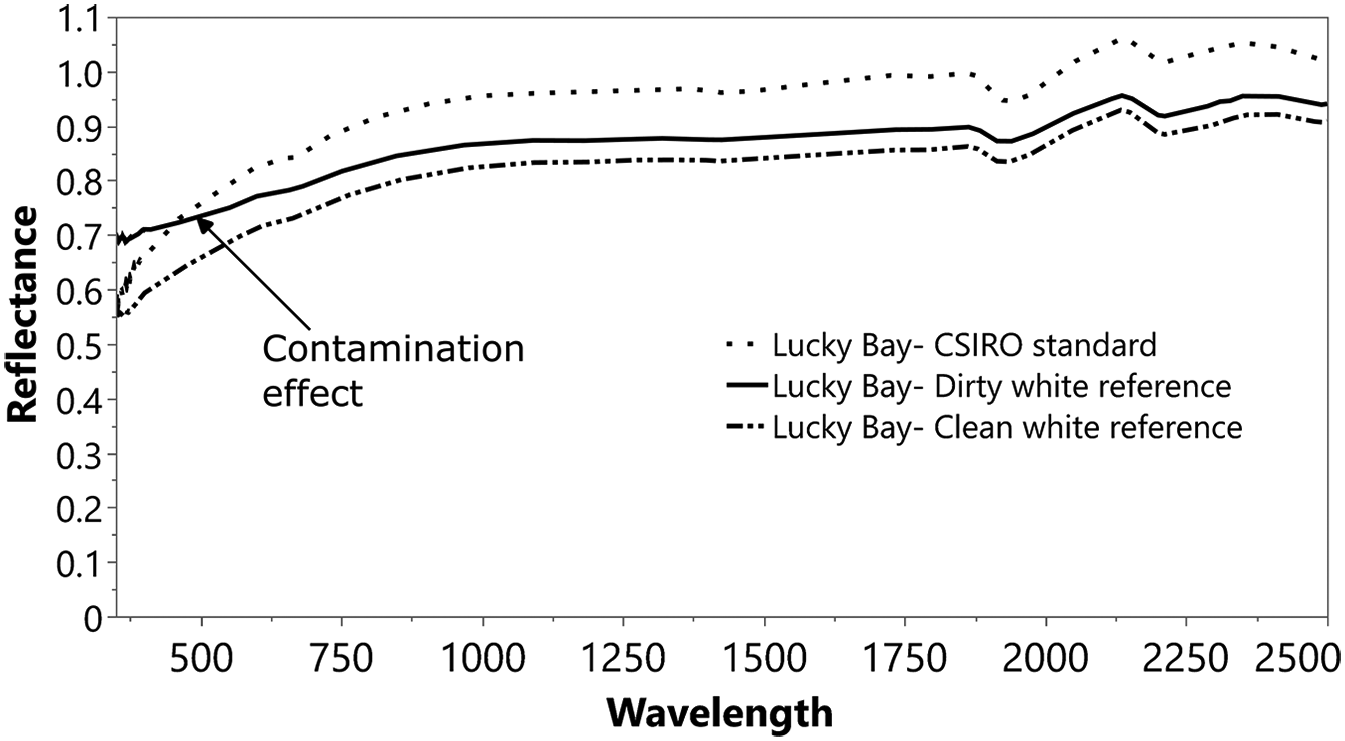
Spectral reflectance of LB ISS. Dotted line: CSIRO standard. 29 Solid line: Measured after optimizing and calibrating using the dirty white reference. Dashed line: Measured after optimizing and calibrating using the clean white reference.
Figure S2 (Supplemental Material) shows the ratio of LB dirty to LB clean, as well as the ratio between the dirty and clean WRs. These ratios exhibit similar patterns across the Vis region, explaining the discrepancies observed in datasets measured with the different WRs, as highlighted in Figure 3.
Figures 5 and 6 display the soil spectra measured with dirty and clean WRs after applying the LB ISS correction. Spectra discrepancies seem to decrease (in terms of albedo) in both WRs measurements, suggesting that the LB corrected for the shift obtained in the Vis region.
Reflectance of all soils measured relative to a dirty white reference (WR) after ISS LB correction. The straight line at 0.6 reflectance is a reference to compare changes with Figure 6.
Reflectance of all soils relative to a clean white reference (WR) after ISS LB correction. The straight line at 0.6 reflectance is a reference to compare changes with Figure 5.
Figure 7 provides examples from two selected soil samples (B9 and B10), each measured with both clean and dirty WRs and then corrected using the LB method. In both cases, the LB correction effectively reduced the discrepancies introduced by the dirty WR, resulting in nearly overlapping spectra. To quantify the effectiveness of the LB correction method we used the mASDS metric to demonstrate the effect of the LB correction. mASDS of B9 decreased from 0.008 to 0.001, and that of B10 from 0.004 to 0.002, clearly illustrating the correction’s effectiveness.
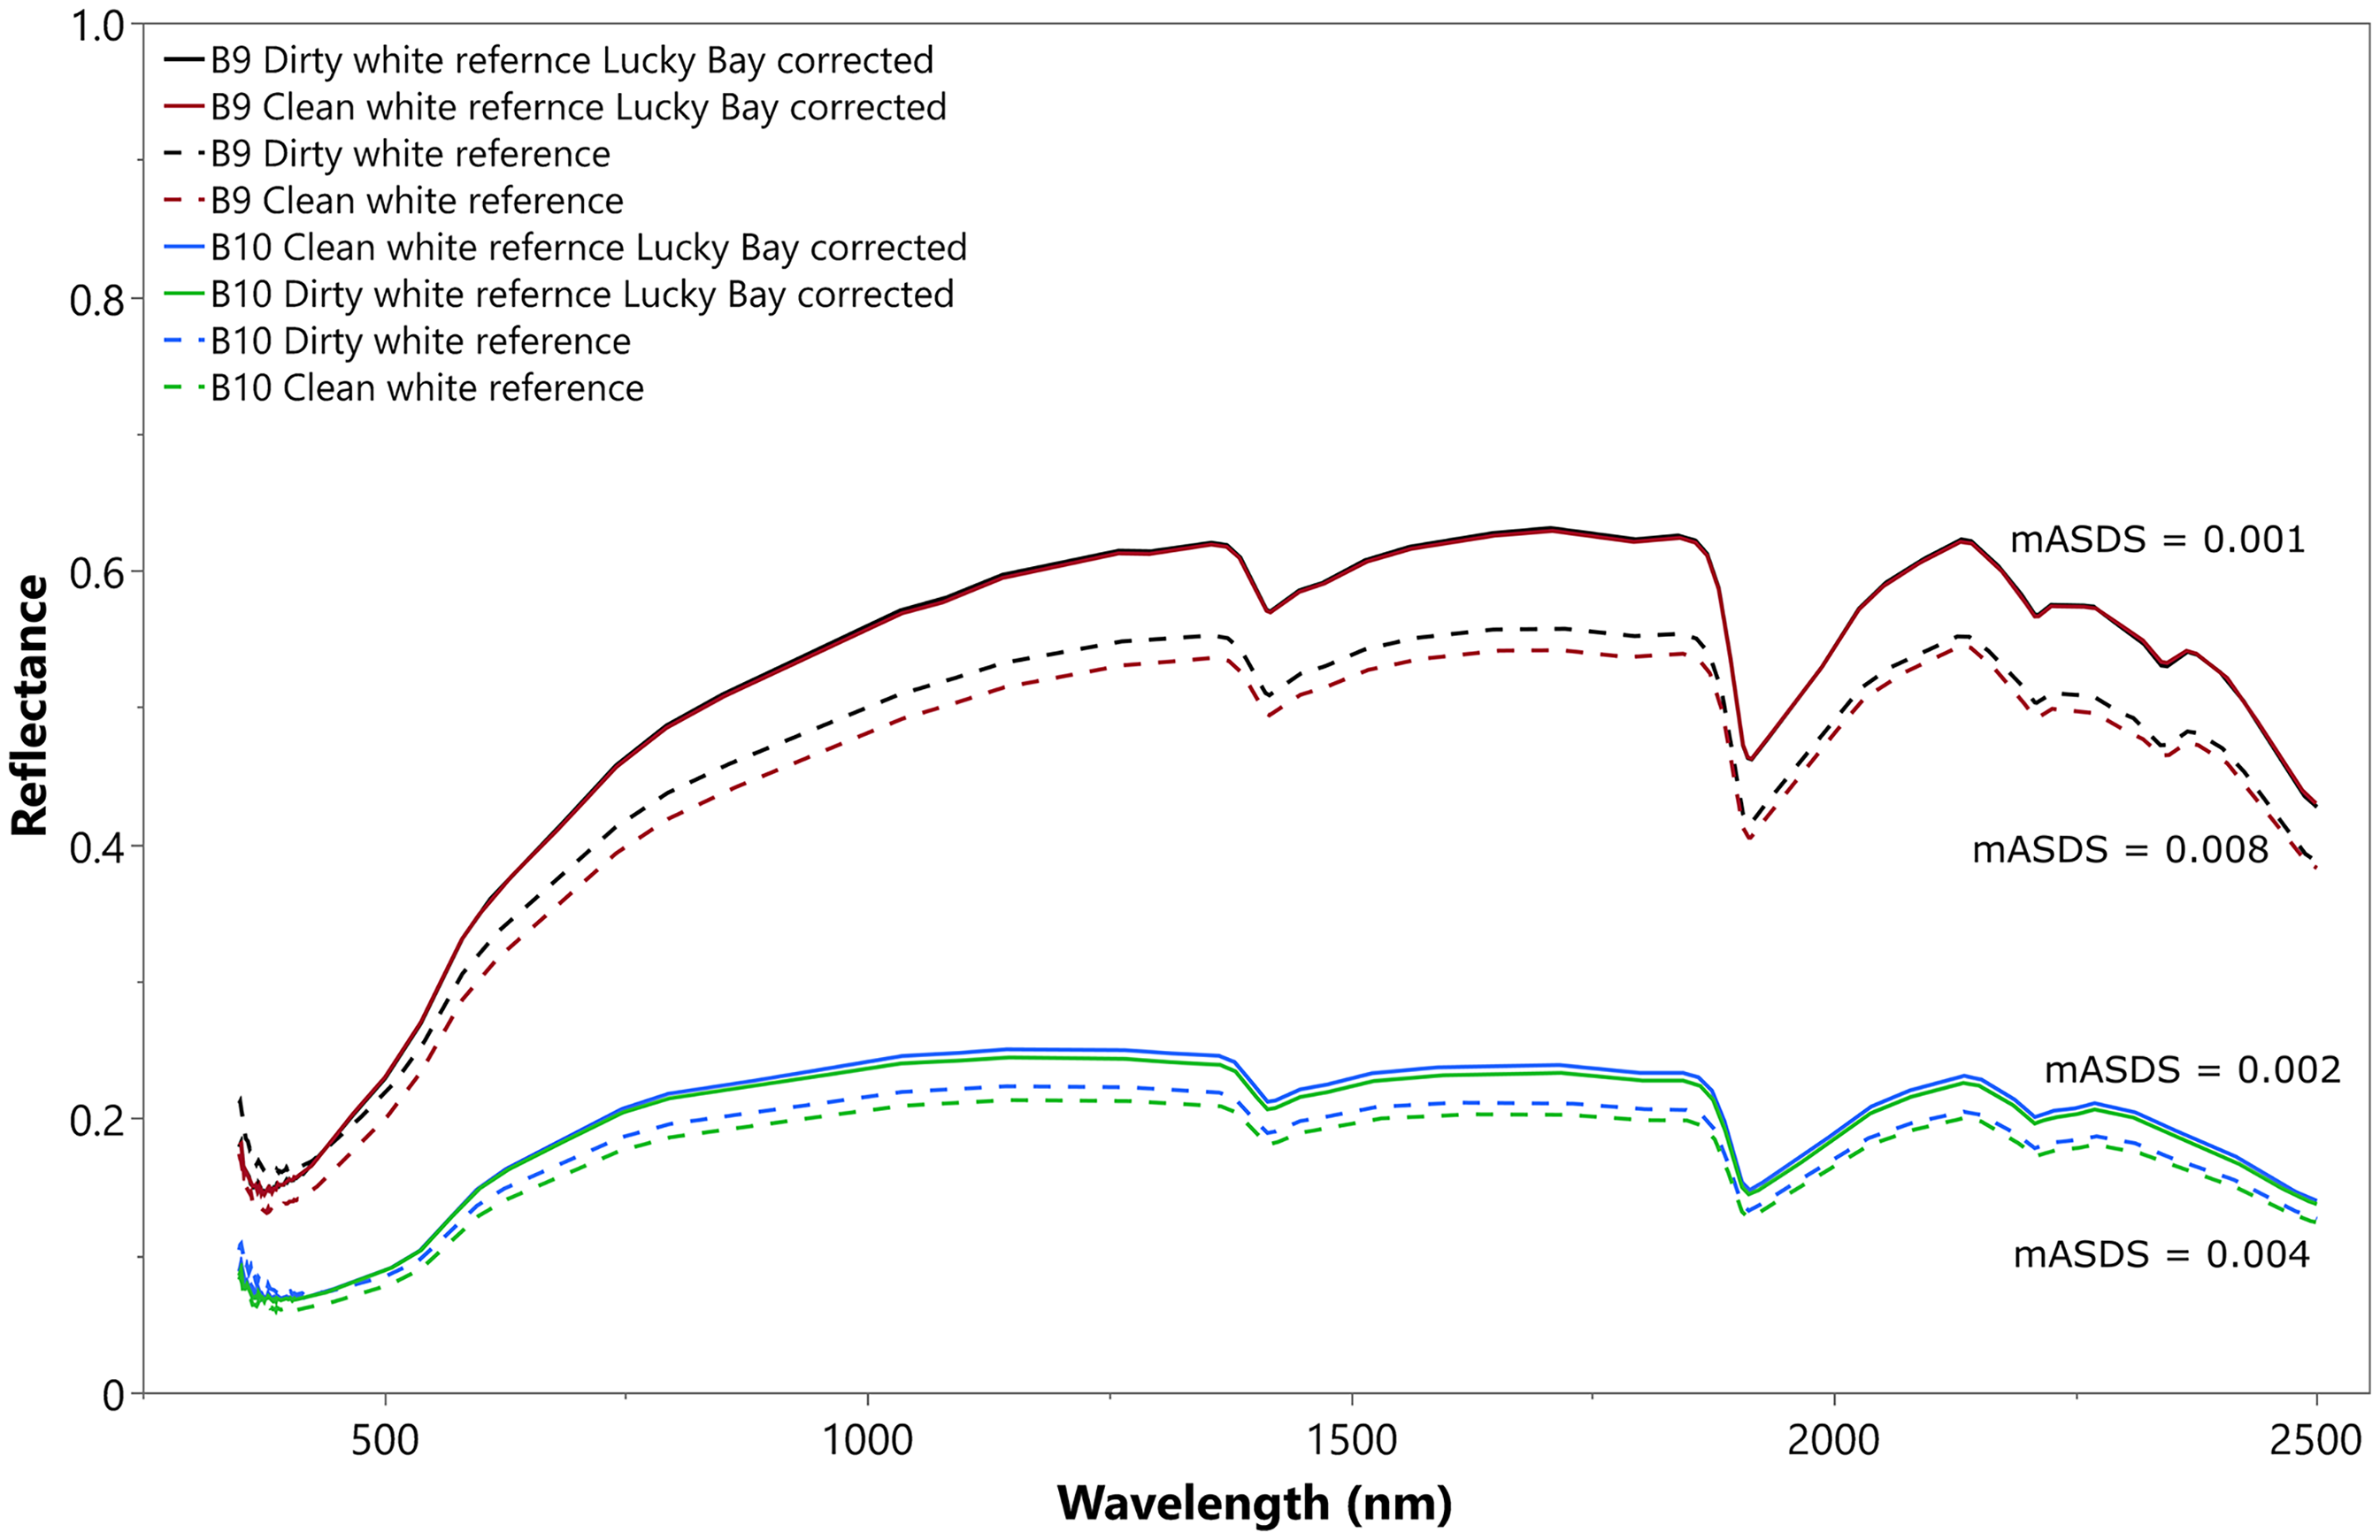
Spectral signatures of two soils (B9 and B10) measured with a clean and dirty white reference, before (dashed lines) and after (full lines) after ISS LB corrections.
To examine the broader effect across the entire sample set, mASDS values were calculated for all samples at each WR stage (dirty and clean), with and without LB correction. Figure 8 presents the results of this analysis. The correction significantly improved the spectral consistency in all soils, indicating that the LB ISS correction successfully compensates for contamination in the WR. Before LB ISS correction, the highest mASDS values were observed in samples K2, H7, K5, A4, and A5 with values of 0.024, 0.015, 0.014, 0.01, and 0.009, respectively. After LB ISS correction, the highest mASDS values were observed in soils K2, H7, A4, K5 and A5 values of 0.018, 0.011, 0.006, 0.005, and 0.005, respectively. Although relatively low compared to values reported in the literature, 30 these residual differences may result from other non-systematic effects encountered during measurements.
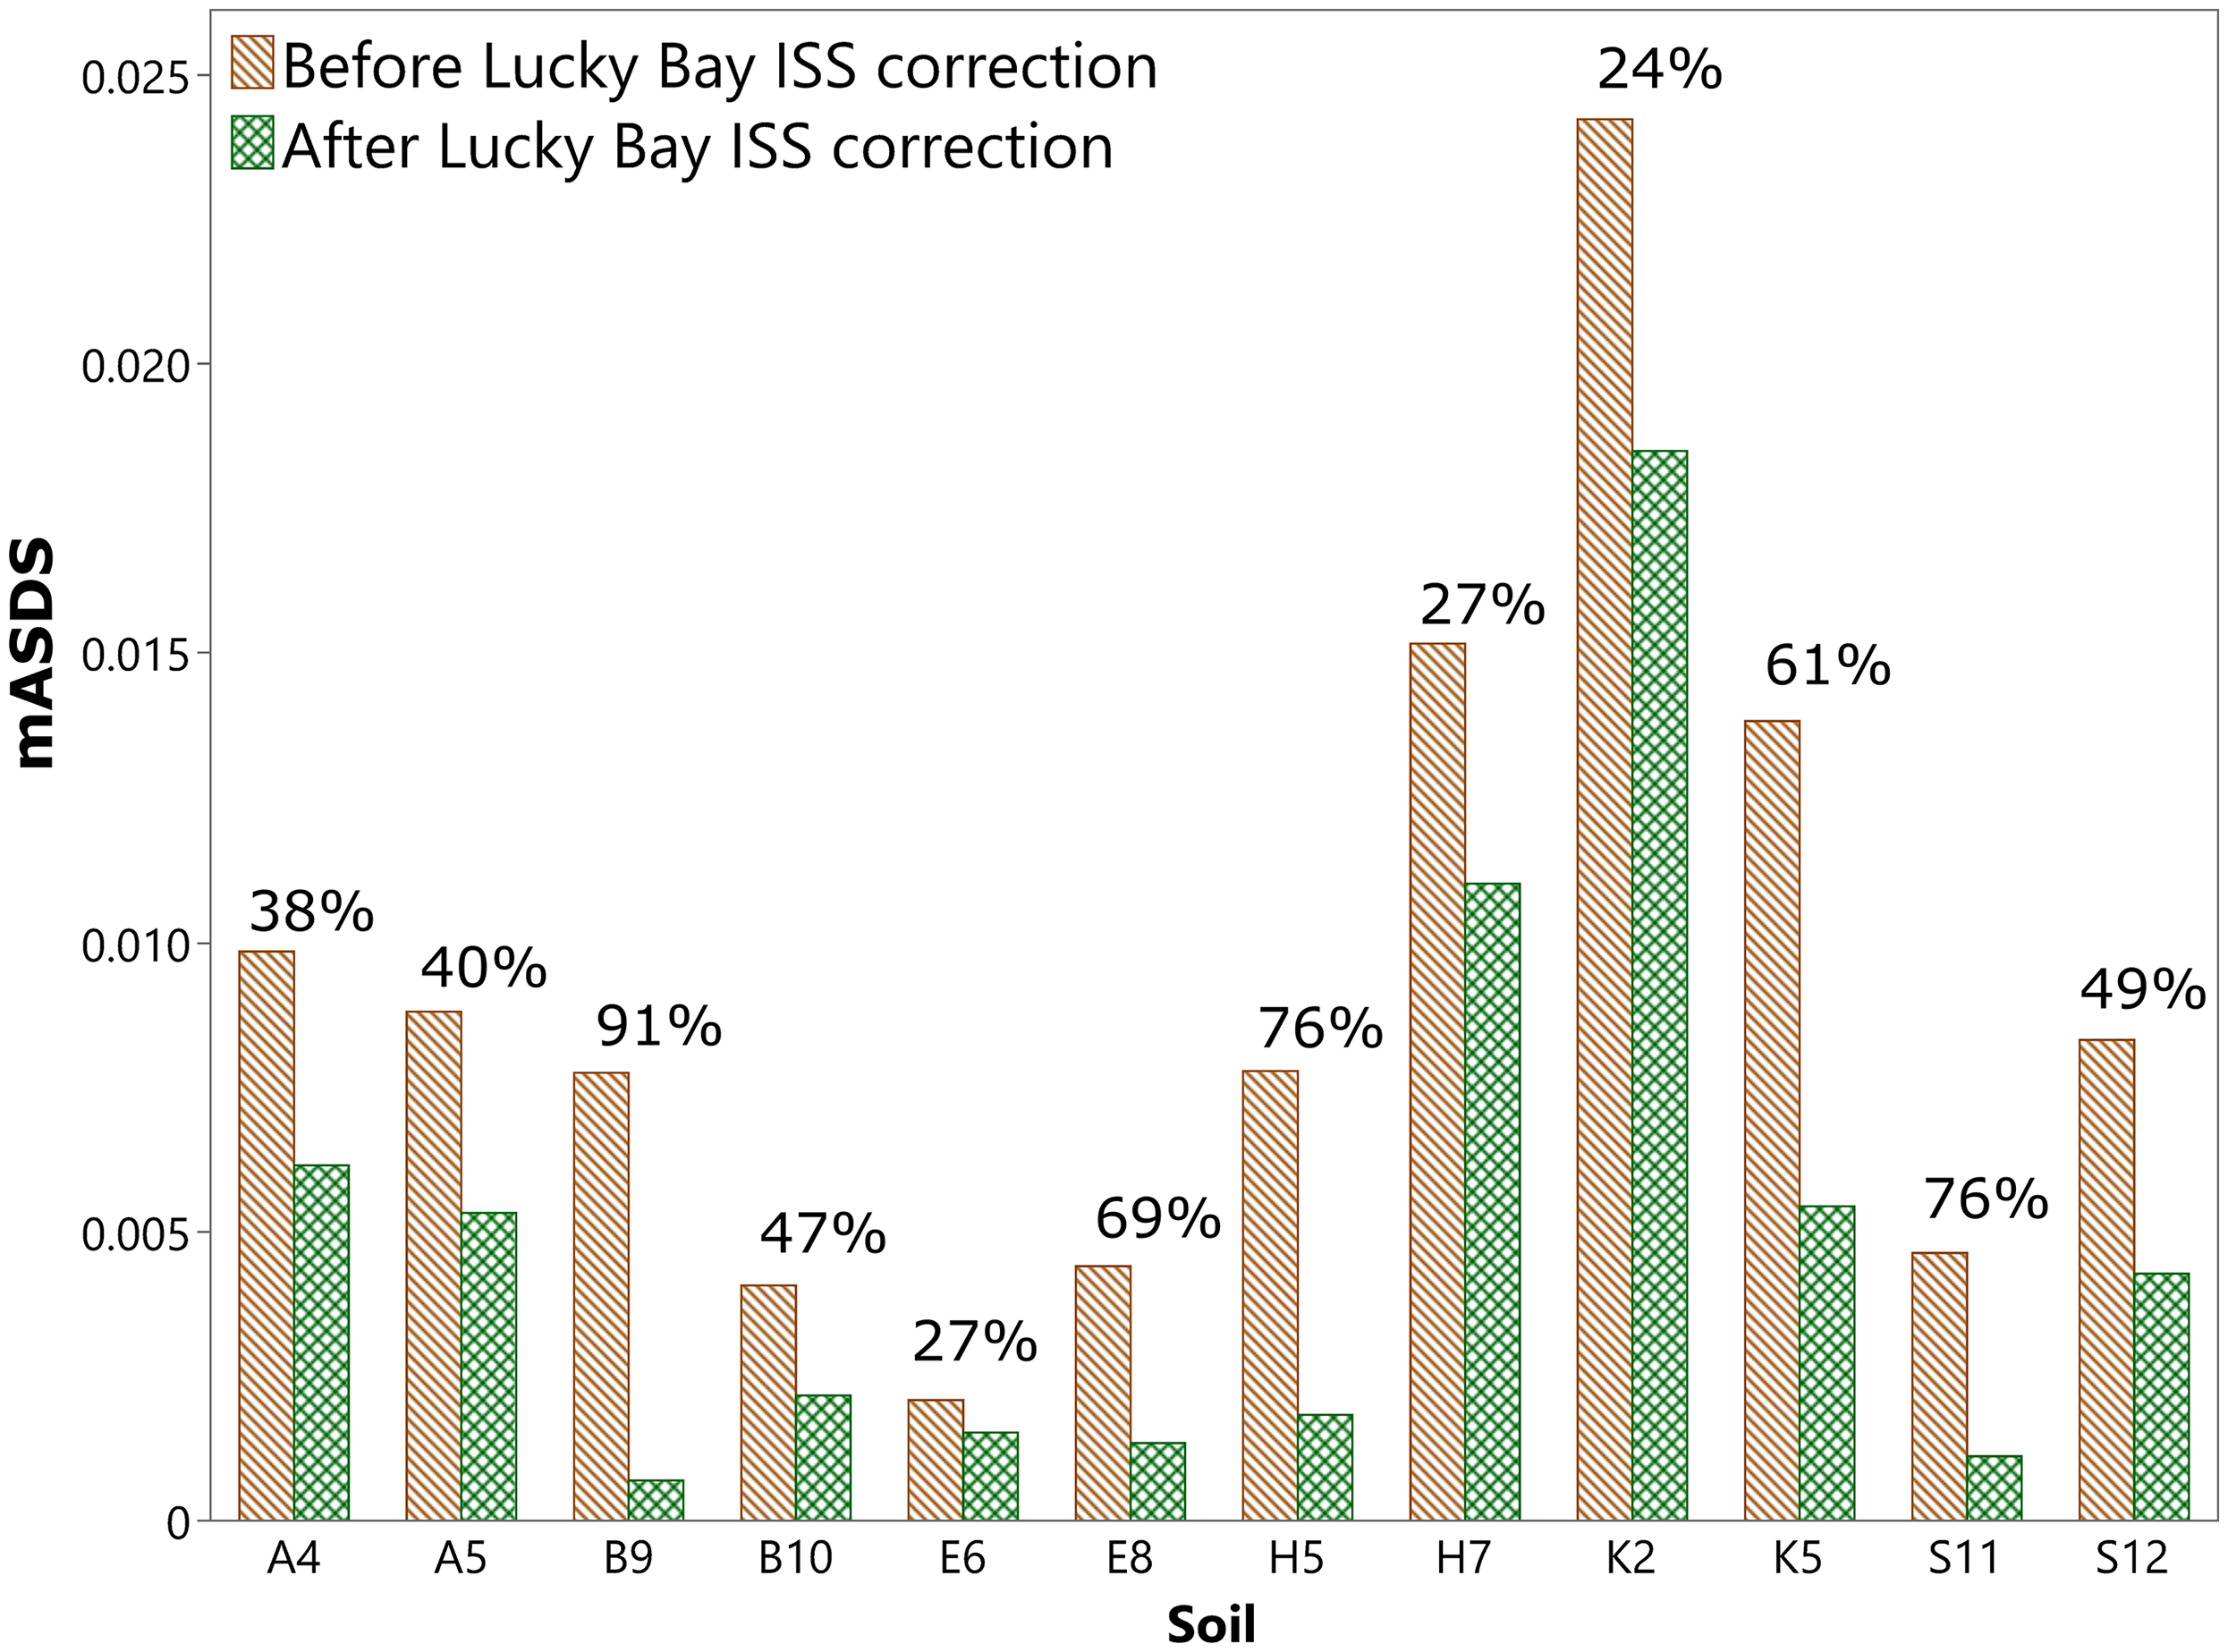
Modified average spectral difference stability (mASDS) of soil spectral reflectance before and after performing ISS LB corrections. Numbers above bars represent the percent of differences of the mASDS before and after LB ISS correction.
In practical laboratory or field settings, the WR can become contaminated, especially after extensive use with numerous soil samples. A major source of contamination can be generated if the sapphire window of the contact-probe assembly is inadequately cleaned between measurements, leading to micro- particles adhering to the assembly, that later contaminate the WR when it is been measured. Indeed, compared to the clean WR, the dirty WR appears contaminated with dust and micro-scratches (Figure 1). Since this contamination often occurs gradually and in the short term, users may not notice the slight brightness change of the WR compared to a clean WR during regular work. 21 As a result, measurements may be taken systematically using a non-ideal WR. Short-term WR contamination caused by dust, micro scratches, and even low irradiance, may introduce significant spectral distortions over time, especially in the Vis region of the spectrum which is particularly sensitive to scattering effects (Figures 2 and 3). These results agree with previous studies showing that the Vis regions is especially sensitive to WR deterioration.16,21,23 This is particularly concerning because the Vis slope is often used in soil spectroscopy models to estimate properties such as soil organic matter (SOM) 31 and iron oxides. 32 In many cases the minor changes in the WR spectrum used at the same laboratory may not be visible to the naked eye, and therefore if not considered or corrected, will affect harmonization of measurements from one session to another even within the same laboratory, and consequent downstream data analysis.
To address this issue, using a clean and well-maintained WR is essential. WR maintenance includes storage in a clean, dust-free case and in a clean environment when not in use. Lightly soiled panels can be air brushed with a jet of clean dry air or nitrogen. Heavily soiled WR panels should be restored before use, following existing protocols. 33 During lab or field work, WR exposure to direct contact with soil, vegetation, moisture, and oily substances should be minimized. A practical suggestion to avoid WR contamination is to have a dual WR setup: one very clean (and if possible, absolutely calibrated) WR, and another one as the WR used in routine measurements. From time to time a spectral measurement of both WRs should be taken. Then, a transfer function should be calculated between the two WRs to ensure that the WR used in routine measurements is aligned with the clean, calibrated WR. However, even with these precautions the WR still deteriorates and gets contaminated over time. As such, using a properly maintained ISS, can serve as an additional correction reference during measurements. the ISS correction method is conducted utilizing the standard LB ISS spectrum, which was measured with a calibrated, clean WR at CSIRO, and is available to all users (Figure 4). 29 The LB ISS correction reduced mASDS values across all soils measured in this study (Figures 5 and 6), demonstrating its effectiveness to correct, to some extent, the effects of using a dirty WR (Figures 7 and 8). Although the correction was effective in all soils, it should be noted that in some soils the correction performed better than in others (Figure 8). This may be explained by the soils’ inherent properties such as texture, CaCO3, and organic matter, Fe or other properties, or by a combination of several properties. The original paper introducing the LB ISS showed similar results, with corrections ranging from 20% to 89%. 29 Further research could be conducted to more explicitly find the underlying reasons and the most important soil properties that affect the LB ISS correction performance.
The advantage of using an ISS is that it is systematically included in every measurement session (measured before and after every five soils), allowing it to mitigate the effects of minor WR contamination and serve as a transfer standard to a reference (benchmark) laboratory. Unlike occasional recalibration practices, where a correction factor is estimated intermittently between a clean and working WR, the continuous use of the ISS, especially after each WR measurement, ensures systematic and repeatable correction. 25 WR contamination can lead to inconsistencies within a single lab, as shown here, and also when harmonizing spectral datasets collected across different laboratories using WR in varying conditions. This makes the use of a clean WR and the use of the ISS even more critical for ensuring cross-laboratory comparability, especially as soil spectral libraries are being developed and expanded globally.8,34,35 Assuming that the white reference (WR) panel deteriorates over both short and long timescales, it is essential to evaluate its spectral characteristics during every measurement session. The ISS may also help correct other systematic effects, such as instrument drift or operational inconsistencies. While measurement protocols are designed to minimize non-systematic errors, 24 such effects can still occur occasionally and should not be ignored.
The LB ISS sample itself may accumulate some contamination during lab measurements. In such cases, it is reasonable to assume that the contamination is negligible compared to that of the WR. In addition, if a severe contamination occurs within the LB sample, it is assumed that this effect will be consistent within each measurement session, introducing a systematic bias that can be corrected with the ISS correction. A practical solution to avoid LB contamination may be to split the LB sample into clean and working LB and from time to time to measure them both and generate a transfer function from the working LB to the clean LB. In the case of field work, it is impractical to use the LB sample itself in field settings, as it may become easily contaminated in field settings and relatively large amounts of LB would be required. Hence, for field work, it was recently suggested to select a soil (sand dune) that can be used as an ISS, that bridges the gap between field and lab work. 36 They term it a field ISS (FISS) and suggest correcting its’ reflectance to the LB ISS with a transfer function, thus creating a pseudo-LB for field work. As WR contamination in field settings can readily occur, using a FISS could alleviate, to some extent, the effect of a dirty WR in field settings, as shown in this study conducted in a lab setting.
In summary, the ISS is an acceptable method to harmonize spectral measurement of soils between laboratories, and its use is essential. The results show that WR contamination primarily affects the Vis region, which if not treated correctly, can significantly alter spectral data and downstream analyses. The use of a consistent ISS, which was well characterized at an agreed benchmark laboratory, is an effective method to correct WR deterioration and ensures data reliability in soil spectroscopy applications.
Conclusion
This study demonstrates that even minor, short-term contamination of a white reference (WR) panel during routine soil spectral measurements can introduce systematic distortions, particularly in the visible region, which may significantly affect the accuracy of spectral models, especially those estimating soil organic matter. Although such distortions are often visually imperceptible, they can accumulate quickly and compromise data reliability.
The Internal Soil Standard (ISS) from the Lucky Bay site proved highly effective in correcting these distortions, successfully harmonizing spectra measured with both clean and contaminated WRs. The ISS correction notably reduced the modified average spectral difference stability (mASDS) across all tested samples, confirming its utility for intra-laboratory harmonization, not just across different laboratories and protocols. Importantly, this study highlights the need to measure the ISS alongside every WR calibration, instead of only at the beginning or end of a session, as WR degradation can occur even between consecutive measurements. Incorporating ISS measurements throughout the process provides a robust means to monitor WR quality and maintain spectral consistency. Overall, the ISS serves as a valuable tool for improving data reliability, enabling consistent soil spectral measurements, and supporting the long-term integrity of soil spectral libraries.
Supplemental Material
sj-docx-1-asp-10.1177_00037028251396975 - Supplemental material for Mitigating Spectral Errors from White Reference Degradation in Soil Spectroscopy
Supplemental material, sj-docx-1-asp-10.1177_00037028251396975 for Mitigating Spectral Errors from White Reference Degradation in Soil Spectroscopy by Simon Ian Futerman, Rachel Lugassi, Jonti Evan Shepherd, Konstantinos Karyotis, Sabine Chabrillat, Thomas Schmid, José A. M. Demattê and Eyal Ben Dor in Applied Spectroscopy
Footnotes
Acknowledgments
This research received financial support from the WHEATWATCHER project, funded through the EU’s Horizon Europe program, under Grant Agreement no. 101156480.
We would like to thank the reviewers for their valuable comments.
Supplemental Material
All supplemental material mentioned in the text is available in the online version of the journal.
References
Supplementary Material
Please find the following supplemental material available below.
For Open Access articles published under a Creative Commons License, all supplemental material carries the same license as the article it is associated with.
For non-Open Access articles published, all supplemental material carries a non-exclusive license, and permission requests for re-use of supplemental material or any part of supplemental material shall be sent directly to the copyright owner as specified in the copyright notice associated with the article.