
Abstract
Liquid biopsy is revolutionizing cancer management, with circulating tumor cells (CTCs), offering a transformative approach to screening, diagnosis, and treatment monitoring. However, existing CTC isolation methods relying on antigen expression or physical properties lack robustness, are operator-dependent, and suffer from automation challenges, leading to inconsistent and time-intensive analyses. A universal, unbiased methodology for CTC detection across tumor types is critically needed. Here, we present the first proof-of-concept study demonstrating the use of Fourier transform infrared (FT-IR) microspectroscopy to study cytospun blood samples coupled with a random forest (RF) classifier, for the detection of a single CTC in the blood of a lung cancer patient as confirmed via immunohistochemistry. Notably, our method utilizes glass coverslips as substrates, routinely employed in pathology departments, enabling seamless integration with histopathological analyses (e.g., staining, immunohistochemistry). Using FT-IR spectral data from in vitro growing lung cancer cells as a training model, we achieved precise CTC identification based on biochemical composition, specifically within the fingerprint region (1800 cm–1 to 1350 cm–1). This study introduces FT-IR microspectroscopy as a novel, label-free approach for CTCs detection in liquid biopsies, with the potential to redefine cancer diagnostics. By enhancing precision and accessibility in CTC identification, the clinical implementation of this methodology may represent a significant advancement in personalized oncology, offering a clinically viable tool for real-time cancer monitoring and improved patient stratification.
This is a visual representation of the abstract.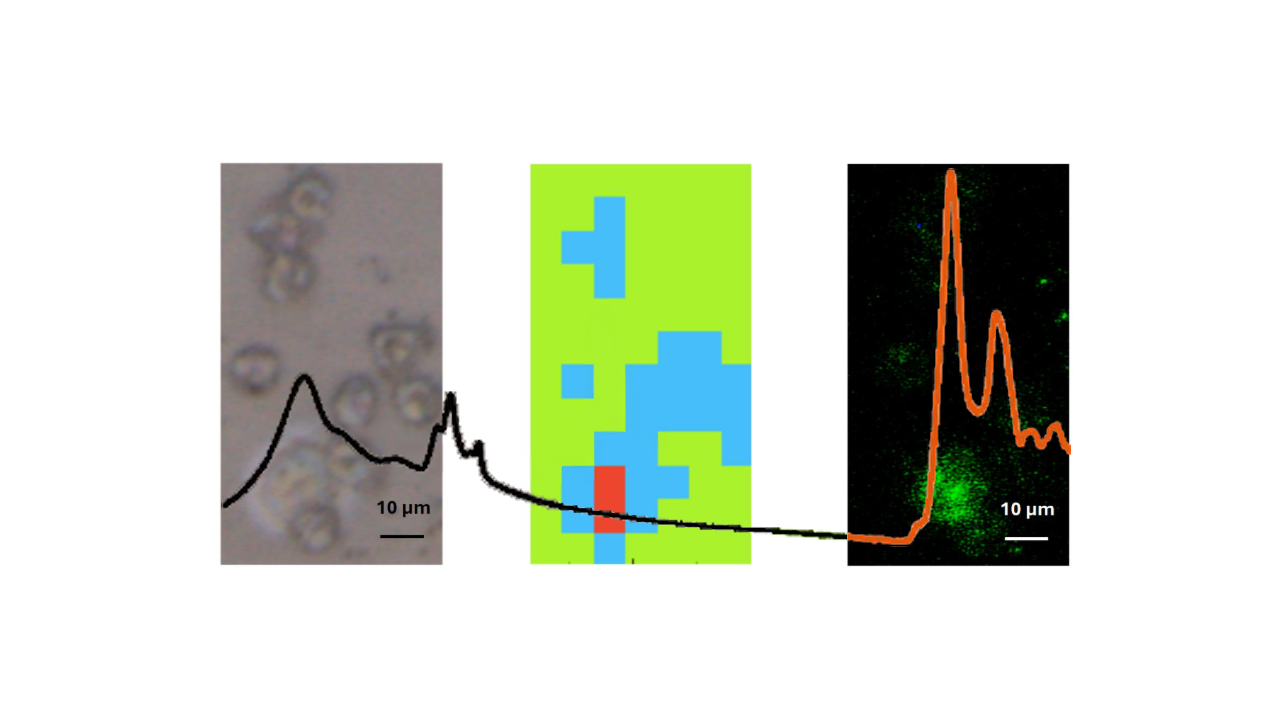
Keywords
Introduction
The work being carried out on liquid biopsy is aimed at establishing this methodology as a hallmark in the management of cancer all the way from screening to follow up after treatment. One of the blood components that can fit this aim is circulating tumor cells (CTCs). 1 Despite inherent challenges, CTC isolation from blood offers unparalleled opportunities for cancer management. Beyond enhancing screening, diagnosis, and treatment response assessment, it enables direct analysis of metastatic processes and in-vitro CTC expansion, providing crucial insights into tumor biology. The clinical significance of CTCs is globally recognized, as evidenced by their incorporation into the staging classification of the breast Cancer Staging Manual, underscoring their pivotal role in precision oncology. 2
Several techniques are available to detect CTCs with their advantages and drawbacks. Label-dependent methods detect CTCs based on the expression of molecules on the cell surface. A label-dependent method that has gained U.S. Food and Drug Administration (FDA) approval and links the presence of CTCs in blood and cancer prognosis is CellSearch. 3 It detects CTCs based on the expression of the epithelial cell adhesion molecule (EpCAM). Label-dependent techniques have the disadvantage that those cells not expressing the chosen marker(s) will be lost. This is made worse in those cases where CTCs undergo epithelial–mesenchymal transition (EMT) with cells gaining mesenchymal traits that confer stem-cell like properties, favor migration, and are associated with the loss of epithelial markers. 4 Other techniques such as microfluidics separate CTCs based on physical properties (i.e., cell size, density, deformability, or a combination of them). Parsortix is a microfluidic based technology FDA approved that captures CTCs based on size and deformability. However, these techniques suffer from clogging, missing CTCs with morphology similar to some peripheral blood mononuclear cells (PBMC), and even causing cell damage if there is increased fluid pressure inside the filters. 5 Taken together, it could be hypothesized that, using the available methodologies for CTC detection, the true number of CTCs present in blood of cancer patients might be higher than reported in the medical literature, estimated to be one CTC per 106–107 white blood cells 6 (1 mL of blood typically contains 4 × 10⁶–11 × 106 white blood cells).
An ideal CTC detection method should be rapid, robust, cost-effective, and applicable across multiple cancer types, serving as a pan-cancer diagnostic tool. Fourier transform infrared (FT-IR) microspectroscopy holds promise in this regard, leveraging infrared light to analyze the biochemical composition of biological samples. While its clinical application in CTC detection is still emerging, growing evidence, including our findings and those of others, demonstrates the potential of spectroscopy-based approaches for identifying CTCs in liquid biopsies.7–9 FT-IR microspectroscopy delivers a direct means to understand sample chemistry rather than any approach using various staining markers. Thus, it is easy to hypothesize that due to the different biochemical characteristics between PBMC and CTCs, this methodology could be used for CTC detection in blood.
A major barrier to the clinical adoption of FT-IR microspectroscopy has been the high cost of substrates traditionally used for biological sample analysis. For years, calcium fluoride (CaF2) and barium fluoride (BaF2) substrates, transparent to IR light, have remained the standard, limiting the widespread clinical application of FT-IR microspectroscopy. In fact, pathology departments widely use more affordable glass substrates, which have been considered unsuitable due to IR signal loss in the critical fingerprint region (1800 cm–1 to 1000 cm–1), 10 rich in biochemical markers such as protein and nucleic acid composition and conformation. In a breakthrough finding, our group has demonstrated for the first time that invaluable biochemical information can still be retrieved using thin glass coverslips, paving the way for a cost-effective and clinically feasible FT-IR-based CTC detection method.10–12 Furthermore, our study using blood from healthy donors spiked with commercially available lung cancer cells, has demonstrated for the first time that FT-IR microspectroscopy can reliably detect single cancer cells in blood. 9 This pivotal finding underscores the potential of FT-IR microspectroscopy as a highly sensitive, label-free technique for CTC identification, reinforcing its viability for clinical application in liquid biopsy-based cancer diagnostics. The logical step forward was to assess whether FT-IR microspectroscopy could detect CTCs in the blood of cancer patients. Thus, the aim of the present study was to set up the basis to achieve this goal by developing a blood-based model where blood samples from healthy volunteers spiked with either A549 lung adenocarcinoma or CALU-1 squamous cell lung carcinoma cells were used as a basis to detect CTCs in a patient with lung cancer. The research here presented is a proof-of-concept methodology based on which further work can now be developed to validate, improve, and expand this approach to other types of cancer.
Experimental
Materials and Methods
For this work, two lung epithelial cancer cell lines were used, A549 lung adenocarcinoma and CALU-1 lung squamous cell carcinoma, both from the European Collection of Cell Cultures (ECACC; UK). Both cells were cultured in Dulbecco’s Modified Eagle Medium (DMEM) with 4.5 g/L glucose and 10% fetal bovine serum (FBS), 1% antibiotic (100×), 1% L-glutamine (200 nM), 1% 4-(2-hydroxyethyl)-1-piperazineethanesulfonic acid (HEPES) buffer solution (1 M), 1% sodium pyruvate (100 nM), and 1% non-essential amino acids (100×) (Merck, UK). Media was changed every three to four days. Cells were passaged by removing culture medium, adding trypsin/EDTA (Merck, UK) and incubating cells for 5 minutes. Following this incubation period, cells were collected and centrifuged at 300 × g for 5 minutes. Supernatant was removed and the pelleted cells resuspended in fresh medium. All cells were incubated at 37
The PBMC were obtained through venipuncture. In the case of healthy volunteers (three donors), the study had ethical approval by the Keele University Faculty of Medicine and Health Sciences’ (FMHS) Faculty Research Ethics Committee (MH-210190). Healthy volunteers at Keele University participating in this research (older than 18 years of age) gave informed, written consent prior to venipuncture. The volunteers’ data was anonymously linked. Only the corresponding author of this paper had access to this data. Blood (5 mL) was placed in ethylenediaminetetraacetic acid disodium salt (EDTA)-containing tubes and taken immediately to the laboratory for sample preparation. Similarly, blood from a 77-year-old male patient with the histological diagnosis of poorly differentiated invasive adenocarcinoma of the lung was obtained under the same conditions (ethical approval granted by West Midlands–Black Country Research Ethics Committee, UK; Research Ethics Committee reference number 23/WM/0272). Again, this patient’s data was anonymized and linked and only the corresponding author of this work had access to this data. This patient had a left lower lobectomy 16 months prior to entering the study followed by one cycle of atezolizumab and declining further treatment. A positron emission tomography (PET) scan 10 months prior to entering the study showed mediastinal nodal metastases and right adrenal metastases. The patient declined any treatment. Seven months prior to entering the study, a magnetic resonance imaging (MRI) scan of the brain confirmed brain metastases. The patient received stereotactic radiosurgery (SRS) for his brain metastases. At the time the blood sample was taken, the patient still had mediastinal nodal disease as well as right adrenal and brain metastases.
Sample Preparation
Blood samples from healthy volunteers were prepared as follows. In-vitro-grown lung cancer cells were removed from culture flasks as described above. Following centrifugation at 300 × g for 5 minutes, cells were resuspended in 0.9% saline; 105 in-vitro-grown lung cancer cells (CALU-1 or A549) were mixed with 1 mL of blood. This cancer cell concentration was based on our previous work. 9 In order to remove red cells from blood, 1 mL of blood containing cancer cells was incubated with 10 mL ammonium–chloride–potassium (ACK) lysing buffer (Thermo Fisher Scientific, UK) for 5 minutes at room temperature. Blood was then centrifuged at 300 × g for 5 minutes. The supernatant was removed leaving the pellet containing PBMC and cancer cells. The pellet was gently mixed with 5 mL of cold 0.9% saline and centrifuged at 300 × g for 5 minutes. The supernatant was removed, and the pellet resuspended in 0.5 mL 0.9% saline. The resuspended mixed PBMC and cancer cells were immediately used to prepare cytospin samples. Red-cell-depleted samples containing PBMC and cancer cells were deposited on glass coverslips (24 × 50 mm, 0.13–0.17 mm thickness; GalvOptics, UK) using a cytospin. Twenty microliters of the sample were deposited into the cytospin funnel and the cytospin was ran at 100 × g for 1 minute. The glass coverslips with the deposited cells were immediately fixed with 100 μL of 4% paraformaldehyde (PFA) and incubated for 15 minutes at room temperature. After fixation, samples were washed with 0.9% saline once and deionized water thrice. For each cell line, three independent experiments were prepared, and for each independent experiment, three replicates were set up. Each independent experiment corresponded to in vitro growing cells at different passage number. For each individual sample 12 to 15 individual cancer cells could be identified and confirmed using Giemsa stain to be cancer cells as we have previously described. 9
Blood from the lung cancer patient was prepared as described above but without adding any in-vitro-grown lung cancer cells. An optical microscope was used to identify potential CTCs present in the non-stained cytospins based on cell morphology (bigger cells when compared to white cells). For each cytospin, FT-IR spectral data were obtained from three to five potential CTCs and followed by immunohistochemistry (see below) to confirm whether they were cancer cells or not.
Fourier Transform Infrared Microspectroscopy
The IR spectra of samples were obtained using a Thermo Nicolet iN10 (MX) visible microscope fitted with 10× objective and a liquid nitrogen-cooled mercury–cadmium–telluride (MCT) detector. Spectra were obtained by co-adding 256 scans at 4 cm–1 resolution. Developing this methodology into a clinical application will entail mapping areas of blood samples containing individual CTCs. The size of the individual cancer cells for each cell line is about 20 to 25 µm in diameter, thus, IR spectra of individual cancer cells were obtained by 4 × 4 mapping each cell using an aperture size of 15 × 15 μm with a 10 μm stepwise both in the x-axis and the y-axis. Furthermore, and in order to avoid possible spectral data contamination from PBMC adjacent to cancer cells, only those cancer cells that remained isolated in the sample were studied. This yielded 70 A549 individual lung cancer cells and 49 CALU-1 lung cancer cells to be used as training data set. In the case of most PBMC, the cell size is 7–10 μm diameter. For PBMC, IR spectra were obtained from clusters of PBMC, as individual PBMC did not yield enough IR signal, and using 4 × 4 mapping points and the same parameters as per cancer cells. Spectral data were meticulously acquired by precisely positioning the aperture to ensure that only cellular information was captured, excluding background areas devoid of cellular material. This rigorous approach enhances the accuracy and reliability of FT-IR-based CTC detection. Background measurements were obtained under the same conditions from areas of coverslip without a biological sample. Each individual map for each cancer cell and each PBMC cluster contained 16 IR spectra, and the best one was used for training data. The selected IR spectrum was the one exhibiting the highest ratio between the peak at 1650 cm–1 (amide I) and the trough at 1800 cm–1, maximizing biochemical contrast.
The same instrument and acquisition parameters were used to map big areas of the lung cancer patient cytospun samples containing both a single CTC and groups of PBMC. These big maps were used to test the methodology and to verify the detection of individual CTCs in the lung cancer patient’s blood sample.
In order to test the performance of a focal plane array (FPA) detector, which allows one to obtain faster FT-IR images of bigger areas, cytospun blood samples from healthy donors spiked with cancer cells were also taken to the SISSI-Bio offline laboratory at Elettra Sincrotrone, Trieste, Italy. FT-IR spectra were obtained with a conventional IR source (Globar) using the Hyperion 3000 Vis-IR microscope (Bruker Optics) coupled with nitrogen-cooled 64 × 64 pixel FPA detector, in transmission mode by 15× objective and 15× condenser with a numerical aperture (NA) of 0.4. FT-IR spectra were obtained apertureless over a field of view of approximately 170 µm × 170 µm (containing at least 100 cells) binning 4 × 4, and then mosaic acquisition was set for each dataset. Spectra were collected with resolution 4 cm–1 and coadding 256 scans per spectrum with a scanner velocity of 2.5 kHz. Cytospun samples from the lung cancer patient’s blood were taken to B22 beamline at Diamond Light Source, Oxfordshire, UK, and the FT-IR spectra were obtained with a conventional Globar source using a Hyperion 3000 microscope (Bruker Optics) coupled with nitrogen-cooled 64 × 64 FPA detector in transmission mode using a 20× objective and a 20× condenser. FT-IR images were obtained apertureless over a field of view of approximately 130 µm × 130 µm and then mosaic acquisition was set for each dataset. Spectra were collected with spectral resolution 4 cm–1 co-adding 256 scans per spectrum with a scanner velocity of 2.5 kHz. The rationale to use similar instruments at two synchrotrons lies on the fact that in a clinical application, similar instruments at different centers have to provide the same results, i.e., detection of CTCs in blood.
Immunohistochemistry
Anti-cytokeratin antibody (mouse anti-human; Agilent, UK) was used to identify CTCs in blood as cytokeratin is not present in PBMC and can still be detected in epithelial cells undergoing EMT. 13 Cytospun blood samples from the lung cancer patient were quenched with 0.4% trypan blue incubated for 2 minutes at room temperature 14 and then washed twice with distilled water to remove trypan blue to stop the quenching process. After this incubation period, samples were permeabilized with Triton diluted in phosphate-buffered saline (PBS) at 0.1% and incubated for 5 minutes at room temperature. Samples were then washed twice with PBS. Following this step, samples were then blocked with goat serum (Abcam, UK) diluted in PBS at a 2% concentration (blocking buffer) by incubating them for 1 hour at room temperature. Anti-cytokeratin antibody was added, and samples were incubated for 1 hour at room temperature. Following this incubation period, samples were washed thrice with blocking buffer. The secondary antibody goat anti-mouse IgG (Abcam, UK) diluted at 1:1000 was added, and samples were incubated for 1 hour at room temperature. Following this, samples were washed once with PBS and thrice with deionized water. A549 adenocarcinoma cell line was used as positive control while PBMC were used as negative control. Samples were then studied using a fluorescence microscope.
Data Analysis
Prior to data analysis, data pre-processing was carried out using Quasar software (v.1.7.0, https://quasar.codes). Two methods of data pre-processing, widely used in spectroscopy research, were either applied in order to assess the best one for CTC detection in the blood of a lung cancer patient:
(i) Spectra were cropped to the area to be analyzed (1800 cm–1 to 1350 cm–1 for the fingerprint region and 3100 cm–1 to 2700 cm–1 for the lipid region), and second derivative applied. Second derivative has been widely used in spectroscopy for a longtime as it enhances the resolution of peaks and greatly suppresses baseline and offset variation improving the separation between overlapping absorption bands.
15
The cut-off at 1350 cm–1 is due to the use of glass coverslip as substrate as we have previously described.
11
Second derivative translation was carried out using Quasar software on the raw data for the lipid region (3100 cm–1 to 2700 cm–1) and the fingerprint region between 1800 cm–1 to 1350 cm–1 with a polynomial order of 2 in all cases. (ii) Extended multiplicative signal correction (EMSC) that allows baseline correction and normalization, and to separate chemical from physical variations in vibrational spectra, was carried out as previously described.
16
Following either spectral pre-processing as described above, a random forest (RF) classifier was used to detect the presence of CTCs in the blood of a lung cancer patient. RF is a supervised machine learning algorithm that uses a group of decision trees to make predictions.
All single spectra identified for each individual A549 and CALU-1 cancer cell (as described above) and PBMC from healthy volunteers (as described above) together with background spectra of areas devoid of cells were used as training set. The testing sets were the IR maps obtained from the lung cancer patient’s blood sample. Thus, the method was aimed at assessing whether FT-IR microspectroscopy could detect a single CTC surrounded by PBMC in the blood of a lung cancer patient.
Results and Discussion
The mean FT-IR spectra of lung cancer cell lines A549 and CALU-1, along with PBMCs from healthy donors are shown in Figure 1. The two critical spectral regions mentioned above (fingerprint and lipid regions) were used as training data to detect single CTC in the blood of a lung cancer patient.
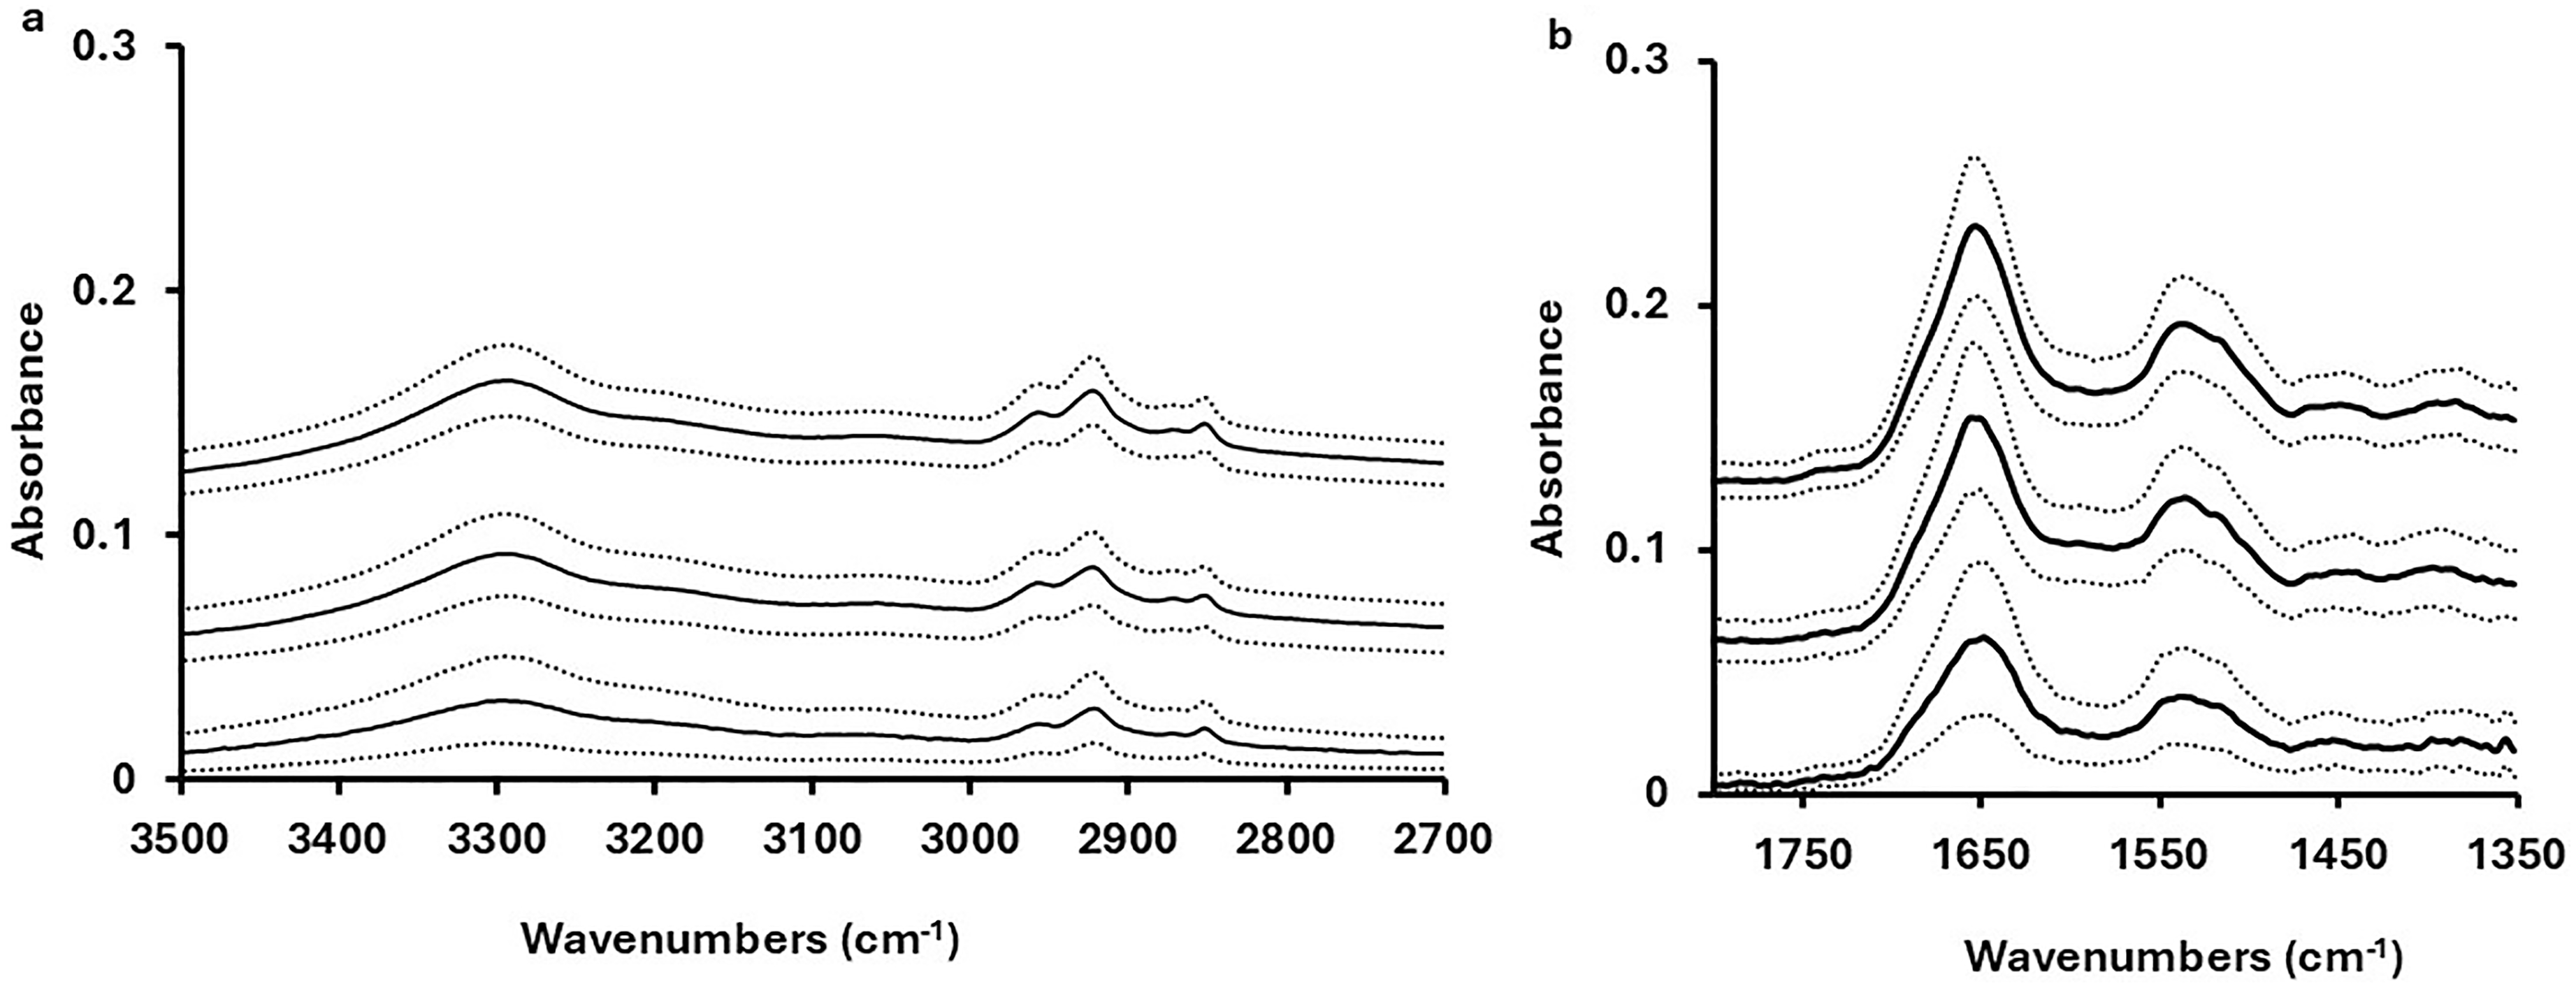
Mean FT-IR spectra following EMSC correction for A549 lung adenocarcinoma (top spectrum) and CALU-1 lung squamous carcinoma (middle spectrum) cell lines, and PBMC (bottom spectrum) with ± SD in dotted lines, for (a) the lipid and amide A regions and (b) the fingerprint region between 1800 cm–1 and 1350 cm–1. Spectra are offset for clarity.
To enhance spectral differentiation, a second derivative analysis was applied, highlighting clear differences in peak positions and intensities between cancer cells and PBMCs within the fingerprint region (Figure 2b). The main differences between cancer cells and PBMC reside at wavenumbers around 1650 cm–1 (amide I) and 1540 cm–1 (amide II). In contrast, no major differences were observed in the lipid region between 3100 cm–1 and 2700 cm–1 (Figure 2a), reinforcing the fingerprint region as the key spectral window for precise CTCs identification in this work.
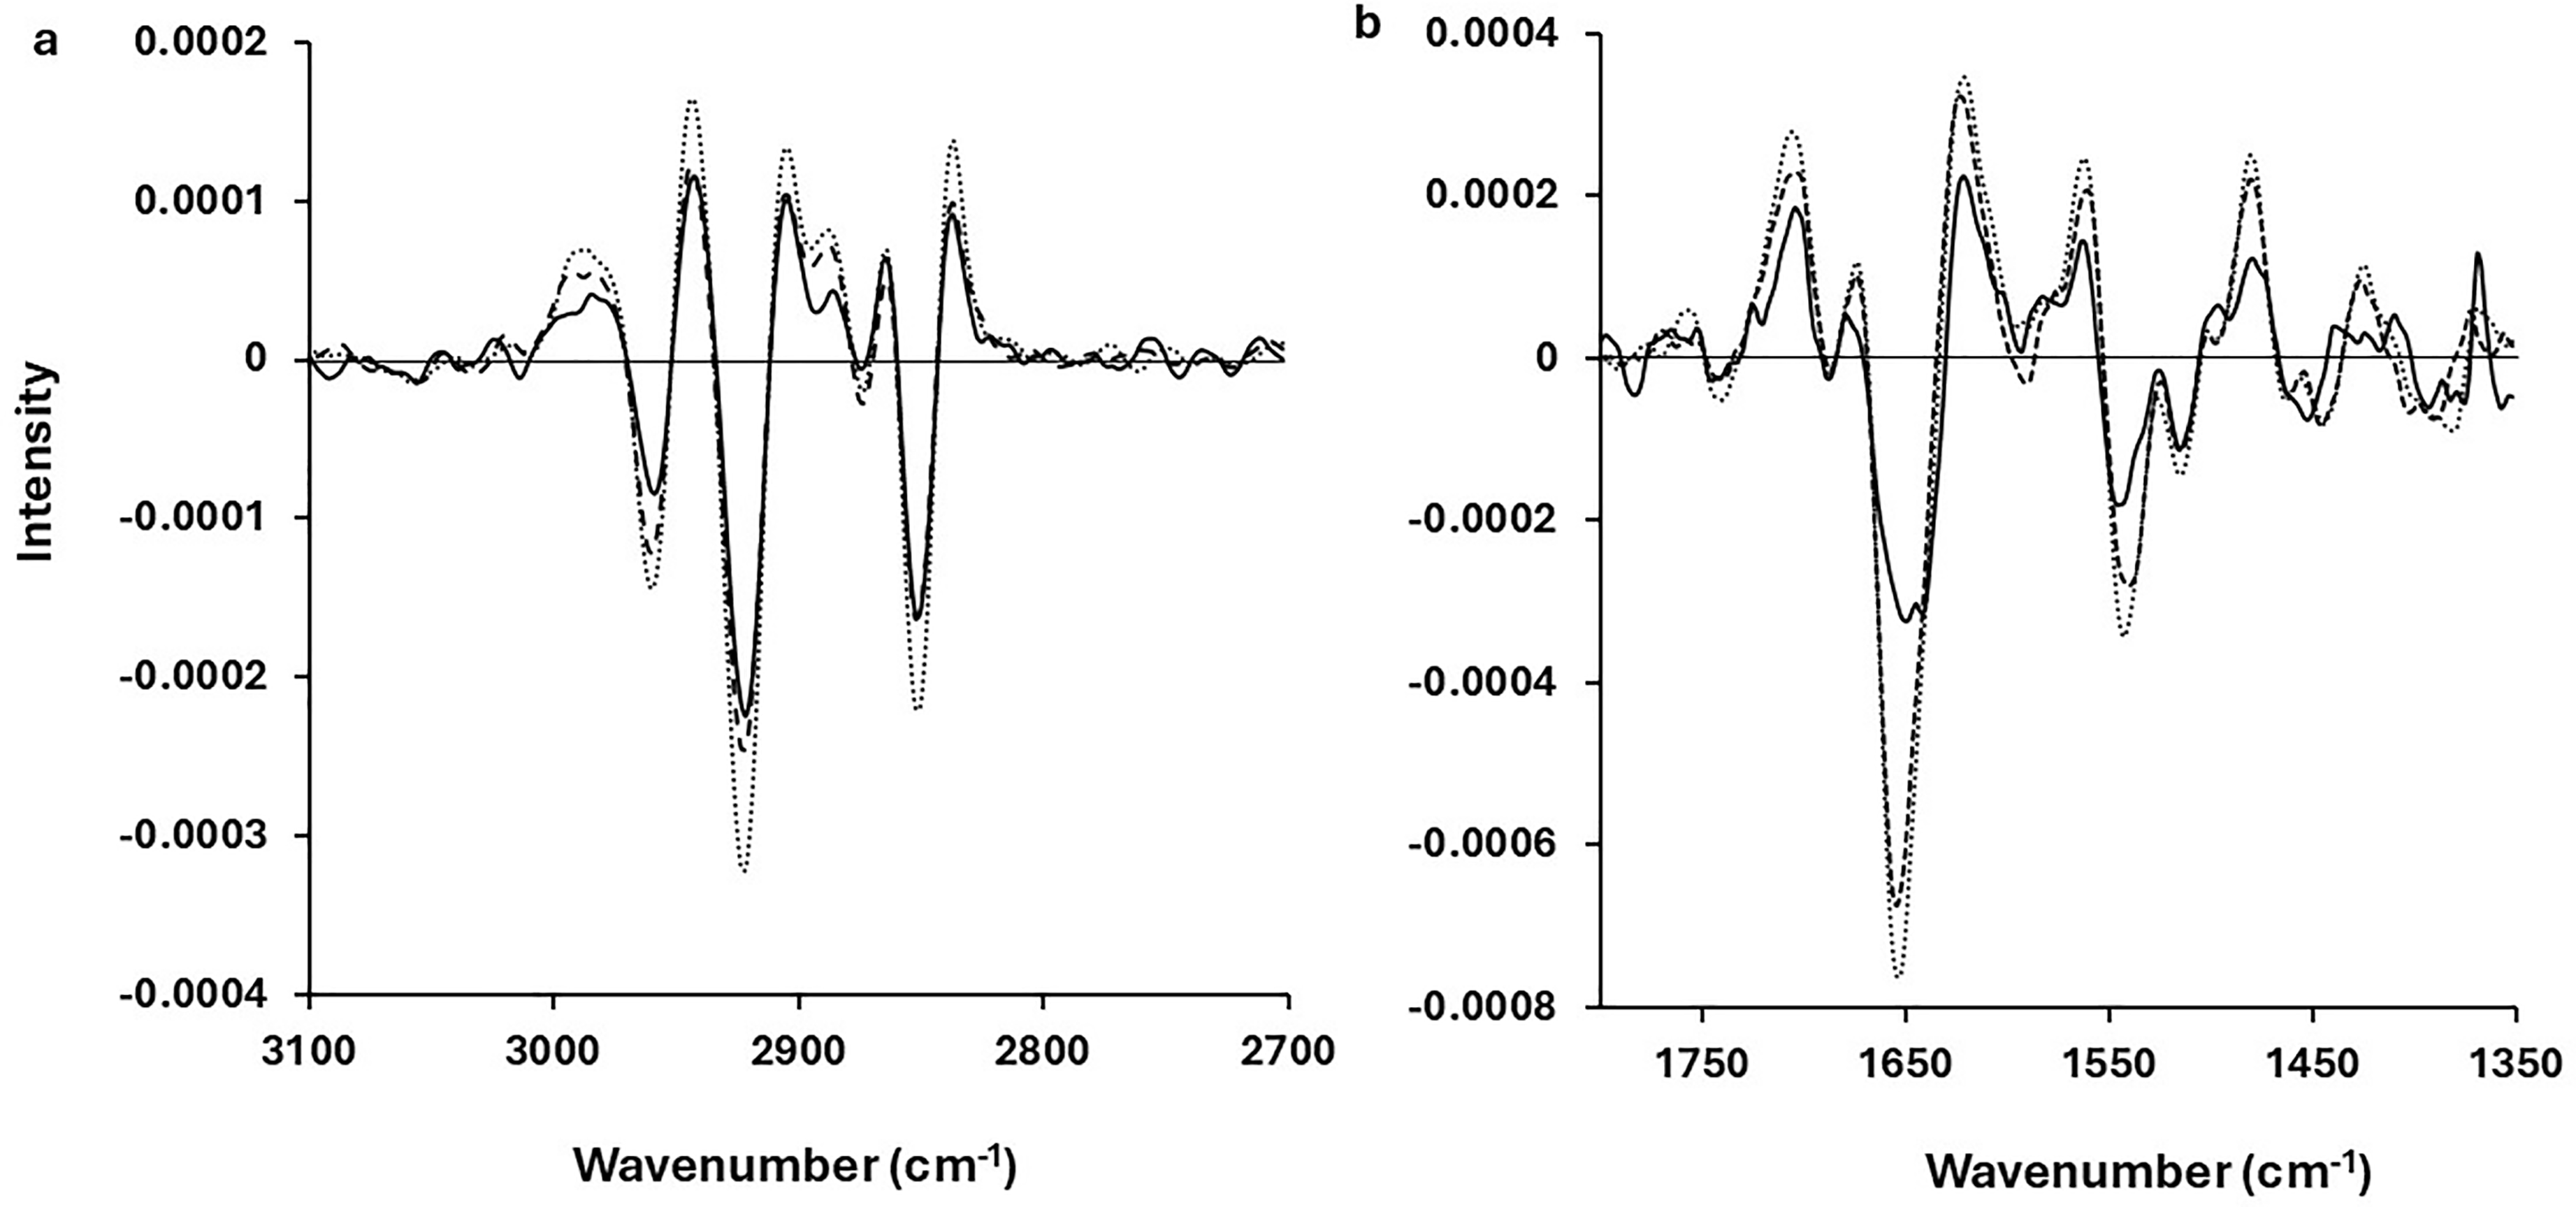
Mean second derivative spectra of PBMC (solid line), A549 lung adenocarcinoma cell line (dotted line), and CALU-1 squamous lung carcinoma cell line (broken line) for (a) the lipid region between 3100 cm–1 and 2700 cm–1 and (b) the fingerprint region between 1800 cm–1 and 1350 cm–1.
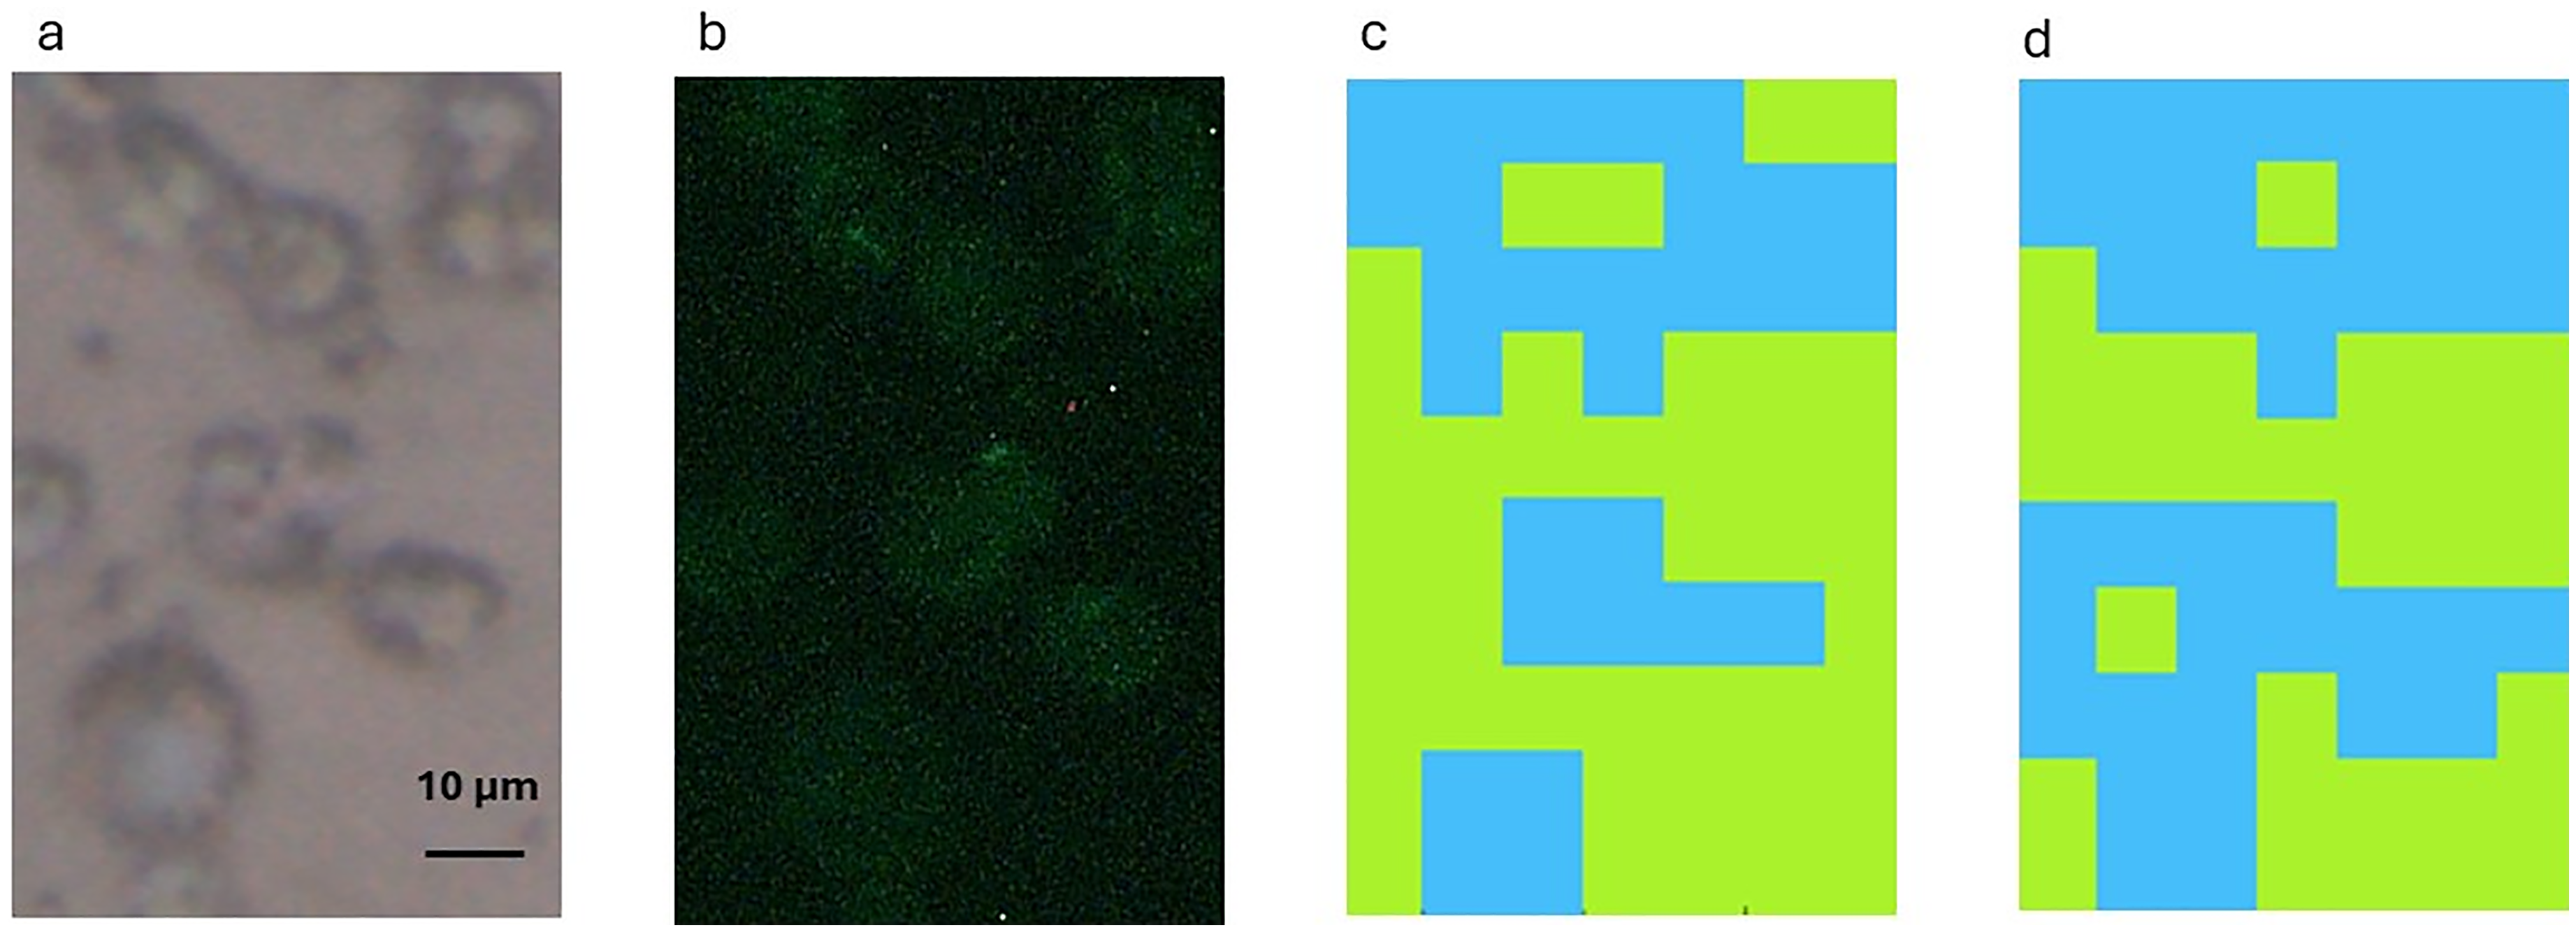
To evaluate the clinical utility of FT-IR microspectroscopy for CTCs detection, an RF classifier was trained using IR spectral data from in-vitro-grown lung cancer cells and applied to blood samples from a lung cancer patient. This approach leverages the distinct biochemical differences between cancer cells and PBMCs. Figure 3 shows a brightfield image of a cytospun patient sample confirming the presence of a single CTC among PBMCs (Figure 3a), with immunohistochemistry validation via cytokeratin expression (Figure 3b). Prior to carrying out immunohistochemistry, FT-IR spectra of this cytospun sample were obtained. At this point, three sets of IR spectral data training (using second-derivative pre-processing) were used. First, the cell line A549 (lung adenocarcinoma) spectral data was used as training data as the lung cancer patient’s histology described the presence of a lung adenocarcinoma. As can be seen in Figure 3c, when using IR spectral data obtained from the A549 lung cancer cell line as training data, as well as PBMC and a background devoid of cells, an RF classifier was able to localize the CTC in the lung cancer patient blood sample. However, this was the case when the fingerprint region between 1800 cm–1 and 1350 cm–1 was used as training data. Using the lipid region between 3100 cm–1 and 2700 cm–1 as training data did not yield a positive result (data not shown).
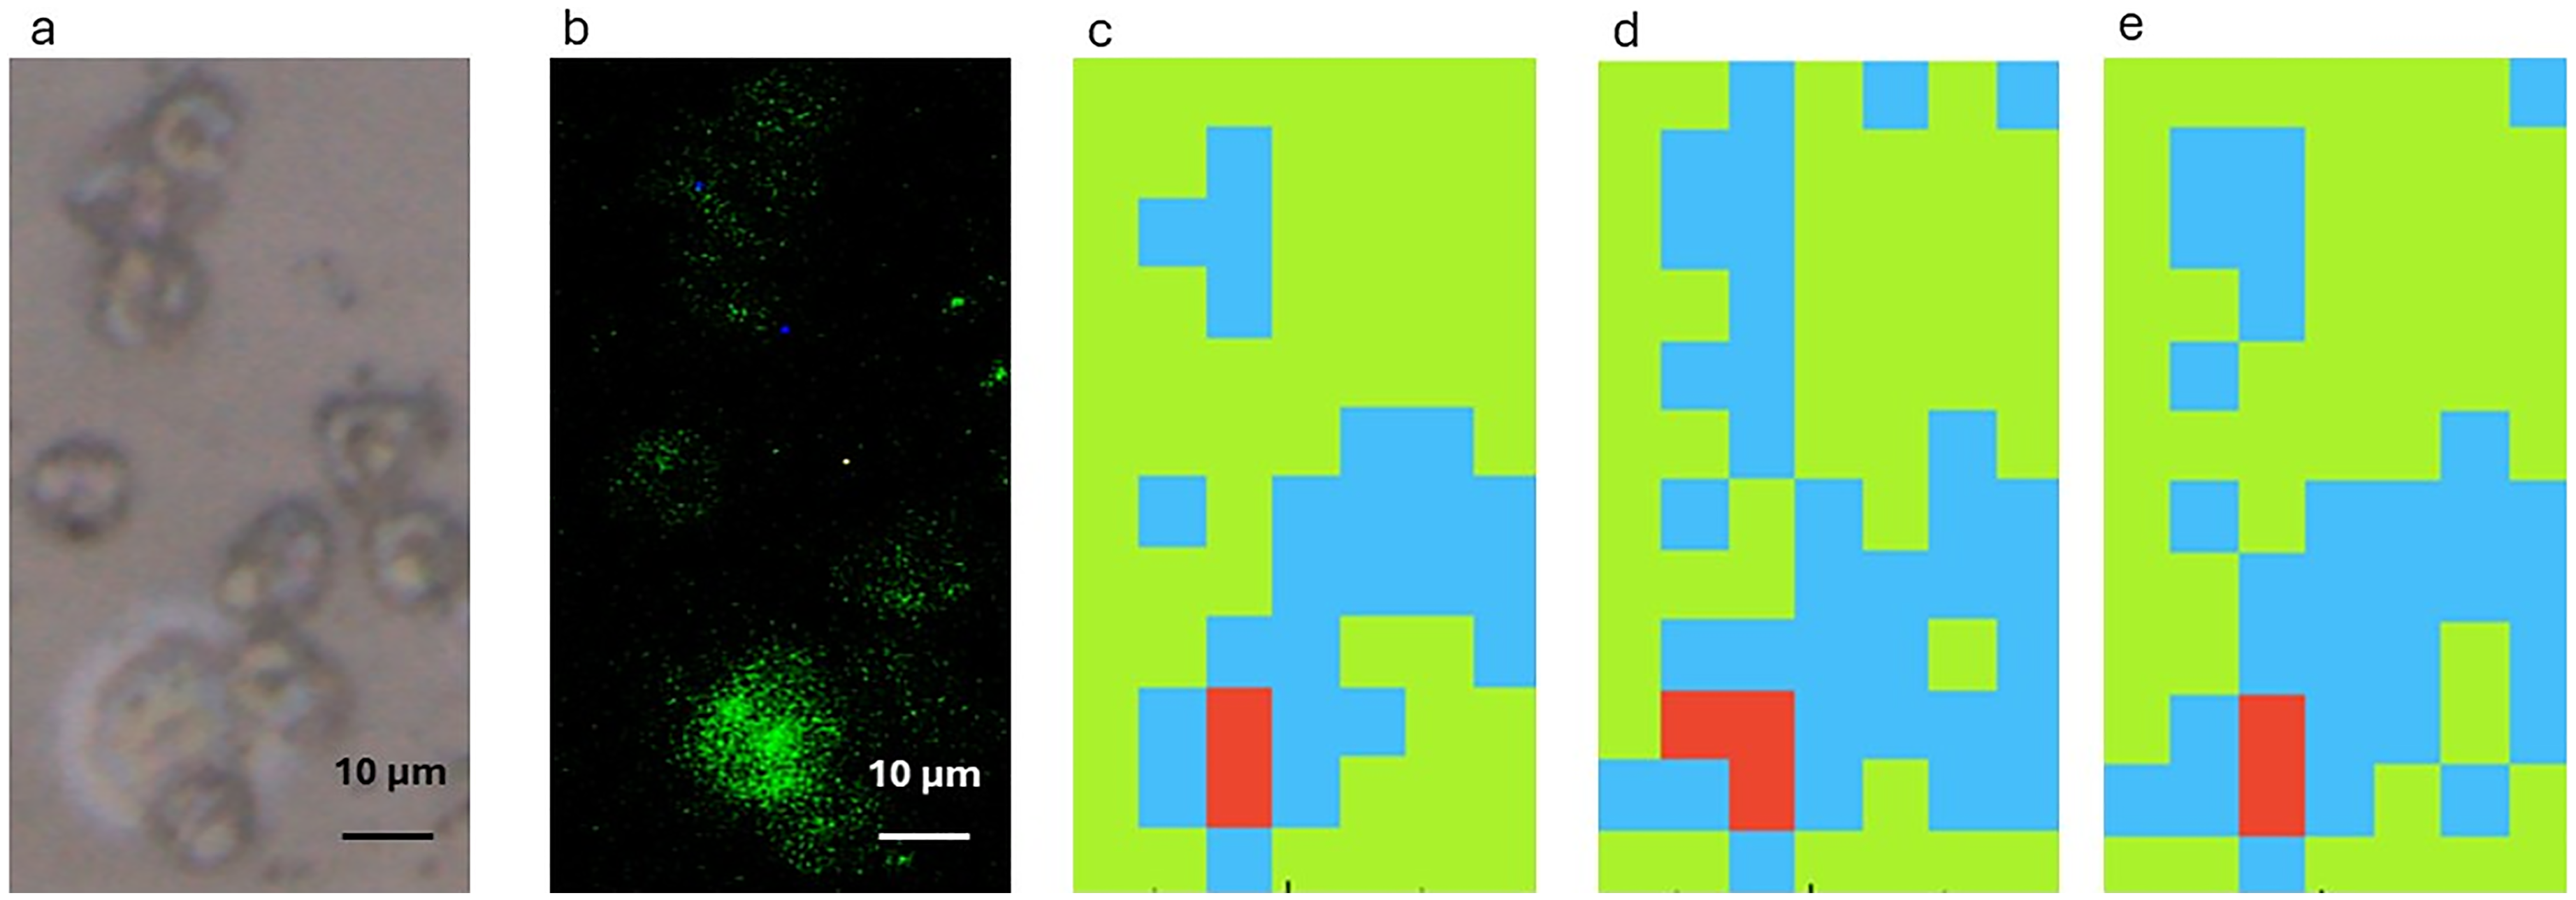
(a) Brightfield image of a cytospun sample from blood of a lung cancer patient containing PBMC and a single CTC. (b) Same sample following immunohistochemistry staining with anti-cytokeratin antibody. FT-IR spectra false colour intensity maps of the spatial region showed in (a) using random forest and the A549 cell line (c), the CALU-1 cell line (d) or A549 and CALU-1 cell lines combined (e) as training data. Background: green. PBMC: blue. CTC: red.
The next step was to assess whether using IR spectral data from a squamous cell carcinoma cell line (CALU-1) as training data, a CTC from a patient with a lung adenocarcinoma could be detected. As can be seen in Figure 3d, using data from a squamous carcinoma lung cancer cell line, a CTC in the blood of a lung adenocarcinoma cancer patient could be detected. Again, this was the case when the fingerprint region between 1800 cm–1 and 1350 cm–1 was used as training data. Using the lipid region between 3100 cm–1 and 2700 cm–1 as training data did not yield a positive result (data not shown). The combination of the IR spectral data from A549 and CALU-1 cell lines used as training data demonstrated again that the methodology is able to detect a CTC in the blood of the study lung cancer patient using the fingerprint region (Figure 3e). Again, this was not the case when the lipid region between 3100 cm–1 and 2700 cm–1 was considered. On the other hand, pre-processing with EMSC did not yield in this case the identification of a CTC in the blood of a lung cancer patient.
It could be argued that FT-IR microspectroscopy can detect CTCs as they are bigger with more biochemical material than the smaller subsets of PBMC (lymphocytes, neutrophils, eosinophils, and basophils). In fact, and as it is described in the Materials and Methods section above, the spectral data of a single PBMC with a diameter smaller than 20 µm (the case of these subsets of PBMC) did not yield FT-IR spectral data of good quality. However, it could then be more difficult to use FT-IR microspectroscopy to separate CTCs from monocytes, another cellular subset of PBMC with a diameter of 25 to 30 µm and thus a size close to the cancer cells’ size. 17 Figure 4a shows a brightfield image containing lymphocytes and a cell with a diameter higher than that of lymphocytes. Immunohistochemistry showed that this cell was negative for the expression of cytokeratin (Figure 4b). More important, the combination of FT-IR microspectroscopy and RF did not detect this cell as being a CTC. This was the case when either A549 cell line (Figure 4c) or CALU-1 cell line (Figure 4d) spectra were used as training data for both the fingerprint and lipid regions.
The work carried out so far was done through point spectra, i.e., scanning a 15 µm × 15 µm square. In order to speed up IR data collection from bigger areas, FPA was used. Figure 5a shows a bright field image of a cytospin from the lung cancer patient containing PBMC and a single CTC. This was confirmed with immunohistochemistry showing the CTC being positive for the expression of cytokeratin (Figure 5b). Due to time constraints to use the benchtop spectrometer at both synchrotrons, it was not possible to obtain enough IR spectral data from large numbers of A549 and CALU-1 cells. Thus, the IR spectral data of these two cell lines was put together and used as training data. This approach is supported by the previous successful detection of a CTC in the blood of a lung cancer patient using as training IR spectral data within the fingerprint region (1800 cm–1 to 1350 cm–1) from either of the lung cancer cell lines. As shown in Figure 5c, combining IR spectral data from both A549 and CALU-1 cell lines as training data enabled the identification of a CTC in the cytospun sample from the lung cancer patient. This detection was successful using the fingerprint region (1800 cm–1 to 1350 cm–1), but not the lipid region (3100 cm–1 to 2700 cm–1), consistent with previous findings. Notably, EMSC pre-processing facilitated the detection of the CTC in the patient sample, whereas second derivative processing did not improve detection in this instance. It is noteworthy to highlight at this stage that training datasets and cancer patient sample were collected with comparable IR imaging setups at different facilities, and that the analysis gave results comparable to the ones obtained using a different benchtop instrument operating in mapping mode.
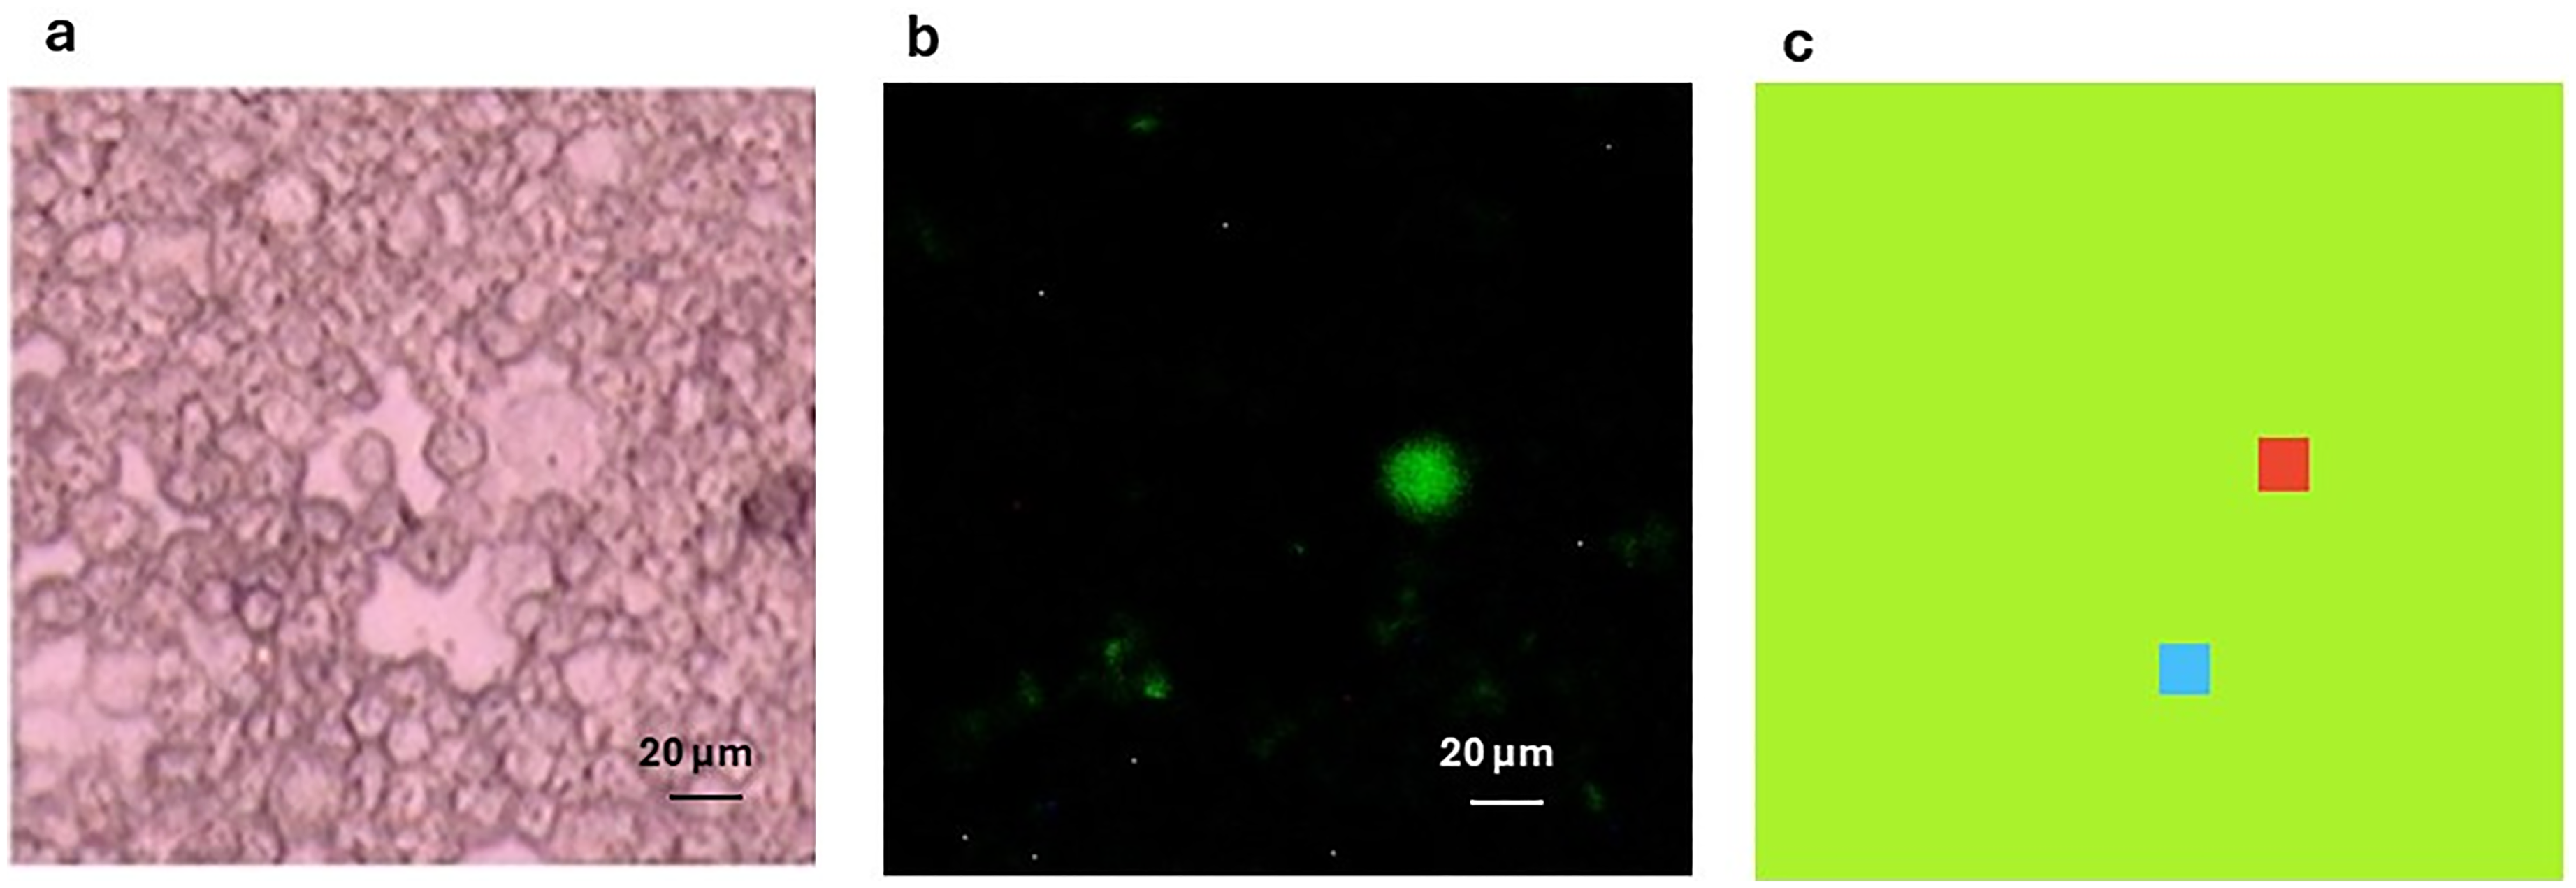
(a) Brightfield image of a cytospun sample from blood of a lung cancer patient containing PBMC and a single CTC. (b) Same sample following immunohistochemistry staining with anti-cytokeratin antibody. (c) FT-IR spectra false colour intensity map of the spatial region showed in (a) using random forest and A549 and CALU-1 cell lines combined as training data. Background: green. PBMC: blue. CTC: red.
The accurate diagnosis for the presence of CTCs in blood will no doubt be a game changer in the management of cancer, especially if the same methodology could detect CTCs from most types of cancer. The link between the presence or absence of CTCs in blood with cancer prognosis is widely accepted. 18 In the case of lung cancer, CTCs can be detected not only in early stages, 19 but also years before the diagnosis of the disease. 20 Furthermore, it could be a predictor of treatment benefit and failure prior to radiological assessment. 21 On the other hand, detection and isolation of CTCs could be the way forward in lung cancer patients with poor performance status, inaccessibility of some tumors, and insufficient tumor material for molecular testing. 21
Cancer cells develop biochemical changes that confer differences between them and their normal counterparts such as increased cell proliferation, altered metabolic pathways and aerobic glycolysis in the presence of oxygen (Warburg effect). However, similarities in biochemistry between cancer cells and their normal counterparts still remain. On the other hand, the biochemical properties of CTCs (in their epithelial form or during the EMT process) are very different from the blood cells. 5 Thus, it could be hypothesized that developing a methodology that exploits the striking biochemical differences between cancer cells and PBMC could have a clear clinical application.
The initial studies in which commercially available cancer cells are used have the drawback that these cancer cells kept in culture for a big number of passages are quite different from the primary tumor from which they originated. However, biochemical differences still remain when compared to PBMC which allow for discrimination between cancer cells and PBMC using FT-IR microspectroscopy. 9 The next obvious step is to assess whether FT-IR microspectroscopy could identify CTCs in cancer patients’ blood. That poses the following problem. In order to develop an algorithm that can detect these CTCs in blood, data is needed from hundreds if not thousands of CTCs and PBMC from cancer patients. However, we hypothesized that even if commercially available cancer cells are quite different from the original primary tumor, the biochemical differences between these cancer cells and PBMC could still be exploited to develop an algorithm to identify CTCs. This would no doubt speed up the clinical application as algorithms could be developed using these commercially available cancer cells where big sets of data can be obtained with ease. With this purpose in mind, we have shown that using two commercially available lung cancer cells (A549 and CALU-1) and an RF classifier, a CTC present in the blood of a patient with lung cancer could be easily detected. Remarkably, our findings suggest that spectral data from cells of a specific lung cancer subtype may not be required for accurate detection of CTCs. Using a commercially available lung squamous carcinoma cell line as a training data, we were able to detect a CTC from a lung adenocarcinoma patient. This breakthrough raises a compelling hypothesis: FT-IR microspectroscopy, by detecting fundamental biochemical differences between cancer cells and PBMCs, could potentially allow spectral data from one cancer type to identify CTCs in patients with various other cancers. Ongoing research is currently underway to test and validate this transformative hypothesis, which could significantly expand the clinical applicability of FT-IR-based CTCs detection across multiple cancer types.
Two methods for IR spectral data collection were used in this work, i.e., single-point microanalysis by single MCT detector and imaging via FPA detector, both using benchtop FT-IR spectrometers and thermal sources. The first mode entails that, by a 15 µm × 15 µm aperture in microanalysis, individual cells are mostly illuminated, thus providing a clearer absorption spectrum of a whole cell but at the cost of greater acquisition time. On the other hand, imaging via FPA acquisition is a faster method, since the larger field of view and number of cells measured in multiplexing mode over an area at least of 130 × 130 µm2, but at the cost of more noisy spectra since any FPA pixel is a smaller fraction of the cell area (effective pixelation of approximately 2 × 2 µm2 of the cell area). These differences in the way IR spectra were obtained could explain why different IR data pre-processing systems could yield different results when aimed at detecting CTCs. Furthermore, when pixel binning is applied, the binning procedure may mix cancer cells and close-by PBMC spectral features, further limiting the robustness of the model. Thus, software implantation is required to optimize post-acquisition pixel binning procedures that match sample heterogenicity and morphological discriminants. In addition, more work and bigger data sets are needed to assess the best way to pre-process IR data according to the method of FT-IR spectral acquisition used.
Regarding the clinical application of this methodology in pathology, we here promote the use of glass substrates which has its own drawbacks. The use of thin glass coverslips allows to obtain information in the lipid region but there is a cut-off in the fingerprint region (Figure 1b). Nevertheless, this is not a barrier to use this method to detect CTCs in blood of cancer patients as we have shown in this work. Another issue is the fragility of these glass coverslips. In order to develop an automated system where samples on these coverslips could be run, as an example, overnight and, furthermore, could later be stained or immunohistochemistry be carried out on the same sample, they need to be strong enough not to break with ease. To advance this approach, we are currently developing a system where glass coverslips are affixed to standard pathology glass slides, each containing one or two holes matching the diameter of the cytospun sample. This design ensures that FT-IR spectra can still be obtained, as the lack of underlying glass does not interfere with IR light absorption, while also enhancing the substrate's durability for pathology use. Crucially, we have demonstrated that the additional thickness from the glass slide and coverslip does not impede subsequent processing, allowing for staining 9 and immunohistochemistry with existing pathology department instruments. This innovation significantly enhances the practicality and integration of FT-IR microspectroscopy into routine clinical workflows.
This methodological proof-of-concept could be used as an initial screening tool to assess the presence or absence of CTCs in blood. Should these cells be present, then, extra samples could be obtained in order to further characterise these CTCs if needed and even try to develop cell lines from them for further studies. With a full clinical application in CTC detection, to have a rather cheap and automated technique to assess the presence of CTCs in blood would no doubt reduce the workload in pathology departments when it comes to work using liquid biopsies.
Conclusion
The integration of liquid biopsy into cancer care is redefining how patients are diagnosed, monitored, and managed. Despite progress, the reliable detection of CTCs remains a significant challenge, particularly due to the limitations of existing antigen-dependent and size-based isolation techniques. This study demonstrates a proof-of-concept that FT-IR microspectroscopy, in combination with machine learning, can successfully identify a CTC in a lung cancer patient’s blood sample. Crucially, this approach capitalizes on the inherent biochemical differences between tumor cells and normal blood cells, offering a label-free alternative that does not rely on predefined surface markers or cell morphology. The use of standard glass coverslips, already commonplace in pathology workflows, represents an important advancement overcoming previous technical and cost-related barriers associated with specialized IR-transparent substrates. Furthermore, the identification of discriminating features within the fingerprint region (1800 cm–1 to 1350 cm–1) reinforces earlier findings from spiking experiments and extends their relevance to real-world clinical samples.
Although further validation in larger, multi-cancer patient cohorts is required, these initial findings establish a solid foundation for expanding the utility of FT-IR microspectroscopy in liquid biopsy applications. With refinement and broader clinical testing, this method holds promise as a practical, scalable, and cost-effective tool to enhance cancer diagnostics and possibly treatment monitoring through blood-based testing. In summary, this study highlights a novel, translationally relevant strategy for CTC detection and marks a meaningful step towards more accessible, personalized cancer care. With continued development, FT-IR microspectroscopy could play an important role in shaping future diagnostic pathways within oncology.
Footnotes
Acknowledgments
Funding from the UHNM Charitable Fund and the North Staffordshire Medical Institute is greatly appreciated. Funding for CE came from a philanthropic gift in a will left to Keele University. Dr Eric Hill (Chemistry Department, Loughborough University) help with immunohistochemistry is greatly appreciated. Work at Elettra Sincrotrone was carried out at SISSI-BOFF Beamline, Beamtime number 20237124. Work at Diamond Light Source was carried out at Beamline B22, Beamtime number SM36088.
Data Availability
Declaration of Conflicting Interests
There are no conflicts to declare.
Ethics Approval
Experiments involving healthy controls were performed according to the Keele University Faculty of Medicine and Health Sciences’ (FMHS) Faculty Research Ethics Committee (ethical approval reference number: MH-210190). Experiments involving a lung cancer patient were performed according to West Midlands–Black Country Research Ethics Committee, UK. Research Ethics Committee (reference number: 23/WM/0272).
Funding
LD was funded by a grant from the UHNM Charitable Fund and the North Staffordshire Medical Institute. Funding for CE came from a philanthropic gift in a will left to Keele University.