
Abstract
The clinical translation of Fourier transform infrared (FT-IR) microspectroscopy in pathology will require bringing this technique as close as possible to standard practice in pathology departments. An important step is sample preparation for both FT-IR microspectroscopy and pathology. This should entail minimal disruption of standard clinical practice while achieving good quality FT-IR spectral data. In fact, the recently described possibility of obtaining FT-IR spectra of cells placed on glass substrates brings FT-IR microspectroscopy closer to a clinical application. We have now furthered this work in order to identify two different types of lung cancer cells placed on glass coverslips. Two types of sample preparation which are widely used in pathology, cytospin and smear, have been used. Samples were fixed with either methanol, used in pathology, or formalin (4% paraformaldehyde) used widely in spectroscopy. Fixation with methanol (alcohol-based fixative) removed lipids from cells causing a decrease in intensity of the peaks at 2850 cm−1 and 2920 cm−1. Nevertheless, we show for the first time that using either type of sample preparation and fixation on thin glass coverslips allowed to differentiate between two different types of lung cancer cells using either the lipid region or the fingerprint region ranging from 1800 cm−1 to 1350 cm−1. We believe that formalin-fixed cytospin samples would be preferred to study cells on thin coverslips using FT-IR microspectroscopy. This work presents a clear indication for future advances in clinical assessment of samples within pathology units to gain a deeper understanding of cells/tissues under investigation.
Keywords
Introduction
It is widely accepted that Fourier transform infrared (FT-IR) microspectroscopy has a potential as a diagnostic tool in histopathology. However, in spite of the work carried out so far, the clinical translation has not materialized yet. There are several aspects that have contributed to this absence of clinical translation. 1 These include, amongst others, lack of multicenter standardization in sample preparation, data collection and data analysis, type of substrates used in pathology, and lack of studies including big numbers of patients. Until recently, a major drawback is the type of substrate used in histopathology departments versus the substrates widely used in FT-IR microspectroscopy. Pathologists use glass substrates of around 1 mm nominal thickness for both histopathology and cytology. The problem is that glass absorbs IR radiation thus reducing the amount of spectral information that can be obtained from tissue and cell samples. Previous studies have shown that, using the same glass substrate used by pathologists, information can still be obtained from the lipid region but not from the fingerprint region.2–4 Another issue is tissue samples embedded in paraffin. The latter has strong band absorption in the lipid region masking biochemical information from these samples. This landscape has recently changed with our work showing that, using glass coverslips of 0.12–0.17 mm thickness as substrates, spectral information not only from the lipid region but also from the amide I 4 and, more importantly, from the fingerprint region down to 1350 cm−1 can now be obtained. 5 This opens a whole new area of research for FT-IR microspectroscopy by utilizing substrates that are also used in pathology departments. In fact, by placing samples on coverslips, not only can spectral information be obtained but also, if further histopathological information is needed, these samples on coverslips can then be placed on and glued to standard histopathological glass slides, stained and covered with another coverslip for histopathological analysis.
This advancement in spectral pathology brings FT-IR microspectroscopy closer to a clinical application. In fact, the closer the sample preparation is to a clinical set up, the faster the technique could be applied and used by clinicians. However, diverse cytological preparations (smears, cytospins, cell blocks and liquid-based cytology) fixed with different fixation procedures are used in different histopathology laboratories. 6 The histopathology department at the University Hospitals of North Midlands (UHNM), like in many hospitals worldwide, prepares cell samples using either the cytospin technique or smear. Examples are cytology samples for lung cancer diagnosis (bronchio–alveolar lavage, pleural fluid) which are prepared as cytospins. Fine needle aspirations from thyroid nodules or head and neck lymph nodes are prepared as smears. For the diagnosis of haematological malignancies, bone marrow aspirates and blood samples are prepared as smears. These samples are then fixed with alcohol-based fixatives such as methanol. Furthermore, in some cases, samples are fixed and stained at the same time. Smears can lead to uneven distribution of cells, thick cell clusters, and inadequate cellularity. 7 However, morphological preservation seems better in smears than in cytospins. 8 On the other hand, cytospins provide cellularity even in cases where smears show unsatisfactory cellularity, increasing the diagnostic potential. 8
On this basis, we carried out the present work to identify the best cell sample preparation (cytospin versus smear) using glass coverslips as substrates to study two different types of lung cancer cells using FT-IR microspectroscopy. It is known that alcohols, used as fixatives, alter lipid content during sample fixation affecting the spectra of cells. 9 On the other hand, formalin (4% paraformaldehyde), widely used as fixative in sample preparation for FT-IR microspectroscopy, does not affect lipid content as much as methanol during fixation. Therefore, we tested formalin and methanol as fixatives for this work.
Materials and Methods
Cells
The cells used in this study were CALU-1, an epidermoid lung cancer cell line from the European Collection of Cell Cultures (ECACC) and A549, a lung adenocarcinoma cell line (ECACC). Both cell lines were cultured in Dulbecco's Modified Eagle Medium supplemented with 10% fetal bovine serum, 5% L-glutamine, 5% antibiotic/antimycotic, 5% HEPES (4-(2-hydroxyethyl)-1-piperazineethanesulfonic acid) buffer, 5% non-essential amino acids, and 5% sodium pyruvate (Merck, UK). For both cell lines, media was changed every three to four days. Cells were passaged before reaching confluence by removing culture medium and adding trypsin/EDTA (Merck, UK) and incubating cells for 5 min. After this incubation period, cells were collected and centrifuged at 1200 r/min for 5 min. Supernatant was discarded and the pellet resuspended in fresh medium. Cell viability for both cell lines was determined with the standard trypan blue exclusion method.
Sample Preparation
Two types of sample preparation were carried out, cytospin and smear. For cytospin, cells were collected as described above, transferred into 15 mL tubes and centrifuged at 1200 r/min for 5 min at room temperature. The supernatant was then removed and the pelleted cells were resuspended in 0.9% NaCl. Cell concentration was brought to 106 cells/mL; 20 µL of this cell concentration was placed in a cytospin funnel and cells were then cytospun for 1 min at 900 r/min on GalvOptics microscope coverslips (24 × 50 mm × 0.13–0.17 mm thickness, GalvOptics, UK) made of soda–lime glass.
Smears were set up as follows: 20 µL of a cell concentration of 106 cells/mL in 0.9% NaCl were placed in one of the edges of a GalvOptics microscope coverslip. The edge of a second GalvOptics microscope coverslip was then placed on the liquid sample and the sample spread out over the length of the first coverslip.
Two types of fixation were used, formalin and methanol. For formalin fixation, samples were fixed with 4% buffered paraformaldehyde in 0.9% NaCl for 20 min at room temperature. Excess formalin was removed by washing once with 0.9% NaCl and thrice rinsed with distilled water. Samples were then air dried at room temperature. For methanol fixation, samples were placed in ice cold methanol (VWR International, UK) for 2 min and then allowed to dry. No washings were carried out as methanol is a volatile compound and evaporated from the sample. This method of fixation followed the same protocol used at the pathology department at University Hospitals of North Midlands (UHNM). For each type of sample and fixation, two replicates were prepared and 50 cells from each replicate studied.
FT-IR Microspectroscopy
Mid-infrared (mid-IR) spectra of the samples were obtained using a Nicolet iN10(MX) spectrometer Thermo Fisher Scientific. Spectra were collected at 4 cm−1 resolution, with 256 co-added scans using an aperture size of 15 × 15 µm centered on the cell nucleus based on our previous work. 10 The time to obtain the spectrum of a single cell was less than 2 min. Background measurements were obtained under the same conditions from areas of coverslip without a biological sample. For all samples, spectra of 100 individual cells were obtained. Data preprocessing was carried out as previously described,4,5 i.e., spectra were cropped to the area to be analyzed and normalized using standard normal variate (SNV) which subtracts the mean spectrum and then divides the standard deviation for each spectrum removing the effect of different sample thickness and spectrum baseline offsets. The spectral analysis of cells on coverslips included the areas between 3100 cm−1 and 2700 cm−1 for the lipid region, and between 1800 cm−1 and 1350 cm−1 for the fingerprint region, the latter based on our previous work using GalvOptics microscope coverslips. 5
Data Analysis
Principal component analysis (PCA) was performed using Unscrambler X software (CAMO). A Levene's test was carried out to assess homogeneity of variance. The statistical analysis was applied on the principal components on pair of data; thus, the T-test was carried out for data that were normally distributed. The non-parametric Mann–Whitney test, which is the equivalent non-parametric test of the T-test, was used for data not normally distributed. Statistical analysis was carried out in Excel. The statistical tests were applied with 0.05 level of significance.
Results
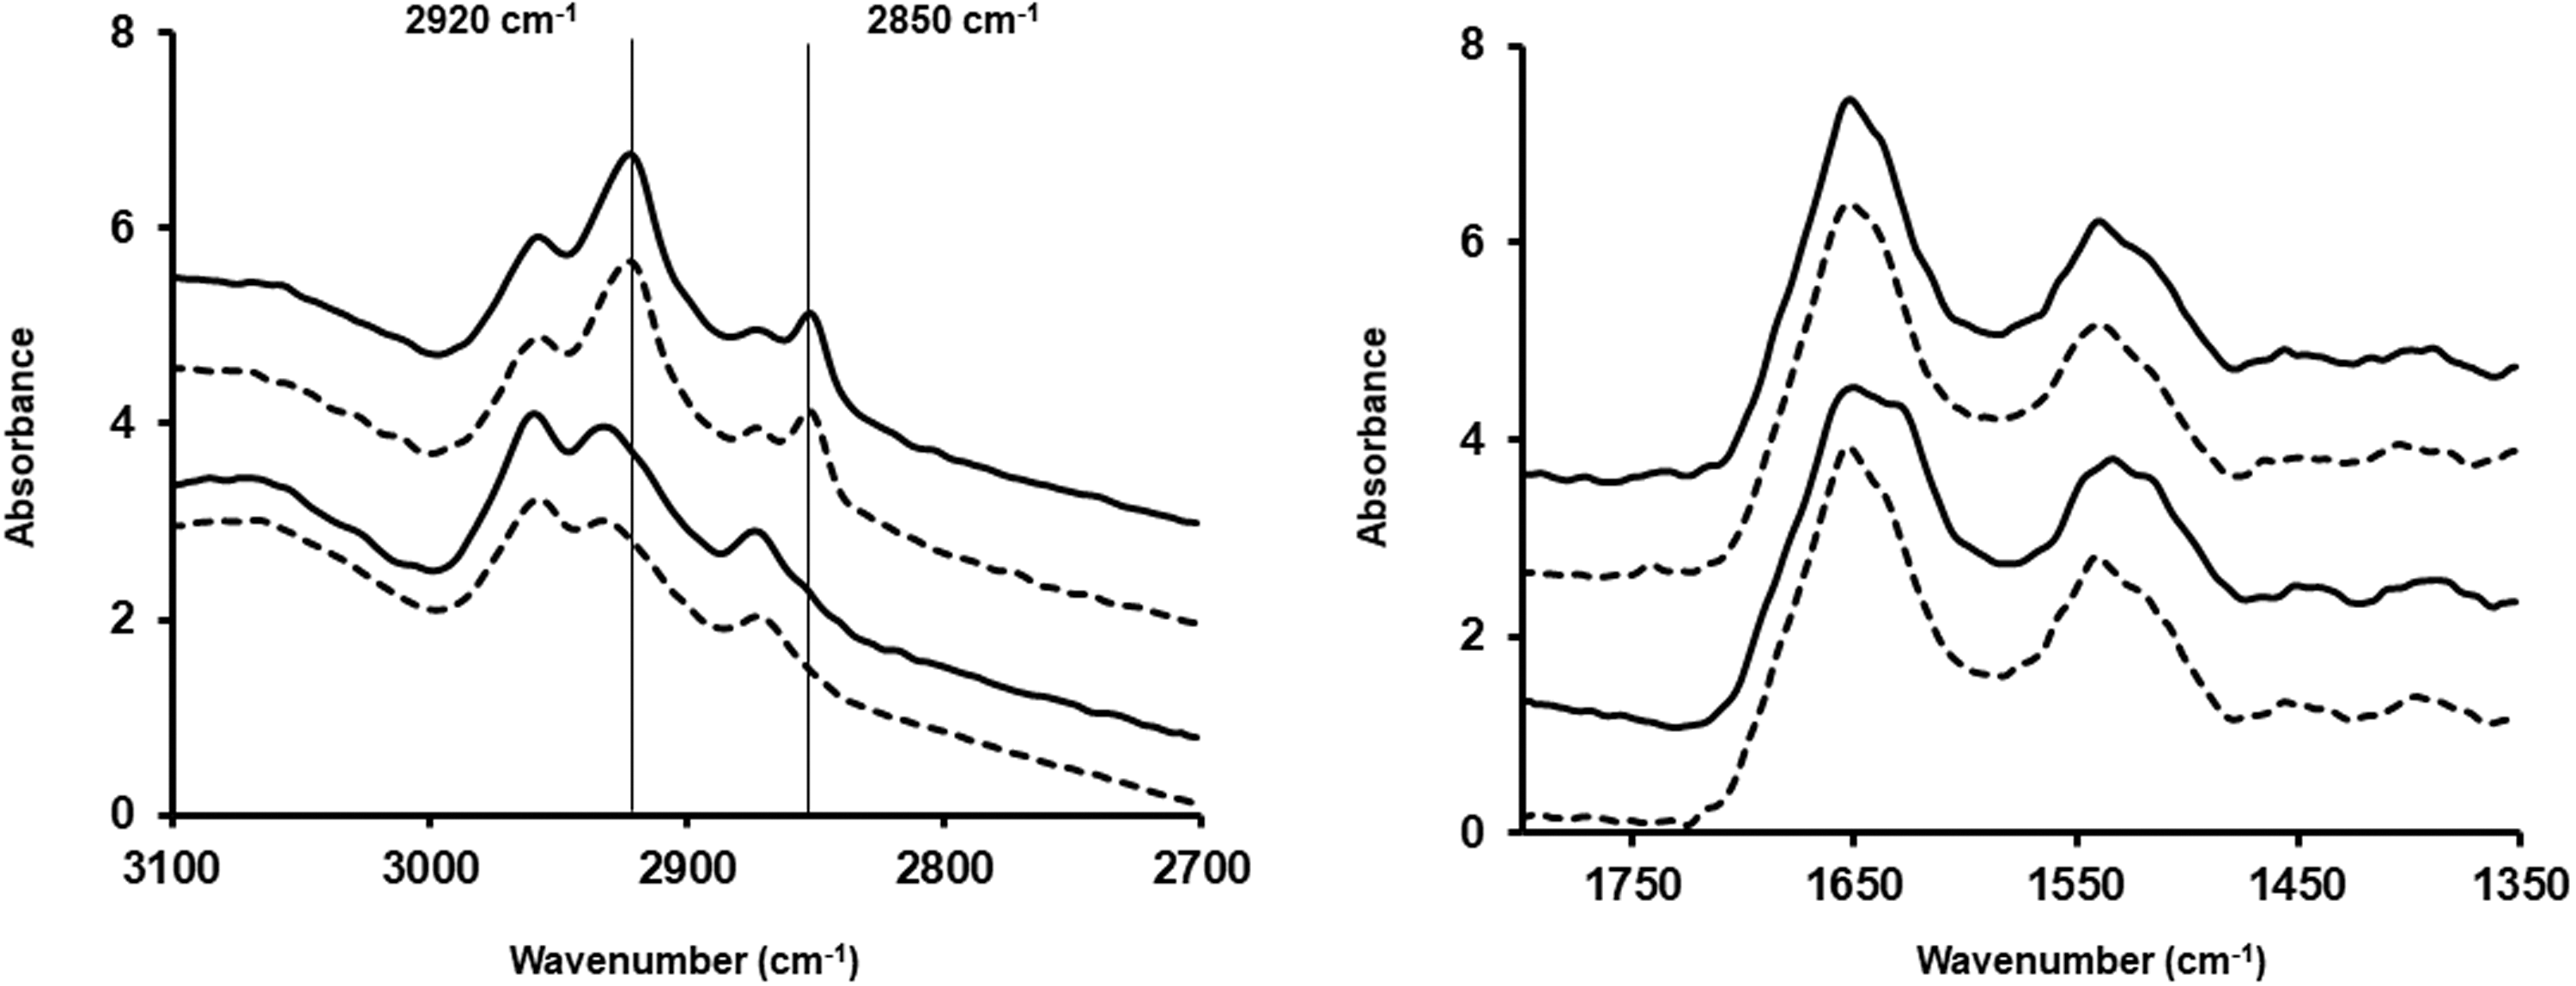
Figures 1 and 2 show the spectra of cells prepared as cytospins or smears, respectively (mean of 100 spectra). They also show the spectra of cells fixed with formalin or methanol. In Fig. 1, the main difference between the two types of fixation methods is the loss of lipids when cells were fixed with methanol and, therefore, a decrease in the 2850 cm−1 and 2920 cm−1 peaks, as well as a shift of the 2920 cm−1 peak towards higher wavenumbers. The same is seen in Fig. 2 where cells were prepared as smears.
Mean spectrum of 100 spectra for A549 (dotted lines) and CALU-1 (solid lines) cells obtained after preparation as cytospin and fixing them with methanol (two bottom spectra) or formalin (two top spectra) for the lipid region and the fingerprint region between 1350 cm−1 and 1800 cm−1. Mean spectrum of 100 spectra for A549 (dotted lines) and CALU-1 (solid lines) cells obtained after preparation as smear and fixing them with methanol (two bottom spectra) or formalin (two top spectra) for the lipid region and the fingerprint region between 1350 cm−1 and 1800 cm−1.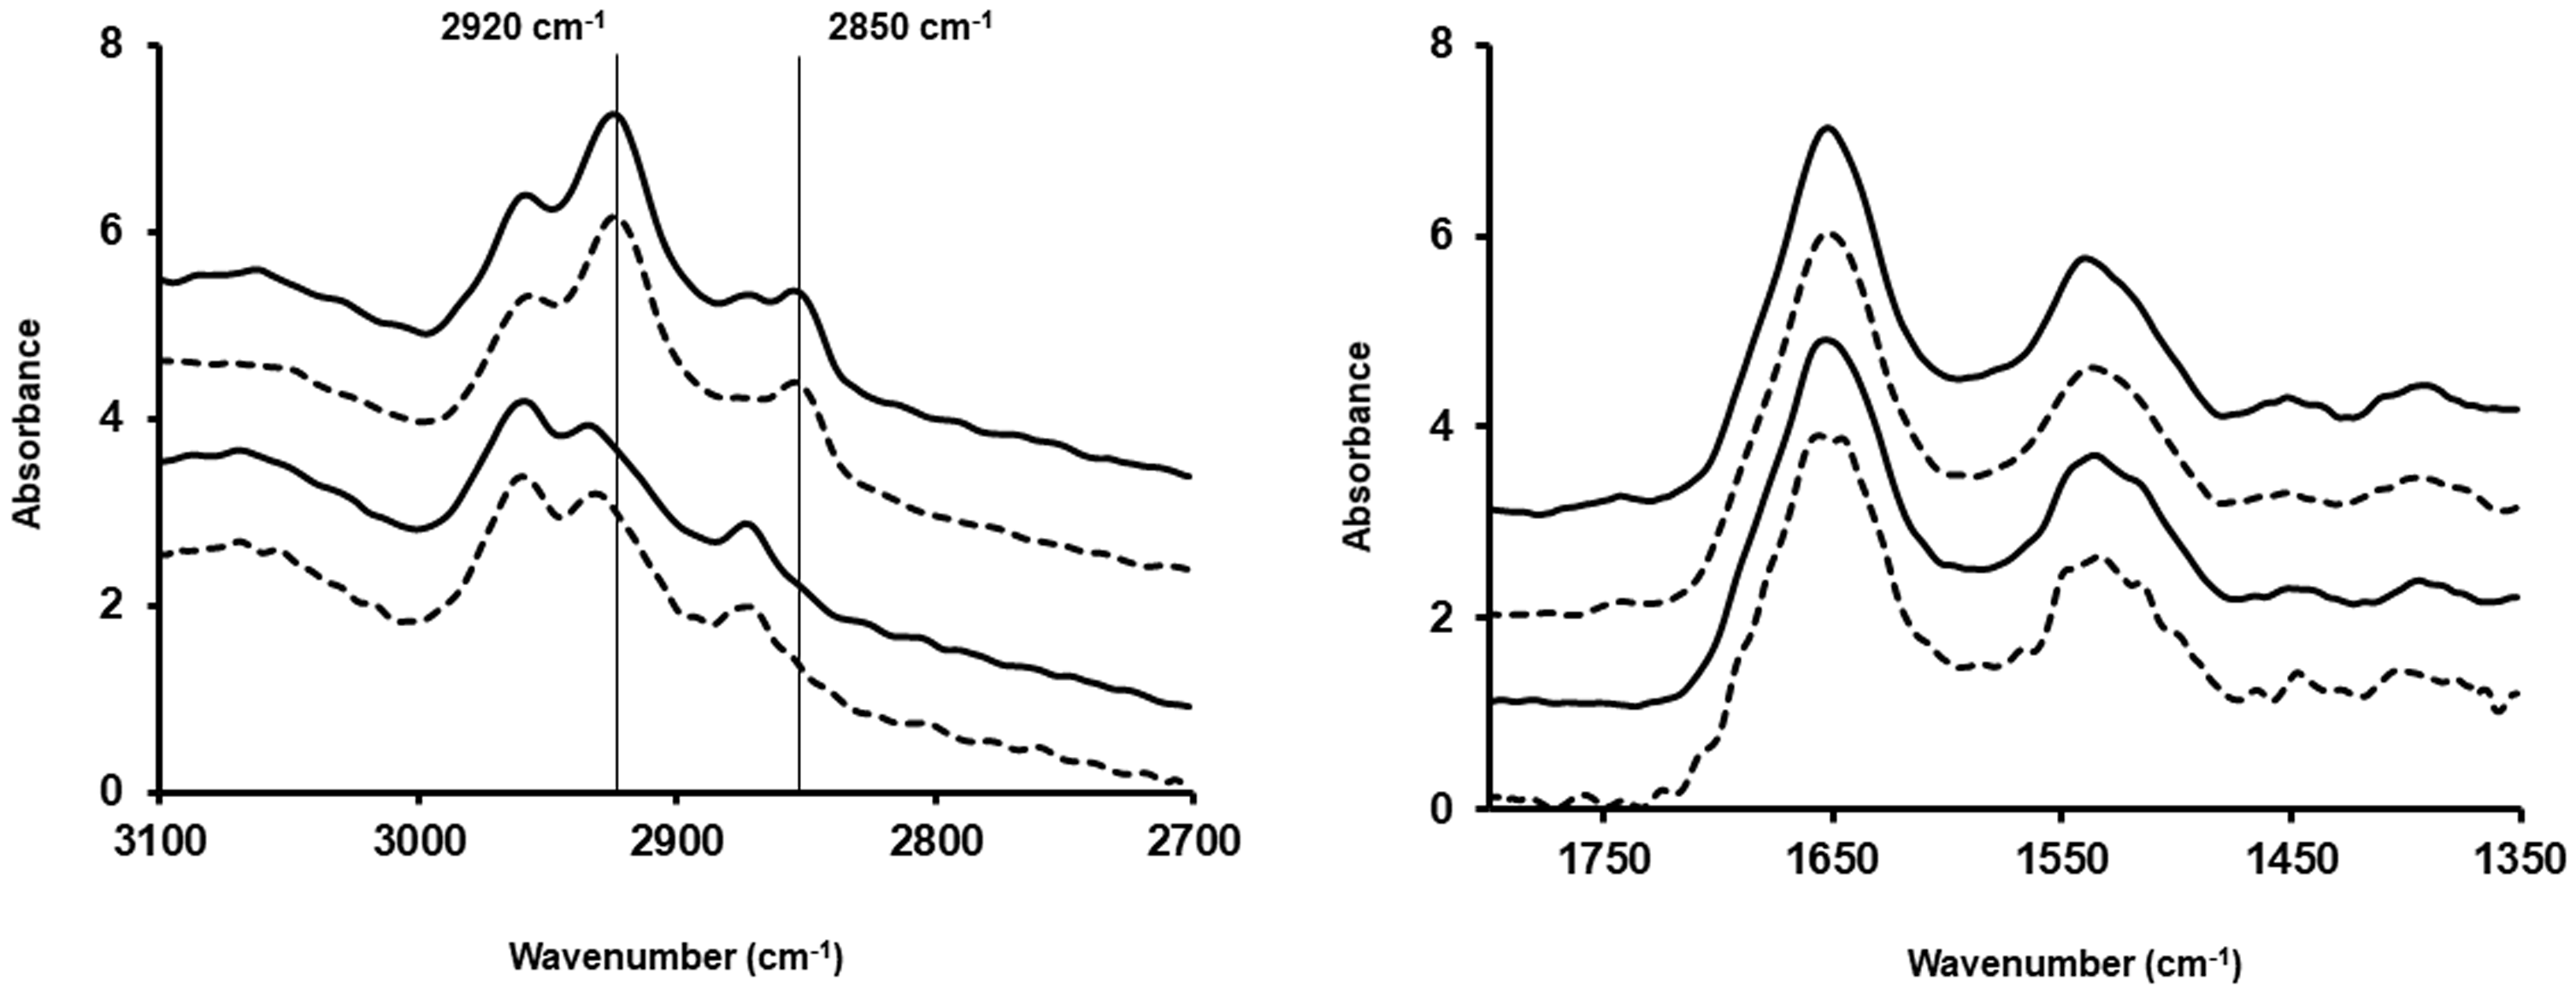
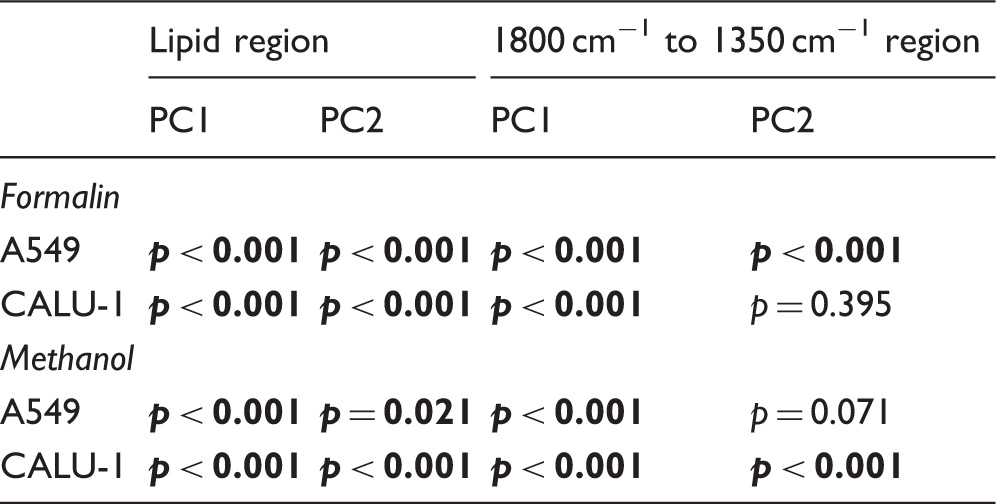
Statistical significance between different types of sample preparation (cytospin versus smear) based on types of fixation (formalin, methanol) and cell type (A549, CALU-1). Statistically significant values in bold.
The next step was to carry out further PCA in order to assess the differences between the spectra of these cells prepared as cytospins or smears, and fixed with formalin or methanol. Figures 3 and 4 show the PCA for the two studied cell lines prepared as cytospins for the lipid region and the fingerprint region between 1800 cm−1 and 1350 cm−1, respectively, and their corresponding loadings. Regarding the fixation method and as expected from the mean cell spectra, there was a clear separation between CALU-1 and A549 cells fixed with formalin or methanol for the lipid region (Fig. 3a). Regarding the studied fingerprint region, there was still a separation between these two cell lines based on how they had been fixed (Fig. 4a).
PCA for A549 (triangles) and CALU-1 (squares) cells obtained after preparation as cytospin and fixing them with methanol (open triangles and open squares) or formalin (filled triangles and filled squares) for the lipid region (a) and the corresponding loadings (b). PCA for A549 (triangles) and CALU-1 (squares) cells obtained after preparation as cytospin and fixing them with methanol (open triangles and open squares) or formalin (filled triangles and filled squares) for the fingerprint region between 1350 cm−1 and 1800 cm−1 (a) and the corresponding loadings (b).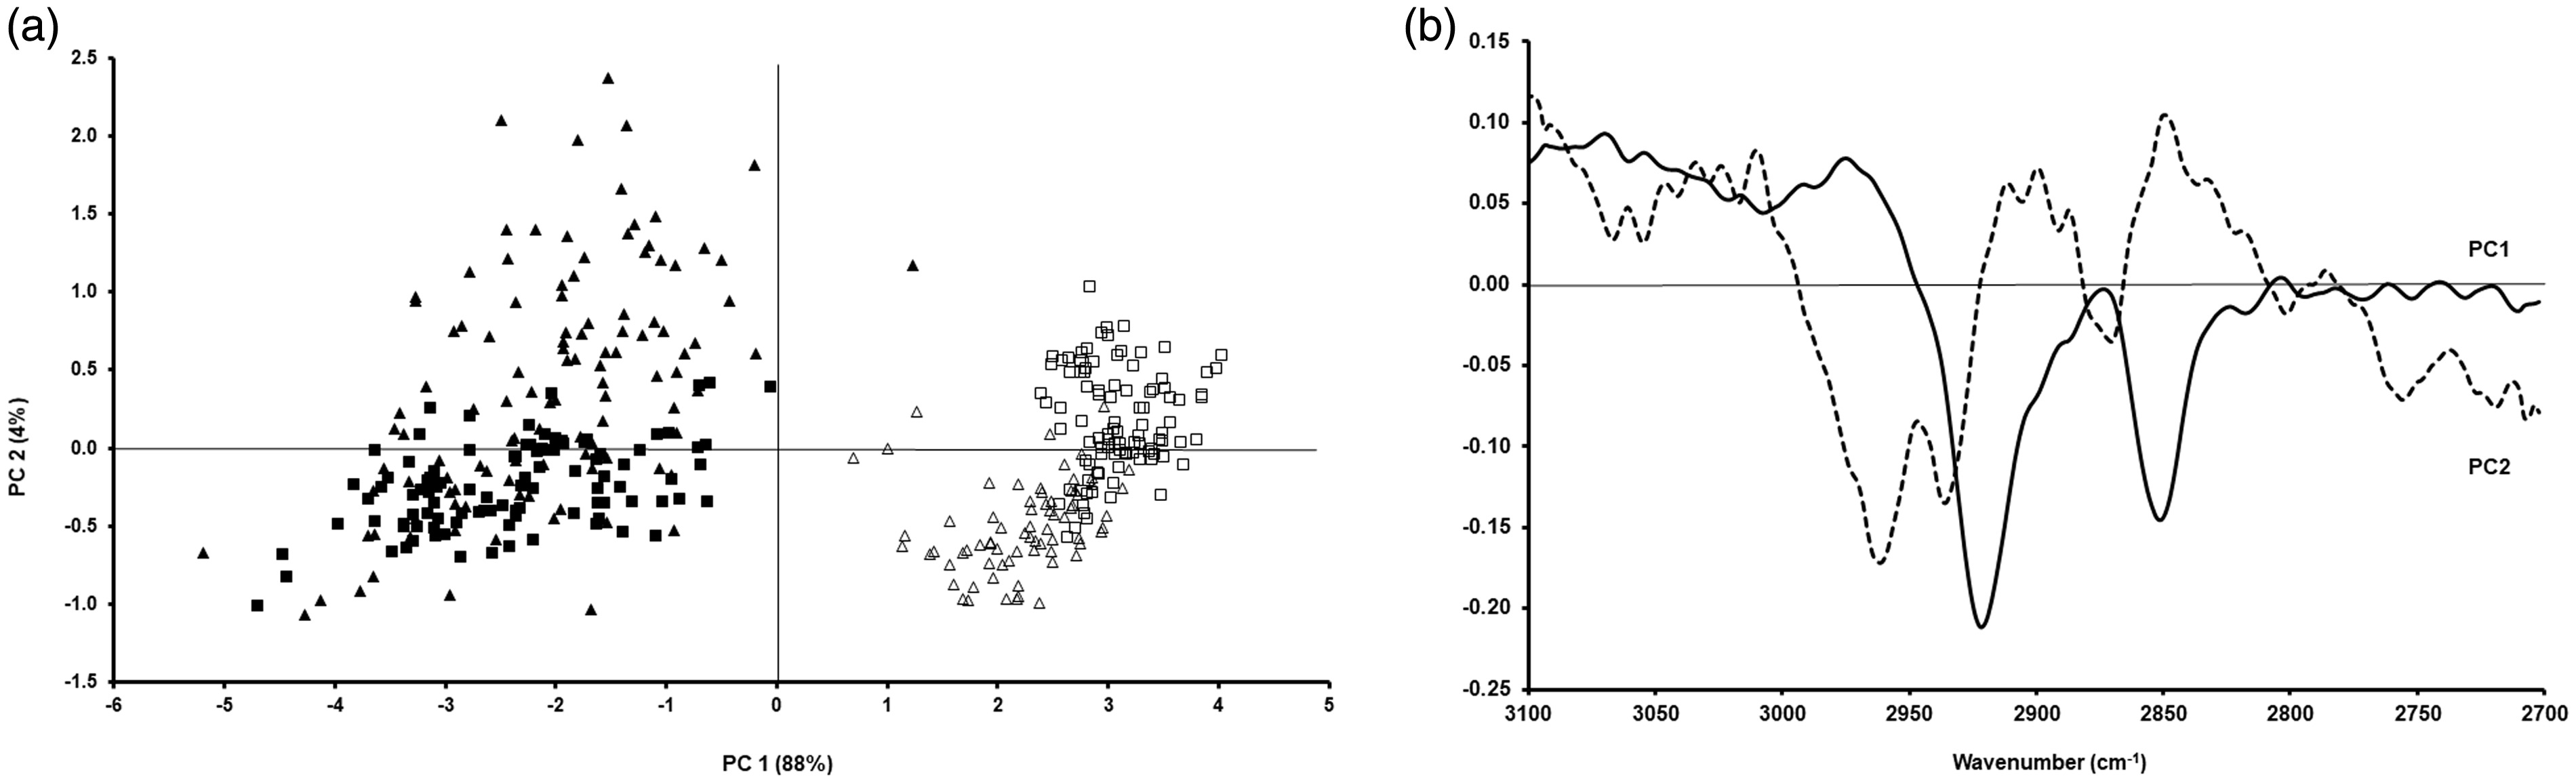
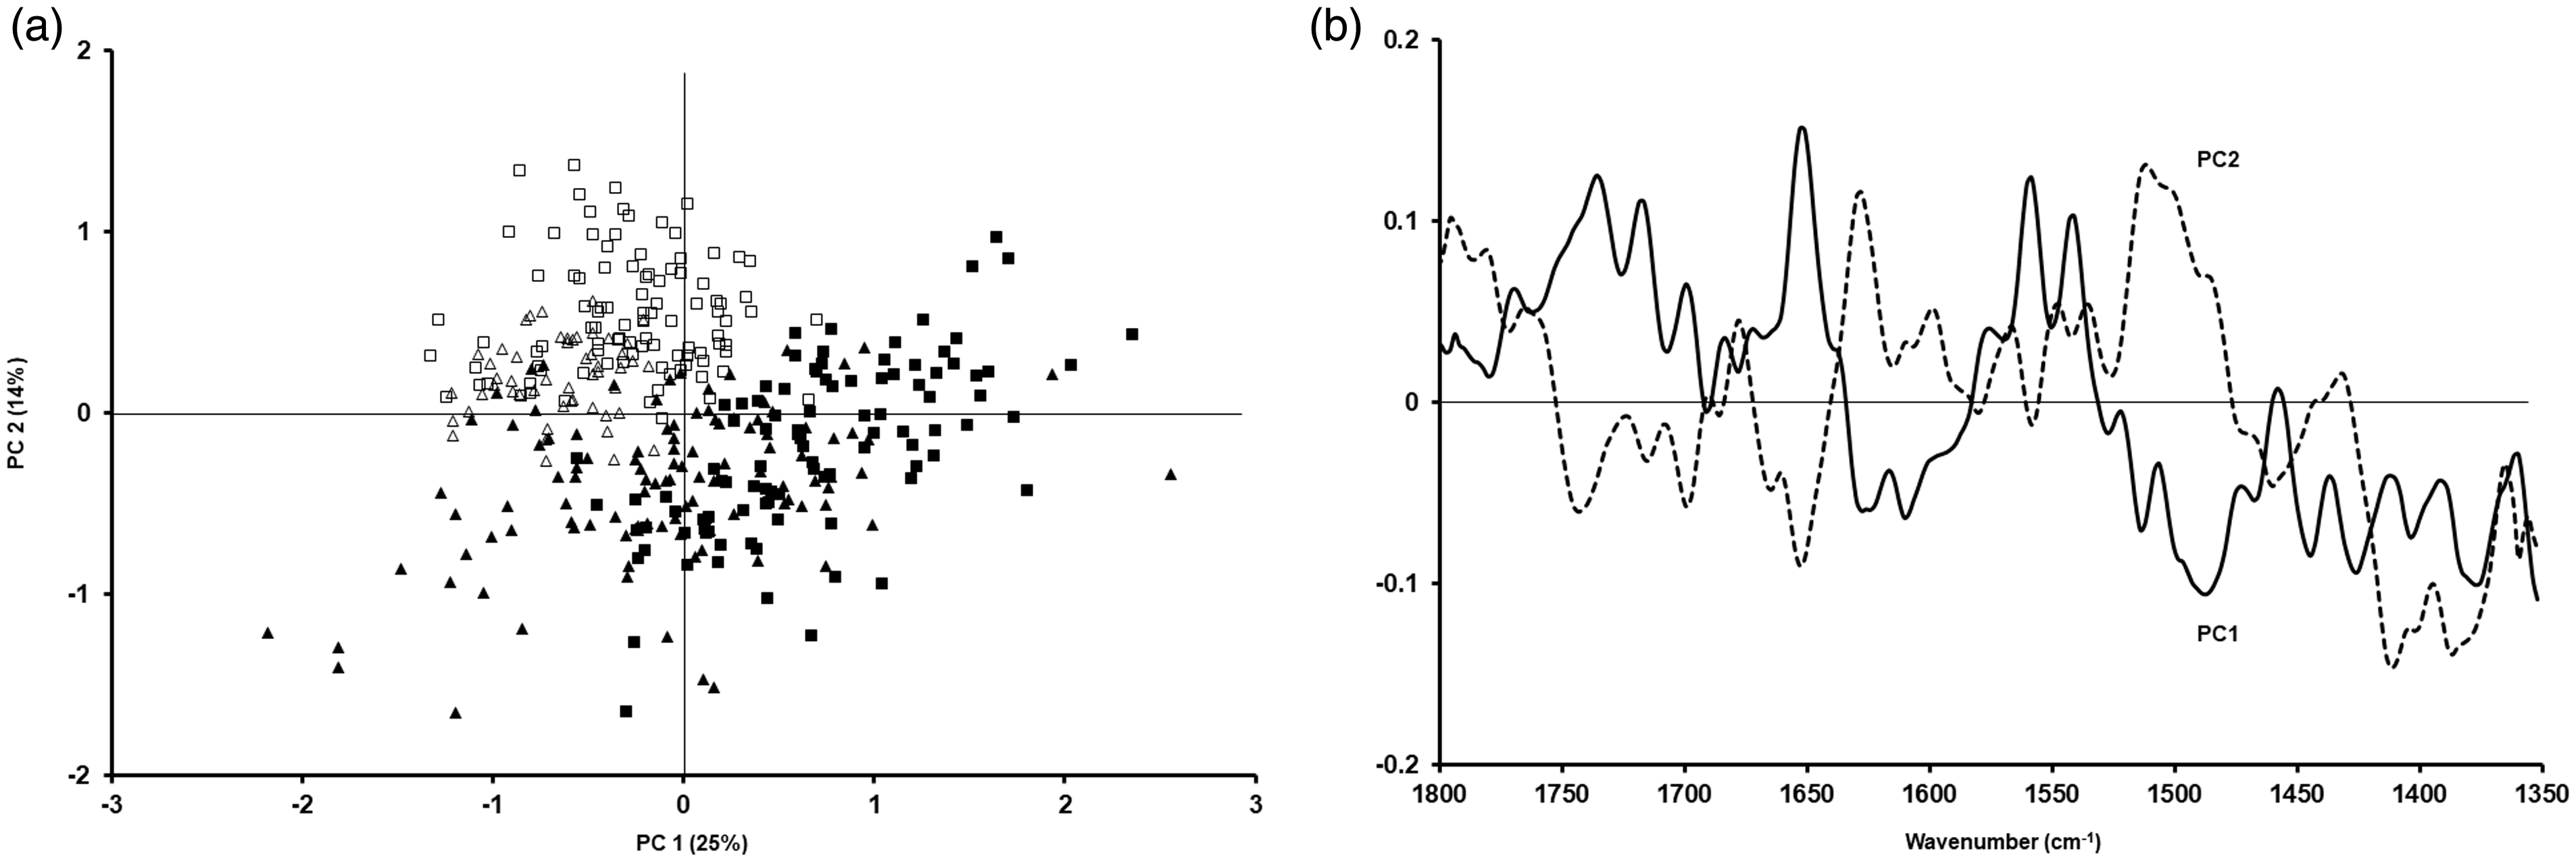
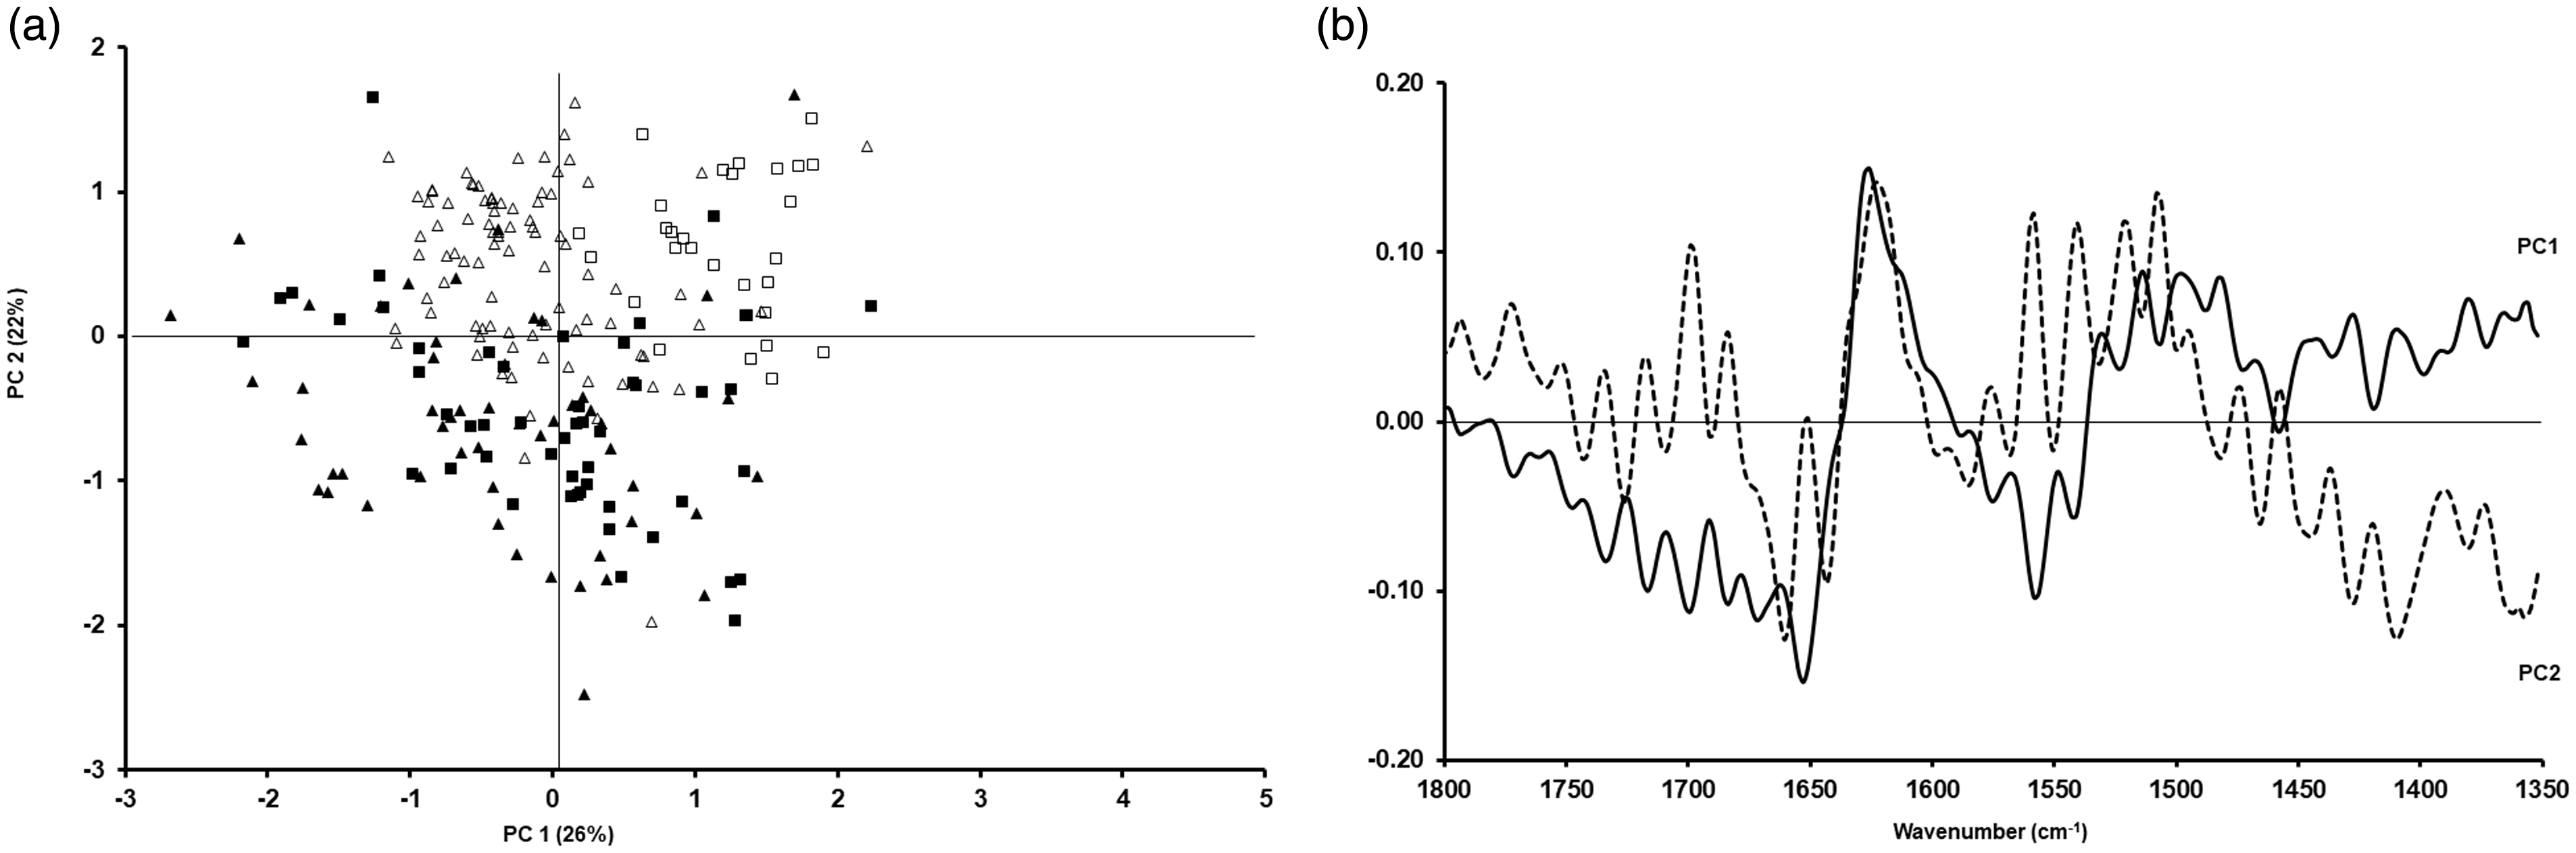
The PCA data for cells prepared as smears are shown in Figs. 5 (lipid region) and 6 (fingerprint region between 1800 cm−1 and 1350 cm−1), as well as their corresponding loadings. For the lipid region, a similar pattern was seen when compared to samples prepared as cytospins, i.e. a clear separation between cells fixed with formalin or methanol was evident (Fig. 5a). Regarding the studied fingerprint region, some differences could still be seen (Fig. 6a). The statistical analysis of the PCAs in Figs. 3 to 6 is shown in Table II. When comparing fixation with formalin or methanol, statistically significant differences can be seen between these two types of fixation regardless of cell line and whether samples have been prepared as cytospins or smears.
PCA for A549 (triangles) and CALU-1 (squares) cells obtained after preparation as smear and fixing them with methanol (open triangles and open squares) or formalin (filled triangles and filled squares) for the lipid region (a) and the corresponding loadings (b). PCA for A549 (triangles) and CALU-1 (squares) cells obtained after preparation as smear and fixing them with methanol (open triangles and open squares) or formalin (filled triangles and filled squares) for the fingerprint region between 1350 cm−1 and 1800 cm−1 (a) and the corresponding loadings (b). Statistical significance between different types of fixation (formalin versus methanol) based on sample preparation (cytospin, smear) and cell type (A549, CALU-1). Statistically significant values in bold.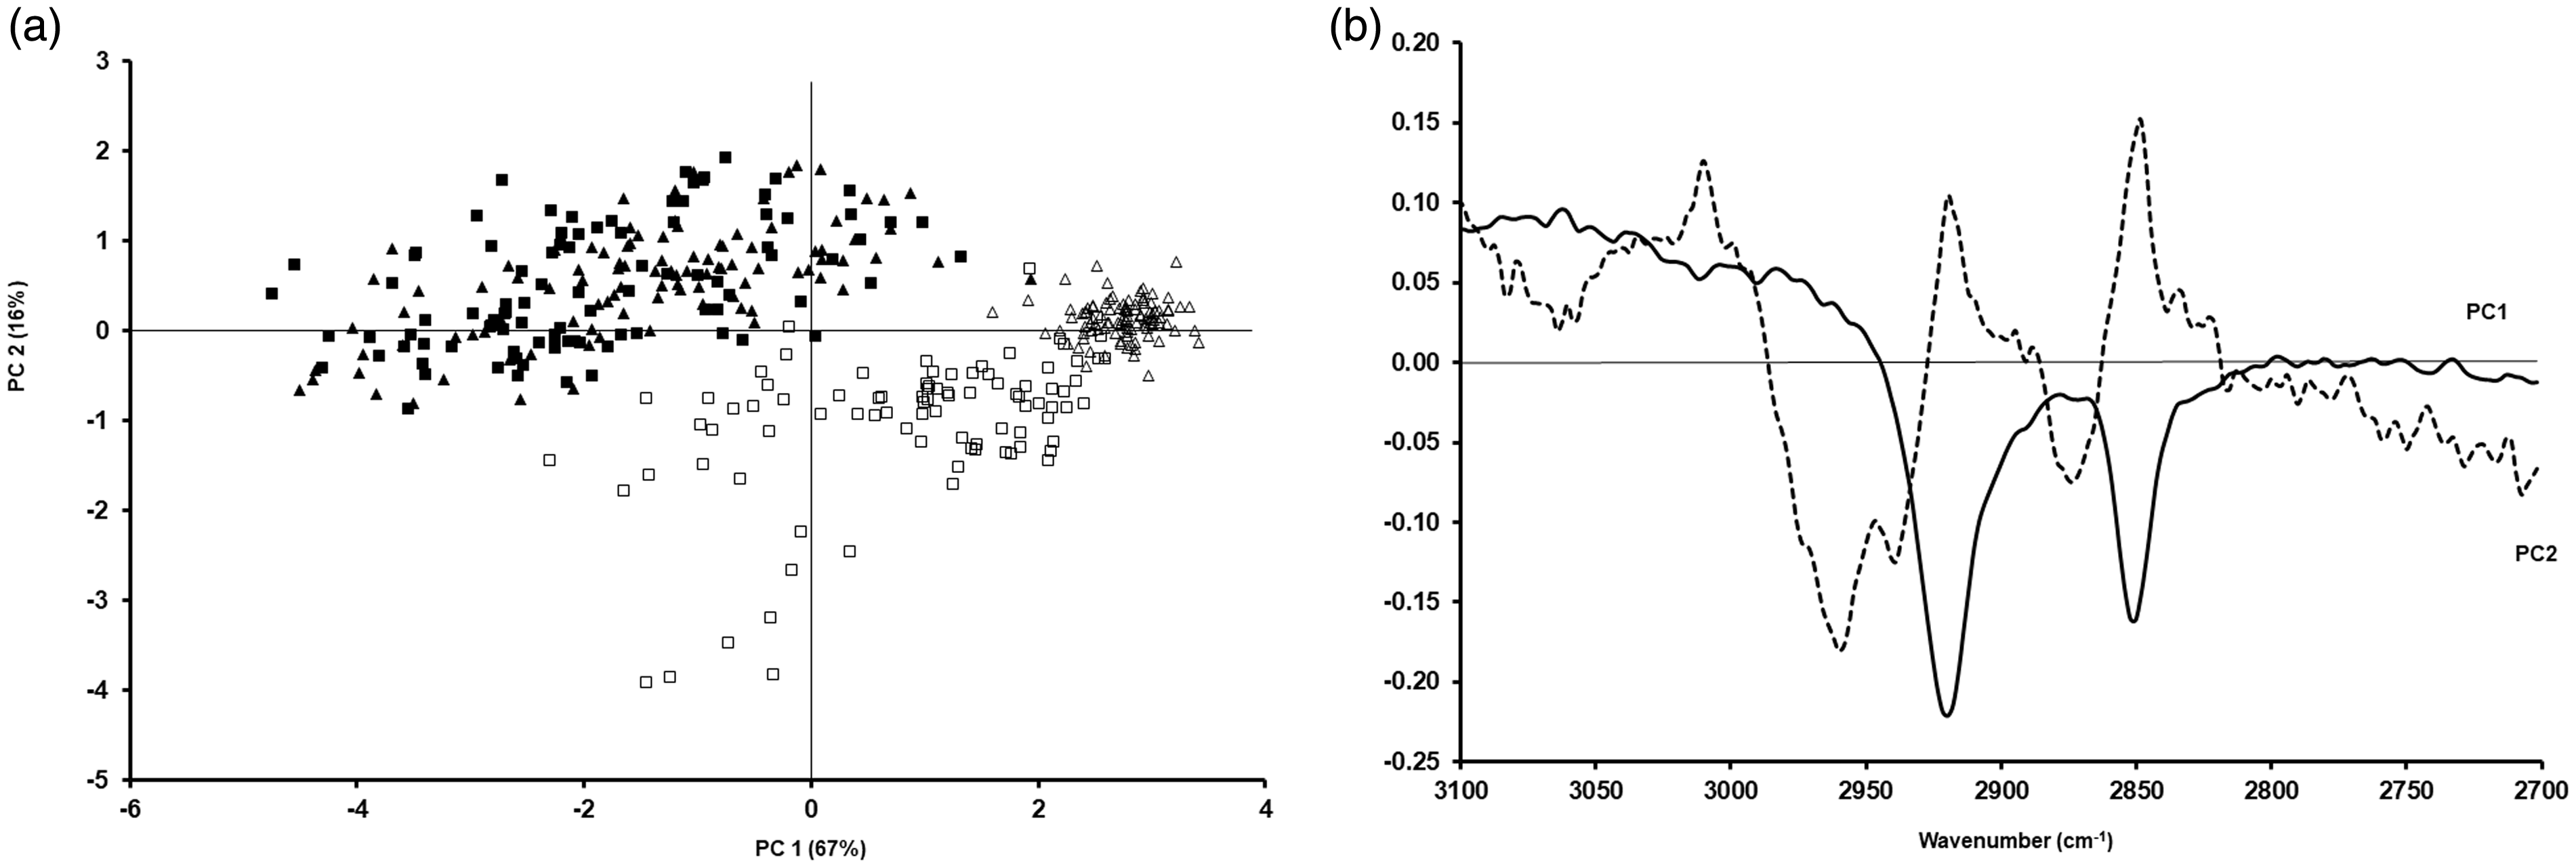
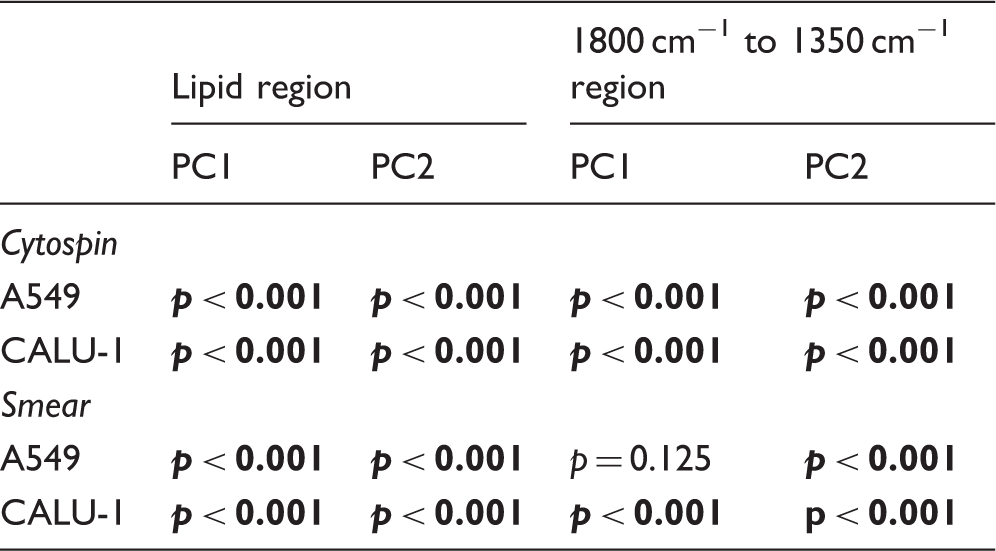
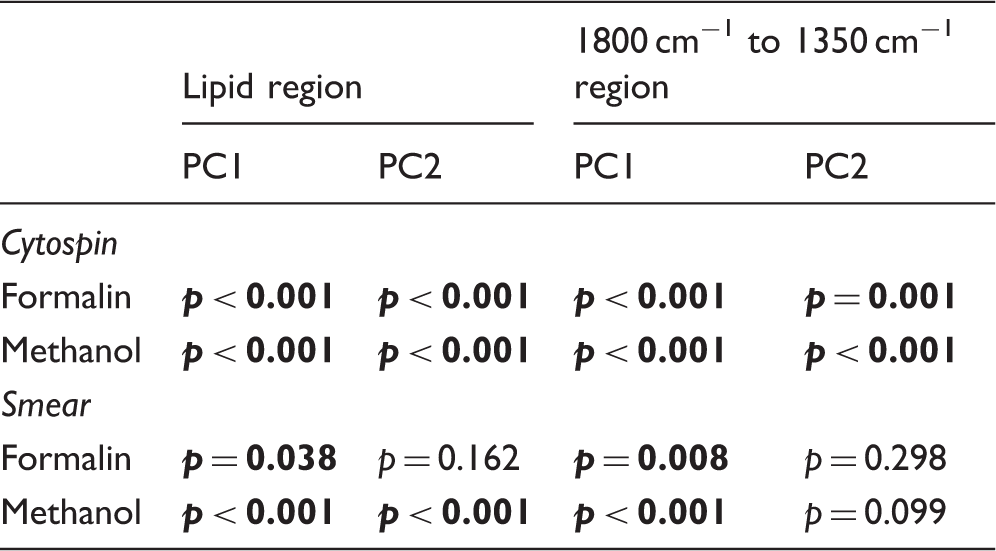
Statistical significance between the different cell types (A549 versus CALU-1) based on sample preparation (cytospin, smear) and fixative (formalin, methanol). Statistically significant values in bold.
Discussion
Several studies have already shown the advantages and difficulties of cell and/or tissue fixation for FT-IR spectroscopy.11–16 However, none of these studies used glass as a substrate on which to hold the sample for analysis. It could be argued that the type of substrate would not make much difference to the final spectral data. However, if this technique is to make it into standard clinical practice, it is important to confirm that fixing cells on glass coverslips with methanol or formalin as examples, still gives robust spectral data which can then be shown to clinicians wishing to apply this technique in pathology departments for disease diagnosis and monitoring.
When a new methodology is being introduced in clinical practice, it is important that there are no major disruptions on the standard procedures used by clinicians. In the case of the introduction of FT-IR microspectroscopy in histopathology, it would be crucial in a first instance that sample preparation is as close as possible to what it is considered standard clinical practice. However, it is also crucial that sample preparation does not modify cells in a way that FT-IR spectra could be greatly affected. Thus, it is not always easy to find the right balance between what FT-IR microspectroscopy can offer and what clinicians might expect from this technique.
Two common sample preparations in pathology are cytospins and smears. The latter is faster and requires less equipment thus reducing costs when compared to cytospin preparation. This is paramount for the already economically stretched health services worldwide. Thus, smear preparation could be the way forward when taking FT-IR microspectroscopy to clinical practice. However, the fact that smear samples need drying before being fixed poses a problem when studying these samples with FT-IR microspectroscopy. It is well known that drying cells could affect their FT-IR spectra 16 mainly in the fingerprint region17,18 as air drying could cause delocalization of biomolecules as a result of large surface tension forces associated with the water–air interface 13 with protein vibration bands undergoing changes in both intensity and line shape upon drying. 18 In fact, we have seen changes in the amide I when fixing cells with methanol probably due to the drying step (Fig. 2). In view of the issues with air drying, preparing samples as cytospin would be in our opinion the way forward. However, it is not clear yet whether the data presented here using cytospin on glass slides together with previous reported data are robust enough to create a change of practice in pathology departments for samples that are presently prepared as smear. Further work might be needed including, amongst other, more cancer types and bigger sample populations.
Regarding cell fixation, several protocols have been described. 19 The way histology samples are fixed in pathology departments is also an important point when bringing FT-IR microspectroscopy to clinical practice. Fixation of cytology slides in methanol is an easy, straightforward and faster procedure when compared to formalin fixation. However, methanol is an alcohol that washes out most of the membrane lipids and thus affecting the spectra of cells. 9 This can be seen in Figs. 1 and 2 where the bands at 2850 cm−1 and 2920 cm−1 corresponding mainly to the CH2 stretching modes of methylene chains in membrane lipids20–22 have a lower intensity in cells fixed with methanol. Furthermore, methanol fixation also causes changes in the position of the 2920 cm−1 band (Figs. 1 and 2). Conversely, formalin causes the crosslinking of the primary and secondary amine groups of proteins preserving also the lipids. 13 This cross-linking locks the secondary structure of proteins 11 although small spectral changes in the fingerprint region following formalin fixation have also been described.12,15,23 However, these changes seem to be smaller than biochemical changes caused by cancer. 14 Nevertheless, we have shown for the first time that placing lung cancer cells on glass coverslips as smear or cytospin, it is possible to differentiate two different types of lung cancer cells using FT-IR microspectroscopy (Table III). Further work is needed to confirm this in other cell lines and diseases.
Conclusion
While some of the data presented here would have been expected based on previous published data, 9 our work using a glass substrate brings forward FT-IR microspectroscopy towards a clinical application in pathology. The methodology we would advocate would be preparing cytology samples as cytospins using glass coverslips as substrates and fixing them with formalin. An automated system would study these samples using FT-IR microspectroscopy identifying, in a first instance, “abnormal” samples and separating them from those samples deemed to be non-pathological. The setting up of these samples on glass coverslips and fixed with formalin would then allow the pathologists to further study them using staining and/or immunochemistry techniques as examples. However, if formalin fixation causes problems with immunohistochemistry, 24 then, further cytology samples could be prepared from the original patient's sample. Nevertheless, to have an automated screening tool to identify "abnormal" samples would reduce working hours in pathology departments as pathologists would need to concentrate only on those samples considered abnormal. In summary, the data presented here together with our previous FT-IR data obtained using glass coverslips could be used by spectroscopists to start or further the interest of pathologists in the application of FT-IR microspectroscopy in cancer diagnosis.
Footnotes
Declaration of Conflicting Interests
The author(s) declared no potential conflicts of interest with respect to the research, authorship, and/or publication of this article.
Funding
The author(s) disclosed receipt of the following financial support for the research, authorship, and/or publication of this article: The support from the Cancer Centre and University Hospitals of North Midlands charities is greatly acknowledged. LMD is partially supported by Alba Synchrotron Light Source.
ORCID iDs
Ibraheem Yousef https://orcid.org/0000-0001-7818-8611 Deborah Latham https://orcid.org/0000-0001-6286-2691 Josep Sulé-Suso ![]()