
Abstract
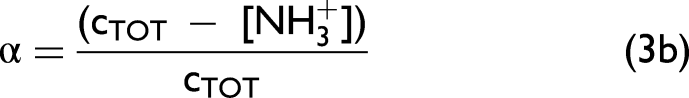
The pKa values of propanolamine hydrochloride (PAMH) and poly(allylamine hydrochloride) (PAAMH) in concentrated solutions were determined by both Fourier transform infrared spectroscopy (FT-IR) titration and classical potentiometric (POT) titration and compared. Starting with the respective fully protonated forms PAMH and PAAMH and increasing the pH value by sodium hydroxide addition in situ attenuated total reflection FT-IR (ATR FT-IR) spectra on PAMH and PAAMH solutions show the variation of diagnostic infrared (IR) bands. From the decrease of the most intense δ(NH3+) band the dissociation process of the NH3+ groups could be followed. Thereby, from the respective normalized band area A the dissociation degree αIR of the ammonium groups could be determined. Plotting pH versus αIR and fitting this curve by a modified Henderson–Hasselbalch function pH = pKa + B log (αIR/1 – αIR) the parameters pKa and cooperativity factor B were obtained. pKa values from FT-IR titration were qualitatively in line with respective pKa values from POT titration. Quantitative systematic pKa deviations between polyelectrolyte (PEL) and respective monoelectrolyte and the tentative effects of PEL molecular weight, ambient ionic strength, and titration concept (FT-IR and POT) are discussed based on classical models of weak PEL.
This is a visual representation of the abstract.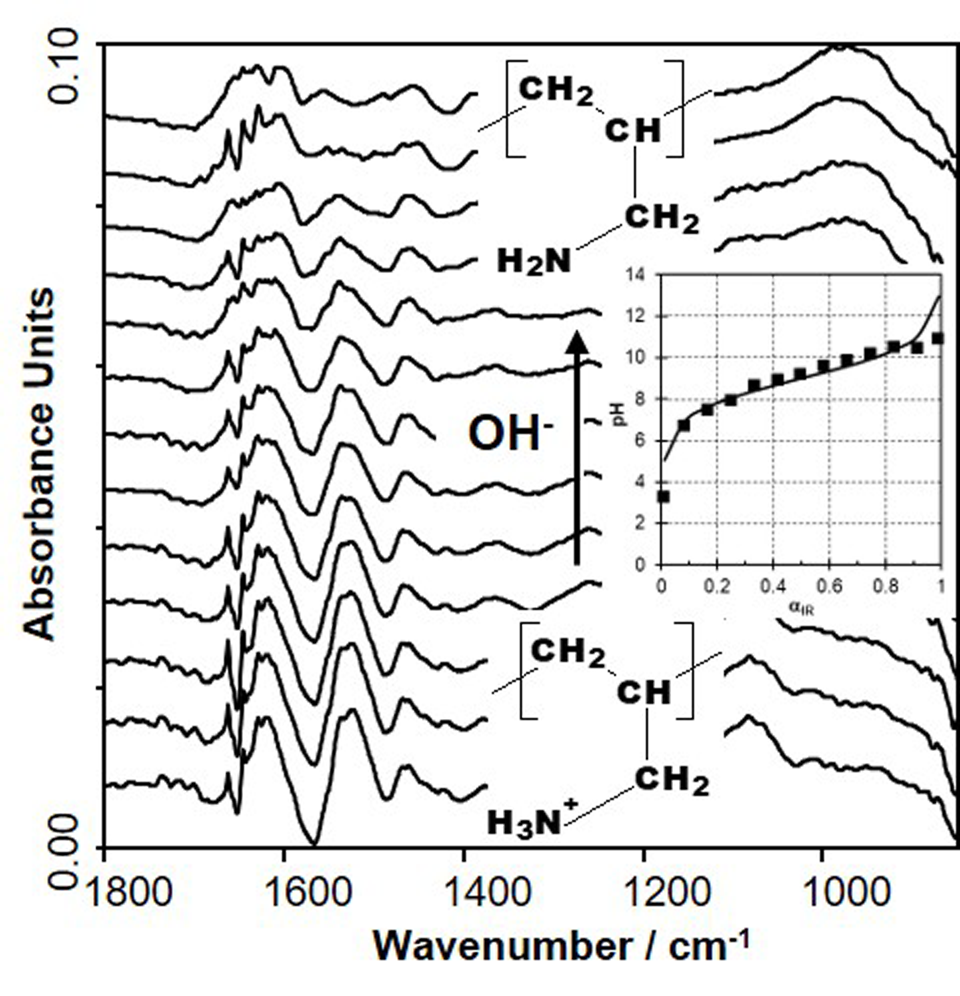
Keywords
Introduction
Knowledge of the protonation and dissociation behavior of weak polyelectrolytes (PELs) and biopolymers such as polysaccharides and proteins in solution and at interfaces is highly relevant for the characterization of their interdependent structural parameters such as pKa, net charge sign and amount, charge density, and conformation.
Recently, we reported a Fourier transform infrared spectroscopy (FT-IR)-based quantitative concept to determine the pKa value of weak mono and polyacids. In situ attenuated total reflection (ATR) FT-IR was applied at concentrated propanoic acid (PA) and poly(acrylic acid) (PAA) solutions, which is based on the variation of infrared (IR) bands assigned to the carboxyl (COOH) and carboxylate (COO–) groups as a function of pH.
1
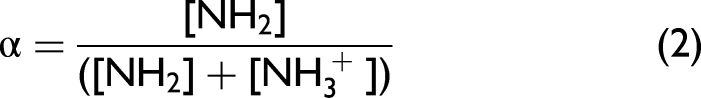
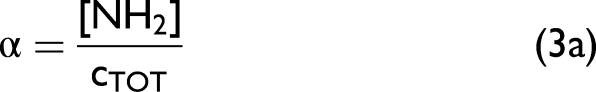
Their band areas ACOOH and ACOO– are directly related to their concentrations [COOH] and [COO–] and thus the dissociation degree
Herein, the FT-IR titration concept introduced for weak monoacid and polyacid solutions is extended to protonated weak monobase and polybase solutions, respectively. Propanolamine hydrochloride (PAMH) and poly(allylamine hydrochloride) (PAAMH) were selected, the protonation state of amino groups was determined in dependence of pH via a diagnostic IR band, and pKa values were calculated. Finally, trends and discrepancies of the pKa values in dependence of molecular weight and ionic strength are discussed based on a simple PEL model, the Ising model adapted to charging of weak PEL, 5 and the GDT model defining a dense PEL phase within a solvent (SOL) phase. This study is intended to determine and interpret pKa values of weak PEL and polyampholyte systems in solution as well as at interfaces in the framework of dynamic and stimulable pH-responsive materials. Herein, concentrated (protonated) monoamine and polyamine solutions shall be studied explicitly in the volume phase by in situ ATR FT-IR, which has been more favorably applied by us at coatings composed of PEL, bioinspired, and protein systems.6–8
Experimental
Chemicals
Poly(allylamine hydrochloride) (PAAMH, MW = 15.000, 50.000, and 150.000 g/mol, denoted as PAAMH-15K, PAAMH-50K, and PAAMH-150K) and 3-aminopropanol (propanolamine, PAM) was obtained from Sigma-Aldrich (Merck KGaA). Samples of PAAMH and PAM were available as powder and liquid, respectively, and were diluted in pure Millipore water to 0.2 M stock solutions (related to amine/ammonium groups). Further pH adjustment is described in the “Fourier Transform Infrared Spectroscopy (FT-IR) Titration” and “Potentiometric (POT) Titration” sections. In Figure 1, the chemical structures of protonated PAAM (PAAMH) and protonated PAM (PAMH) (Sigma Aldrich) are given.
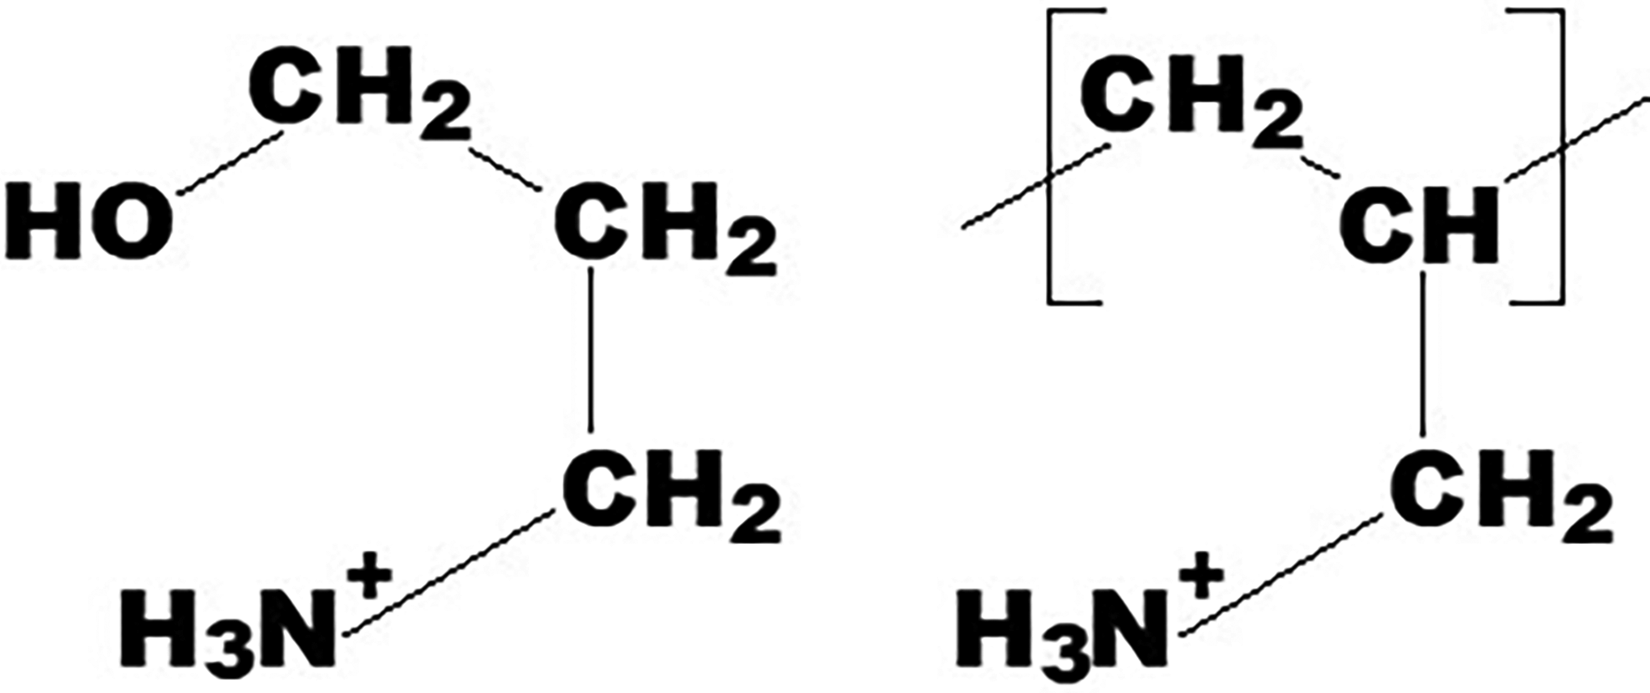
Chemical formulae of PAMH and PAAMH.
Overlap Concentration
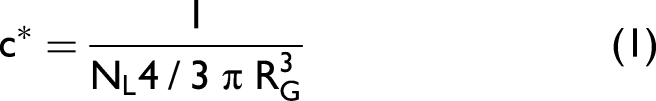
Knowledge or estimation of the overlap concentration c* is important in the context of the applicability of models describing polymer solutions, since PEL properties critically differ between semi-dilute and overlap regimes. Principally, c* is related to the radius of gyration RG by the following simplified Eq. 1, which can be found in more complex forms in textbooks, e.g., Elias.
9
Fourier Transform Infrared Spectroscopy (FT-IR)
The FT-IR measurements were performed using the FT-IR spectrometer Tensor II (Bruker-Optics GmbH) equipped with a globar source and mercury–cadmium–telluride detector recording FT-IR spectra with a spectral resolution of 2 cm–1. Purging nitrogen gas was used to remove water vapor and carbon dioxide in the sample compartment of the FT-IR spectrometer. FT-IR spectra were recorded in ATR mode, which was used with an in situ ATR FT-IR attachment (Optispec) operating by the single-beam sample reference (SBSR) concept developed by Fringeli. 11 In situ cells (in-house construction: MM and IPF machine shop) with four liquid compartments (respective upper and lower ones on the front and back side) housing trapezoidal zinc selenide (ZnSe) internal reflection elements (IRE) with dimensions 50 × 20 × 2 mm3 and 45° incident and leaving angles were used. According to the SBSR concept, sample intensity spectra (IS) of sample solutions in contact with the IRE were measured on the front side and upper half, while reference intensity spectra (IR) were measured on the front side and lower half (IR). Sample and reference intensity spectra were based on 11 active reflections (i.e., penetrating into the adjacent liquid medium), respectively, at the front side due to the evanescent IR field. From single channel intensity spectra of the mono or polyamine solutions (IS) at the given pH value in contact with ZnSe IRE and of single channel intensity spectra of Millipore water adjusted to the respective pH value (IR) absorbance spectra (A) were computed according to A = –log(IS/IR). Atmospheric water vapor absorptions in the absorbance spectra were eliminated by arbitrarily scaled subtraction of a water vapor absorbance spectrum, which can be obtained from the difference between two spectra recorded at different purging times in the sample compartment of the FT-IR spectrometer.
Fourier Transform Infrared Spectroscopy (FT-IR) Titration
Prepared were 2 mL of 0.2 M PAM or 0.2 M PAAMH solutions in pure Millipore water optionally in the absence or presence of 1 M NaCl. Typically, the freshly prepared 0.2 M PAAMH solution resulted in an initial value of pH ≈ 3.0 and was not adjusted further due to a stoichiometric hydrochloride amount (according to the supplier information). Whereas the freshly prepared PAM solution showed an initial value of pH ≈ 12. Hence a stoichiometric amount of 40 μL of 10 M HCl was added to the 2 mL of PAM solution, which resulted in a value of pH ≈ 2.0 (PAMH). Into each solution (PAAMH: 2.00 mL, PAMH: 2.04 mL) portions of 10–40 μL of 1 M sodium hydroxide (NaOH) solutions were subsequently added, with 400 μL (8–20 portions) as the maximum total addition. For the initial and every following sample after the addition of the respective 1 M NaOH portion, the pH was measured (Metrohm) after 5 min. Thereafter the actual solution sample was filled in the sample compartment (see above) by syringe and the FT-IR spectrum was measured after another 5 min. Afterward, the solution sample was withdrawn, another 1 M NaOH portion was added and again injected into the sample compartment and measured. The final concentrations in the sample volume after a complete FT-IR titration run was c ≈ 0.16 M for PAAMH and c ≈ 2.00/2.04 × 0.16 M and that of salt (NaCl) was cS ≈ 0.16 M for both the original salt-free PAMH and PAAMH solution and cS ≈ 1.16 M for both the original salt containing PAMH and PAAMH solutions.
It is well known that concentrated polycation solutions interact with atmospheric carbon dioxide and may form carbamate species. 12 This might influence pH value and thus dissociation degree and cause IR bands in the diagnostic region between 1800 and 1300 cm–1 analytically used in this report. This was critically addressed in this work by sealing all vessels and containers during storing, transfer to devices, and pH measurements using Parafilm. No CO2 interaction with the polycation solution was expected for the in situ ATR FT-IR measurements, which were conducted under the elimination of CO2 in the closed in situ cell. Nevertheless, we addressed this issue and compared in Figure S1 (Supplemental Material) ATR FT-IR spectra on PAAMH solutions at pH = 2.6 and pH = 12.5 (PAAM), which were stored either sealed (“sealed”) or unsealed in the laboratory atmosphere (“air,” 1 h) or which were continuously aerated (“aerated”; >60 bubbles per minute through 200 μL syringe tip, 1 h), respectively. For pH = 2.6, no spectroscopically visible effect of storing PAAMH solution unsealed in the air (1 h) or upon aeration (1 h) in comparison to storing in a sealed state could be obtained. Hence, no significant effect of atmospheric contamination was expected for low pH values. For pH = 12.5 also no significant spectroscopic effect upon storing PAAM solution unsealed in the air if compared to storing in a sealed state was observed, while upon respective aeration (1 h) additional peaks in the region 1800–1300 cm–1 showed up. Especially the new peaks at 1560 and 1490 cm–1 could be assigned to carbamate species, which was reported. 12 Since only for pH = 12.5 and for the extreme case of aeration spectroscopic significant changes were observed, we conclude no significant influence of CO2 on both FT-IR and POT titration experiments.
Determination of Dissociation Degree and pKa Using FT-IR Titration
Integrated areas of the δ(NH3+) (ANH3+, ≈1525 cm–1) and δ(NH2) band (ANH2, 1600–1630 cm–1) from ATR FT-IR spectra of protonated monoamine (PAMH) and polyamine (PAAMH) solutions are linearly related to molar concentrations of ammonium


Potentiometric Titration
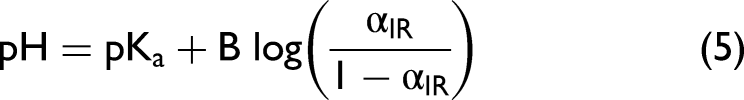
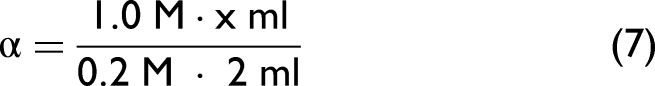
Potentiometric (POT) titration was applied parallelly to the FT-IR titration experiments at the identical PAMH or PAAMH solutions. A 0.2 M PAMH solution (starting pH ≈ 2) or PAAMH solution (starting pH ≈ 3) was titrated by 1 M NaOH. For every titration step, i.e. the addition of 10–40 μL of 1 M NaOH to the presented 0.2 M PAMH or PAAMH solution, the pH was measured. A total dosed volume of 400 μL was applied, which corresponds to an ideal neutralization degree of αN = 1. Typical POT titration data are given in Figures S3a and S3b (Supplemental Material) for PAMH and PAAMH, respectively. The final concentrations c and salt concentrations cS obtained after each titration run were c = 0.16 M for PAAMH and c = 2.00/2.04 × 0.16 M for PAMH and cS = 0.16 M for the initial salt-free solutions. The final salt concentration for the PAMH and PAAMH solutions for the initial presence of salt was cS ≈ 1.16 M. For POT titration data, the degree of neutralization αN (denoted herein as dissociation degree α) was plotted versus the pH value. In principle, α was calculated by rationing the actual NaOH concentrations cNaOH and the actual PAMH or PAAMH concentrations c according to
Results
In this section, both FT-IR and POT titration data on 0.2 M solutions of the protonated forms of the low molecular base PAM (PAMH) and of the high molecular polybase PAAM (PAAMH) are presented and compared. PAM was selected since its constitutional chemical structure (HO–CH2–CH2–CH2–NH2) is related to that of the repeating units of PAAM (–CH2–CH2–CH(NH2)–) (Figure 1). PAAMH samples with three different molecular weights MW = 15.000, 50.000, and 150.000 g/mol (PAAMH-15K, PAAMH-50K, and PAAMH-150K) were utilized. From FT-IR spectroscopic data on concentrated PAMH and PAAMH solutions as a function of pH, the pKa values of ammonium/amine systems can be determined via the HHE
Propanolamine hydrochloride (PAMH)
Figure 2a shows ATR FT-IR spectra of 0.2 M PAMH solutions (2 mL) titrated subsequently by 1 M NaOH. Additionally, the resulting pH values for the actual titrated volume of 1 M NaOH are given in the range from pH ≈ 2 to pH ≈ 12. Starting with the original PAMH solution at pH = 1.62, subsequently, 10 μL and up to 400 μL were subsequently added. While the δ(OH) band at around 1640 cm–1 due to the spectral decompensation of bulk water of the reference (pure water) and of the sample solution is dominating, generally low intensities of further IR bands were observed. Nevertheless, an IR band at around 1525 cm–1 could be observed in the initial spectrum of PAMH solution at pH = 1.62, which can be assigned to the δ(NH3+) band of the ammonium group. Significantly, the integrals of the δ(NH3+) band are decreasing with increasing pH value, while no other bands show such decreases or increases due to their weak spectral intensities. From the respective integrals of the δ(NH3+) band
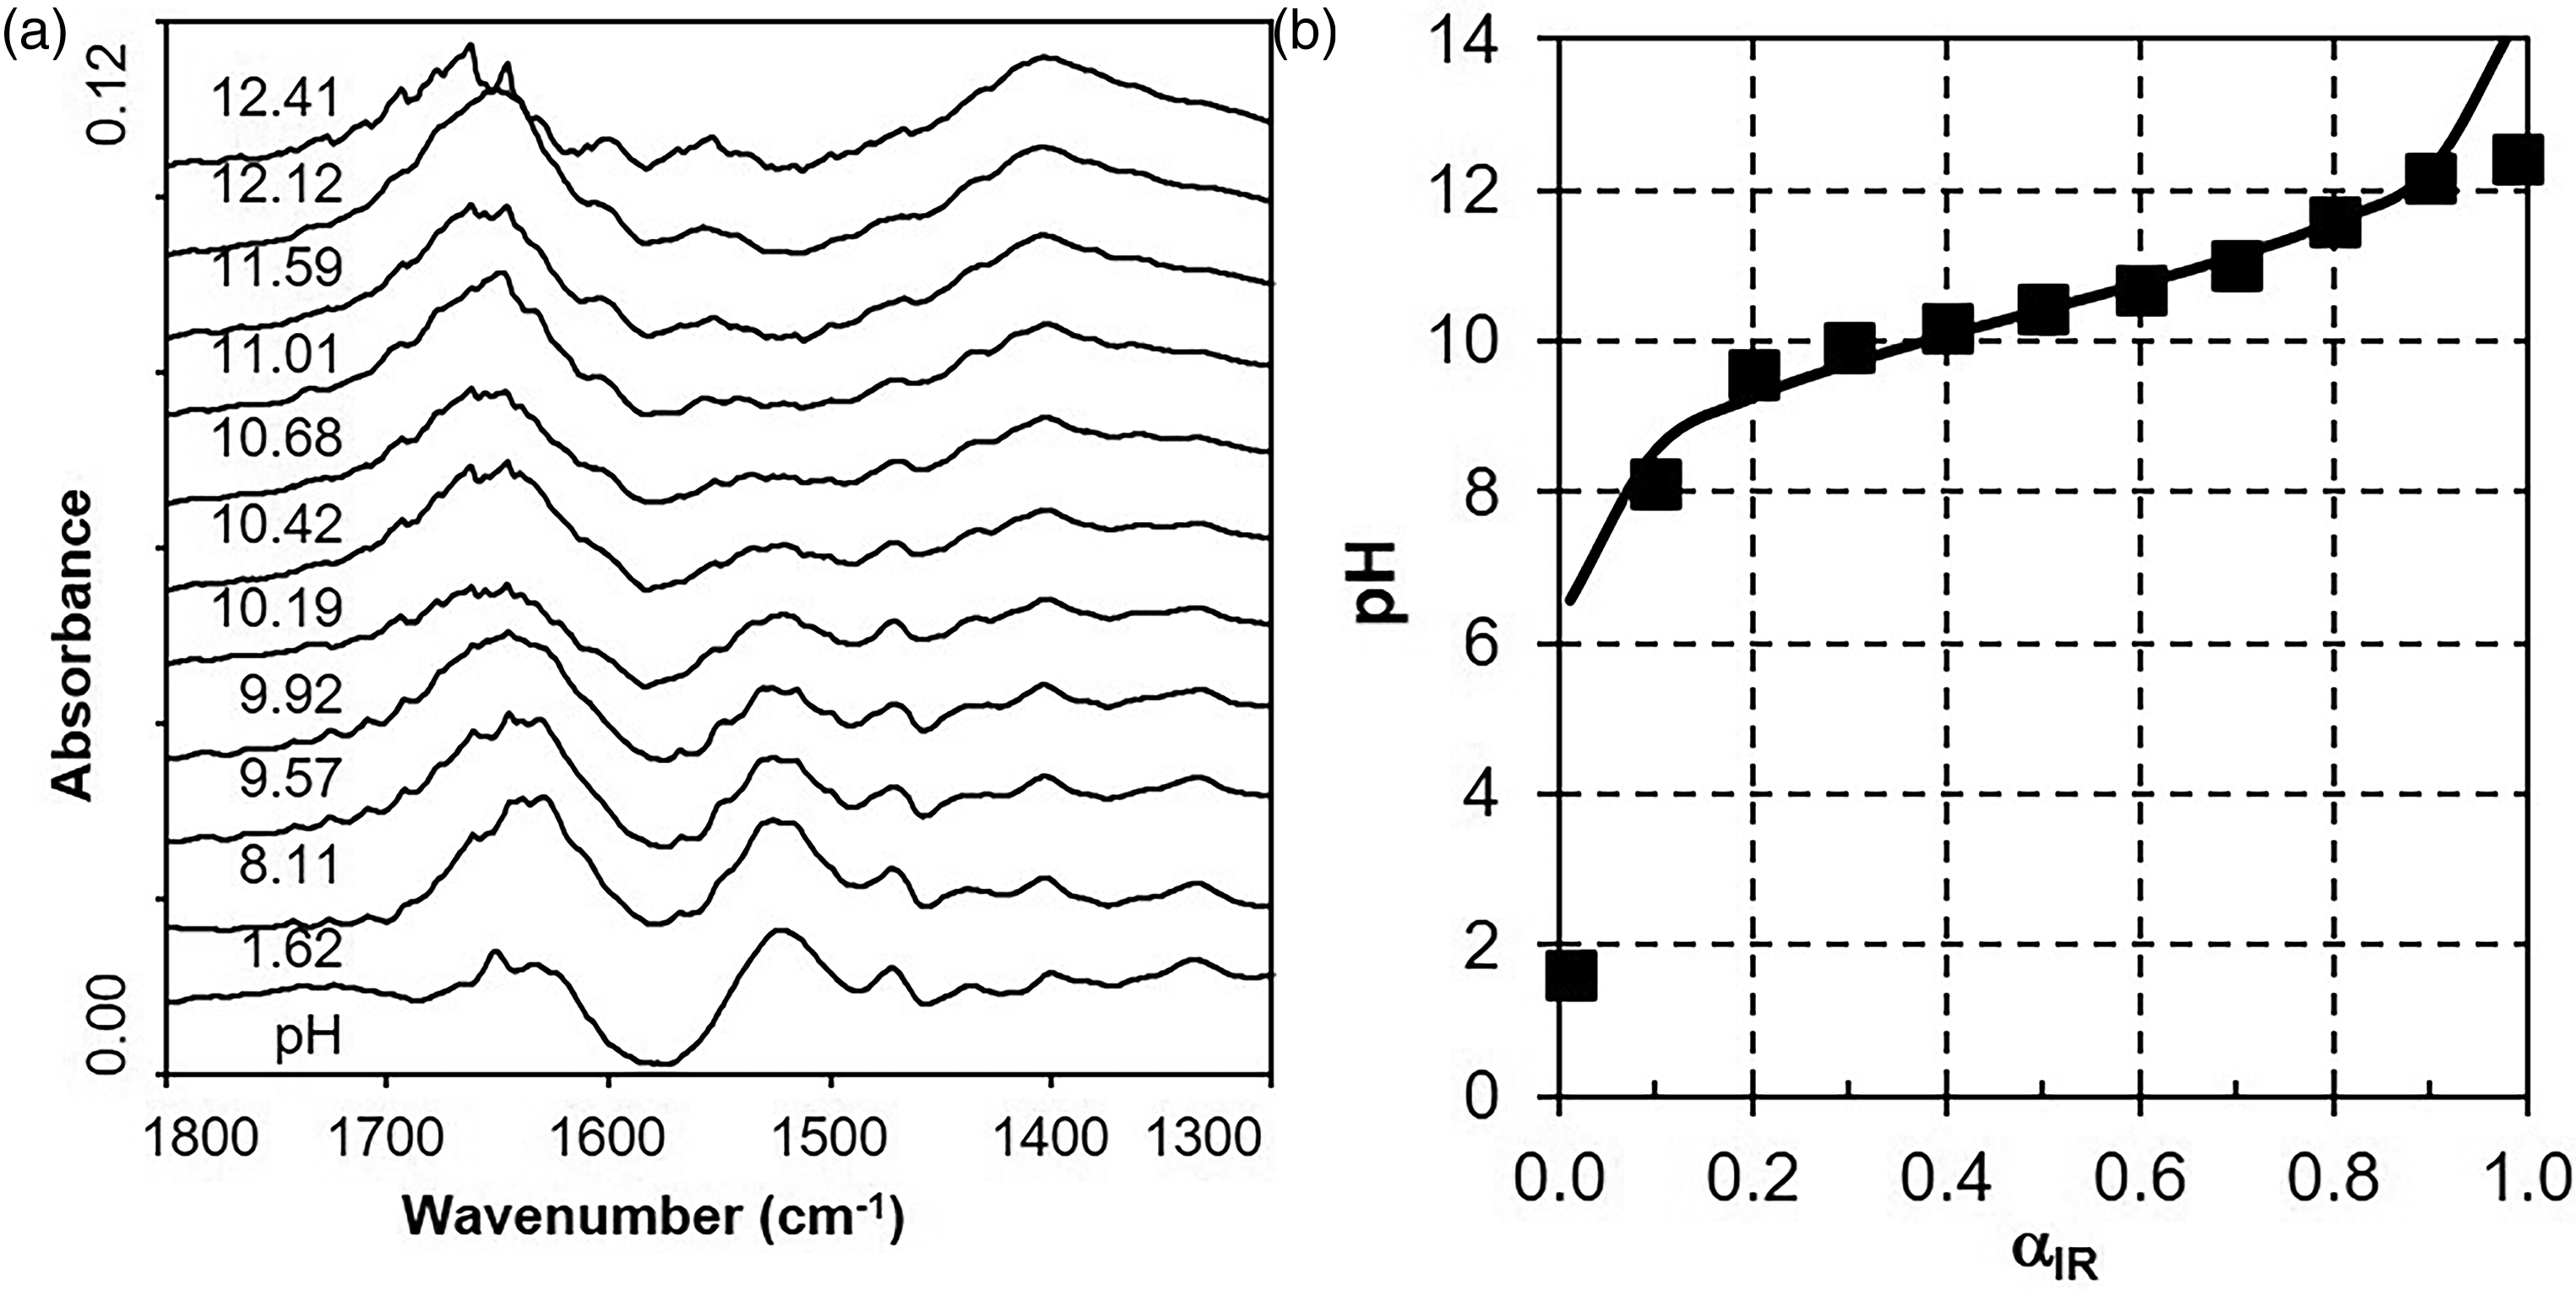
(a) Attenuated total reflection Fourier transform infrared spectroscopy (ATR FT-IR) spectra of 0.2 M PAMH solutions at different pH values starting at pH = 1.62 (bottom) and adjusted by adding increasing volumes (to top) of 1 M NaOH. (b) Plot of pH versus FT-IR based dissociation degree αIR from ATR FT-IR spectra given in Figure 2a for 0.2 M PAMH solution (black squares) and fitted curve according to Eq. 5 (full line).
Values of pKa = 10.11 and B = 1.25 were determined as it is summarized together with respective error values in the following Table I.
Parametric empirical prefactor B and pKa obtained from fitting experimental FT-IR titration and POT titration data for 0.2 M PAMH and 0.2 M PAAMH solutions at cNaCl = 0 M and cNaCl = 1 M by a modified HHE according to Eq. 5 in comparison to reference data on pKa values.
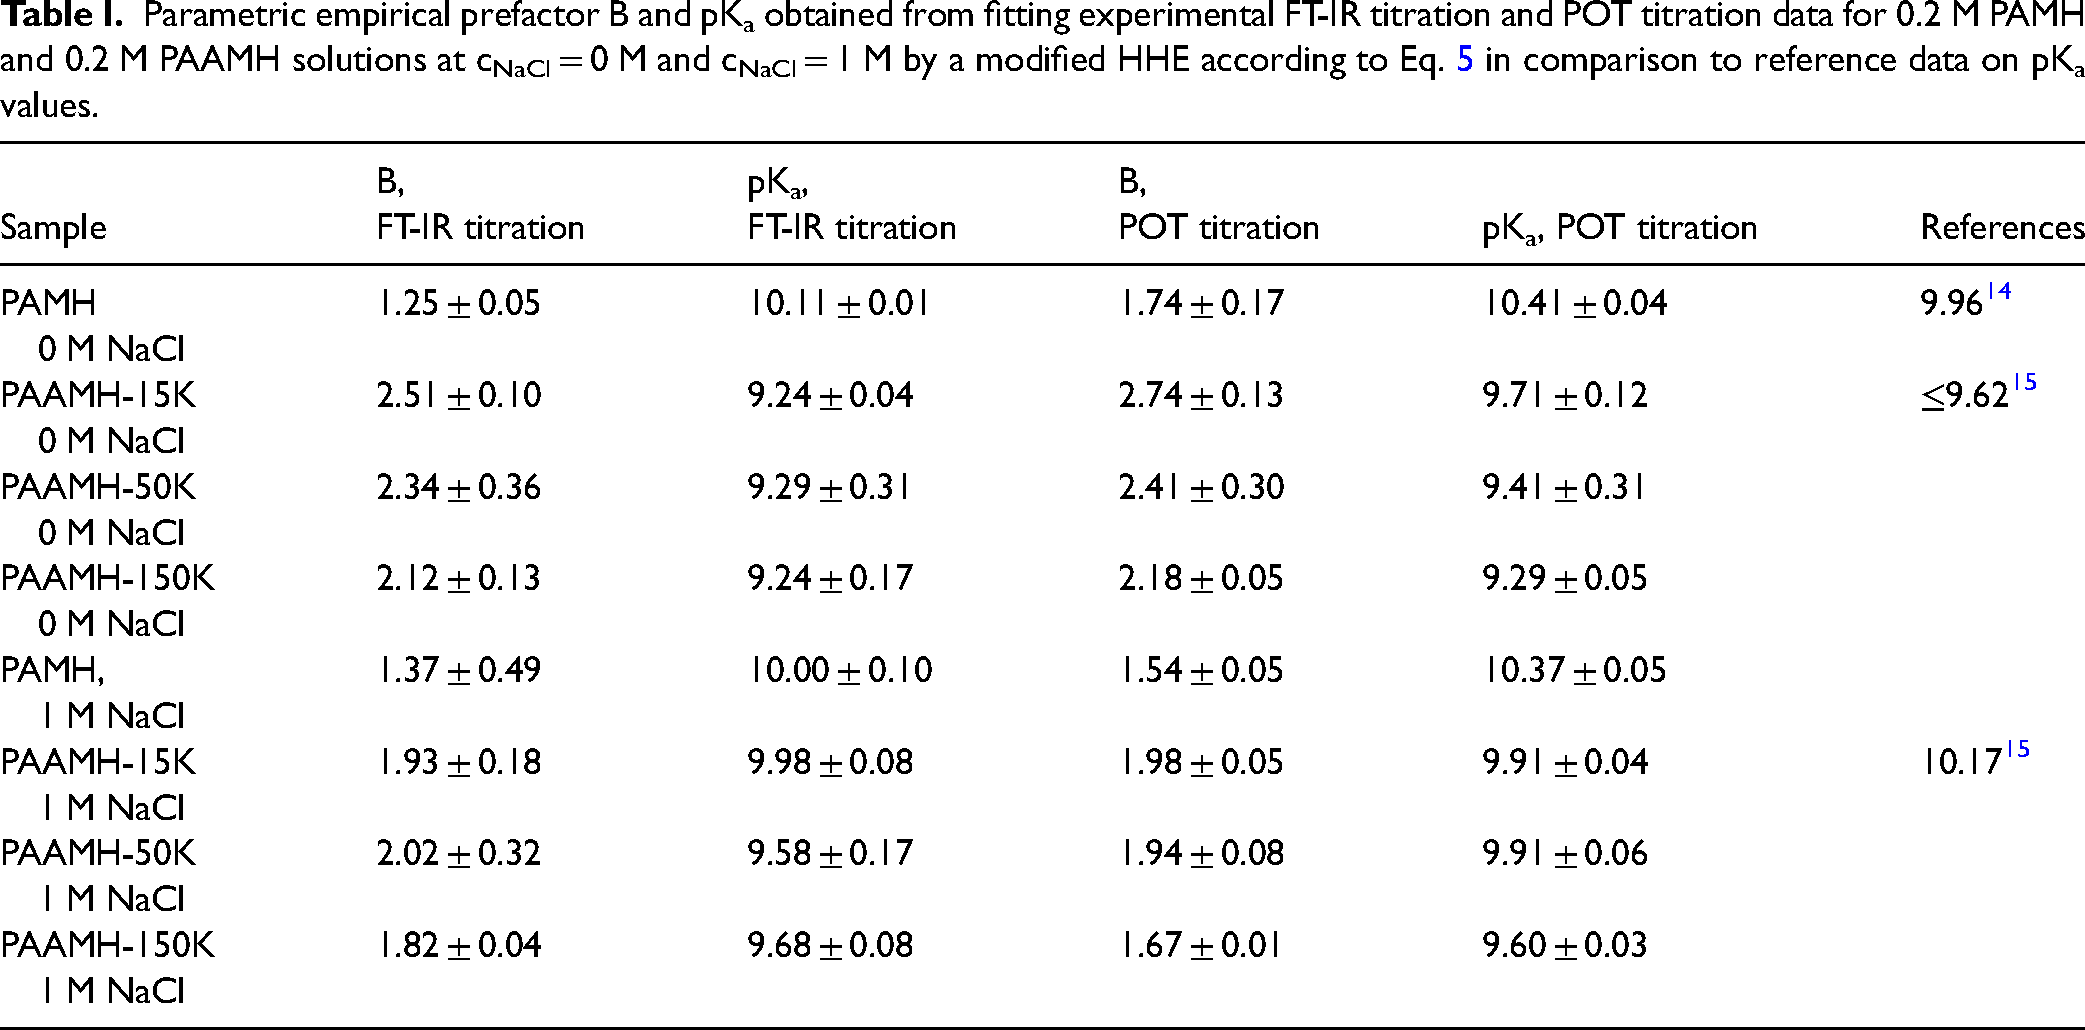
This pKa and B value from FT-IR titration were around similar to the values of pKa = 10.41 and of B = 1.74 from POT titration data on PAMH shown exemplarily in Figure S3a (Supplemental Material). Moreover, both the pKa value from FT-IR titration and POT titration are in good agreement with pKa = 9.96 from the literature. 14 Furthermore, the prefactor B obtained by FT-IR (B = 1.25) and POT titration (B = 1.74) data differed to a considerable extent, which cannot be explained and might have originated from the fitting process.
Additionally, 0.2 M PAMH solutions were titrated by 1 M NaOH in the presence of 1 M NaCl. As it is also given in Table II values of pKa = 10.00 and B = 1.37 were obtained by FT-IR titration, while values of pKa = 10.37 and B = 1.54 were obtained by POT titration. Obviously, both FT-IR and POT titration data revealed similar pKa values for PAMH solutions in the absence if compared to the presence of 1 M NaCl. On the one hand, this trend is somewhat unexpected, since at higher salt concentrations electrostatic interactions are screened and thus the protonation of PAM should be facilitated and the pKa value of the protonated form increased. On the other hand, since charged monomeric PAMH in 0.2 M solution without salt can freely diffuse in the volume phase, one could also rationalize the low charge screening effect of salt, which is different for charged polymeric PAAMH as it will be shown in the next section.
Poly(Allylamine Hydrochloride) (PAAMH)
Figure 3a shows ATR FT-IR spectra of 0.2 M solutions of PAAMH with a molecular weight of MW = 50.000 g/mol (PAAMH-50K), which were titrated by 1 M NaOH (respective resulting pH values are indicated). Like for the ATR FT-IR spectra on PAMH solutions (Figure 2a), the area of the δ(NH3+) band at around 1525 cm–1 due to ammonium groups
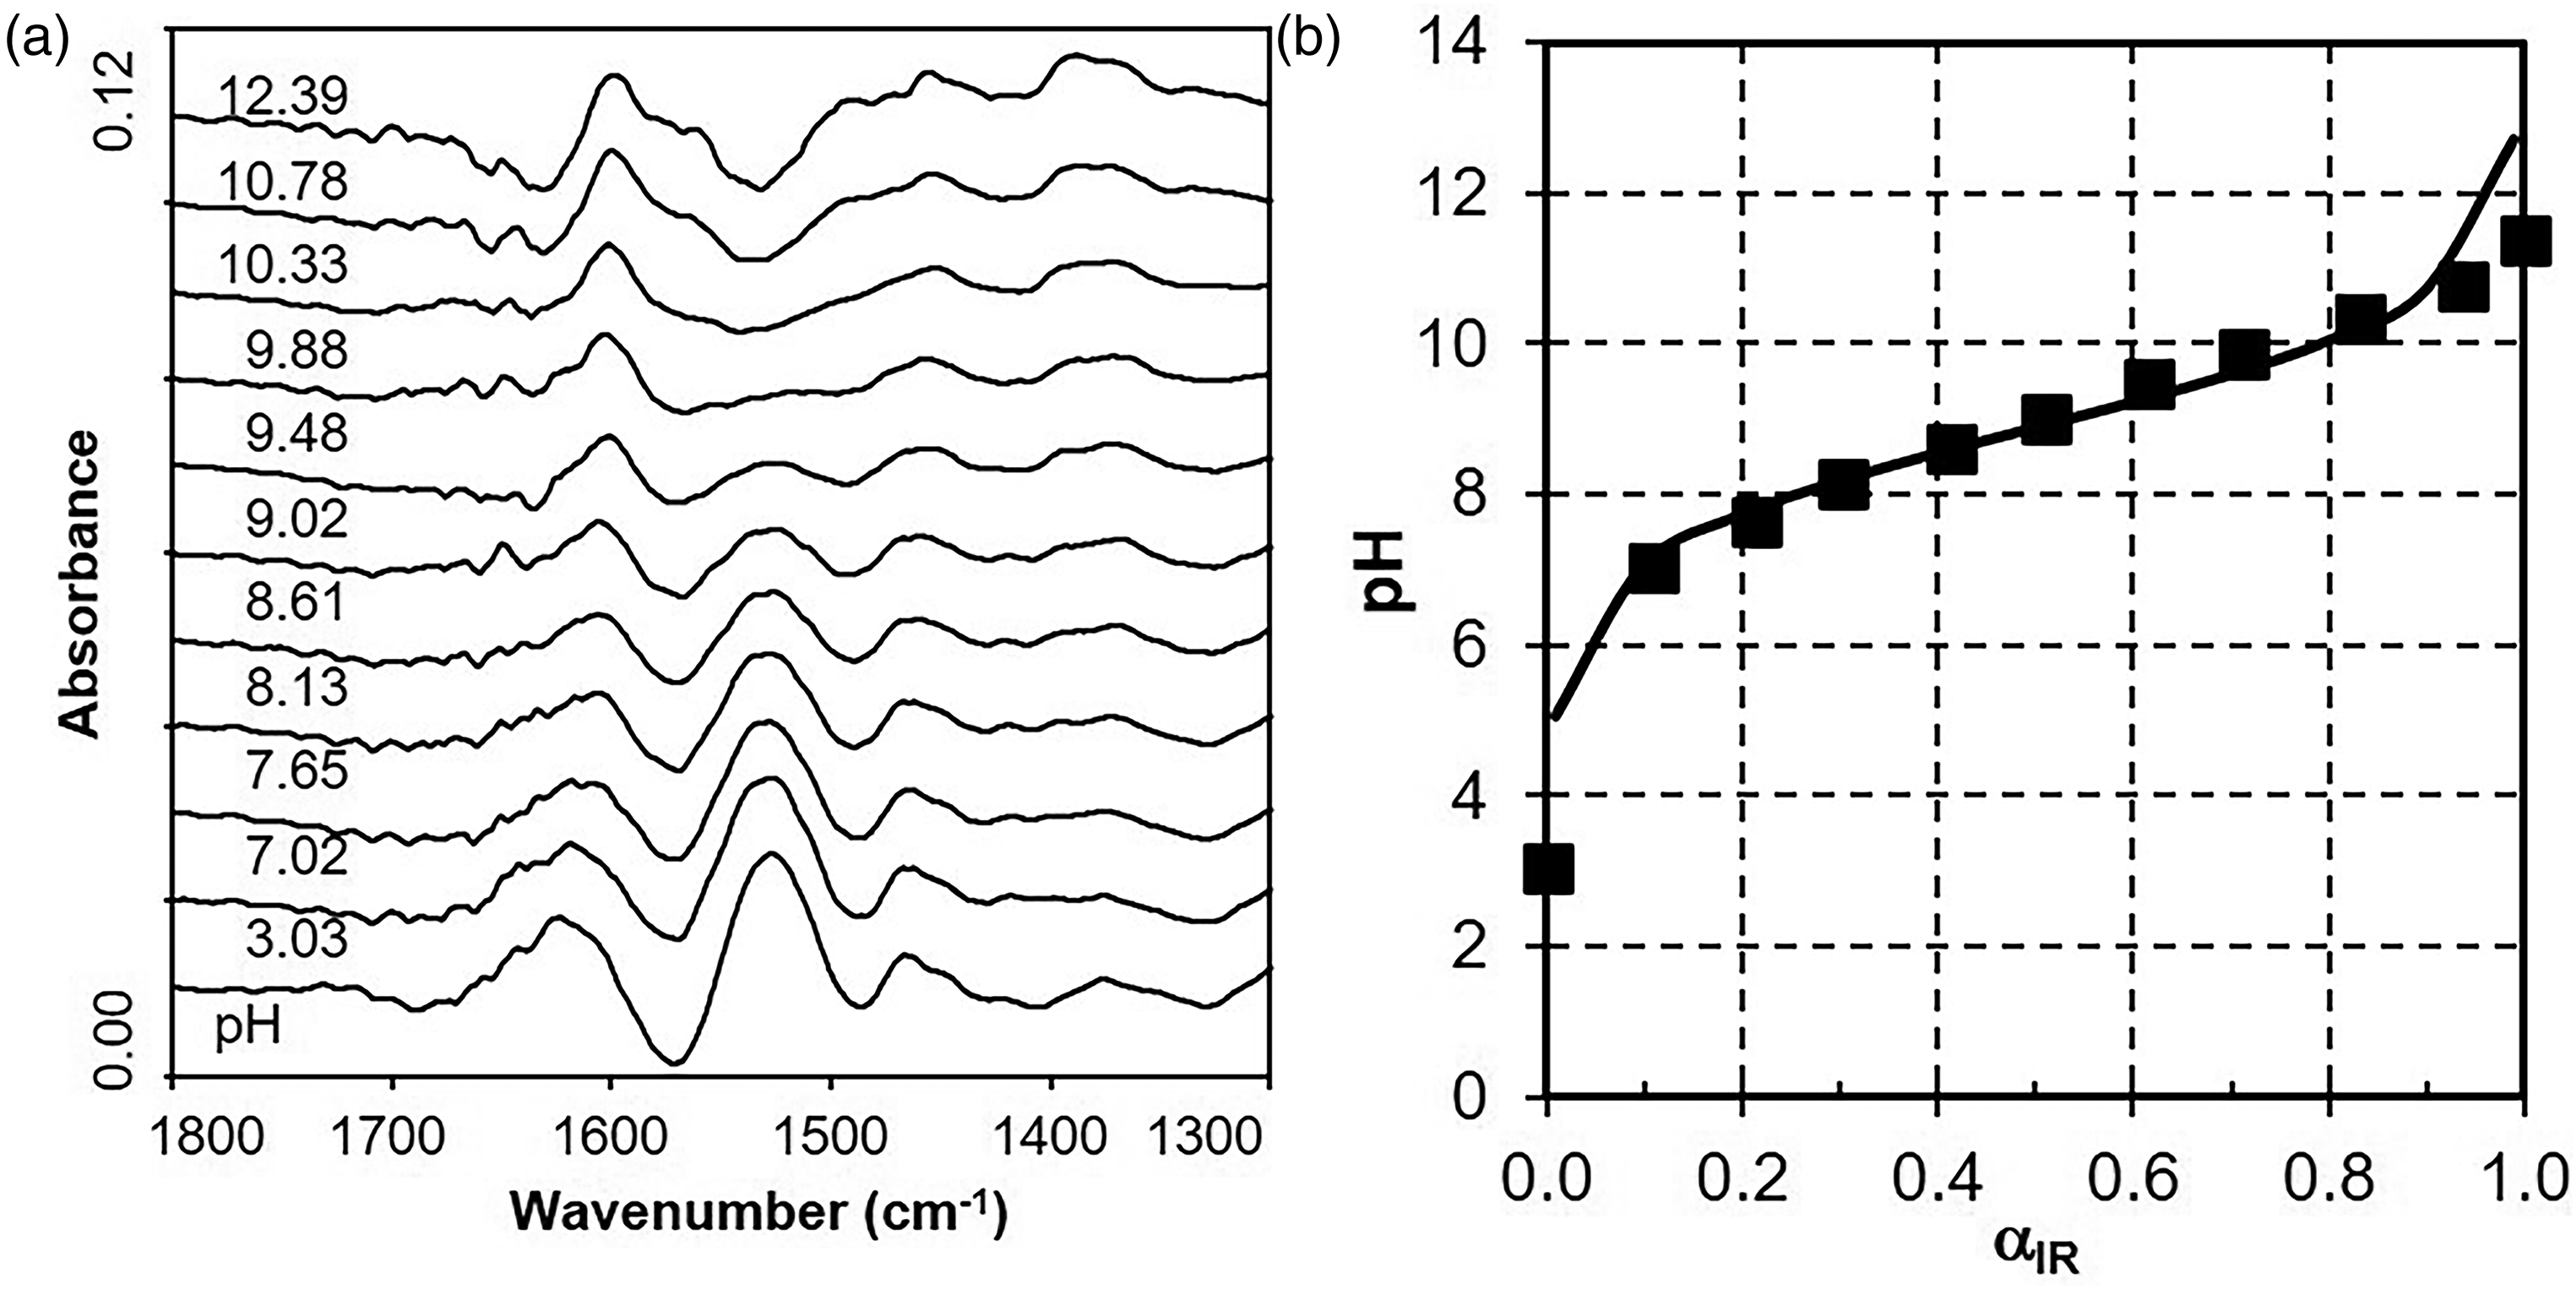
(a) ATR FT-IR spectra of 0.2 M PAAMH-50K solutions at different pH values starting with pH = 3.26 (bottom) and adjusted by adding increasing volumes (to top) of 1 M NaOH. (b) A plot of pH versus FT-IR-based dissociation degree αIR from ATR FT-IR spectra given in Figure 3a for 0.2 M PAAMH-50K solution (black squares) and fitted curves according to Eq. 5 (full line).
For FT-IR titration of PAAMH-50K solution, a value of pKa = 9.29 was determined, which was slightly lower if compared to the value of pKa = 9.41 for POT titration. Exemplary POT titration data are given in Figure S3b (Supplemental Material). Additionally, for FT-IR titration a value of B = 2.34 was found, which was similar to B = 2.41 determined by POT titration, indicating a similar degree of cooperativity during titration.
The presence of salt (1 M NaCl) resulted in higher values of pKa = 9.58 for FT-IR and more significantly pKa = 9.91 for POT titration if compared to respective values for the absence of salt (FT-IR: 9.29; POT: 9.41). This salt effect is reasonable, since at higher salt concentrations electrostatic interactions are screened and thus the charged (i.e., protonated) state of PAAMH-50K is tolerated resulting in an increased pKa value of the protonated form if compared to the absence of salt. Comparable to PAAMH-50K in the absence of salt similar B values (FT-IR: 2.02; POT: 1.94) were determined for POT compared to FT-IR titration suggesting similar cooperativity.
Generally, all pKa values found for polymeric PAAMH-50K were significantly lower if compared to low molecular PAMH regardless of whether or not FT-IR or POT titration was used, or the absence or presence of salt was applied.
Concerning molecular weight dependence of PAAMH starting with the “monomer” form (PAMH) and continuing with PAAMH-15K, PAAMH-50K until PAAMH-150K, for both the absence and presence of salt POT titration data showed a significant monotonous decrease of pKa values from 10.41 to 9.29 and from 10.37 to 9.60, respectively. FT-IR titration data in the absence of salt showed rather a steplike decrease of the pKa values from 10.11 for PAMH to 9.24 for PAAMH-150K, while in the presence of salt similar to POT titration there was rather a monotonous but less pronounced decrease of pKa values from 10.00 for PAMH to 9.68 for PAAMH-150K.
Discussion
Based on our recent report on FT-IR and POT titration on weak polyacid solutions, 1 herein we have extended FT-IR and POT titration to weak polybase solutions. Two main tasks were addressed. On the one hand, the experimental modalities of FT-IR titration validated at weak polyacid solutions were transferred to weak polybase solutions, while on the other hand, the experimental findings were interpreted and critically discussed on their relevance based on known theoretical models for weak PEL solutions.3–5
Experimental Modalities
Concerning the experimental task, FT-IR titration offers a new analytical method to determine pKa values of weak PEL not only for carboxyl but also for amine group-bearing (polymer) systems. Favorably, only some 8–20 pH settings are needed, at which some respective 8–20 ATR FT-IR spectra have to be recorded beginning with, e.g., the low pH setting of around pH ≈ 2. Analogously, to already introduced FT-IR titration data at polyacid systems, 1 the analysis of the measured data of pH versus αIR for polybase systems by HHE is straightforward and results in general agreement between pKa values obtained from FT-IR titration and POT titration obtained herein and the literature.14,15 However, while for the polyacid systems FT-IR titration allows to monitoring intensity variations of several pH-sensitive IR bands indicative for COOH and COO– groups, for polybase systems monitoring of pH-sensitive changes was limited to the δ(NH3+) band at 1525 cm–1 indicative for NH3+ groups.
Another important experimental aspect is, that for FT-IR titration one must not necessarily know, if the original mono/polyamine solution to be analyzed is in either 0% or 100% protonated/dissociated state, while such knowledge is mandatory for the quantitative analysis of POT titration data. Advantageously, FT-IR titration data are based on the measured pH values of the sample solution versus the respective spectroscopically determined dissociation or protonation degrees, while classical POT titration data are based on the measured pH values versus dissociation or protonation degrees, the latter of which are not analytically determined but calculated by dividing titrant concentration and monomer/polymer concentration. Hence, usually, for POT titration the sample initially has to be either in the extreme dissociation/protonation degree of 0 or of 1, and then titration with either NaOH or HCl starts. Whereas FT-IR titration must on principle not be performed starting with such defined initial extreme dissociation/protonation degree, since FT-IR titration data are based on corresponding but not continuously ordered pH/αIR value pairs. Nevertheless, in this work, FT-IR titration was performed on the identical mono/polyamine solutions used for POT titration and in the same sequence of measurements, so that any hysteresis effects of weak PEL are ruled out.
One final experimental aspect has to be critically addressed. FT-IR titration at weak polybase solutions, similar to weak polyacid solutions, requires rather high concentrations of cPEL = 0.2 M due to the lack of ATR FT-IR sensitivity for the bulk solution phase, and even at this high cPEL, only the δ(NH3+) band is evaluable. This aspect will be critically discussed below in the context of PEL solution regime type and overlap concentration.
Data Interpretation
Monoelectrolyte Versus PEL Effect
Firstly, FT-IR titration supported by POT titration data revealed systematically higher pKa values (10.11–10.41) for the “monomer” bound ammonium groups compared to the polymer-bound ammonium groups (9.24–9.71). This result is reasonable, and explanations might be given on both a simple and a more complex level. On a simple qualitative level, the pKa value is generally higher, or the propensity of losing cationic charge is lower for low molecular ammonium compared to high molecular ammonium compounds due to energetic and entropic contributions. Energetically, keeping the protonation degree or the cationic charge is more favored in monoammonium compounds since they can freely move according to Brownian motion. Whereas, in polyammonium compounds, many neighbored ammonium groups are locally fixed on a polymer chain, which is energetically unfavorable. Additionally, the neighbored-like charged repeating units repel each other and force the chain into an extended conformation, which is entropically also unfavorable.
On a more complex level such nearest neighbor and next nearest neighbor interactions in polyamine systems were addressed by statistical mechanical models to describe acid/base properties earlier by Katchalsky et al., 16 and later by Smits et al., 5 and Borkovec and Koper, 17 which were starting from the Ising model originally addressing magnetic interaction. 18 Based on such a model and plotting pH versus the fraction of charged monomers β (i.e., ionization degree) a doublet fraction xD (i.e., the number of nearest charged neighbor pairs per total number of monomers) and even a triplet fraction xT (i.e., respective next nearest pairs) can be obtained just from FT-IR and POT titration data.
Molecular Weight Effect
Including PAMH as a “monomer”, a series of increasing molecular weights of polymeric PAAMH (PAMH, PAAMH-15K, PAAMH-50K, and PAAMH-150K) suggest that decreasing pKa values were obtained. This issue is reflected in Figure 4, where based on a rearrangement of the HHE according to
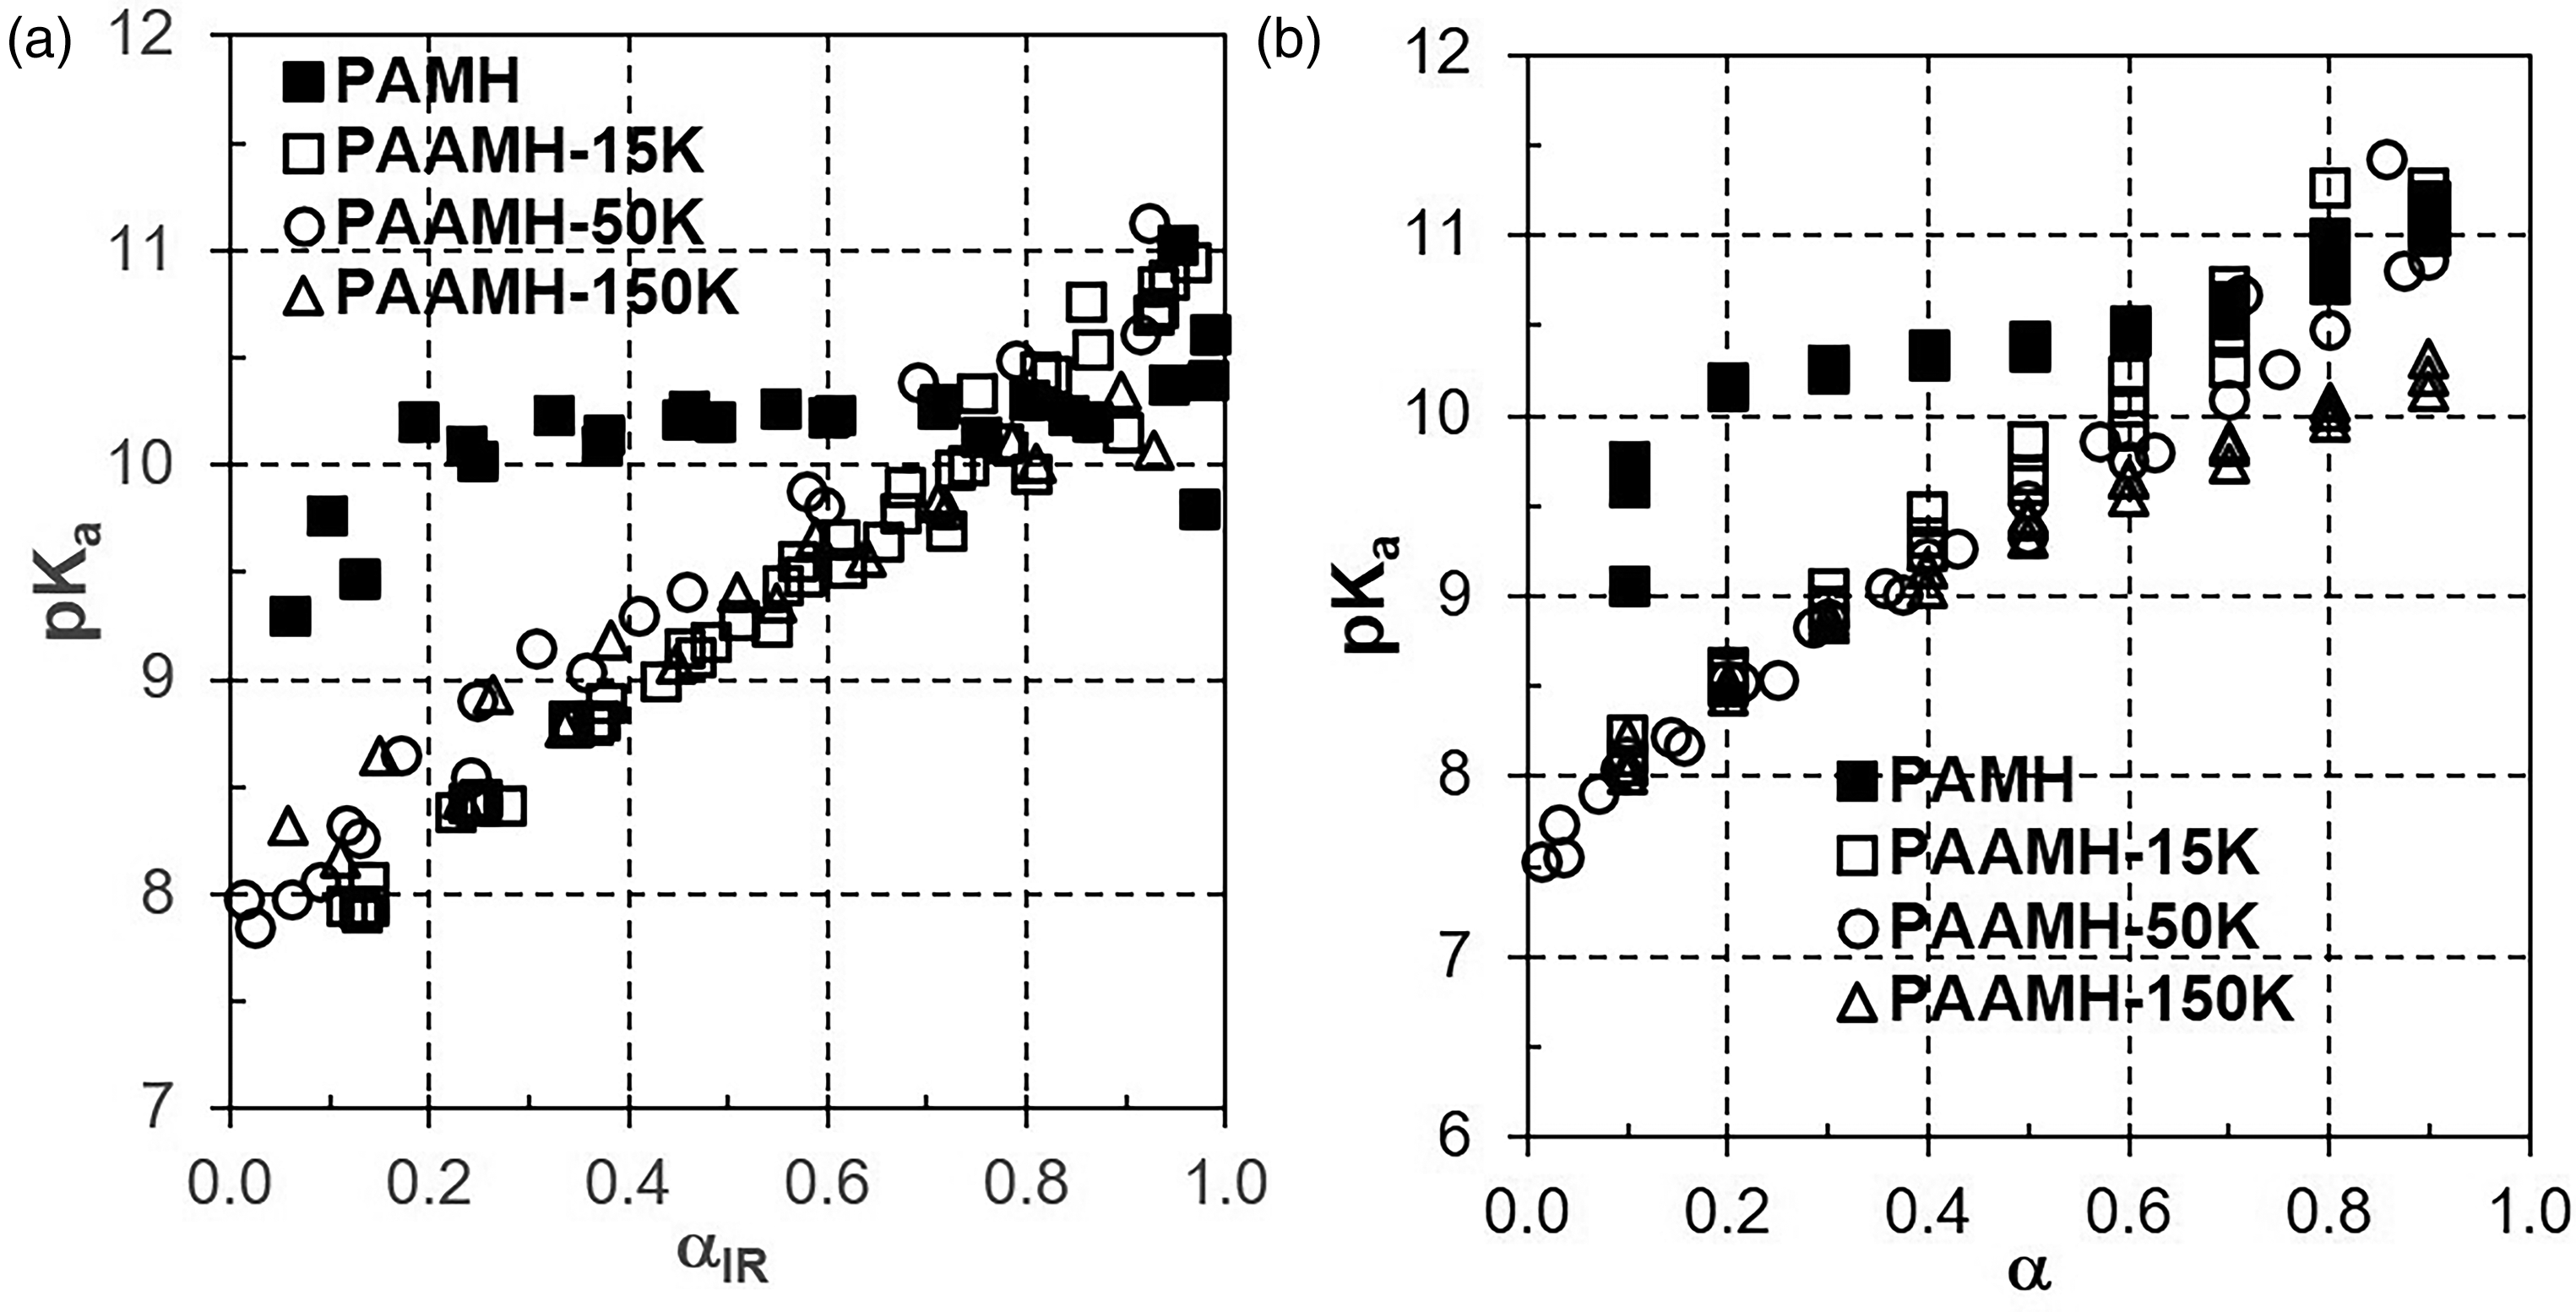
Plot of pKa versus dissociation degree αIR from FT-IR (a) and α from POT titration (b) according to equation pKa = pH − log[α/(1 − α)] 19 for 0.2 M PAMH and PAAMH-15K, -50K, and -150K solutions obtained from FT-IR and POT titration (full cubes: PAMH; empty cubes: PAAMH-15K; empty circles: PAAMH-50K; empty triangles: PAAMH-150K).
Such plots were initiated by Miyajima et al. 4 and Kodama et al. 19 addressing, whether there is an increasing dependence of pKa on dissociation degree α with increasing molecular weight. Generally, for PAAMH, the pKa value is significantly dependent on αIR, while PAMH does not show such dependence being rather constant (between α = 0.2 and 1.0). However, the courses of PAAMH-15K, PAAMH-50K, and PAAMH-150K are not significantly different, so that there is no significant influence of MW on pKa. Extrapolating all courses (rather constant one for PAMH, rising ones for PAAMH) to αIR = 1 a value of around pKa ≈ 10.5 can be identified, which one might call pKa,0 and should be close to the pKa value of the “monomer” PAMH. Similar trends as the pKa constant for PAMH and increase for PAAMH with increasing α were obtained for the POT titration data (Figure 4b). Such lack of molecular weight dependence suggests that PAAMH coils irrespective of molecular weight have exceeded the overlap concentration c* and separate PEL and SOL domains cannot be established. Indeed, based on the radius of gyration RG = 11.9 nm for PAAMH-15K reported in the literature, 10 values of c* = 0.038 mol/L for PAAMH-15K were calculated. This value of c* is far lower if compared to the applied PEL concentration cPEL = 0.2 mol/L and suggests, that for all molecular weights PAAMH coils are no longer separated from each other. Hence, e.g., the GDT model of Jacob and Marinsky 3 and Miyajima et al. 4 would not apply, since it requires separate PEL (ideally rod-like) and SOL domains.
Salt Effect
Furthermore, the higher pKa values for both FT-IR titration (range: 9.58–9.98) and POT titration (range: 9.91–9.60) for polymeric PAAMH (15K–150K) in the presence of salt if compared to the absence of salt (FT-IR, range: 9.24–9.29; POT, range: 9.71–9.29), clearly showed the screening effect of 1 M NaCl (Debye length: 0.3 nm). Such screening effect for “monomeric” PAMH was neither observed by FT-IR titration (0 M NaCl: 10.11; 1 M NaCl: 10.00) nor by POT titration (0 M NaCl: 10.41; 1 M NaCl: 10.37). Obviously, electrostatic screening allows polymer-bound ammonium groups of PAAMH macromolecules, which are inhomogeneously distributed in solution, as long as the polymer concentration keeps below the overlap concentration, better to keep charges, while screening does not have such effect on the ammonium groups of rather homogeneously distributed low molecular PAMH.
To get a more comprehensive picture of the salt effect, in Figures 5a–5c, plots of pKa versus αIR and α, respectively, which are analogous to Figure 4, are presented.
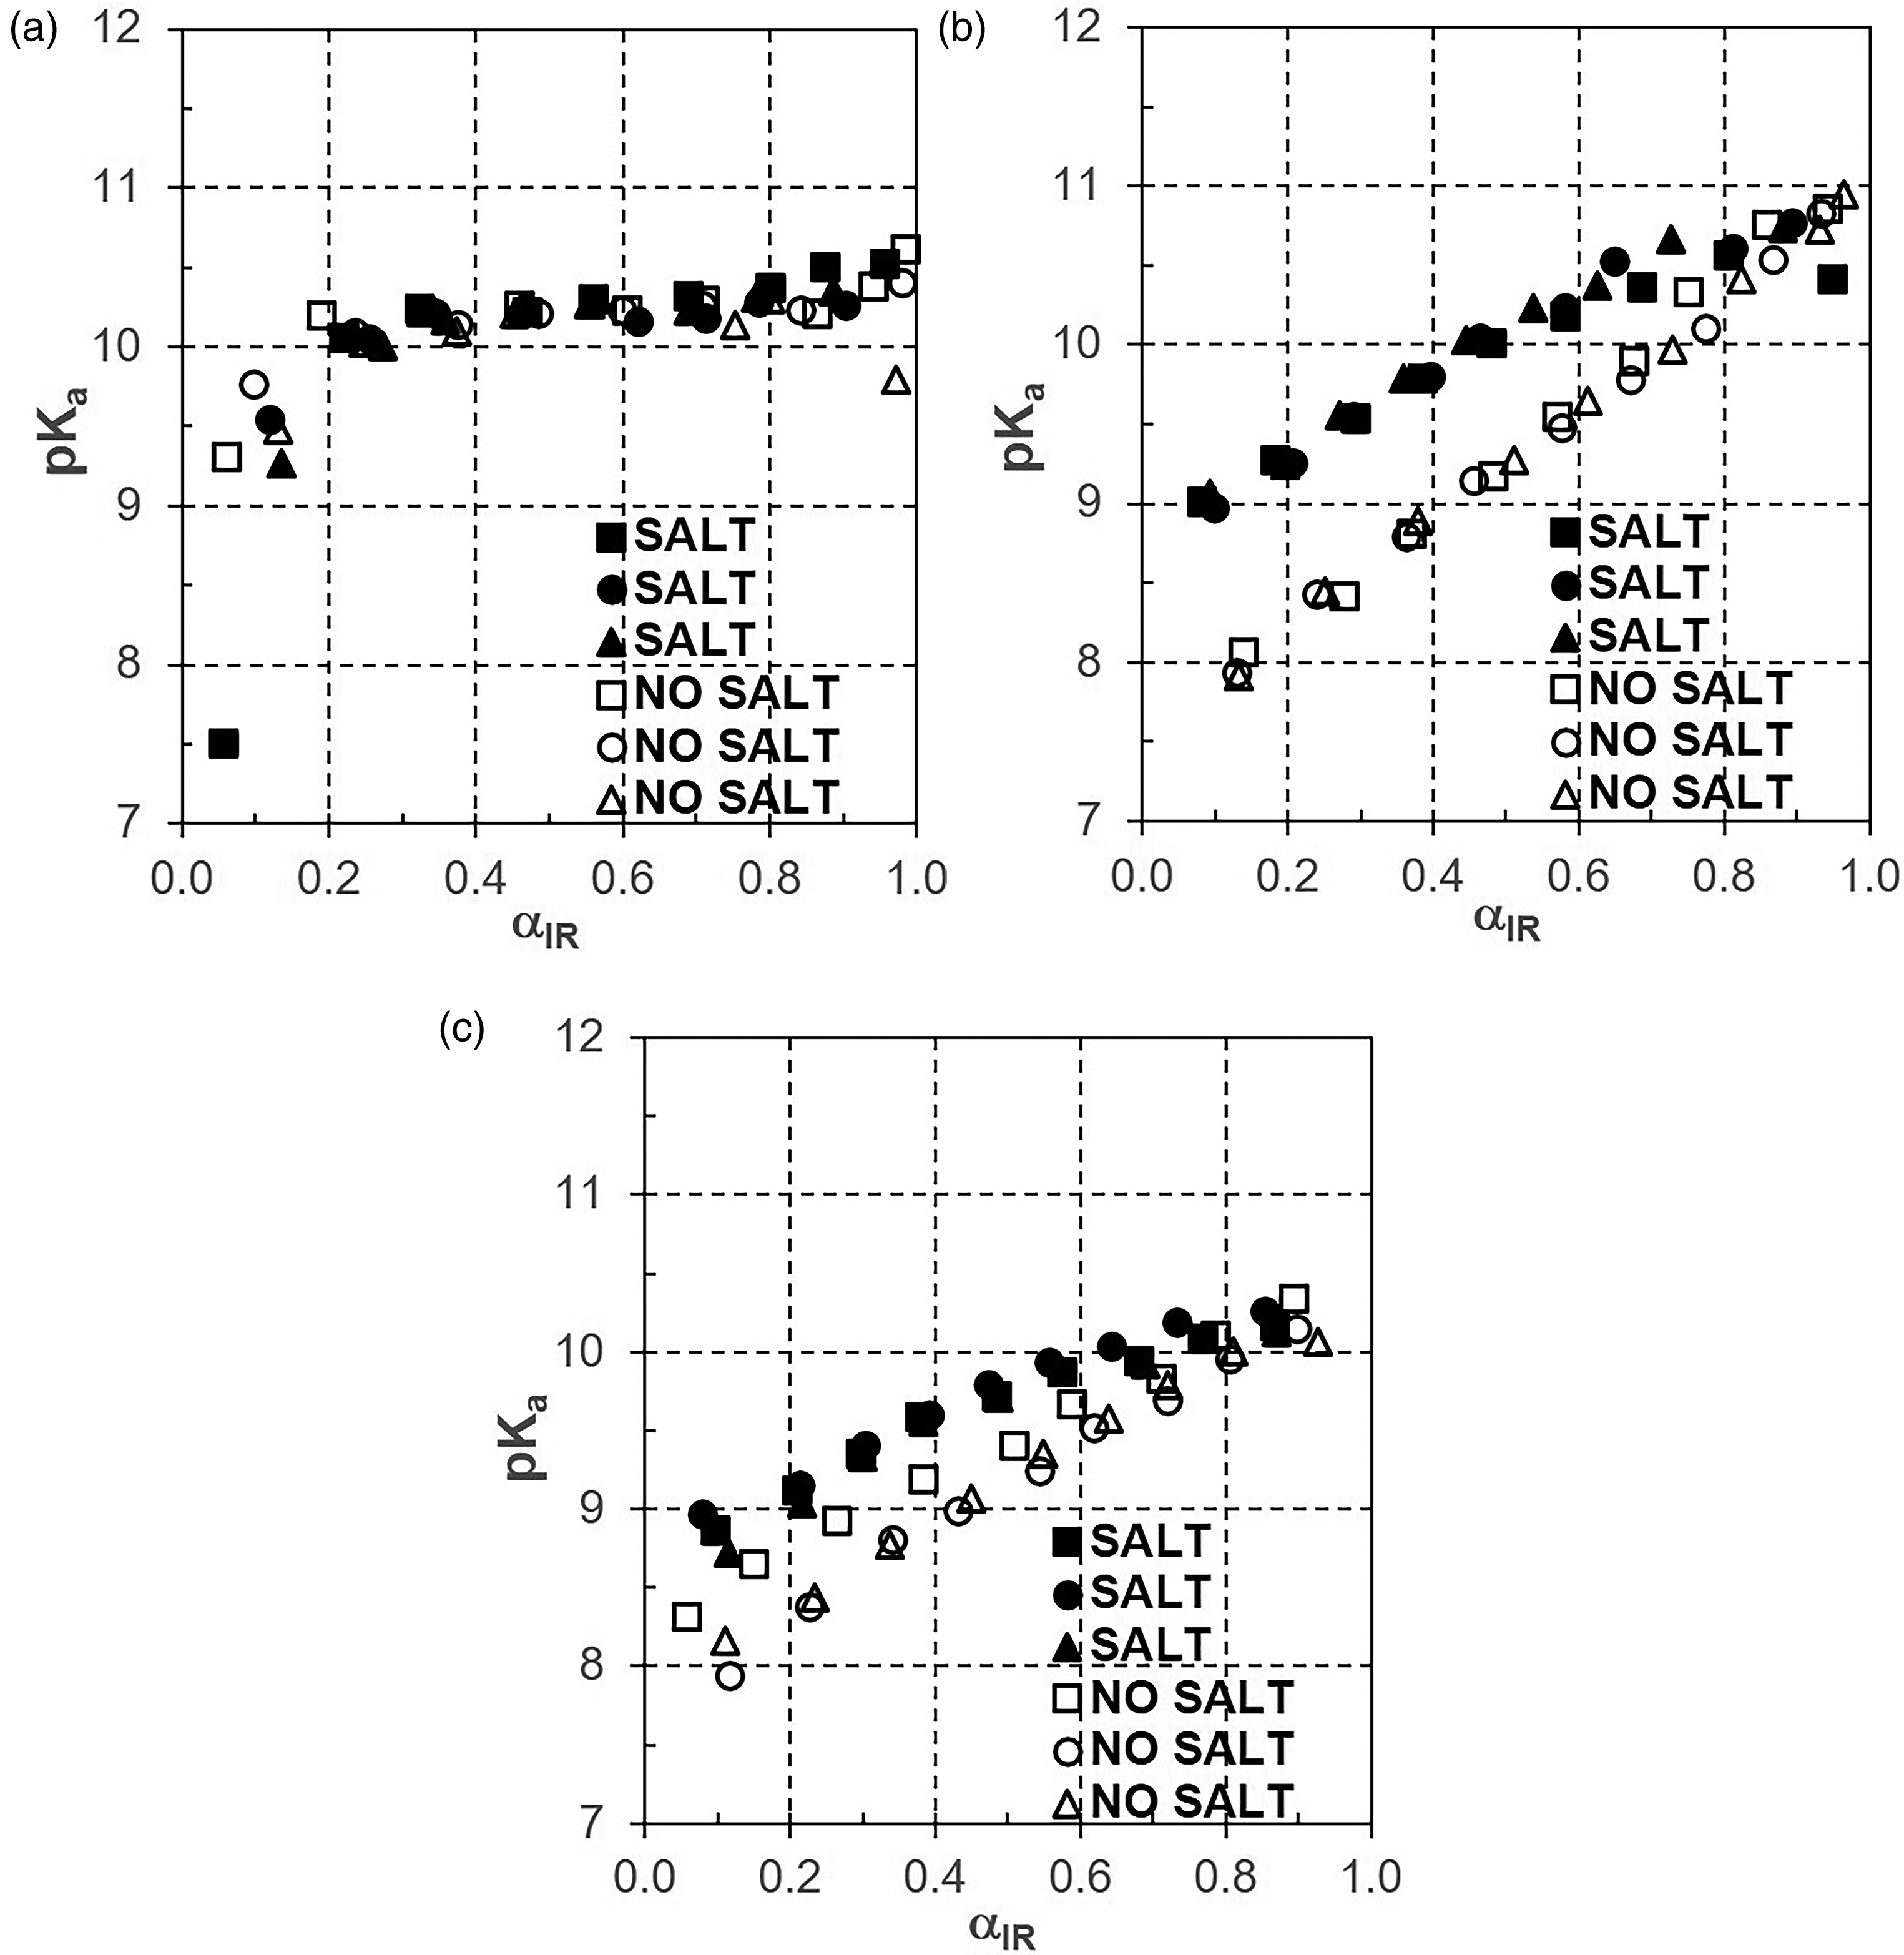
Plot pKa versus αir in the absence (empty symbols) compared to the presence (full symbols) of salt (1.16 M NaCl) for PAMH (a), PAAMH-15K (b), and PAAMH-150K (c).
Therein, we compare titration data related to PAMH, PAAMH-15K, and PAAMH-150K concerning the absence indicated by empty symbols and the presence of salt (1 M NaCl) indicated by full symbols. For PAMH (Figure 5a) no clear distinction can be made between the presence and absence of salt, which is due to only a weak salt effect for low molecular “monoelectrolytes”. However, for PAAMH-15K (Figure 5b) a significant distinction between the presence and absence of salt can be made, which is due to the stronger salt effect for PEL. For PAAMH-150K (Figure 5c) no such clear distinction can be made. Although in both PAAMH-15K and PAAMH-150K 0.2 M solutions, PEL coils should have exceeded overlap concentration c* = 0.031 mol/L, presumably the overlap effect might be even more pronounced for PAAMH-150K.
FT-IR Versus POT Titration Effect
Finally, we challenge the two different analytical principles in sensing dissociation or protonation using FT-IR compared to POT titration. In principle, both FT-IR and POT titration concepts are based on the addition of NaOH aliquots resulting in decreasing ionization. However, FT-IR titration might be assumed to sense deprotonation rather molecularly (–NH3 + Cl– → NH2 + H+ + Cl– and thus rather “directly” in the PEL domain, while POT titration measures solely the actual given pH values in solution. Hence, POT titration senses deprotonation rather “indirectly” just by registering the pH value (i.e., H+ concentration) in the SOL domain but not the PEL domain. Since FT-IR titration registers deprotonation of PAAMH rather immediately in the PEL domain and POT titration only after H+ has reached the SOL domain, lower pKa values might be expected for FT-IR and higher ones for POT titration. Although such a trend has been qualitatively observed for PAAMH in the low salt regime (Table I, 0 M NaCl), quantitatively the pKa deviations obtained between FT-IR and POT titration obtained for PAAMH solutions were not significant enough given the error ranges and thus the present measured data on PAAMH solutions cannot fully justify this hypothesis.
Nevertheless, the challenging deviation between FT-IR and POT was considered by plots of pKa versus α shown in Figure 6. We have selected PAAMH-15K, no salt (Figure 6a), and PAAMH-15K, 1 M NaCl (Figure 6b). For PAAMH-15K without salt, pKa values showed both higher values and slope for POT titration, which suggests that FT-IR titration reports more deprotonation if compared to the POT titration method. This might be attributed to the postulated higher sensitivity of FT-IR titration to the PEL phase. Whereas POT titration does not sense any dissociated protons in the SOL phase, since due to the exceeding of the overlap concentration there is no longer a defined distinction between PEL and SOL phase. Interestingly, in the presence of salt, the pKa versus α plots for POT and FT-IR titration are quite similar and the slope is rather flat, which suggests that the sensitivity of FT-IR and POT titration for dissociation becomes similar under such strong salt screening and thus the differentiation between a PEL and a SOL phase might be even more obsolete.
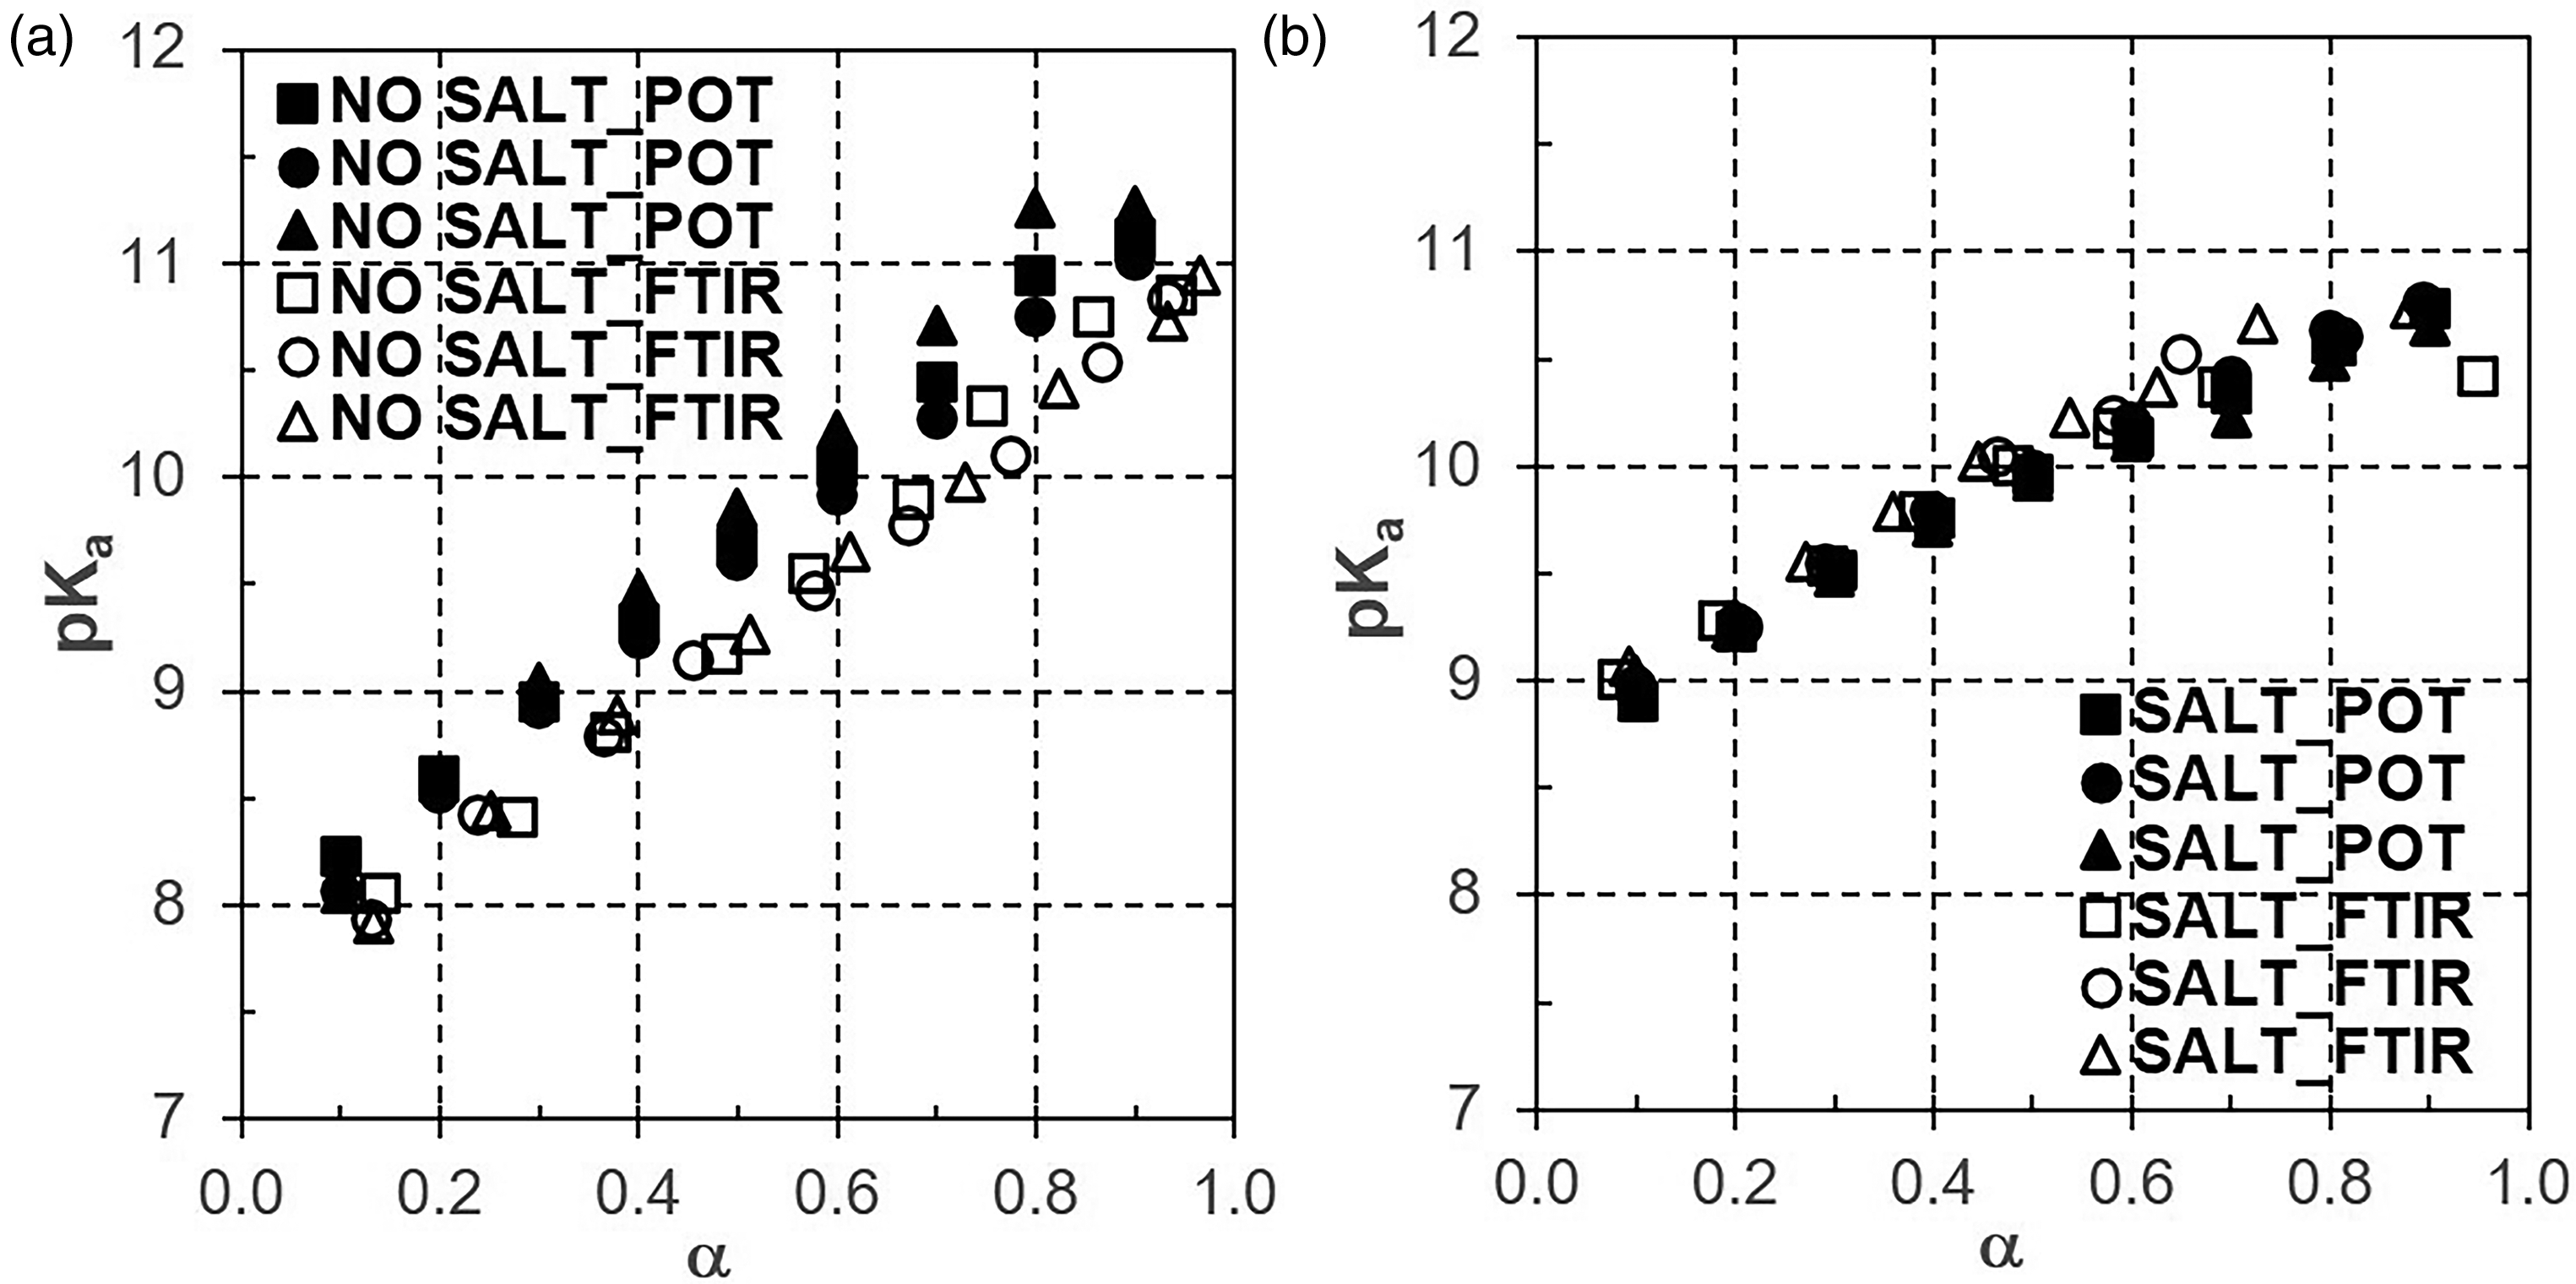
Plot of pKa versus αFT-IR (αIR, empty symbols) and POT titration (α, full symbols) for PAAMH-15K in the absence of salt (a) and in the presence of salt (b).
Conclusion
Using FT-IR titration pKa values of PAMH and PAAMH in concentrated solutions for three different MW and in the absence and presence of salt (NaCl) were determined and critically discussed in comparison to pKa values obtained by classical POT titration. Conceptually, FT-IR titration does not only monitor deprotonation in polyammonium solutions molecularly, since NH3+ groups are spectroscopically “seen”, but FT-IR titration can be readily extended to weak polybase systems at interfaces.
Three main relevant effects on PAMH and PAAMH solutions could be identified by the FT-IR titration complementing POT titration which were the evident monoelectrolyte versus PEL effect, the evident salt effect, and the challenging POT versus FT-IR titration effect.
Finally, due to the versatility of this method further FT-IR titration studies will be performed at interfacial polyammonium containing multilayers, brushes, and polyampholyte layer systems using the introduced approach.
Supplemental Material
sj-docx-1-asp-10.1177_00037028231213673 - Supplemental material for Determination of the pKa Value of Protonated Mono and Polyamine in Solution Using Fourier Transform Infrared Titration
Supplemental material, sj-docx-1-asp-10.1177_00037028231213673 for Determination of the pKa Value of Protonated Mono and Polyamine in Solution Using Fourier Transform Infrared Titration by Martin Müller, Luise Wirth and Birgit Urban in Applied Spectroscopy
Footnotes
Acknowledgments
Part of this work is related to the project “Dynamic Surface Coatings Through the Hierarchical Self-Assembly of Responsive Colloidal Building Blocks” (PN 426 950 009) funded by Deutsche Forschungsgemeinschaft (DFG).
Declaration of Conflicting Interests
The authors declared no potential conflicts of interest with respect to the research, authorship, and/or publication of this article.
Funding
The authors disclosed receipt of the following financial support for the research, authorship, and/or publication of this article: This work was supported by the Deutsche Forschungsgemeinschaft, (grant number PN 426 950 009).
Supplemental Material
All supplemental material mentioned in the text is available in the online version of the journal.
References
Supplementary Material
Please find the following supplemental material available below.
For Open Access articles published under a Creative Commons License, all supplemental material carries the same license as the article it is associated with.
For non-Open Access articles published, all supplemental material carries a non-exclusive license, and permission requests for re-use of supplemental material or any part of supplemental material shall be sent directly to the copyright owner as specified in the copyright notice associated with the article.