
Abstract
Maturity is a major fiber trait that affects the processing and performance of cotton fiber. Rapid and accurate identification of fiber maturity phenotypes and genotypes is of importance to breeders. Previous studies showed that either conventional fiber measurements or attenuated total reflection Fourier transform infrared spectroscopy (ATR FT-IR) analysis discriminated the immature fiber (im) phenotype from the wild type (WT) mature fiber phenotype in a segregating F2 population from a cross between two upland cotton lines differing in fiber maturity. However, both conventional fiber property measurement methods and FT-IR analyses with current algorithms could not detect the subtle differences among the WT fibers composed of two different genotypes, WT homozygosity (WT-homo) and WT heterozygosity (WT-hetero). This research explored the FT-IR method, in combination with soft independent modeling of class analogy of principal component analysis (SIMCA–PCA), for the discrimination of WT fiber phenotypes consisting of two different genotypes (WT-homo and WT-hetero). The new approach enabled the detection of IR spectral intensity differences between WT-homo and WT-hetero fibers. Successful classification originated from a distinctive spectral difference in the low-wavenumber region (<700 cm–1) between WT-hetero fibers and WT-homo fibers. This observation emphasized that ATR FT-IR with a SIMCA–PCA approach would be a sensitive tool for classifying the WT fibers demonstrating minor phenotypic differences. The improved sensitivity of the infrared method may provide a way of dissecting genotype–phenotype interactions of cotton fibers rapidly and efficiently.
This is a visual representation of the abstract.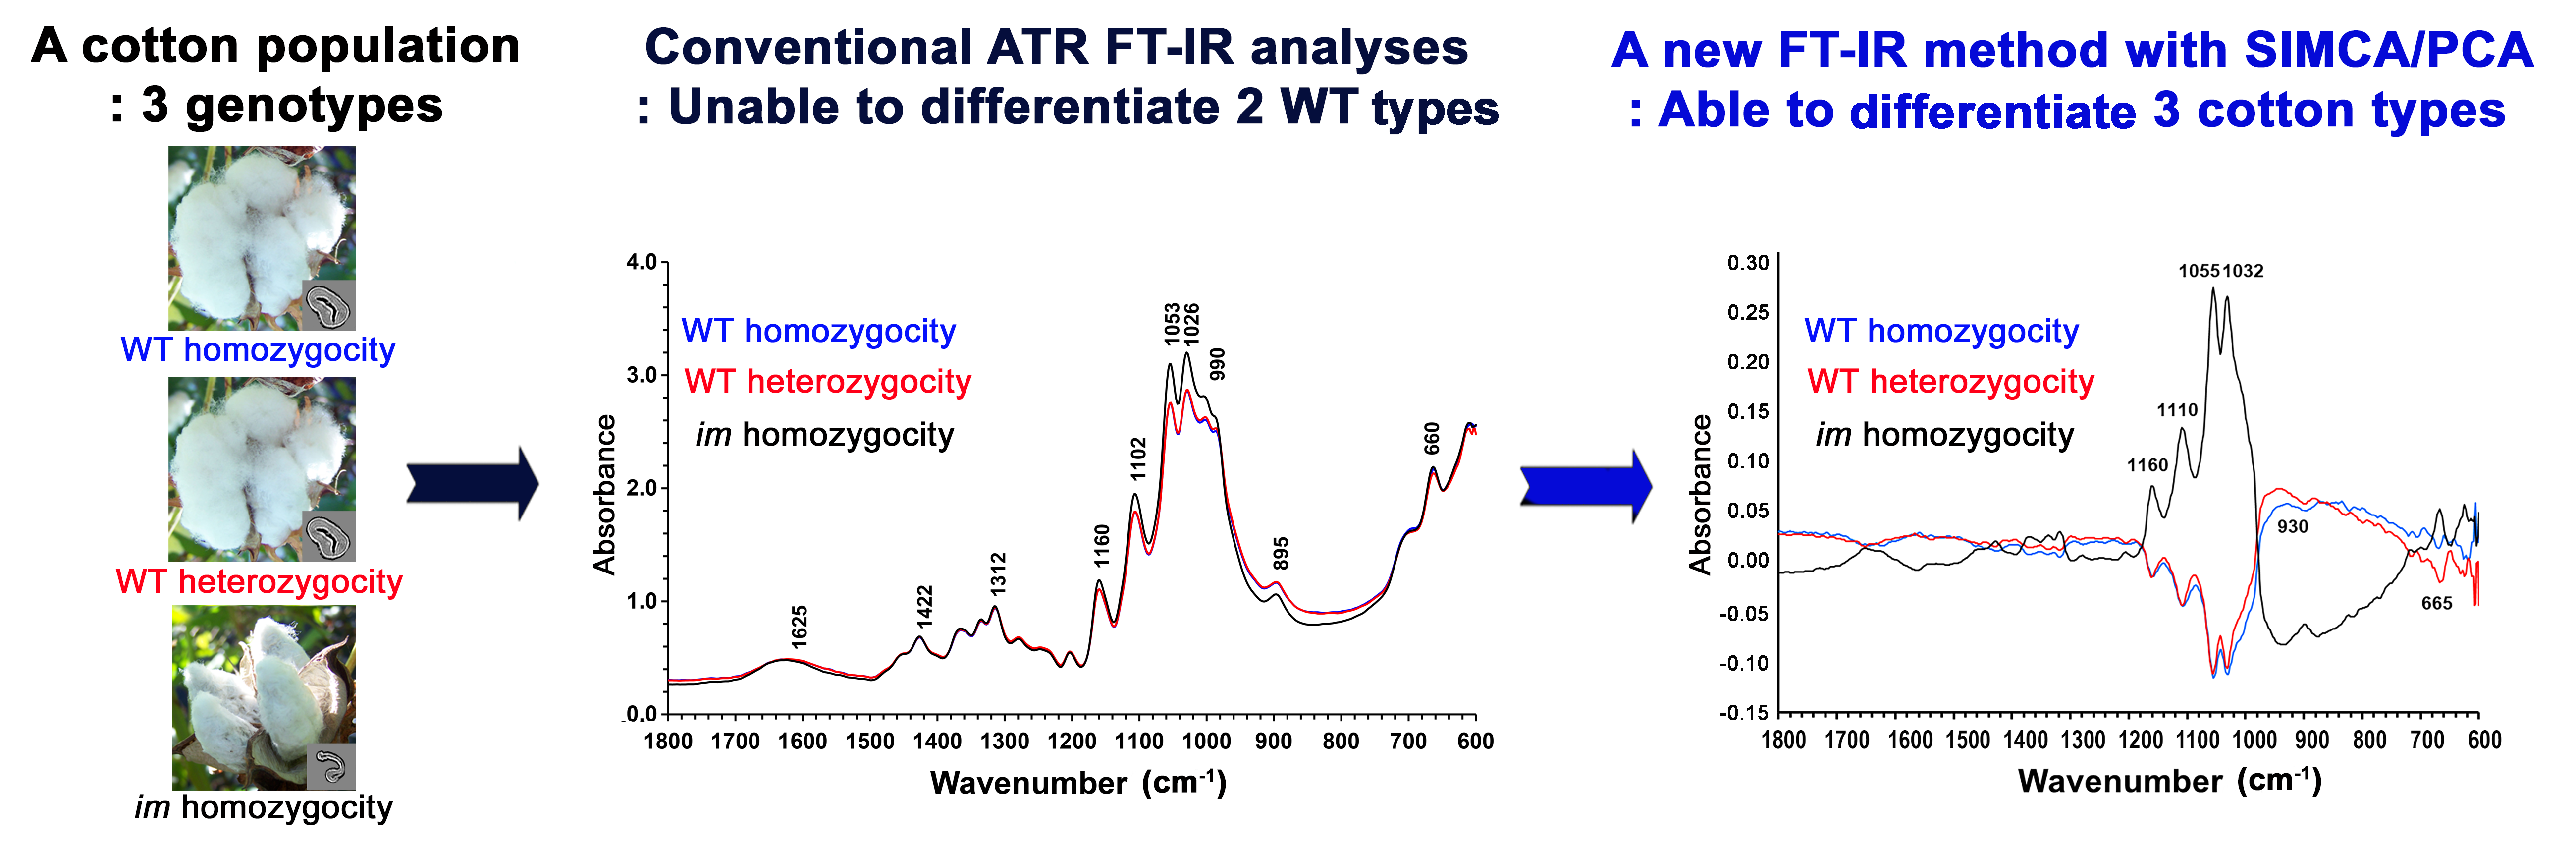
Keywords
Introduction
Cotton fiber maturity property is a key yield index and also an essential fiber quality attribute, which is directly linked to fiber breakage and entanglement (neps) during mechanical processing, dye uptake in yarn and fabric products, as well as yarn processing and textile performance.1–5 Fiber maturity is represented by the term circularity (θ), defined as the cross-sectional area of the secondary cell wall (SCW) relative to the area of a circle having the same perimeter.6–8 Another term, fiber maturity ratio (MR) calculated by the formula of MR = θ/0.577, is commonly used in the cotton industry.6–8 Mean fiber maturity can be measured directly on each of 300–500 cross-sectioned fibers in a sample by an image analysis microscopy (IAM) method. However, the IAM method utilizes the microscopic approach requiring laborious and time-consuming processes and it would be a great effort to analyze many experimental cotton samples by cotton breeders and geneticists. Alternatively, the fiber maturity of experimental cotton populations has been measured indirectly from other methods, including the advanced fiber information system (AFIS) 9 and Cottonscope 10 by cotton geneticists and breeders. Previous studies on a set of 104 well-defined reference materials for cotton fiber maturity have reported a good overall agreement of the MR values measured by the direct (IAM) and indirect methods (AFIS and Cottonscope), despite the differences in sensitivity or dynamic ranges among three methods.11,12 In addition, a quick and indirect tool for fiber maturity is a high volume instrument (HVI), which is a standardized instrument for measuring cotton fiber properties including micronaire (MIC). 13 HVI MIC reflects a combination of fiber maturity and fineness information by measuring air-flow resistance through a plug of cotton fibers of a given weight, 14 and can be utilized for fiber maturity interpretation when additional information on samples is given.
An immature fiber (im) mutant that produced non-fluffy cotton bolls with immature and thin fiber cell walls was reported in the 1970s. 15 By backcrossing the original im mutant several times with the wild type (WT) Texas Marker-1 (TM-1), a pair of near-isogenic lines varying in fiber maturity was created and also used as a cotton model system for studying cotton fiber maturity. 16 To distinguish the im fiber phenotype from the WT fiber phenotype, their maturity values could be directly measured by calculating the SCW area of individual cross-sectioned NIL fibers. However, the laborious microscopic method is very time-consuming for most cotton breeders and geneticists who often study fiber maturity phenotype from an experimental population composed of a large number of cotton samples, largely due to a need for dedicated software for image analysis. Because of significantly lower MIC values for the im fibers than for the WT fibers, cotton scientists have used MIC values to estimate the fiber maturity of the NIL fibers.17–19 Lint percentage (Lint %), closely related to fiber MIC readings between the im and WT fibers, was also taken to characterize the NIL fiber phenotypes.15,17–20
To explore the possibility of a rapid, non-destructive, low-cost, and routine method in cotton fiber studies, attenuated total reflection Fourier transform infrared spectroscopy (ATR FT-IR) method has been attempted extensively.18,21–29 In these investigations, utilization of ATR device greatly facilitates the sampling procedure and also is time efficient in sample analysis. The sampling depth of the ATR device is from 2 to 15 μm depending on ATR crystal materials and also increases with decreasing wavenumber.30–32 For instance, sampling depth increases from ∼1 μm for germanium crystal to over 6 μm for ZnSe crystal over the 1100–600 cm–1 region. 30 Meanwhile, different ATR crystals have different wavenumber ranges, for instance, ZnSe, germanium, and diamond crystals are reported in respective ranges of 5000–550, 5000–850, 4500–2500, and 1800–200 cm–1. 31 Since the thickness of the SCWs in mature cotton fibers ranges from 2 to 7 μm, 33 the ATR method is capable of representing the information inside mature cotton fibers by the use of both a low refractive index crystal (ZnSe or diamond) and a low spectral region (1100–600 cm–1), as demonstrated by systematic investigations of cotton fiber biosynthesis.18,21–29 The ATR FT-IR method provides cotton breeders and geneticists with a way of collecting IR fiber properties from a very limited quantity of cotton fibers that are insufficient for conventional fiber property measurement but are enough for ATR FT-IR analysis.18,23,27
The ATR FT-IR spectra of cotton fibers have been analyzed by different spectral interpretation strategies, including the direct use of one-band intensities, the estimation of two- or three-band intensity ratios, and the implementation of a chemometric tool known as principal component analysis (PCA).18,21–29 Major applications involve the use of specific infrared (IR) bands to monitor the SCW cellulose deposition, the use of PCA to identify groups representing different fiber developmental stages and to distinguish fiber transition phase, and the proposal of simple algorithms to estimate cotton fiber maturity and crystallinity properties. In addition to cotton plant-related studies, the FT-IR technique has been used to screen other plant cell–wall mutants and to investigate the plant SCW synthesis as a rapid and non-invasive tool.34,35
In a recent investigation, 18 we reported IR maturity (MIR) and crystallinity (CIIR) values on a segregating F2 population derived from a cross between the im mutant and the WT cotton plant, along with MIC and Lint % values from conventional methods. In the segregating F2 population, the ratio between the WT and im phenotype was the expected 3 : 1 segregation ratio as predicted from the single recessive im gene. 16 The WT fiber phenotype consisted of two different genotypes namely WT homozygosity (WT-homo) and WT heterozygosity (WT-hetero), whereas the im fiber phenotype was composed of one type of genotype, im homozygosity (im-homo). 18 In maize, a dosage-dependent manner of a recessive gene caused phenotypic variations between WT-homo and WT-hetero maize plants. 36 Interestingly, the recessive im gene used in this cotton study also showed a dosage-dependent manner. 37 However, it is not known if the im gene affects fiber properties differentially between WT-homo and WT-hetero cotton plants. Usages of any classifiers including MIC-, Lint %-, MIR-, or CIIR-based values were successful in identifying the im phenotype from the WT phenotype fibers, but none of these classifiers enabled distinguishing the two WT fiber genotype groups (WT-homo vs. WT-hetero) further.
The main objective of this study was to examine whether the ATR FT-IR method with the aid of soft independent modeling of class analogy of PCA (SIMCA–PCA) could be effective for classifying the WT-homo fibers from the WT-hetero fibers, in which their genotype assignments were determined by DNA marker analysis of the individual plant. 18 This strategy differs from simple algorithmic analysis of ATR FT-IR spectra for MIR and CIIR value estimation or PCA characterization of ATR FT-IR spectra for spectral grouping. In simple algorithm analyses, unique IR bands from narrow spectral regions with fewer variables are used to assess target properties from individual spectra. These characteristic bands should be sensitive to spectral intensity changes induced by fiber development. Unlike the simple algorithm approach, PCA relies on wide spectral regions (or more variables) for maximizing the total variance within a spectral data set (usually, at least five spectra). PCA is an effective variable reduction technique, by decomposing the spectra into mathematical spectra, i.e., called loading vectors, scores, principal components (PCs), etc., that represent the most common variations to original data. Considerably fewer new variables (known as PCs) are able to describe the original information at very high percentages. PC scores are commonly used to show the relationships of samples within a sample set consisting of different classes (or groups). In general, PCA is a process of clustering the samples on the basis of their spectral characteristics and logical assignment of all data, 38 and it is not a classification method. Opposite to PCA characterization of all data representing different classes (or a single PCA approach), SIMCA–PCA performs a separate PCA model for each class (or a multiple PCA approach). 39 Each class in a SIMCA–PCA model has its own PCs, and several classes in this model may have completely different PC spaces. When an unknown sample is believed to be one of these classes, calculations between the spectrum of the unknown sample and each of these classes are processed, and this provides such values as Mahalanobis distance (MD) and spectral residual (SR) that are used to determine whether the sample is likely to be a member of any classes. 40
Materials and Methods
Cotton Fiber Materials
The F2 population fiber set, as designed in Figure 1, was originally created by crossing the im mutant with Gossypium hirsutum MD90ne to produce normal and WT mature fibers as previously described. 18 The F1 plants produced WT fiber phenotype with WT-hetero genotype, and they were self-pollinated to obtain F2 seeds. The F2 population consisted of 708 progeny plants including 218 WT phenotype with WT-homo genotype, 335 WT phenotype with WT-hetero genotype, and 155 im phenotype with im-homo genotype. 18 In this study, 92 F2 progeny plants from 708 progeny plants were available for FT-IR spectral collection, representing phenotypic and genotypic fibers of WT-homo (30 F2 plants), WT-hetero (42 F2 plants), and im-homo (20 F2 plants). All cotton fibers were collected by ginning the manually harvested seed cotton with a laboratory roller gin.
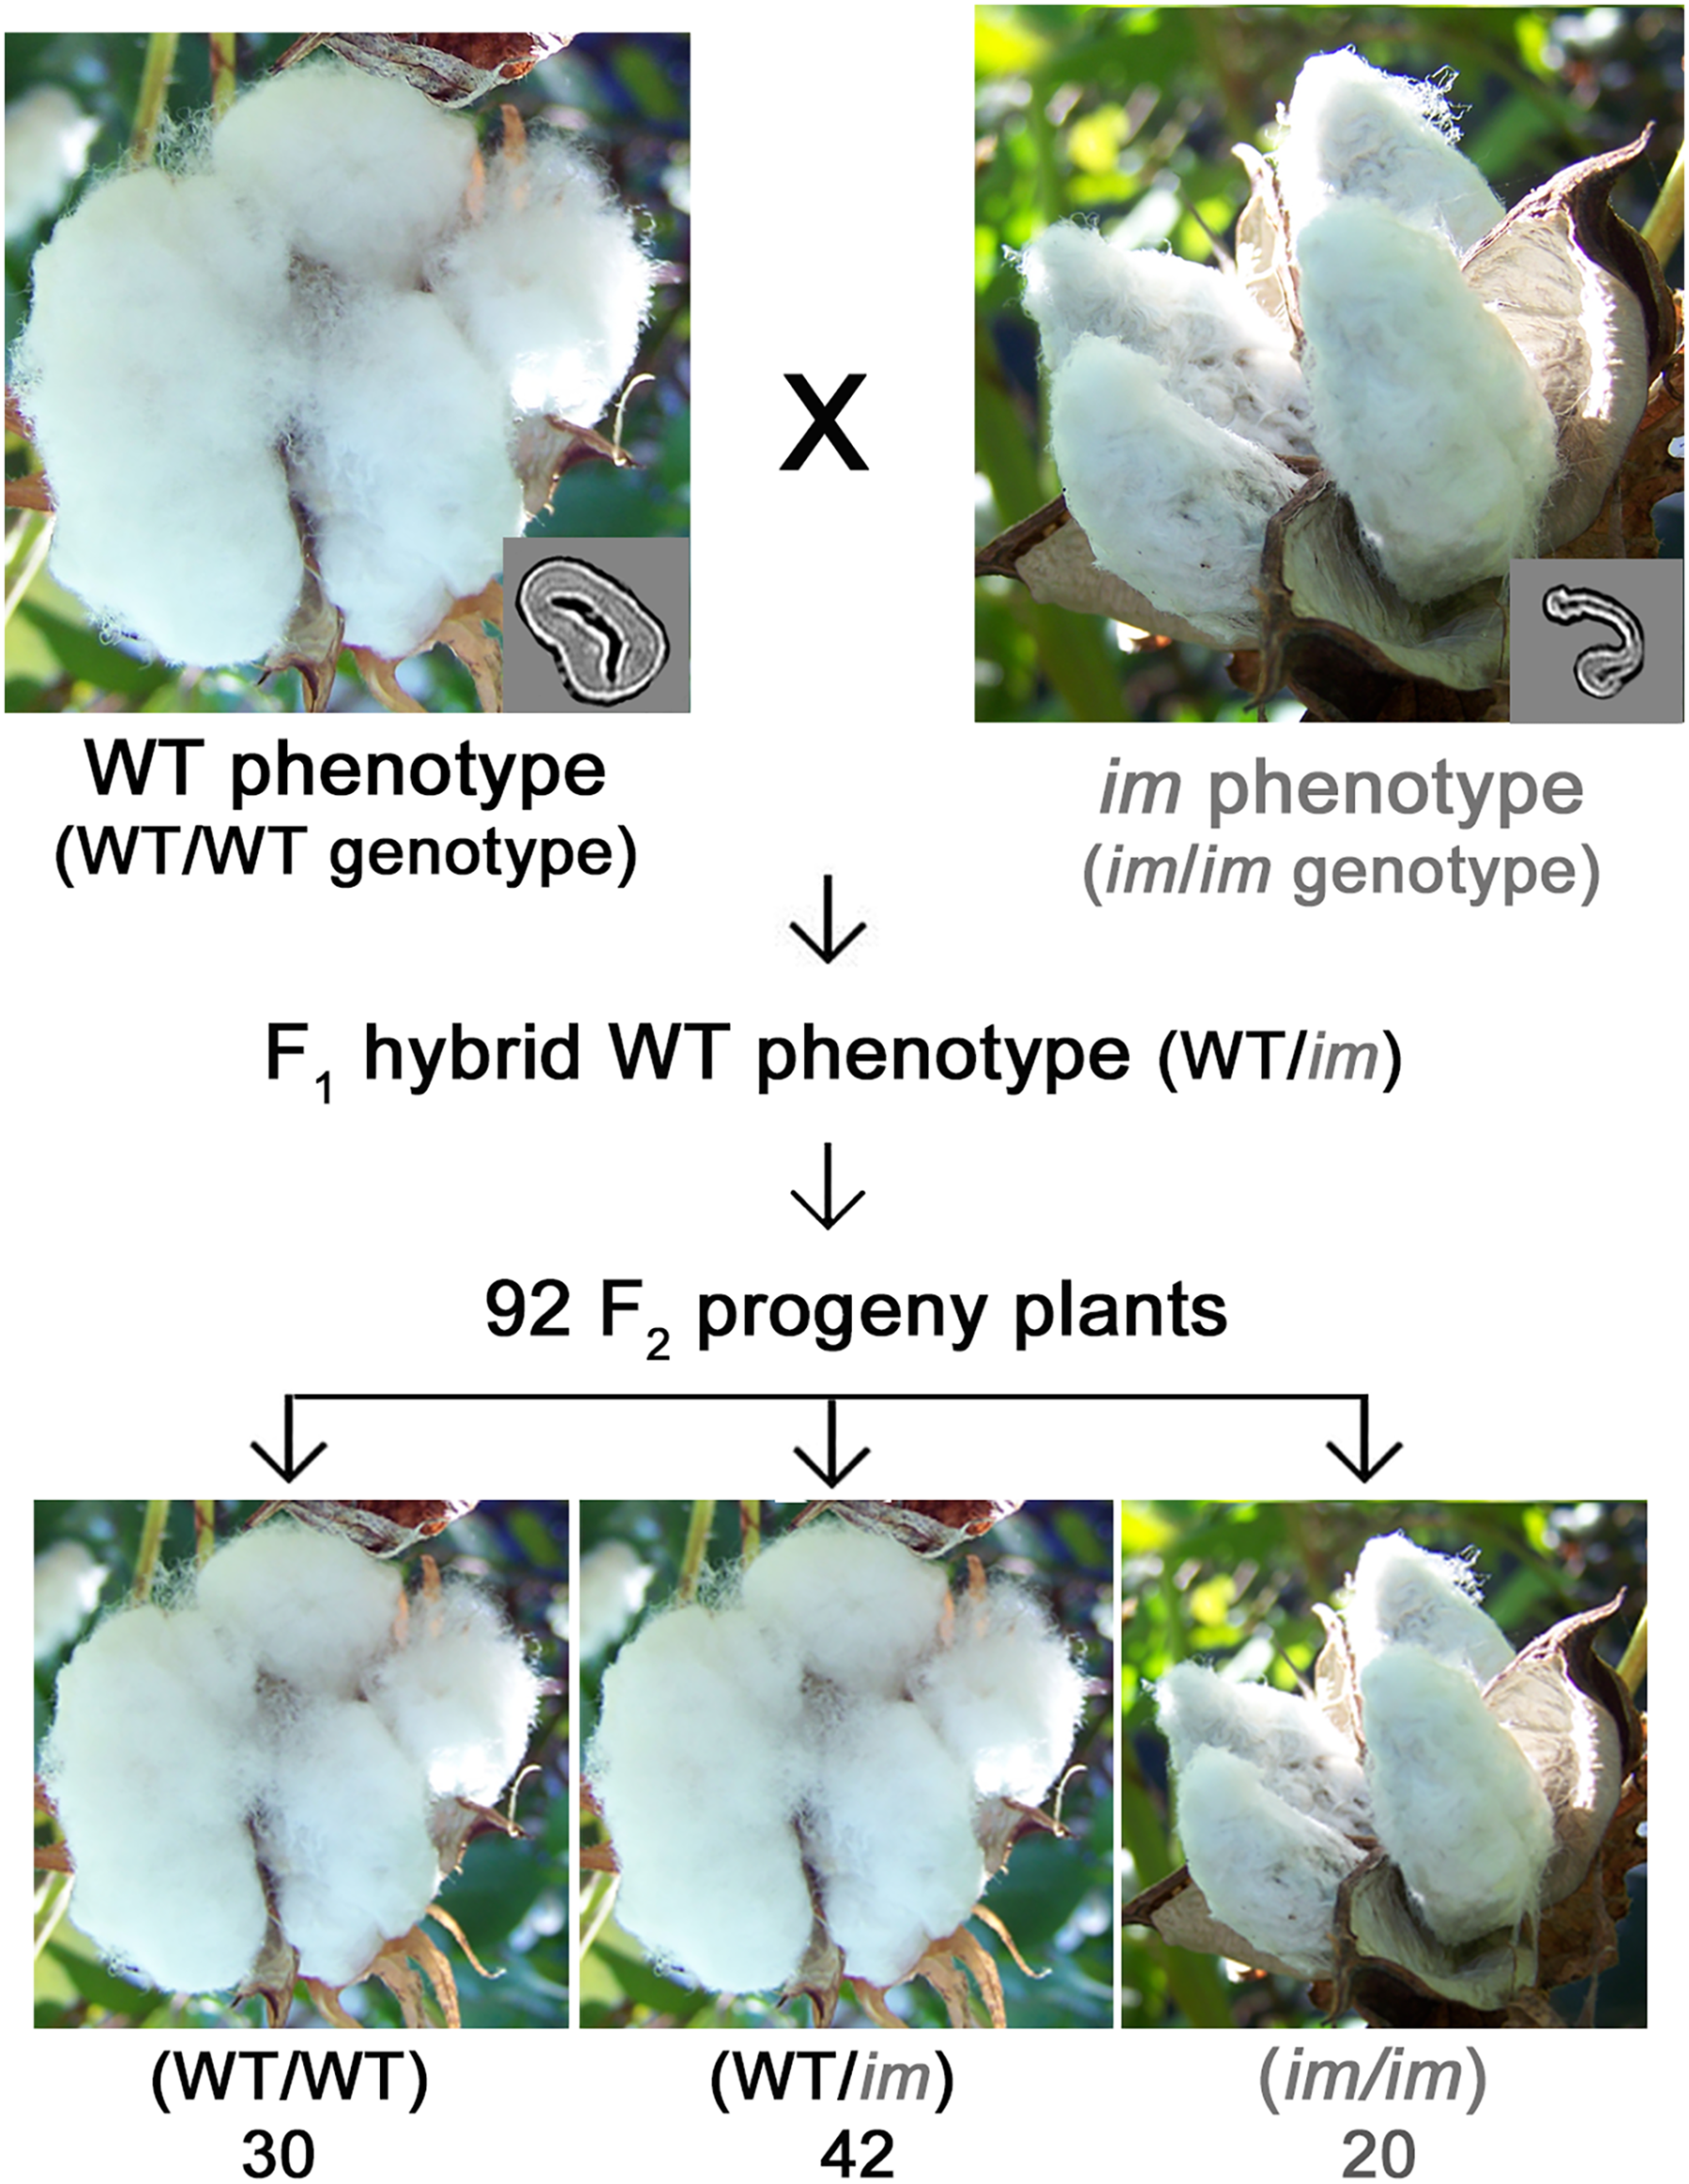
Construction of F2 progeny plants producing different fiber maturity phenotypes and genotypes. F2 progeny plants were derived from a cross between G. hirsutum MD90ne and im mutant. WT cultivars generate a phenotype of a fluffy boll with a mature and thick fiber wall (inset), whereas the im mutant produces a phenotype of a non-fluffy boll with an immature and thin fiber wall (inset). Three genotypes, including homozygosity for the WT fiber (WT-homo), heterozygosity for the WT fiber (WT-hetero), and homozygosity for the im type (im-homo), were determined by DNA marker analysis of individual plants.
Fiber Phenotype and Genotype Determination
Details of MIC and Lint percentage measurements from conventional fiber maturity phenotype analysis as well as MIR and CIIR indices from the ATR FT-IR method have been previously described. 18 Briefly, the Lint % of the segregating F2 population was measured by dividing the lint weight by the seed cotton weight prior to multiplying by 100, MIC values were determined by using HVI 1000 (Uster Technologies Inc.) or Fibronaire (Motion Control Inc.), and genotype data were acquired with two InDels and a Simple Sequence Repeat as provided in Table S1 (Supplemental Material) and Kim et al. 18
Attenuated Total Reflection Fourier Transform Infrared Spectroscopy (ATR FT-IR) Spectral Collection and Analysis
An FTS 3000MX FT-IR spectrometer (Varian Instruments) equipped with a ceramic source, KBr beamsplitter, deuterated triglycine sulfate detector, and an ATR attachment was used to perform all spectral measurements on a routine basis.18,24–28 The ATR sampling device with an optical window of 1.8 mm in diameter utilized a DuraSamplIR single-pass diamond-coated internal reflection accessory (Smiths Detection), and a consistent contact pressure was applied by way of a stainless-steel rod and an electronic load display. At least six measurements were performed by re-sampling different locations across each sample, in the region of 4000–600 cm–1 at 4 cm–1 resolution and 16 scans. One ATR FT-IR spectrum represents the total contribution of all chemical components from the primary cell wall to SCW to the lumen in a fiber sample, and its characteristic and intense IR absorptions originate from one or more main components in a sample. All spectra were recorded in absorbance units and no baseline correction was applied to these ATR spectra.
After importing the spectra into the GRAMS/AI program (version 9.1, Thermo Fisher Scientific), the mean spectrum was calculated for each sample and then was smoothed with a Savitzky–Golay function (polynomial = 2 and points = 11). The spectral set was exported into Microsoft Excel 2016 to assess CIIR and MIR values by using the previously proposed algorithm analysis.25,26 In addition, the spectra were normalized by dividing the intensity of individual bands in the 1800–600 cm–1 region with the average intensity in this 1800–600 cm–1 region, and subsequent PCA characterization and SIMCA–PCA discriminant models were developed with the use of GRAMS IQ application in GRAMS/AI program.
Development of SIMCA–PCA Classification Models
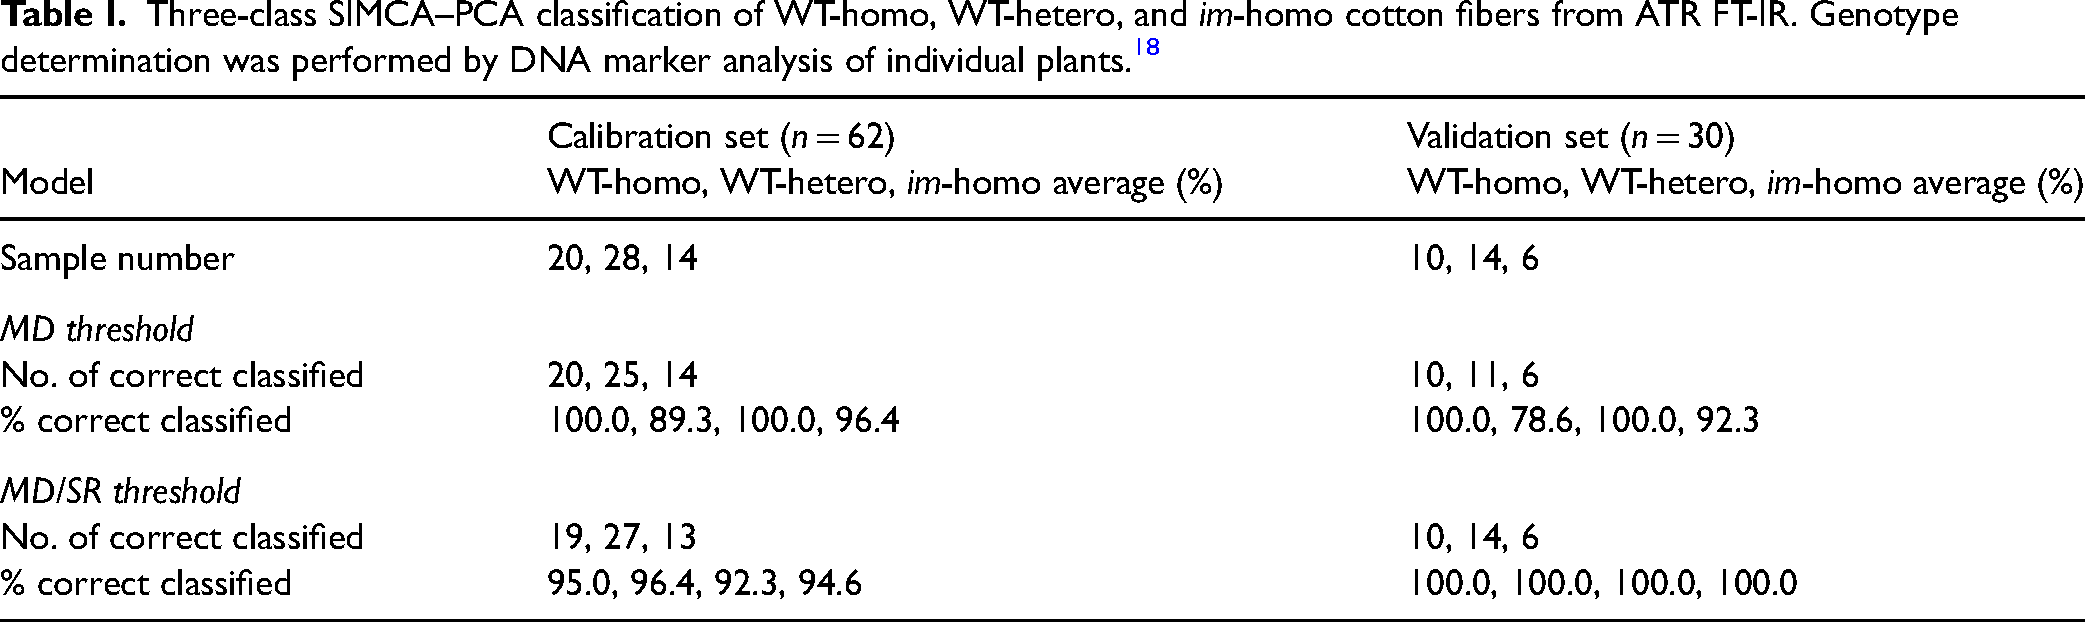
On the order of sample identification number among each of the three classes, every third sample was used for model validation while the remaining samples were used for SIMCA–PCA classification model development. This led to a set consisting of 62 calibration samples (20 WT-homo, 28 WT-hetero, and 14 im-homo) and 30 validation samples (10 WT-homo, 14 WT-hetero, and six im-homo) (Table I). The im fibers were included in three-class model development along with the two WT-fiber classes, because, as shown in Figure 1, the F2 population consisted of some im fibers that were unknown before any fiber property measurements.
Three-class SIMCA–PCA classification of WT-homo, WT-hetero, and im-homo cotton fibers from ATR FT-IR. Genotype determination was performed by DNA marker analysis of individual plants. 18
All spectra were imported into the GRAMS IQ application in Grams/AI for discriminant model development. Classification models were established using three classes (representing WT-homo, WT-hetero, and im-homo class) with different spectral pretreatments (e.g., mean centering (MC), multiplicative scatter correction (MSC), and the first derivatives) and also with leaving one out cross-validation (LOOCV) method in the 1800–615 cm–1 region for their optimal identification. For each of the WT-homo, WT-hetero, and im-homo classes, the optimal number of three, five, and two factors suggested by the software package was utilized, respectively. By applying the model to validation and calibration samples, the spectrum of each sample was compared against three classes, and then both MD and SR values were calculated. A sample was classified as one of three classes being modeled when this sample met the criteria of either the smallest MD or SR value under two scenarios: (i) The lowest MD rule, if its MD difference between the second smallest MD value and the smallest MD value is >0.50, and (ii) the lowest SR rule, if its MD difference between the second smallest MD value and the smallest MD value is <0.50.
Statistical Analysis
Statistical analyses and construction of graphs were performed using frequency distribution, column statistics, analysis of variance, and paired/multiple t-tests between any pair of three-class fibers for MIC, Lint %, MIR, CIIR, PC1 or PC3 index (Table S2, Supplemental Material) Using Prism version 7 software (Graph-Pad Software, Inc.). The probability (p)-value cutoff for significance was 0.05.
Results and Discussion
Conventional Fiber Phenotypes of the Segregating F2 Plants Composed of Three Different Genotype Fibers
A combination of MIC and Lint % in Figure 2a showed a reasonable pattern of increasing fiber MIC with Lint % from the im-homo fibers to the WT-home and WT-hetero fibers. Of the 20 F2 progeny plants with the im-homo genotype, 16 plants produced immature fiber phenotypes that were measured to be MIC > 2.0 by the HVI instrument whereas four plants generated extremely immature fiber phenotypes that could not be detected by the HVI (MIC < 2.0) as given in Table S1 (Supplemental Material). When the undetectable MIC values of these four cotton fibers were assumed to be 2.0, MIC values of the 20 im-homo fibers (2.79 ± 0.54, mean ± standard deviation (SD)) were significantly (p < 0.0001) lower than those of the 30 WT-homo (4.95 ± 0.25) or the 42 WT-hetero plants (4.83 ± 0.30) in Figure 2b. In contrast, there was no significant (p = 0.07) difference in MIC values between the WT-homo and WT-hetero fibers.
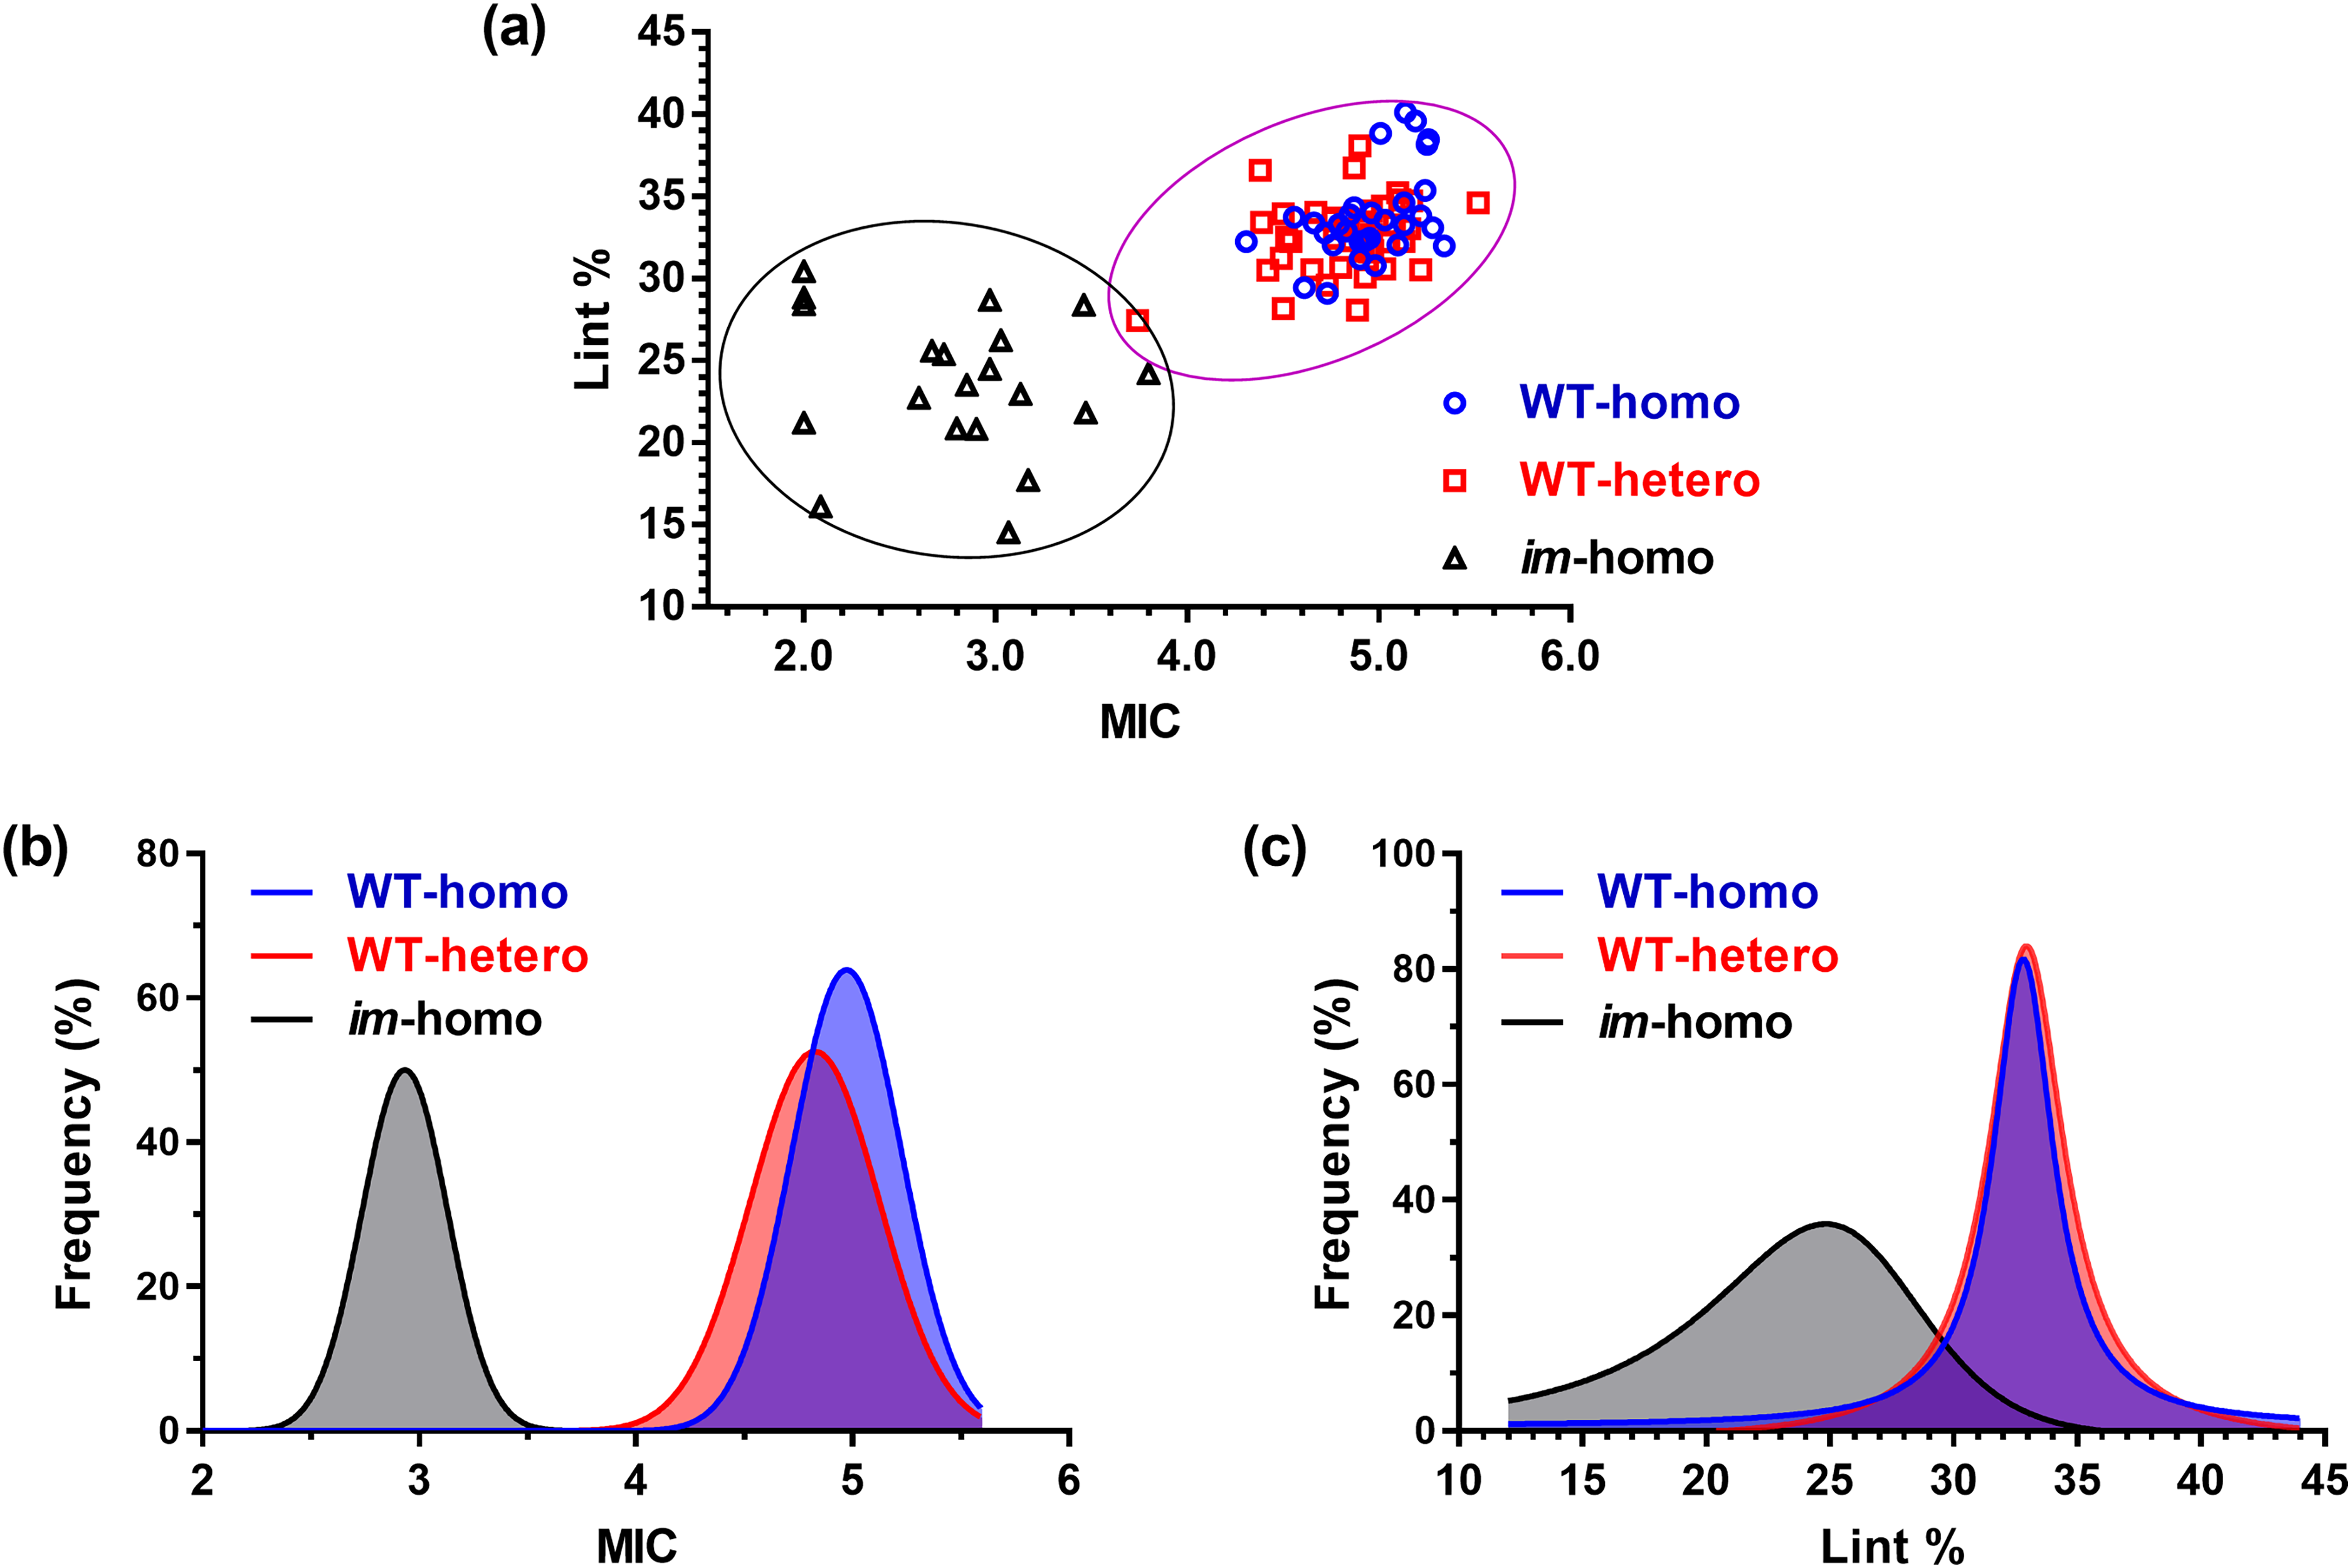
(a) Lint percentage (Lint %) against MIC classification, (b) MIC frequency, and (c) Lint % frequency of WT-homo fibers, WT-hetero fibers, and im-homo fibers.
As given in Figure 2c, the average Lint % of the im-homo fibers (23.6 ± 4.3%) was lower than the WT-homo fibers (33.8 ± 2.8%) or the WT-hetero fibers (32.6 ± 2.2%). Although five of 20 im-homo fibers and 13 of the combined 72 WT fibers had an overlapping Lint % range of 27.0–31.0%, there were significant differences between the im-homo fibers and the two WT fibers (p < 0.0001) and also between two WT fibers statistically (p = 0.048 and Table S2, Supplemental Material). Hence, the use of either MIC or Lint % or their combination produced a significant and visual separation of the im-homo fibers from two WT fibers induced by fiber maturity difference but cannot distinguish the WT-hetero genotype fibers from the WT-homo genotype fibers visually and significantly because of their identical phenotype (Figure 2c; Table S2, Supplemental Material).
ATR FT-IR Spectral Characteristics of Fiber Phenotypes with Three Different Genotype Fibers
Figure 3 compared the ATR FT-IR spectral average in the 1800–600 cm–1 region among three-class fibers. Each mean spectrum was the average of all samples in a respective fiber class. Although Figure 3 revealed that the im-homo fiber had identical IR absorption wavenumbers to the WT-homo and WT-hetero fibers, there were some IR intensity variations induced by fiber phenotypes and genotypes. For example, the spectrum of im-homo fiber exhibited relatively greater IR intensities (1175–975 cm–1) and also weaker intensities (975–725 cm–1) than those of two WT fibers (WT-homo and WT-hetero). Meanwhile, there existed indistinctive spectral intensity differences in this spectral region between the WT-homo and WT-hetero fibers. This observation is consistent with a preceding investigation 27 that reported apparent distinctions in the intensities of the bands 1150 through 750 cm–1 between the developed TM-1 and im fibers. Previous studies18,21,22,28 have assigned a broad band centered at 1620 cm–1 to the OH bending mode of adsorbed water, a band around 1450 cm–1 to a methylene deformation, several bands in the 1400–1300 cm–1 region to R–O–H in-plane bending modes, at least five intense bands in the 1200–1000 cm–1 region to the stretching modes of C–O and C–C vibrations, a strong band at 895 cm–1 to the β-glycosidic linkage in cellulose, and weak bands from 800 to 700 cm–1 to crystal forms of native cellulose in cotton fibers. Notably, the bands below 1500 cm–1 are populated with many unassignable overtone and combination modes, some of which could be quite intense. In addition, there were intense absorptions due to the hydrogen-bonded O–H stretching vibrations at 3340 and 3280 cm−1, the standard methylene antisymmetric and symmetric C–H stretching modes at 2910 and 2845 cm−1, and a likely methine stretching at 2910 cm–1 (Figure 3, inset).
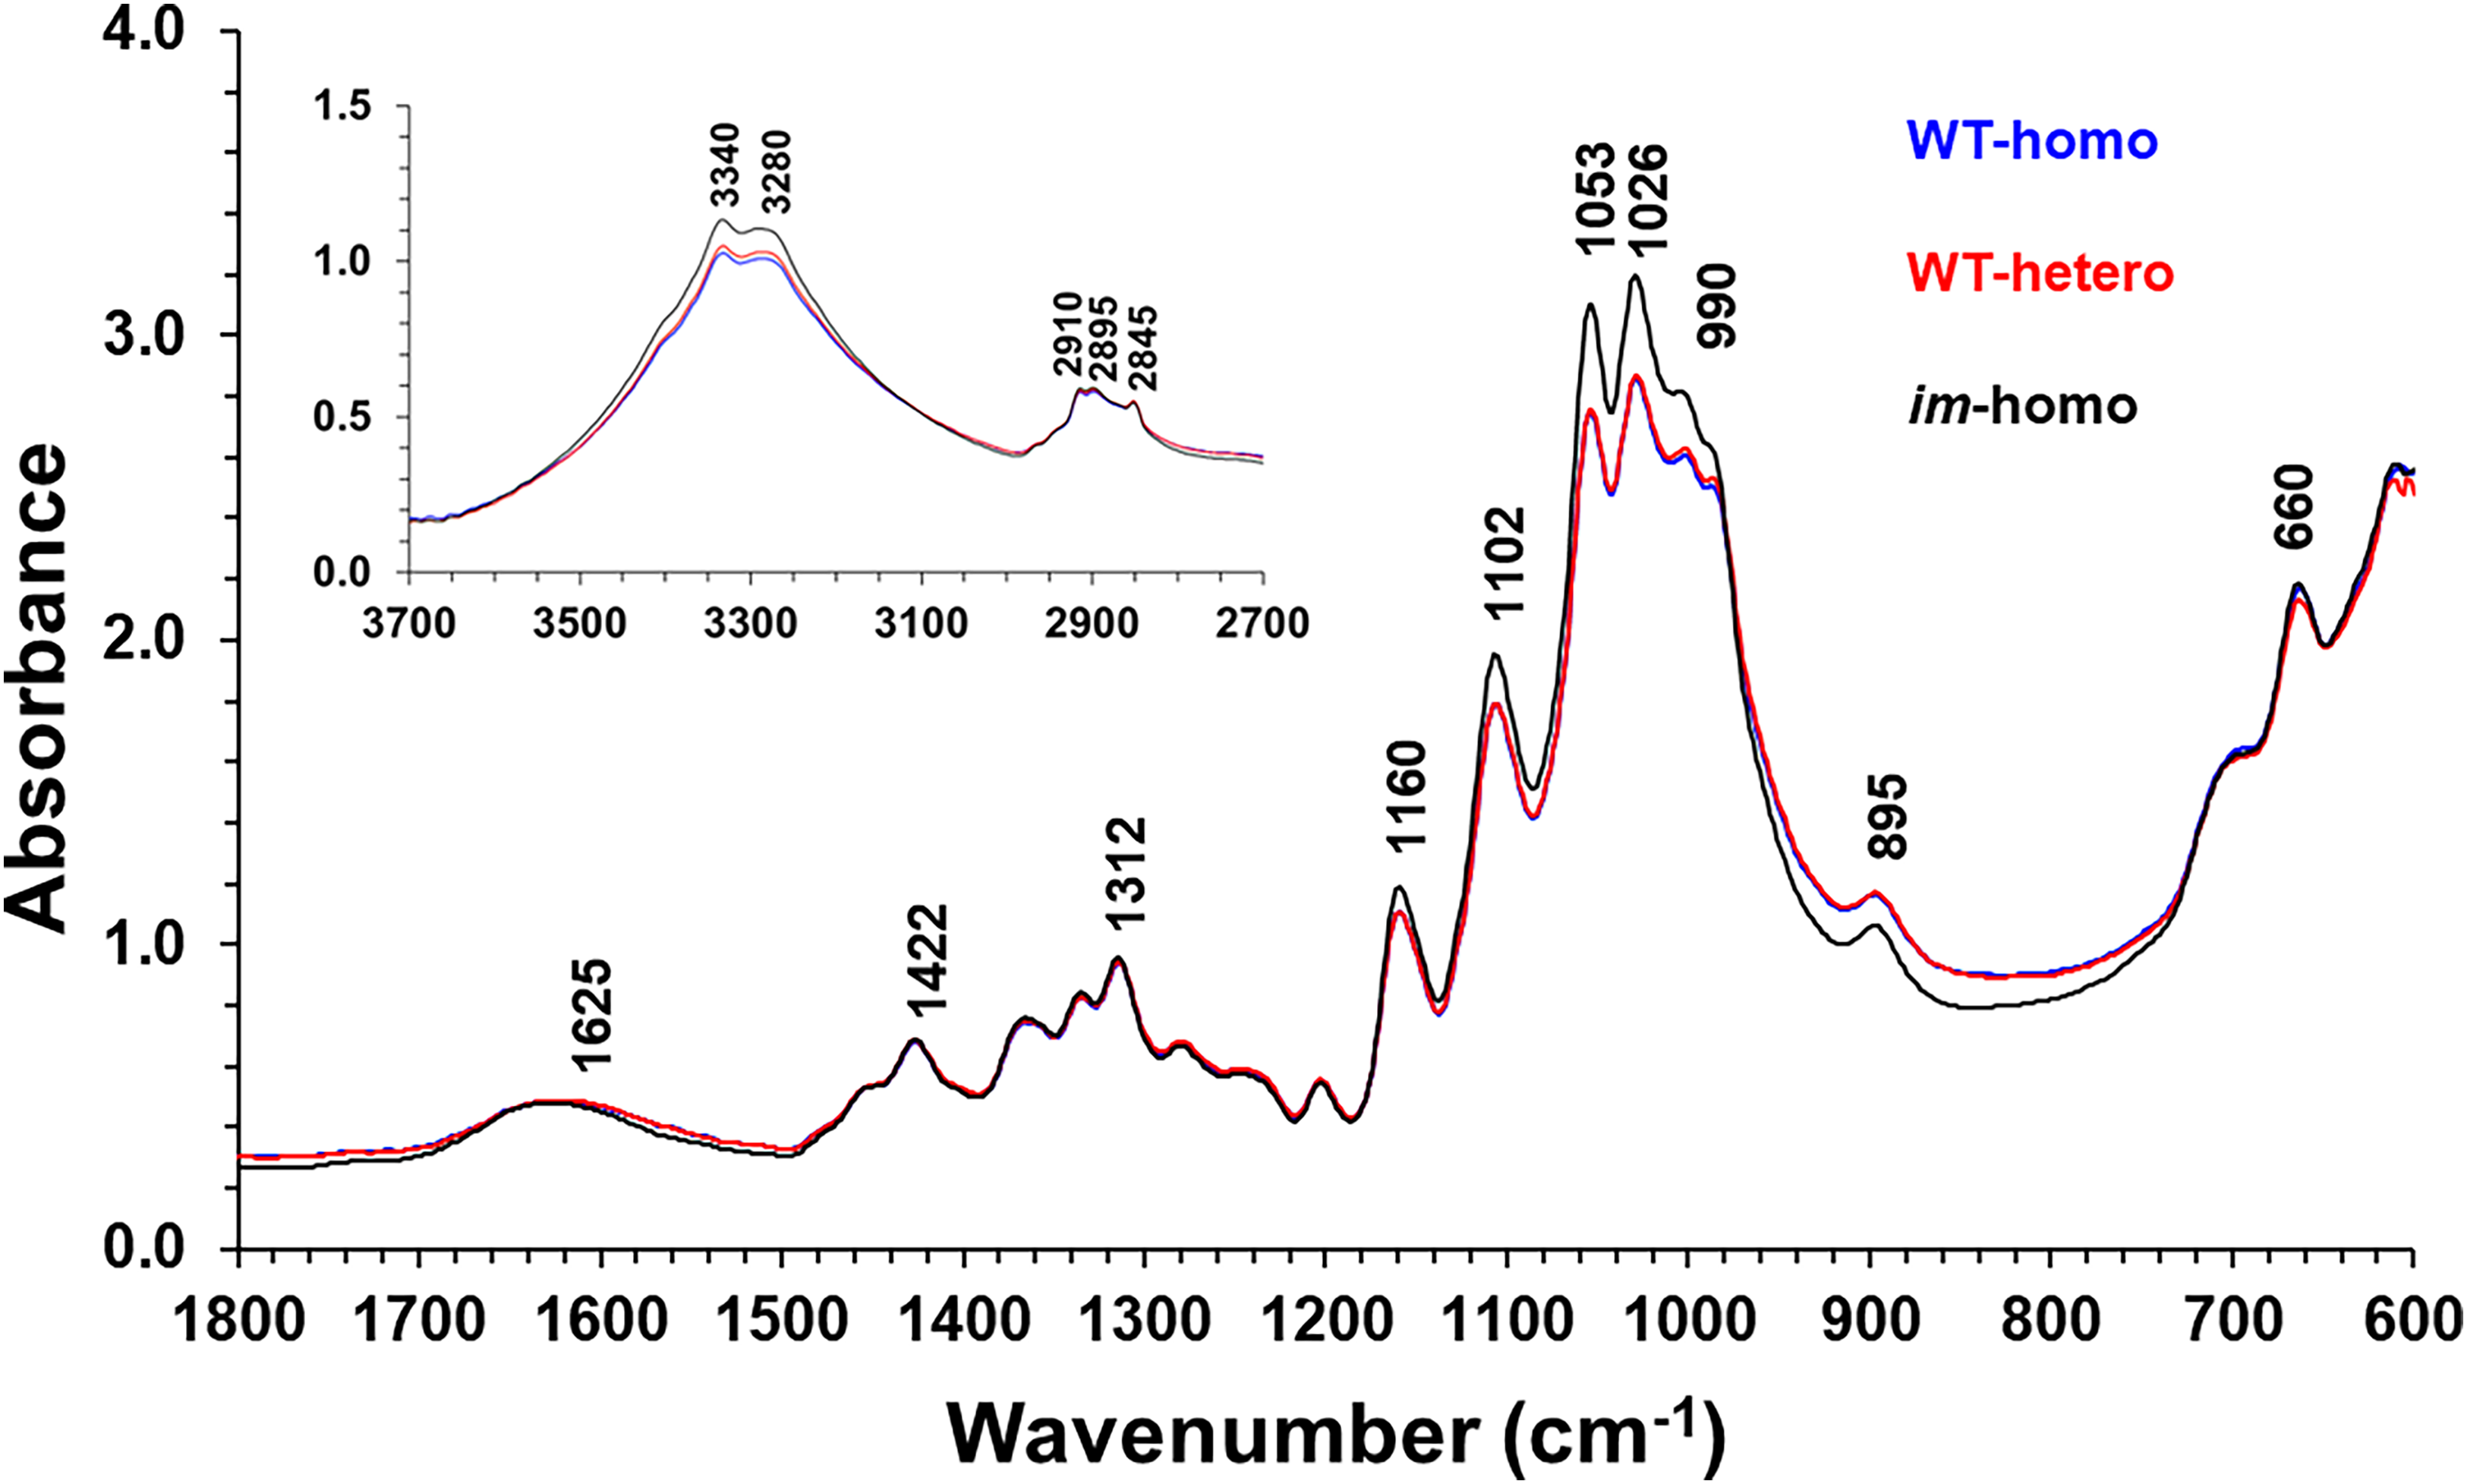
Representative of normalized ATR FT-IR spectral average for three-class fibers, WT-homo, WT-hetero, and im-homo.
Difference spectra in Figure 4 showed more subtle distinctions of spectral intensities among three-class fibers. It clearly indicated a nearly equal number of relatively large negative and positive intensity peaks in the 1150–750 cm–1 region, mainly assignable to the C–O stretching modes and crystal forms in fiber cellulose. In this region, the difference spectrum of im-homo fiber differed from that of either WT-homo fiber or WT-hetero, whereas the difference spectrum of WT-homo fiber resembled that of WT-hetero fiber. It is these ATR FT-IR spectral differences that contributed to separate im-homo fibers from two WT-type fibers from FT-IR measurement. Notably in the low-wavenumber wing (<700 cm–1), there was a relatively great intensity difference at 665 cm–1 between WT-hetero fibers and the other two (im-homo and WT-homo), and such a distinction might facilitate the classification of WT-hetero fibers from im-homo or WT-homo fibers. The 665 cm–1 peak may be from the OH out-of-plane bending mode of adsorbed water, and a previous study 21 reported a strong linear relationship (R2 = 0.94) between cotton fiber cellulose content and the intensity at 667 cm−1 (close to 665 cm–1 in this work). The exact chemical origins for the difference are unknown because FT-IR spectra cannot identify one SCW component, especially if its minor presence, from other complicated SCW components easily. Future research on wet chemical analysis and other instrumental characterization of SCW compositions is needed to gain more understanding of differences in SCW constitutes of crossed fibers and to further advance the FT-IR utilization.
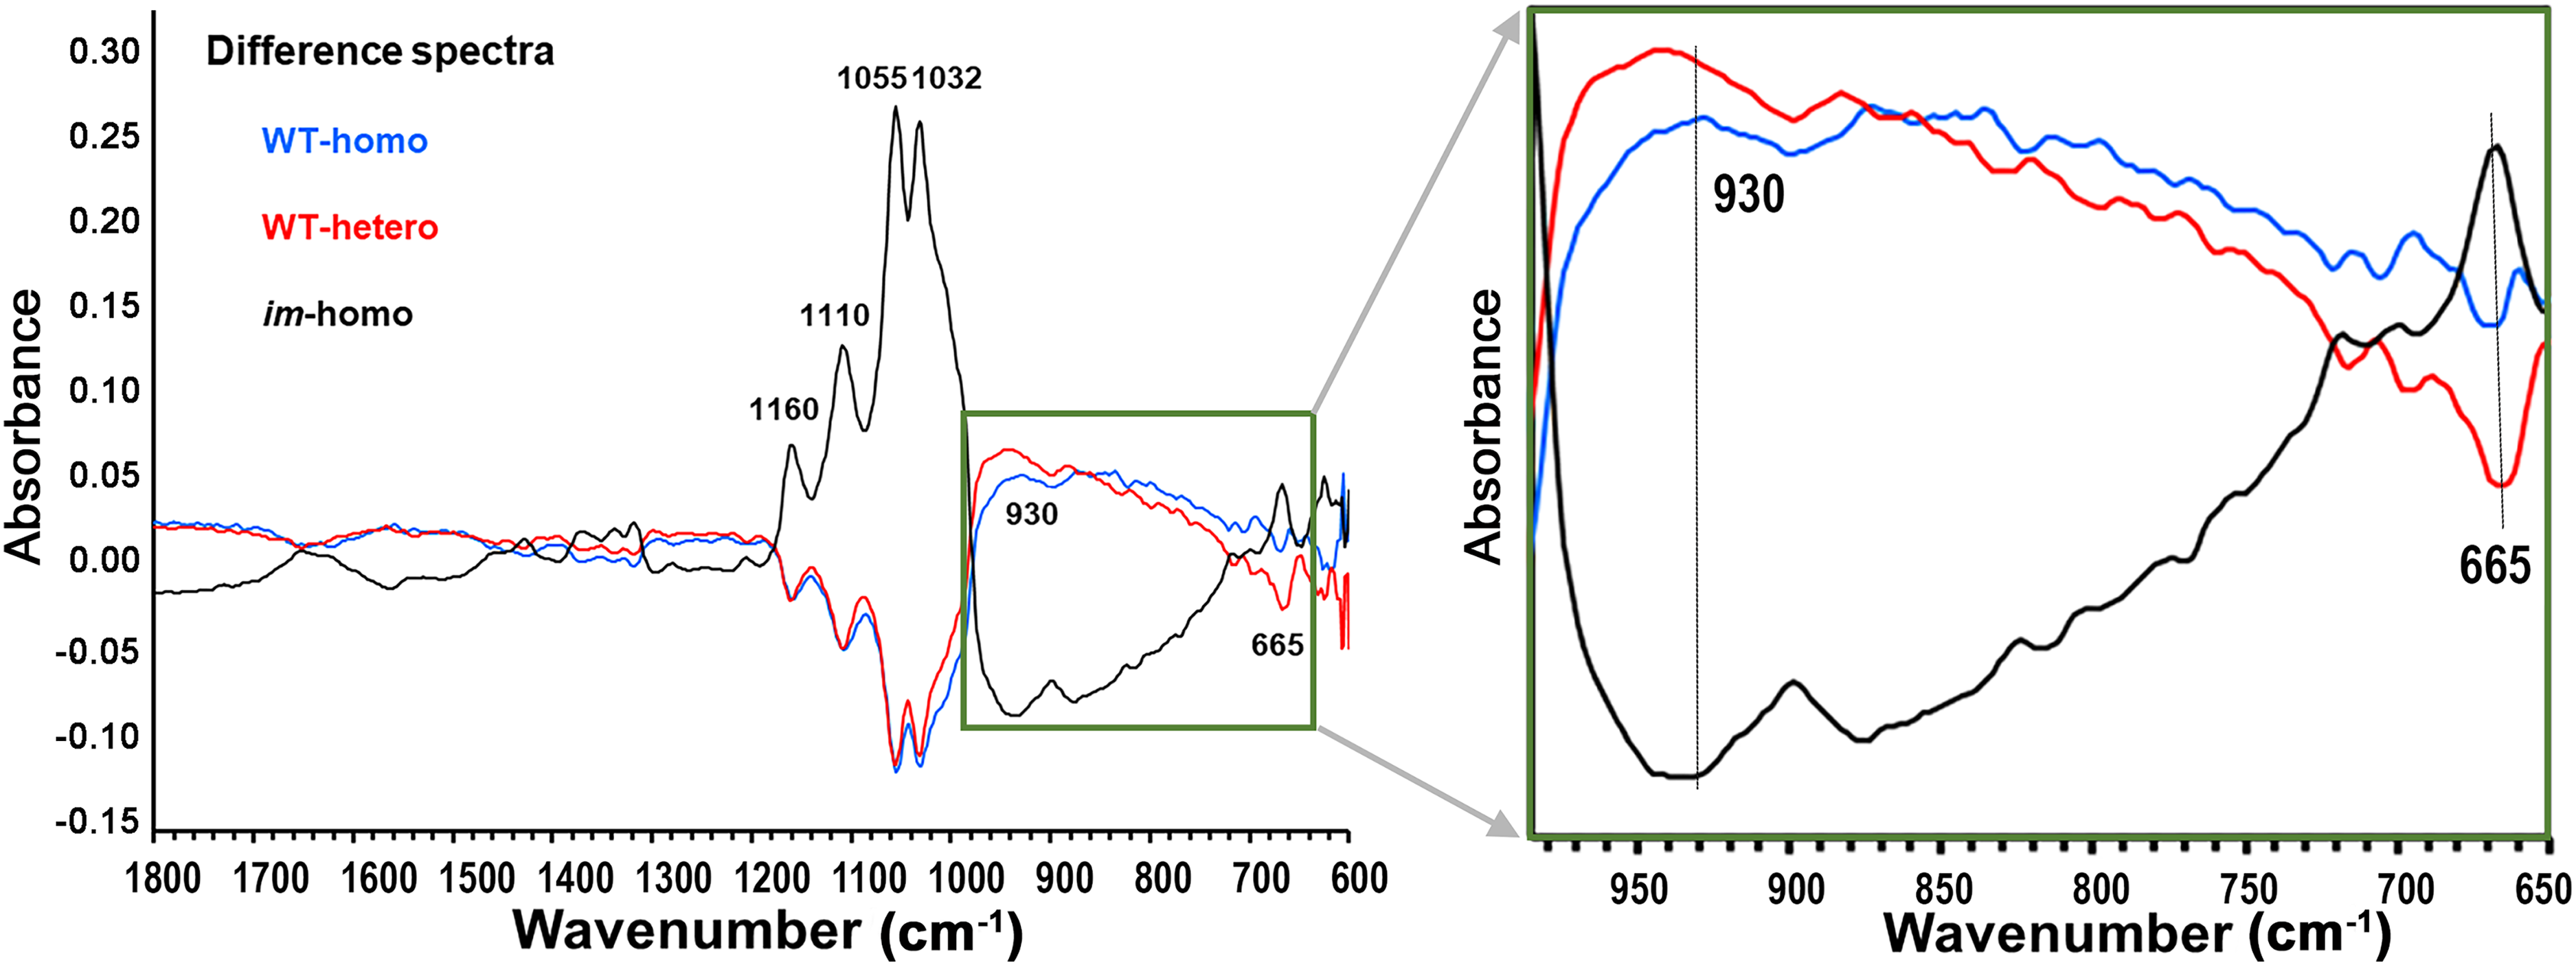
Difference ATR FT-IR spectra of an average spectrum of WT-homo fibers, or of WT-hetero fibers, or of im-homo fibers, minus that of all combined fibers (WT-homo + WT-hetero + im-homo). The original average spectra for three-class fiber sets are in Figure 3. To display the details of spectral differences, the boxed area of the original graph is zoomed in.
Simple Algorithmic and PCA of ATR FT-IR Spectra for Classifying Fiber Phenotypes with Three Different Genotype Fibers
A plot relating CIIR to MIR in Figure 5a indicated an increase in fiber CIIR and with MIR from the im-homo fibers to all WT fibers, as expected. Average MIR values in Figure 5b varied from 0.65 ± 0.09 for the im-homo fibers to 0.83 ± 0.04 for the WT-homo fibers and to 0.84 ± 0.04 for the WT-hetero fibers, along with average CIIR value in Figure 5c increasing from 68.7 ± 8.0% for the im-homo fibers to 85.2 ± 7.8% for the WT-homo fibers and to 85.7 ± 7.8% for the WT-hetero fibers. There were significant differences in MIR value (p-value < 0.001) or CIIR values (p-value < 0.001) between the im-homo fibers and two WT fibers, whereas there were insignificant differences in MIR value (p-value = 0.39) or CIIR values (p-value = 0.79) between two WT fibers (Table S2, Supplemental Material).
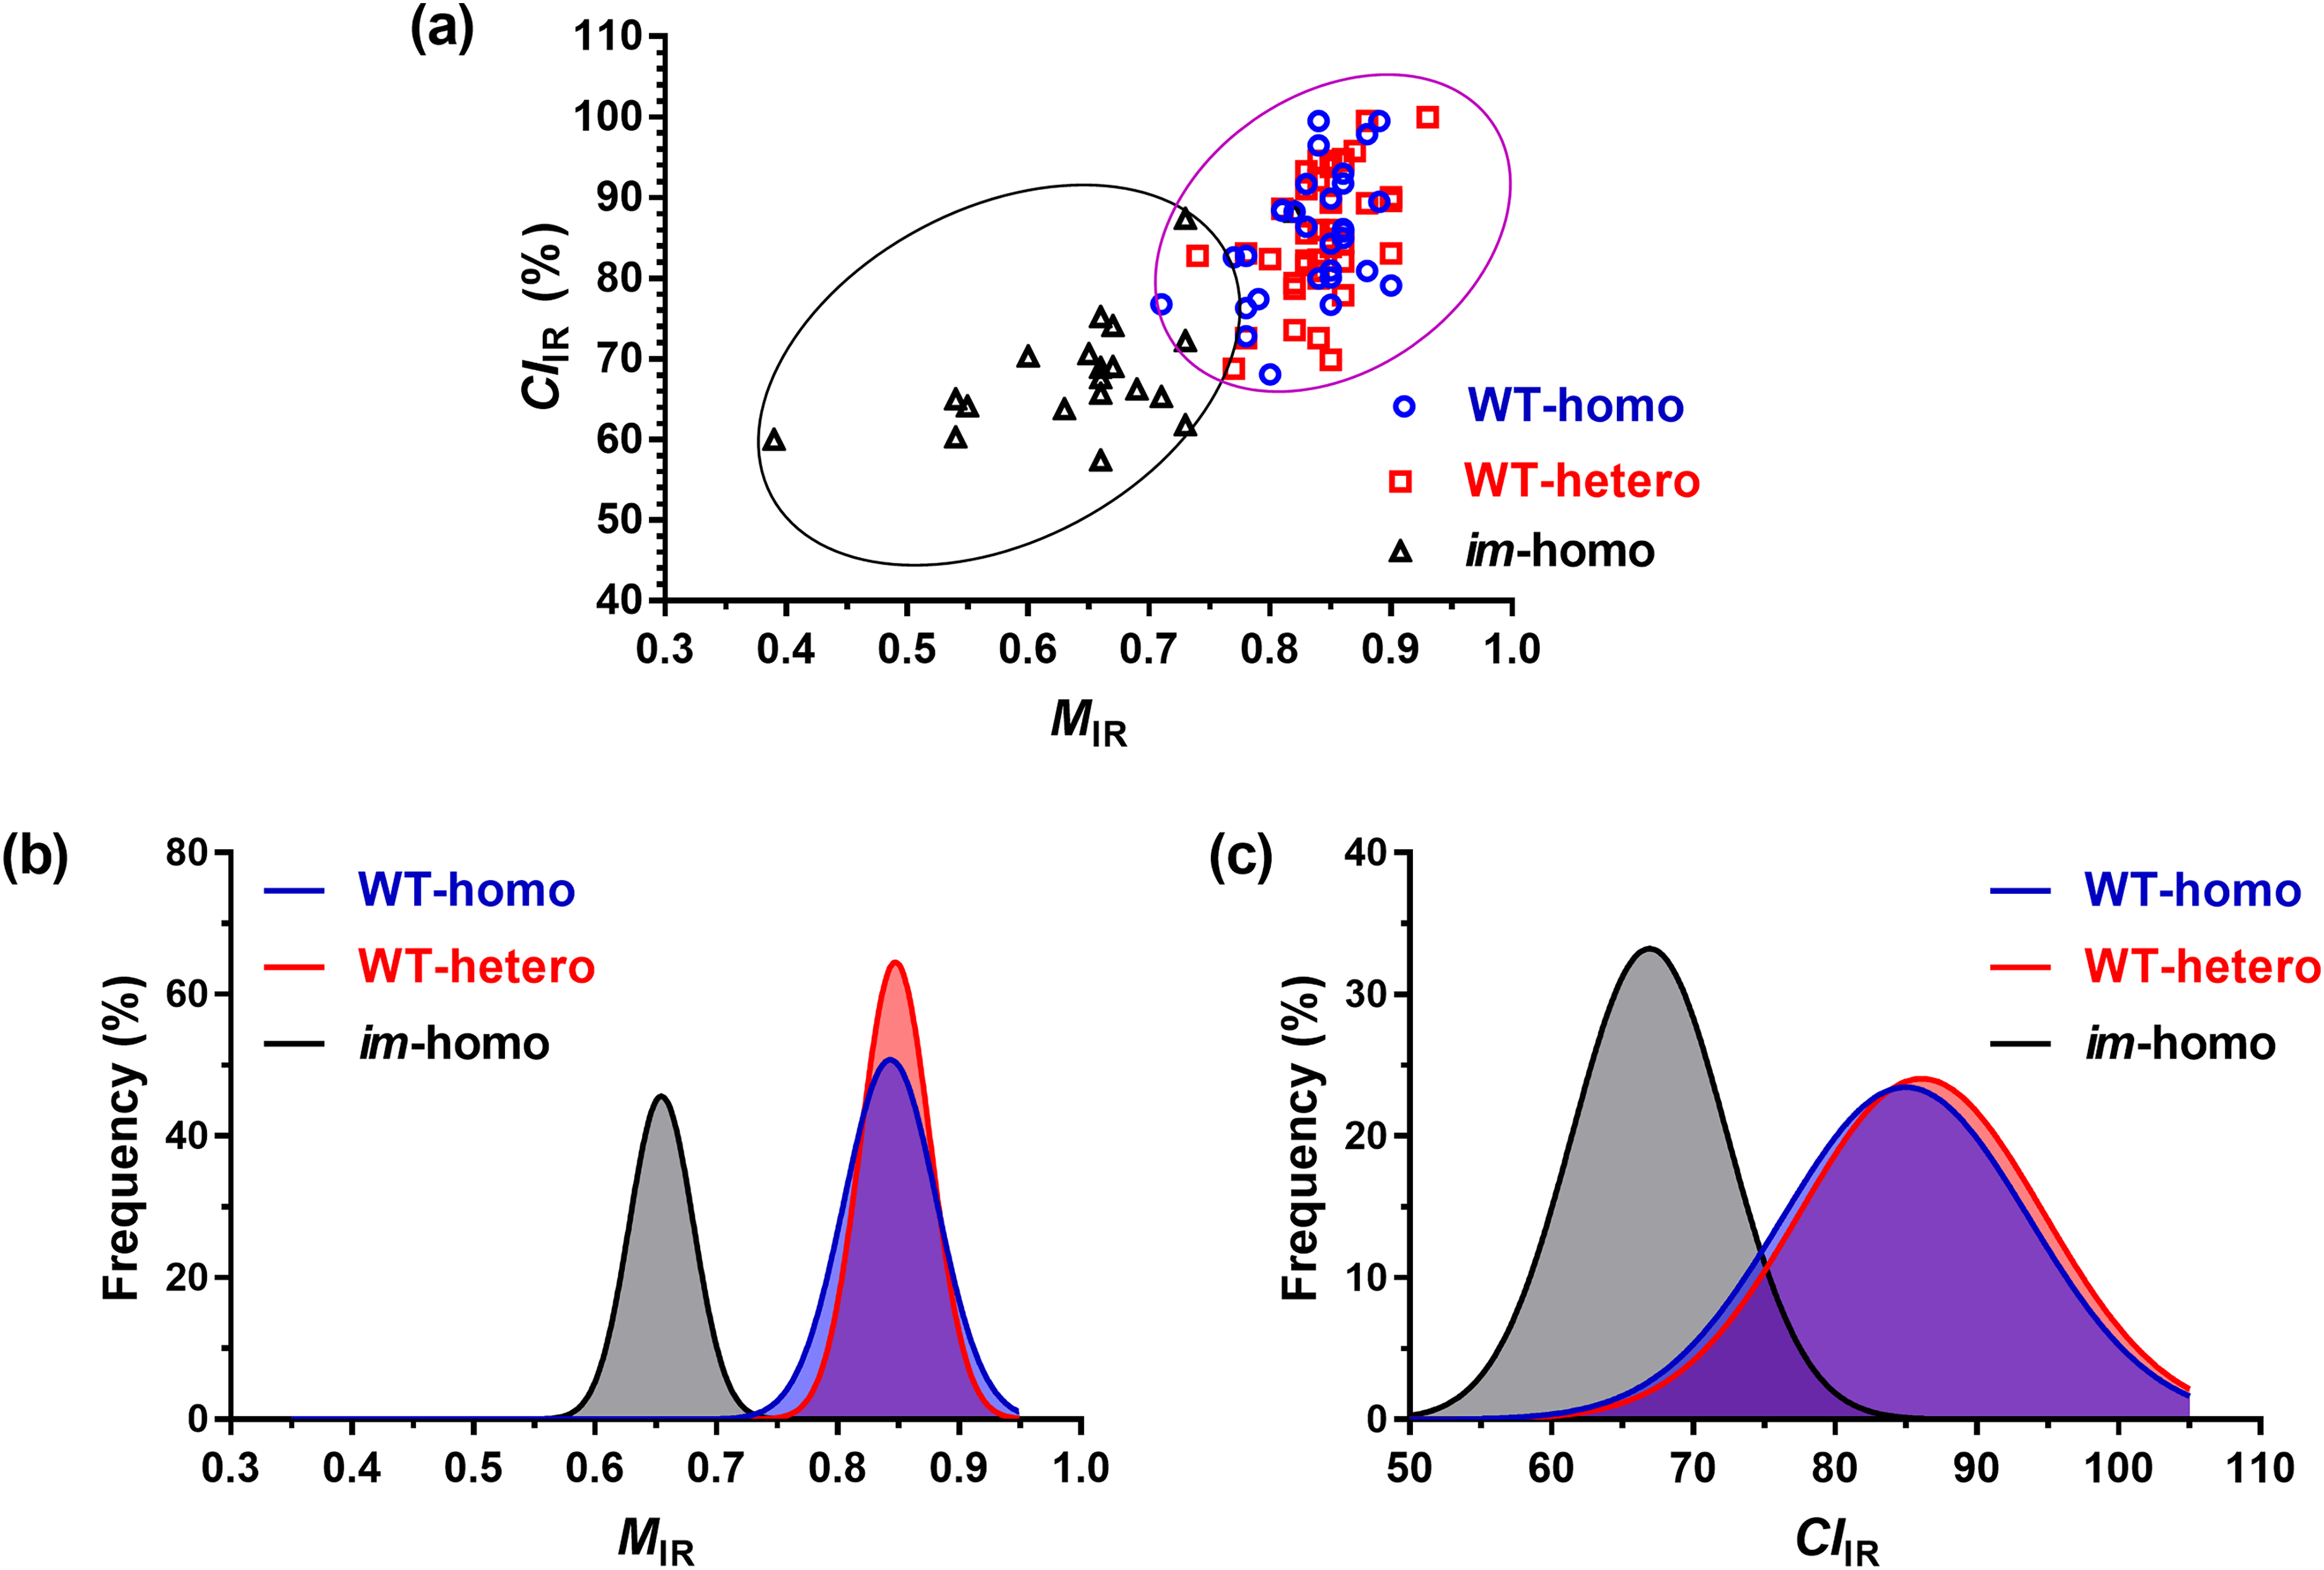
(a) Infrared crystallinity (CIIR) against MIR classification, (b) MIR frequency, and (c) CIIR frequency from ATR FT-IR spectra of WT-homo fibers, WT-hetero fibers, and im-homo fibers.
Differing from simple algorithmic analysis for assessing MIR and CIIR index from fewer variables (or narrow spectral regions), the PCA approach utilized a wide spectral region (615 datapoints or variables over the 1800–615 cm–1 IR region). To interpret the spectral similarity or dissimilarity among three genotype fibers, all 92 spectra were subjected to PCA characterization with MC plus the first Savitzky–Golay derivative spectral pretreatments and also with the LOOCV method. The first 10 PCs accounted for 94.6% of the total spectral variation, with the first PC (PC1) explaining the most variation (62.0%), the second PC (PC2) revealing the second most variation (12.0%), the third PC (PC3) accounting for the third most variation (5.2%), and the fourth PC (PC4) representing the fourth most variation (4.0%). As shown in Figure 6, the plot of the PC3 score against the PC1 score provided better visualization of sample separation than other PC combinations for three types of fibers. The PC1 score tended to increase from im-homo fibers to two WT fibers (p-value < 0.001), which is anticipated since the PC1 score was associated with the degree of cotton fiber SCW development,21–23,27–29 and corresponding PC1 loadings in Figure 6b revealed a great loading variation mainly in the 1100–950 cm–1 region assignable to the C–O stretching modes in fiber cellulose. However, the PC1 score could not differentiate two WT fibers (p-value = 0.28). The PC3 score, with complementary information to the PC1 score, did not show a clear pattern of differences between any pair of three fiber classes (p-value > 0.11). The PC3 loadings in Figure 6b showed great variation at the region only below 700 cm–1. Therefore, the two WT fibers could not be separated clearly by respective genotype categories with the use of a sole PC score, echoing the difficulty of further screening the WT-homo fibers from the WT-hetero fibers by the methods in Figure 2 and 5 (Table S2, Supplemental Material).
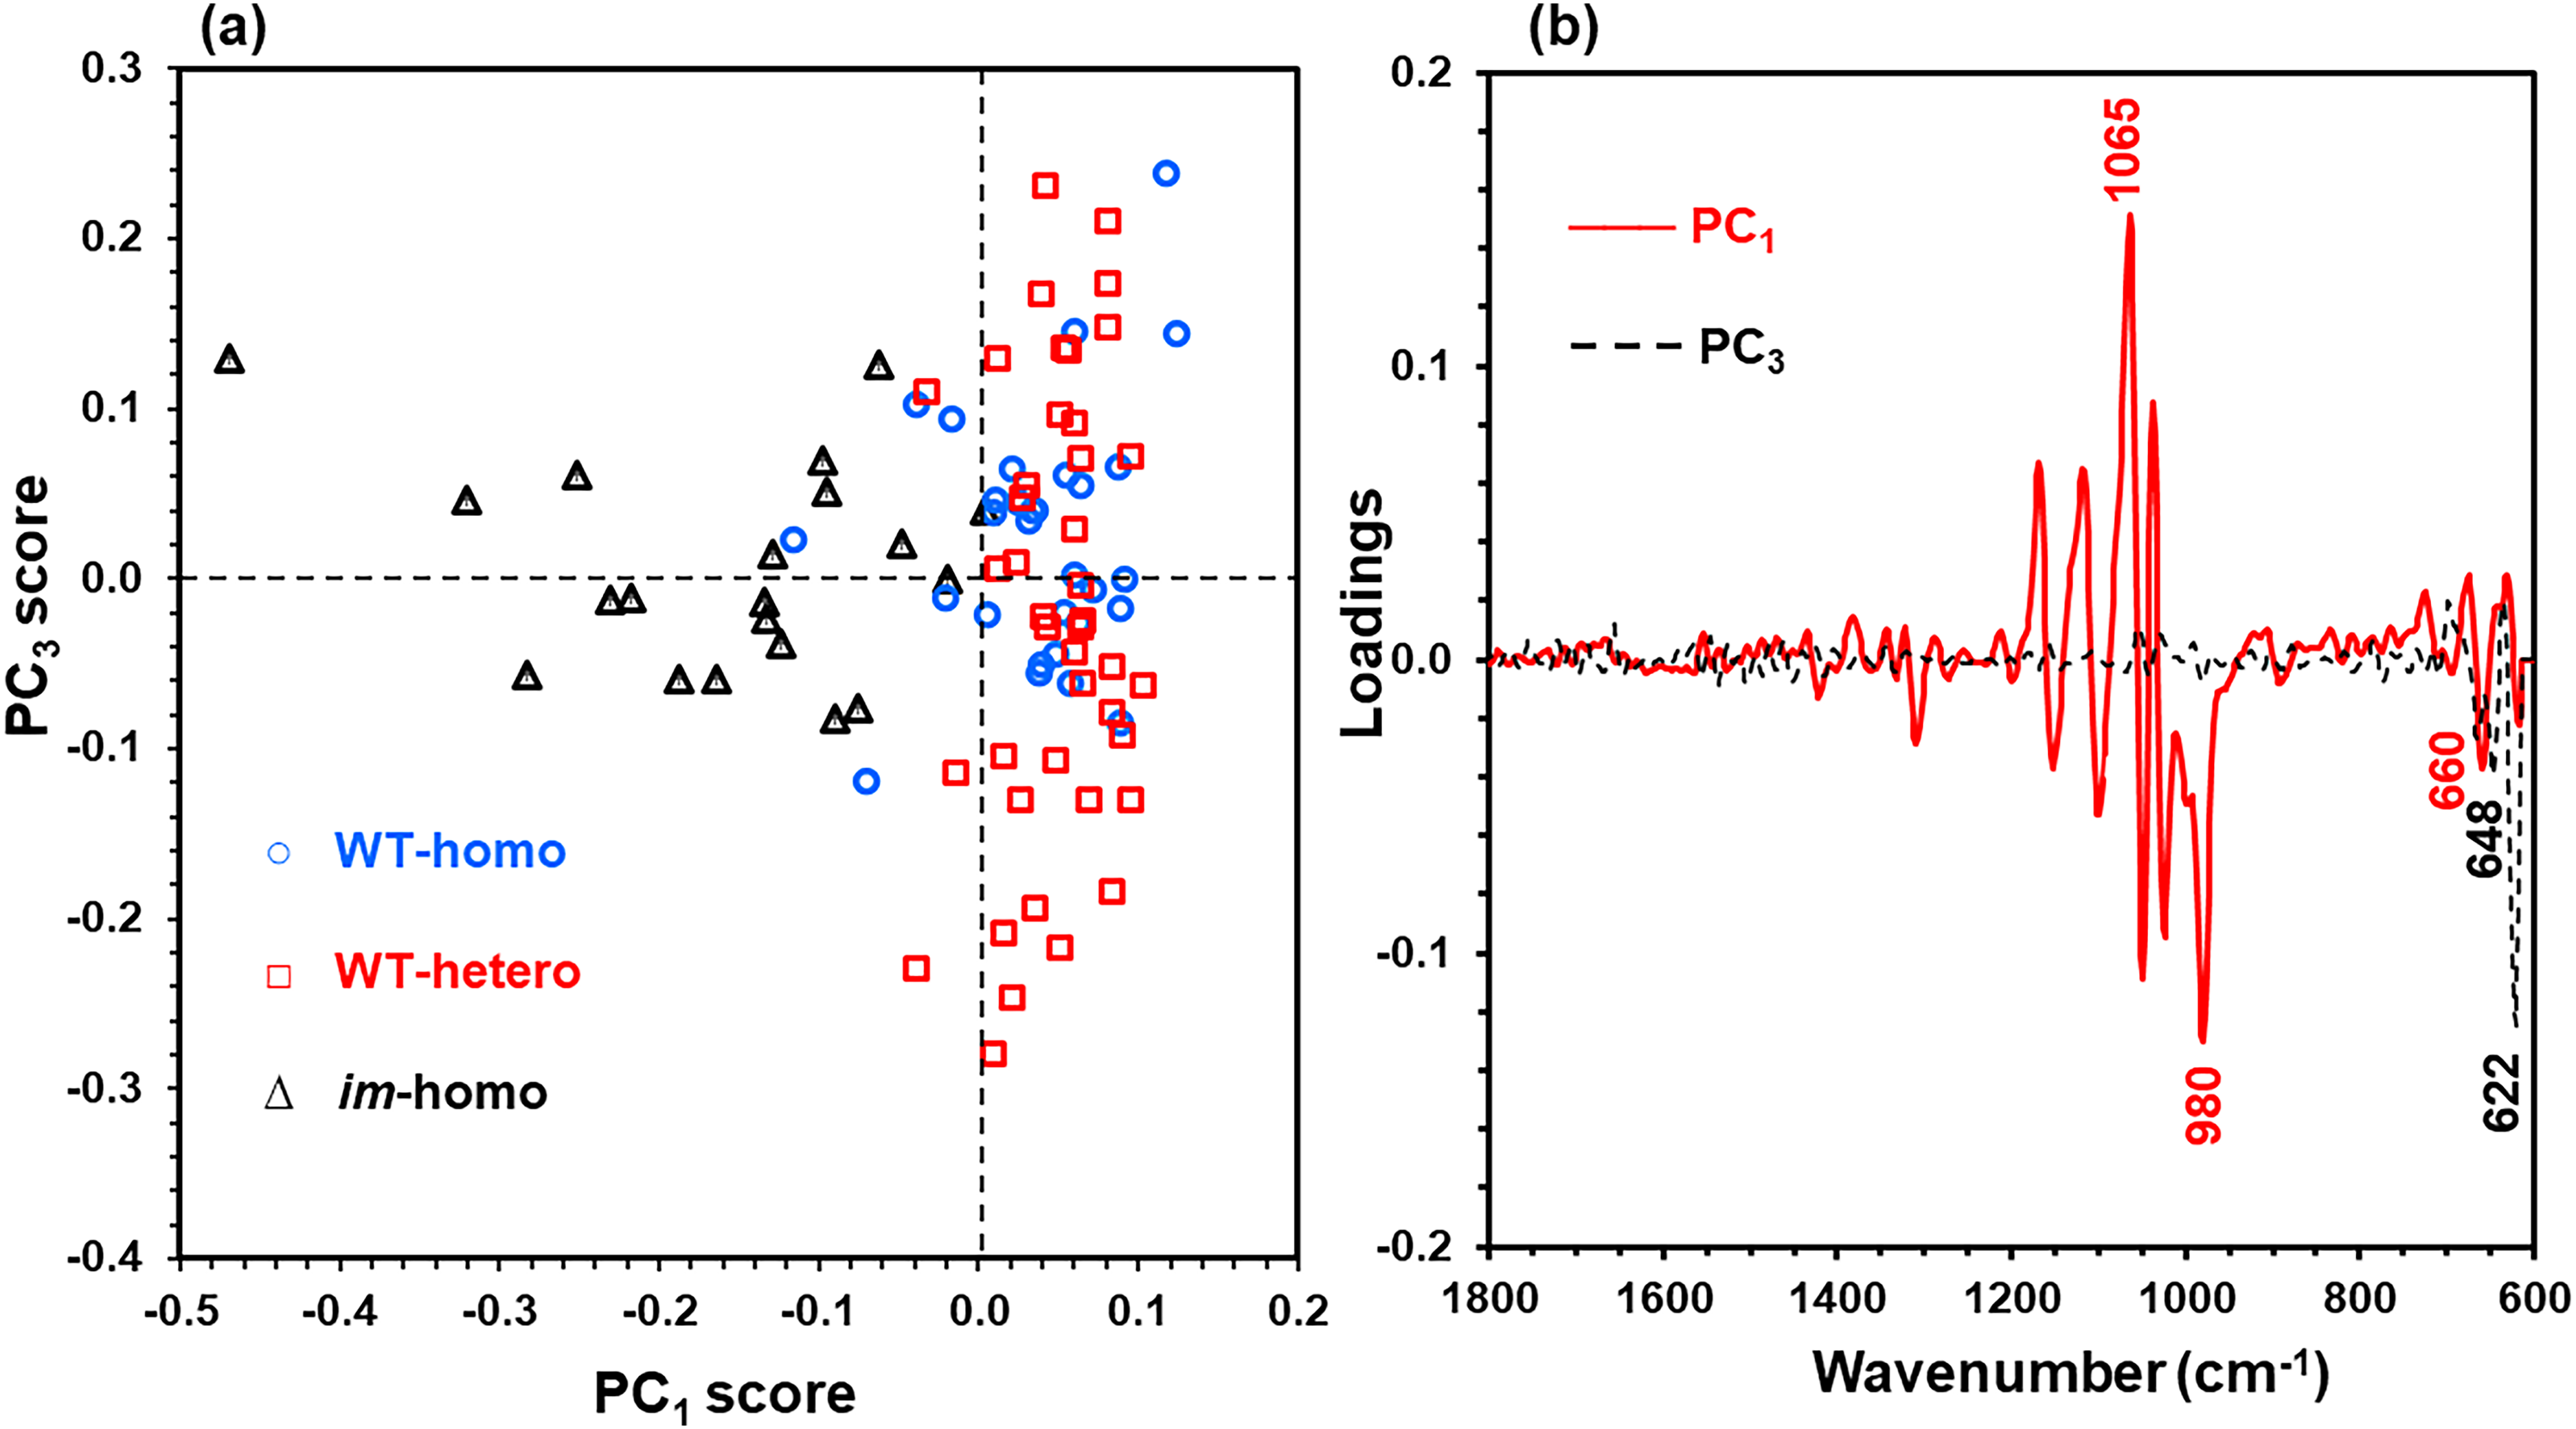
A plot of PC3 score against (a) PC1 score and (b) PC1 and PC3 loadings from the PCA of normalized ATR FT-IR spectra of WT-homo fibers, WT-hetero fibers, and im-homo fibers.
Soft Independent Modeling of Class Analogy of Principal Component Analysis (SIMCA–PCA) Classification Models of ATR FT-IR Spectra for Classifying Fiber Phenotypes with Three Different Genotype Fibers
Classification models were developed using different spectral pretreatments (e.g., MC, MSC, and the first and second derivatives) in the 1800–615 cm–1 region for optimal identification of three-class fibers. For each model, classification efficiency was evaluated by the sample numbers correctly classified, and optimal results in calibration and validation sets are summarized in Table I.
Of the 62 and 30 samples in calibration and validation sets, 59 and 27 samples were correctly classified into respective classes by applying the lowest MD value rule (or MD threshold), producing an overall correct classification of over 90.0%. There were zero WT-homo fiber, three WT-hetero fibers, and zero im-homo fiber in validation samples, and also zero WT-homo fibers, three WT-hetero fibers, and zero im-homo fiber in calibration samples being misclassified. In general, the numbers of individual classes incorrectly determined in the validation set were proportional to those in a calibration set, suggesting that the classification error likely was from the degree of diversity and representation of both calibration and validation samples within each fiber category. Further analysis revealed that these misclassified WT-hetero samples in the validation and calibration set were identified wrongly as WT-homo fibers. Although a few WT-hetero fibers were misclassified in Table I, the classification was enormously improved compared to results from MIC-, Lint , MIR-, CIIR-, and PCA-based screening in Figures 2, 5, and 6.
To discern how an individual sample (or spectrum) was classified on the basis of three-class modeling, range, mean, and SD of the MD values on 20 calibration samples for the WT-homo class are summarized in Table II (original data in Table S3, Supplemental Material). Within these samples, MD values increased from WT-homo class (0.92 ± 0.31; mean ± SD) to WT-hetero class (3.91 ± 2.55) and to im-homo class (7.08 ± 3.10). MD difference between the second smallest MD value and the smallest MD value ranged from 0.33 to 9.81, with 19 of 20 samples possessing an MD difference of >0.50. Similarly, MD values of validation samples shared the same tendency of increasing MD values from the WT-homo class (1.89 ± 1.85) to the WT-hetero class (4.44 ± 2.49) and to the im-homo class (7.04 ± 2.84), and also all validation samples showed an MD difference of >0.50 between the second smallest and the smallest MD value. This trend is expected, since both calibration and validation samples from the WT-homo class have lower MD values to the correct WT-homo class than to the incorrect WT-hetero or im-homo class, and vice versa.
Range, mean, and SD of the MD values from three-class SIMCA–PCA classification of WT-homo, WT-hetero, and im-homo cotton fibers from ATR FT-IR.
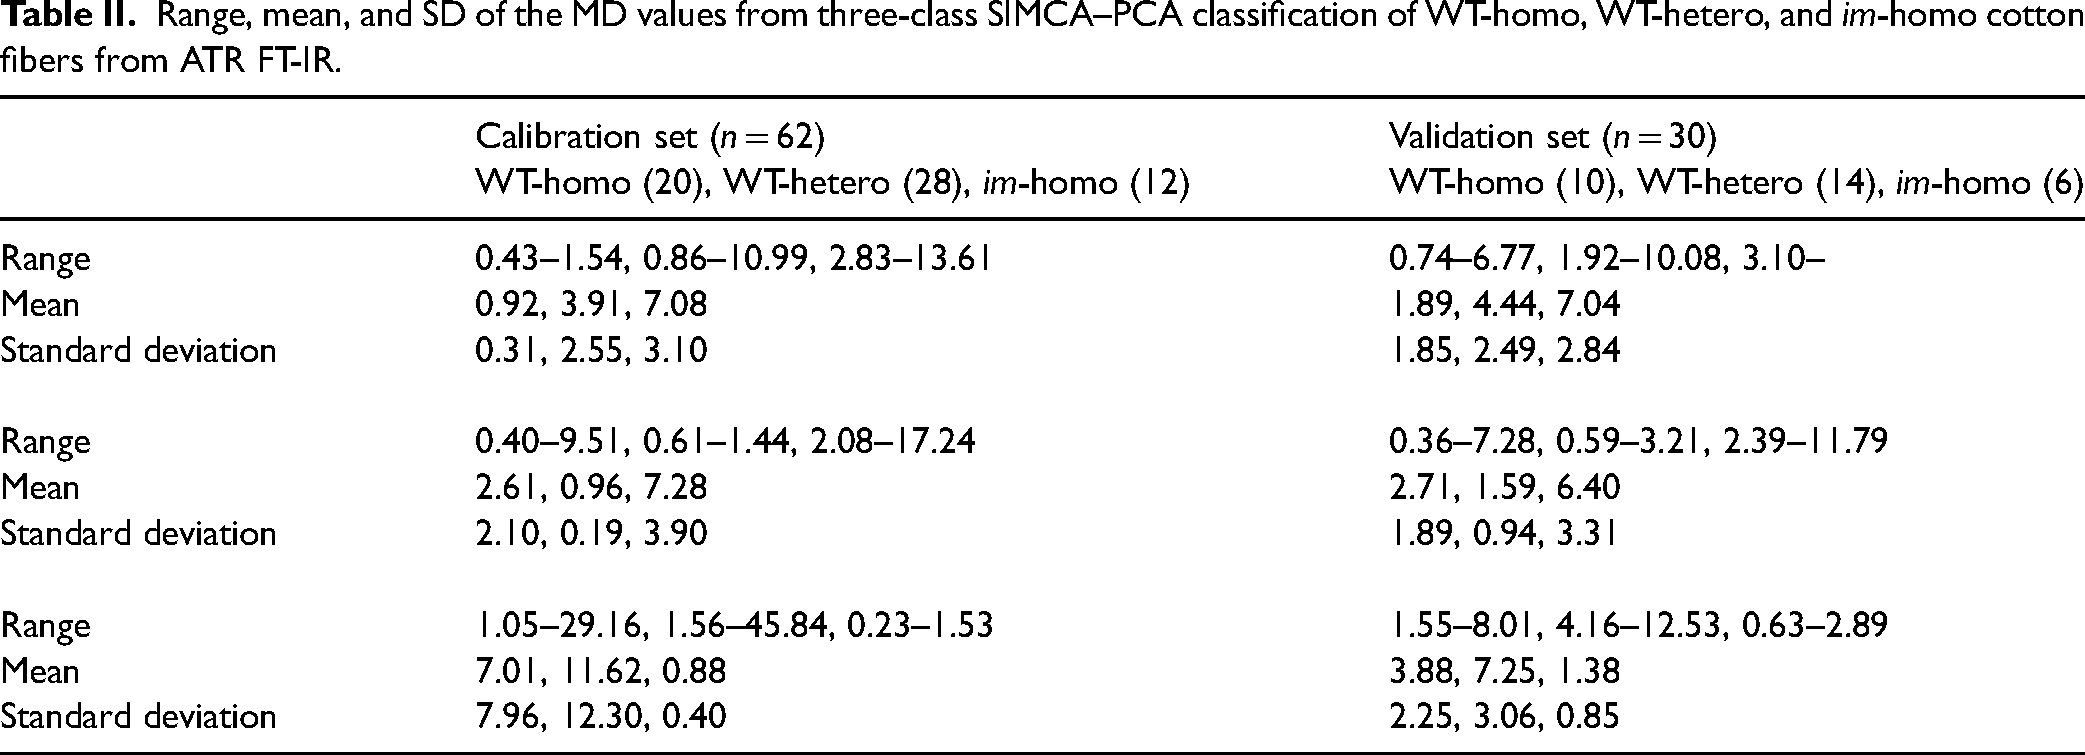
The 28 calibration samples in the WT-hetero class revealed a pattern of enlarging MD values from the WT-hetero class (0.96 ± 0.19) to the WT-homo class (2.61 ± 2.10) and to the im-homo class (7.28 ± 3.90). MD differences of these samples between the second smallest MD value and the smallest MD value were from −0.58 to 8.37, in which 18 of 28 calibration samples had an MD difference of >0.50. Equivalently, MD values of validation samples increased from the WT-hetero class (1.59 ± 0.94) to the WT-homo class (2.71 ± 1.89) and to the im-homo class (6.40 ± 3.31), and 10 of 14 validation samples had an MD difference of >0.50.
Similar to trends for two WT fibers, 14 im-homo calibration fibers showed rising MD values from the im-homo class (0.88 ± 0.40) to the WT-homo class (7.01 ± 7.96) and to the WT-hetero class (11.62 ± 12.30). MD differences of 14 calibration samples in the im-homo class between the second smallest MD value and the smallest MD value were from 0.13 to 27.86, in which 13 of 14 calibration samples had an MD difference of >0.50. Coincidently, MD values of six validation samples increased from the im-homo class (1.37 ± 0.85) to the WT-homo class (3.88 ± 2.25) and to the WT-hetero class (7.25 ± 3.06), and all validation samples had an MD difference of >0.50.
Overall, Table II suggested that a sample in a specific class could be separated from the other two classes on the dimension of MD values solely and successfully. However, a practical concern prompts, that is, whether samples could be identified accurately if they had a trivial difference between the second smallest and the smallest MD value, for example, at MD < 0.50. With regard to this point, the SR value was introduced as a second threshold for classification efficiency, and it would be applied only when the difference between the second smallest and the smallest MD value was <0.50. After re-analyzing all data with a combined MD/SR threshold, results were compared in Table I. Clearly, this procedure improved the classification for WT-hetero fibers in either the calibration set (from 89.3 to 96.4%) or the validation set (from 78.6 to 100.0%). On the other hand, it showed a compromised effect for both the WT-homo fibers (from 100 to 95.0%) and the im-homo fibers (from 100.0 to 92.3%) in the calibration set. Hence, the result indicated an over 95% average of correct classification for both calibration and validation samples on the basis of three-class fibers using a combined MD/SR threshold. For the identification of WT-homo fibers from WT-hetero fibers only, the resultant two WT-fiber models showed that 46 of 48 calibration samples and 24 of 24 validation samples were correctly clustered, with only one WT-homo fiber and one WT-hetero fiber being misclassified among a total of 72 samples. Nevertheless, the results demonstrate the feasibility of the ATR FT-IR method with the aid of SIMCA–PCA in the successful discrimination of WT cotton fiber phenotypes consisting of two different genotypes.
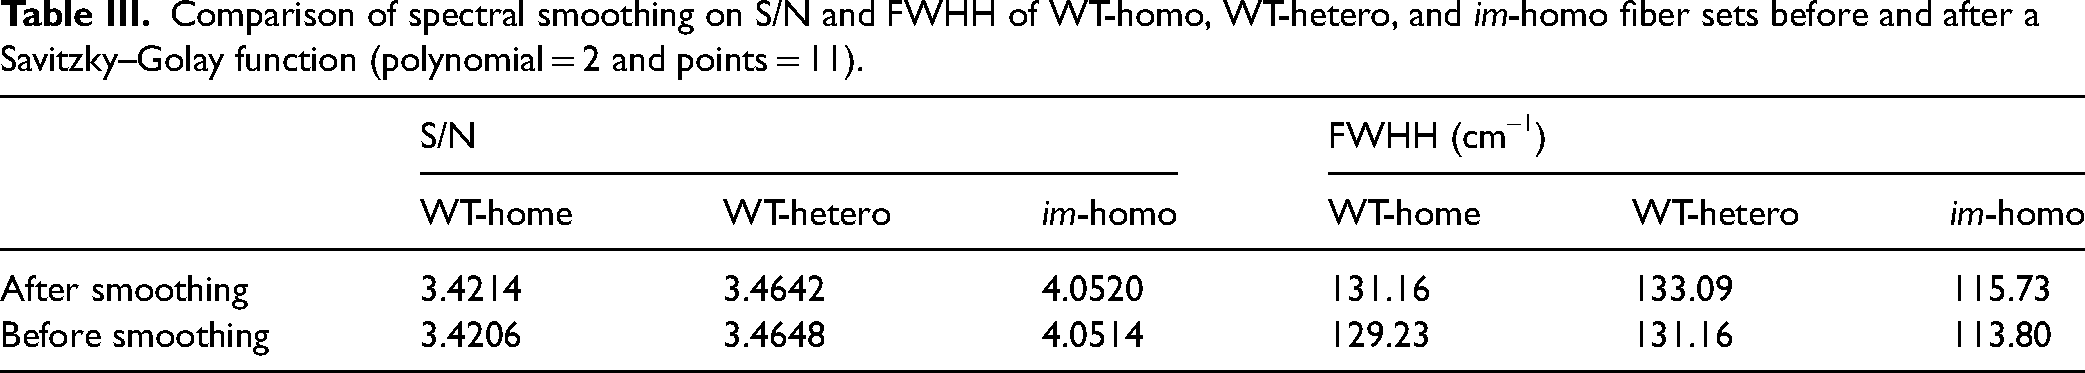
Regarding the effect of the Savitzky–Golay smoothing on the spectra, the signal-to-noise ratio (S/N) in terms of peak-to-peak noise was estimated. Maximum peak intensity was calculated as the average of intensities in the 1120–960 cm–1 region, and minimum peak intensity was calculated as mean intensity in the 1820–1780 cm–1 region. Table III compares the S/N before and after smoothing on average spectra of three fiber sets. The S/N did not change much with spectral smoothing for each of the three fiber sets, and there was a statistically insignificant difference in S/N (p-value = 0.99) before and after smoothing. Meanwhile, full width at half height (FWHH) was assessed from the 1085–945 cm–1 region and inserted in Table III. FWHH increased little (1.93 cm–1) with spectral smoothing for each of the three fiber sets, since the 1.93 cm–1 gap is one datapoint interval in a spectral scan. The difference in FWHH (p-value = 0.82) was statistically insignificant before and after smoothing. Therefore, the use of the Savitzky–Golay smoothing function (polynomial = 2 and points = 11) in this study may not affect the spectral line shape and absorbance intensity significantly.
Comparison of spectral smoothing on S/N and FWHH of WT-homo, WT-hetero, and im-homo fiber sets before and after a Savitzky–Golay function (polynomial = 2 and points = 11).
In this study, we were able to detect the subtle differences caused by the genotypic variants between homozygous and heterozygous cotton fibers via the combination of ATR FT-IR spectra with the SIMCA–PCA method. Unlike the tetraploid WT cotton plant consisting of two copies of functional pentatricopeptide repeat (PPR) genes in A (Ghir_A03G006650) and D (Ghir_D03G012190) sub-genomes, the im mutant plant contains only one functional PPR gene in the D sub-genomes since the A sub-genome is composed of a non-functional PPR gene containing a 22-base pair (bp) deletion mutation. 41 Functional PPR protein is involved in mitochondrial cellular respiration in developing fibers 42 and photosynthetic performance in cotton leaves. 43 The im phenotype was caused by a loss of PPR function in a dosage-dependent manner. 37 Therefore, we suspect that the phenotypic difference between WT-hetero and WT-homo may have resulted from various levels of functional PPR protein. The dosage-dependent regulations of plant genes and their effects on plant phenotypes have been extensively studied on maize to understand the mechanisms of “heterosis” where cross-pollinated hybrids are more vigorous than their parents. 44 Variation in disease resistance was reported between homozygotes and heterozygotes of the maize Hm2 gene. 45 Analysis of FT-IR spectral intensity ratios (A1665 : A1510 and A1595 : A1510) showed the differences in the cell wall components between the homozygotes and heterozygotes of the maize bm1 gene. 36 Despite the genetic basis of heterosis or hybrid vigor in plants was not clearly understood, variation in transcriptional regulation was suggested to explain the phenomenon of improved performance of the progeny of a cross between two different parental genotypes. 46 Cotton breeders and geneticists also produced large collections of cotton hybrids demonstrating multigenic complex traits with various phenotypic features and compared their genotype variants with corresponding phenotype variants for identifying genes regulating cotton fiber maturity.47–50 Current phenotypic methods, such as conventional fiber maturity measurement methods (Figure 2) and the simple algorithmic and PCA of ATR FT-IR spectra (Figures 5 and 6), lacked the ability to detect the subtle differences generated by the genotypic variations and might prevent genomic approaches for improving cotton fiber maturity. In this study, we have demonstrated that the ATR FT-IR technique in combination with the SIMCA–PCA method enabled the monitoring of minor maturity differences driven by the genotypic variations. This new approach could be utilized by cotton scientists searching for highly sensitive tools for detecting minor variations generated by genetic variations found in cotton hybrids.
Conclusion
The results from traditional fiber maturity and ATR FT-IR measurements revealed a unique challenge of distinguishing any slight differences between the two WT genotypes, WT-homo versus WT-hetero fibers. This study presented an ATR FT-IR method combined with SIMCA–PCA models for classifying three-class fibers. Results revealed the optimum discrimination of one fiber class from the other two classes at a satisfactory level of >95.0% with the use of both MD and SR thresholds, especially a striking separation between WT-homo and WT-hetero fibers. This approach might be a useful and sensitive tool for detecting subtle maturity variations induced by genetic variants among crossed fibers and also potentially in commercial hybrid cotton fibers, given that ATR FT-IR measurement is a rapid, non-destructive, and direct characterization of all chemical components in cotton fibers.
Supplemental Material
sj-docx-1-asp-10.1177_00037028231211942 - Supplemental material for Attenuated Total Reflection Fourier Transform Infrared Spectroscopy with Soft Independent Modeling of Class Analogy–Principal Component Analysis for Classifying Cotton Fiber Maturity Phenotypes of Cotton Population Composed of Various Genotypes
Supplemental material, sj-docx-1-asp-10.1177_00037028231211942 for Attenuated Total Reflection Fourier Transform Infrared Spectroscopy with Soft Independent Modeling of Class Analogy–Principal Component Analysis for Classifying Cotton Fiber Maturity Phenotypes of Cotton Population Composed of Various Genotypes by Yongliang Liu and Hee-Jin Kim in Applied Spectroscopy
Footnotes
Acknowledgments
The authors acknowledge the technical assistance of former and current members of the Cotton Structure and Quality Research Unit and Cotton Fiber Bioscience Research Unit of USDA-ARS-SRRC as well as the Crop Genetic Research Unit, USDA-ARS-SEA for growing, phenotyping, and genotyping cotton samples. We thank Dr. Christopher Delhom of USDA-ARS-SRRC for the enormous effort and critical insights to improve the paper. Mention of a product or specific equipment does not constitute a guarantee or warranty by the U.S. Department of Agriculture and does not imply its approval to the exclusion of other products that may also be suitable.
Declaration of Conflicting Interests
The authors declared no potential conflicts of interest with respect to the research, authorship, and/or publication of this article.
Funding
The authors received no financial support for the research, authorship, and/or publication of this article.
Supplemental Material
All supplemental material mentioned in the text is available in the online version of the journal.
References
Supplementary Material
Please find the following supplemental material available below.
For Open Access articles published under a Creative Commons License, all supplemental material carries the same license as the article it is associated with.
For non-Open Access articles published, all supplemental material carries a non-exclusive license, and permission requests for re-use of supplemental material or any part of supplemental material shall be sent directly to the copyright owner as specified in the copyright notice associated with the article.