
Abstract
The ultraviolet resonance Raman (UVRR) spectra of the two proteins bovine serum albumin (BSA) and human serum albumin (HSA) in an aqueous solution are compared with the aim to distinguish between them based on their very similar amino acid composition and structure and to obtain signals from tryptophan that has only very few residues. Comparison of the protein spectra with solutions of tryptophan, tyrosine, and phenylalanine in comparative ratios as in the two proteins shows that at an excitation wavelength of 220 nm, the spectra are dominated by the strong resonant contribution from these three amino acids. While the strong enhancement of two and one single tryptophan residue in BSA and HSA, respectively, results in pronounced bands assigned to fundamental vibrations of tryptophan, its weaker overtones and combination bands do not play a major role in the spectral range above 1800 cm–1. There, the protein spectra clearly reveal the signals of overtones and combination bands of phenylalanine and tyrosine. Assignments of spectral features in the range of Raman shifts from 3800 to 5100 cm–1 to combinations comprising fundamentals and overtones of tyrosine were supported by spectra of amino acid mixtures that contain deuterated tyrosine. The information in the high-frequency region of the UVRR spectra could provide information that is complementary to near-infrared absorption spectroscopy of the proteins.
This is a visual representation of the abstract.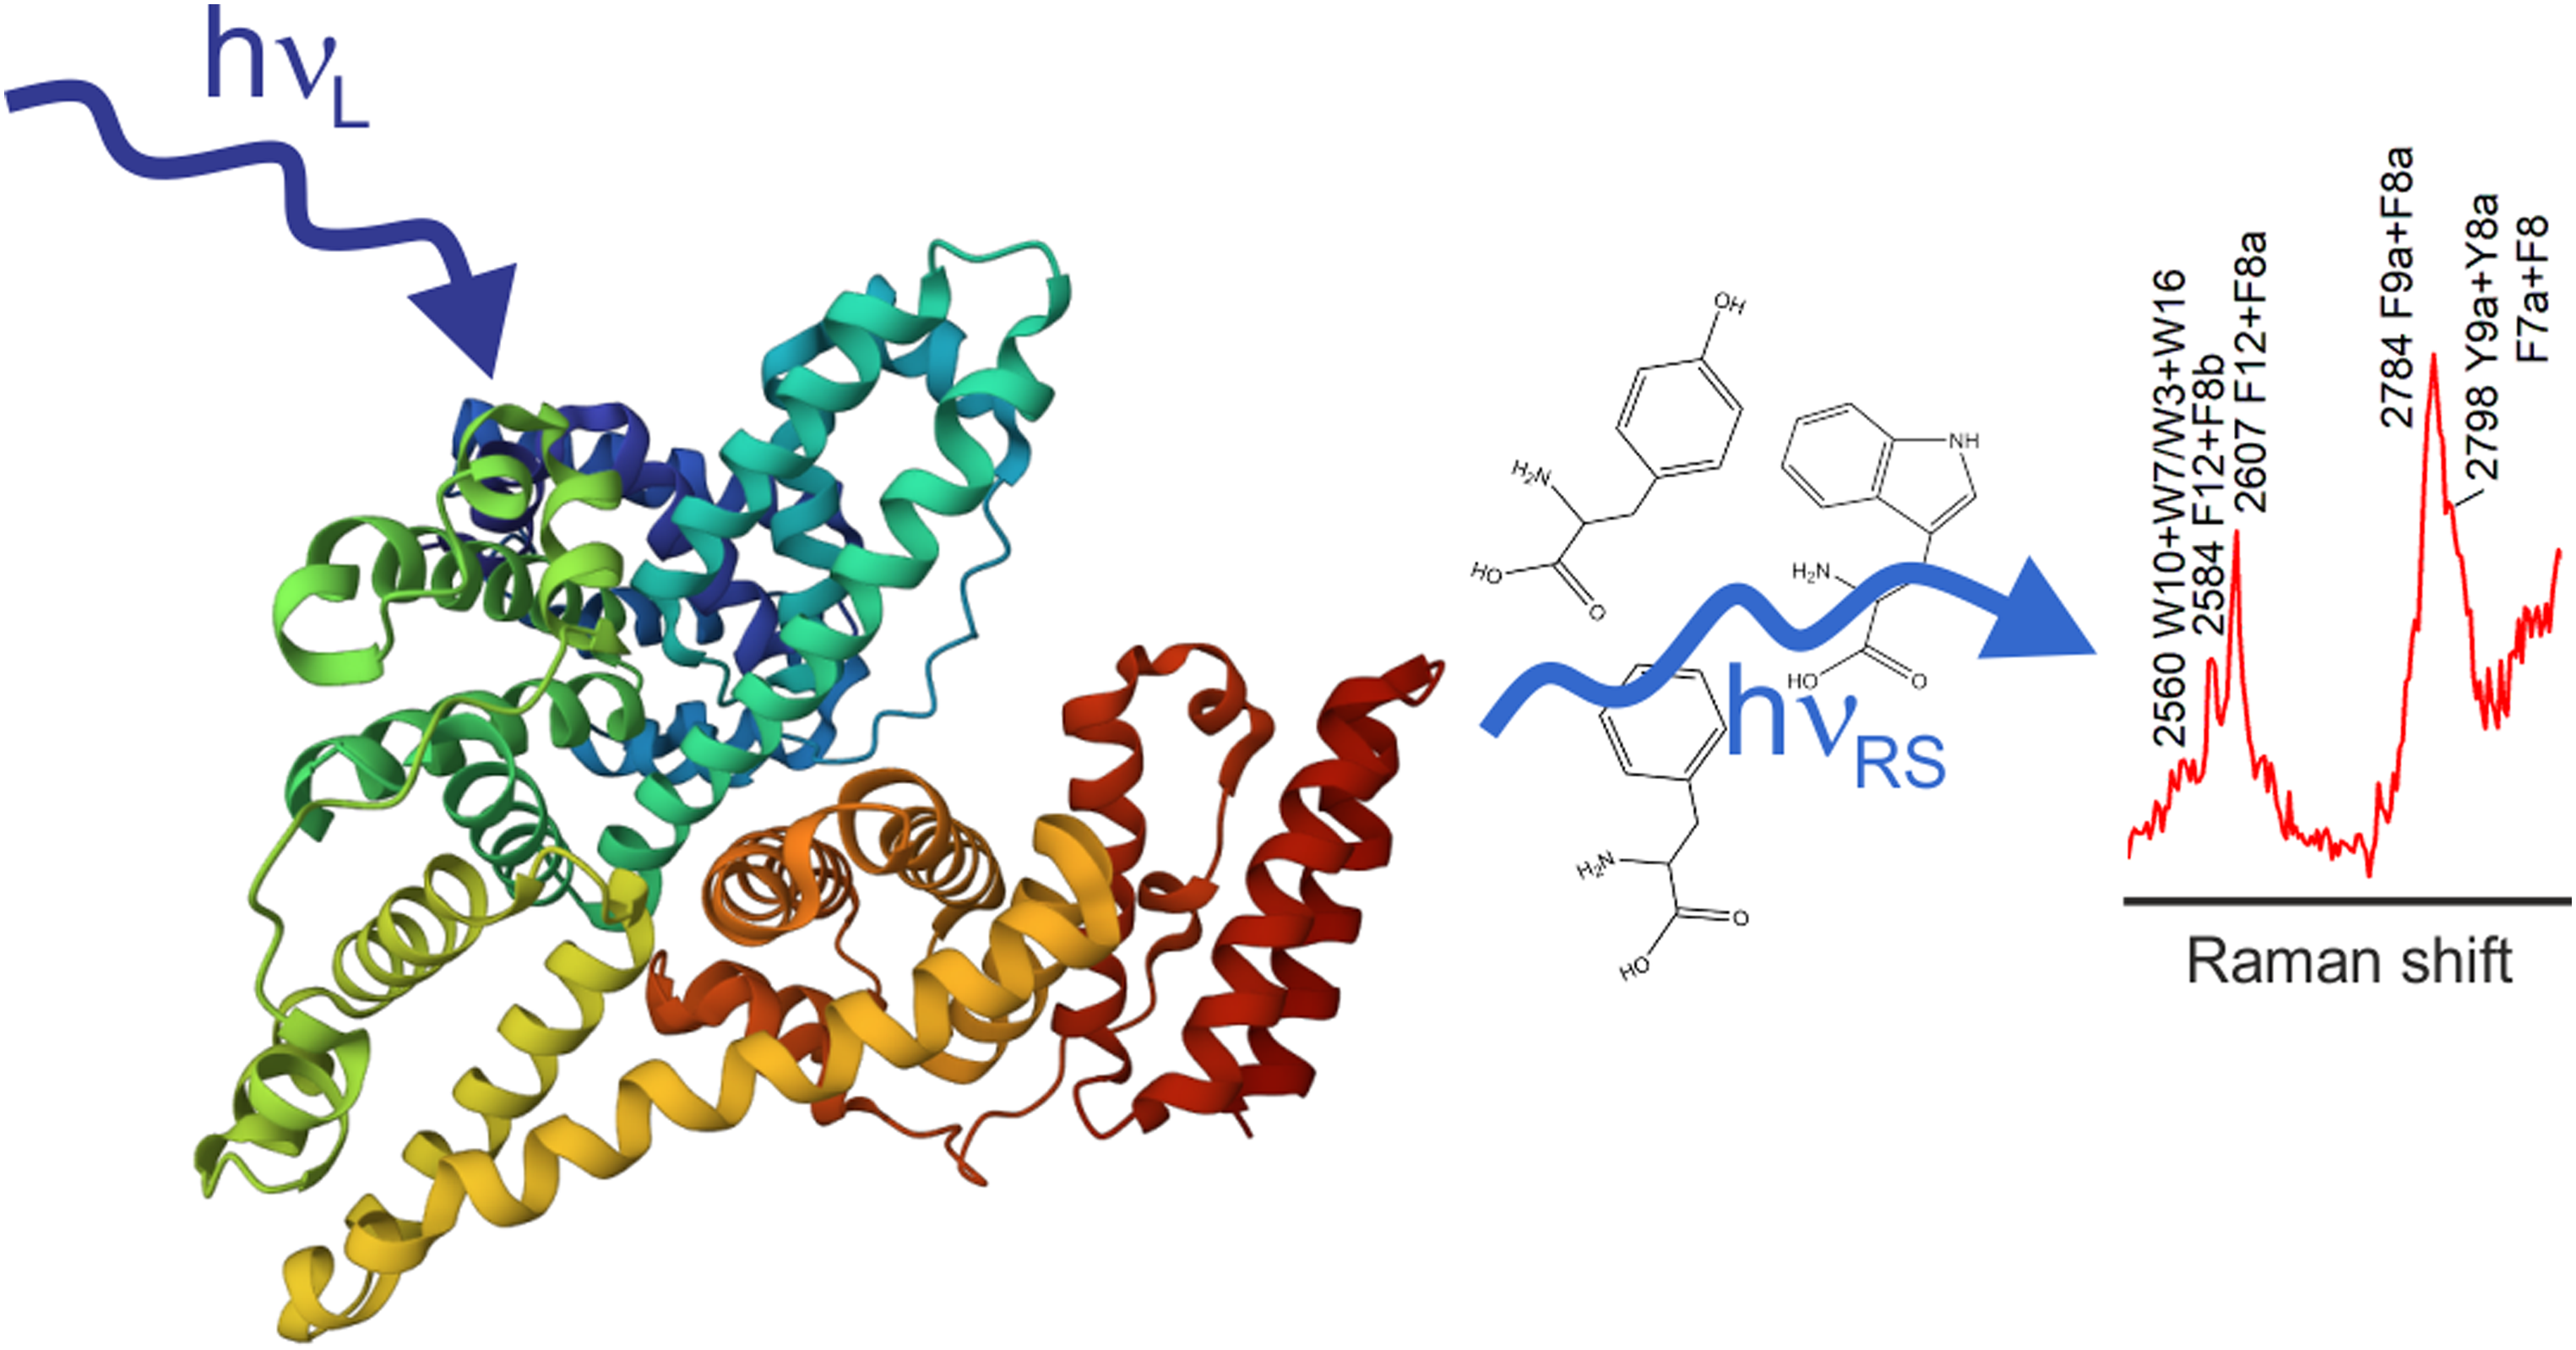
Keywords
Introduction
Serum albumin is the most abundant protein in vertebrate blood and plays an important role as a carrier and in interacting with external molecules and materials that enter an organism. 1 Serum albumins have served in many pioneering applications of Raman scattering to protein structural studies,2–5 and Raman spectroscopy has revealed important information on the interaction of serum albumin with drugs6,7 or nanomaterials and surfaces using surface-enhanced Raman scattering on gold and silver nanostructures.8–10
In a Raman experiment, resonance with a particular electronic transition implies extreme selectivity, as the resonant Raman (RR) signal of a particular chromophore is many orders of magnitude stronger than the nonresonant spectrum and precludes observation of all other molecular species in the sample. In biological samples, resonant excitation in the ultraviolet (UV) has been shown to be very useful in the Raman spectroscopic characterization of microorganisms11–13 and recently individual eukaryotic cells.14,15
Based on the rich body of knowledge on the RR spectra of proteins16–19 and amino acids,20–22 there is great potential in structural studies of albumins using ultraviolet RR (UVRR) spectroscopy.23,24 When the deep UV region around 200 nm is used for RR excitation, the selective enhancement of the signals of amide vibrations occurs, enabling the characterization of the protein secondary structure.16,23,25 In contrast, excitation at longer UV wavelengths emphasizes the different contributions by the aromatic amino acid side chains to different extents.16,20,21 In serum albumin, different aromatic residues are located in or near binding sites for drugs or other molecules or are involved in ligand binding7,26,27 or may indicate differences in structure and interaction of serum albumins of different species.
The two proteins, human serum albumin (HSA) and bovine serum albumin (BSA), are very similar, with a sequence overlap of approximately 75.6%, 28 yet very different interactions and thermodynamic properties.10,29,30 Here, we discuss the UVRR spectra of BSA and HSA, with the aim of assigning the contributions of different aromatic amino acid side chains to the protein spectral signature. In addition to the fingerprint spectral region, we discuss the regions of overtone and combination bands in the wavenumber range from 2900 to 5100 cm–1 that are differently pronounced in the spectra of the proteins and provide information that is complementary to that observed in near-infrared (NIR) absorption spectra of the proteins.
Materials and Methods
Sample Preparation
Raman Experiments
Raman spectra were recorded in backscattering geometry in a rotating quartz cuvette. The cuvette rotates at approximately 4.5 Hz to reduce the risk of UV light-induced degradation of the samples. The excitation light is provided by a frequency-quadrupled diode laser (Toptica Photonics) operating at 220 nm. The scattered light was detected with a Raman spectrometer Horiba T64000 operated in single-stage mode with an edge filter, using a 2400 mm–1 holographic grating. The spectral resolution considering the full spectral range is 6 cm–1 for spectra measured in the 700 to 2900 cm–1 region, and 10 cm–1 for spectra in the region from 3800 to 5100 cm–1. The recorded spectra were frequency calibrated using the spectrum of acetone. Because of water evaporation from the solution, the focus of the optical path changes with time. To compensate for this effect and reduce noise, each spectrum was averaged over 10 spectra measured with an accumulation time of 180 s (for each measurement, the focus was readjusted). No significant changes in the Raman bands in the samples were observed in the sequence of collecting several spectra, excluding sample degradation that occurred during the measurements. All spectra were background corrected. When required, spectra were normalized using the band at 932 cm–1 of perchlorate that was added to the buffer.
Sequence and structural data of the proteins were obtained from Protein Data Bank (PDB), using PDB IDs 3V03 for BSA 28 and 1AO6 for HSA. 31 Structural analysis of the proteins was performed using PDBsum 32 and PyMOL (Molecular Graphics Systems v.2.0 Schrödinger, LLC).
Results and Discussion
Spectra of BSA and HSA in the Region from 700 to 1800 cm–1
Resonance Raman spectra were collected from solutions of BSA and HSA in a phosphate buffer at pH 7 using an excitation wavelength of 220 nm. BSA is a globular protein, it consists of 583 amino acids, of which 27 are phenylalanine, 20 are tyrosine and two residues are tryptophan. It is estimated that 74.2% of its secondary structure is α-helical. HSA is also globular, has a 75.6% sequence homology with BSA, 28 and it is estimated that 70.9% of its secondary structure is α-helical. It consists of 585 amino acids, of which 31 are phenylalanine, 18 are tyrosine and only one is tryptophan. The UVRR spectra of both proteins are shown in Fig. 1, together with the well known20,21,33 spectra of the three amino acids phenylalanine, tryptophan, and tyrosine in solution. The spectra of the pure amino acid solutions represent most of the bands in the spectra of the two proteins, the according assignments are given in Table I. This agrees with earlier reports of UVRR spectra of other proteins at this excitation wavelength.16,33 In the 1500–1700 cm–1 region, the overlap of bands is observed due to the strong signals assigned to the ν8a modes of phenylalanine and tyrosine and the ν8b mode of the latter. 20
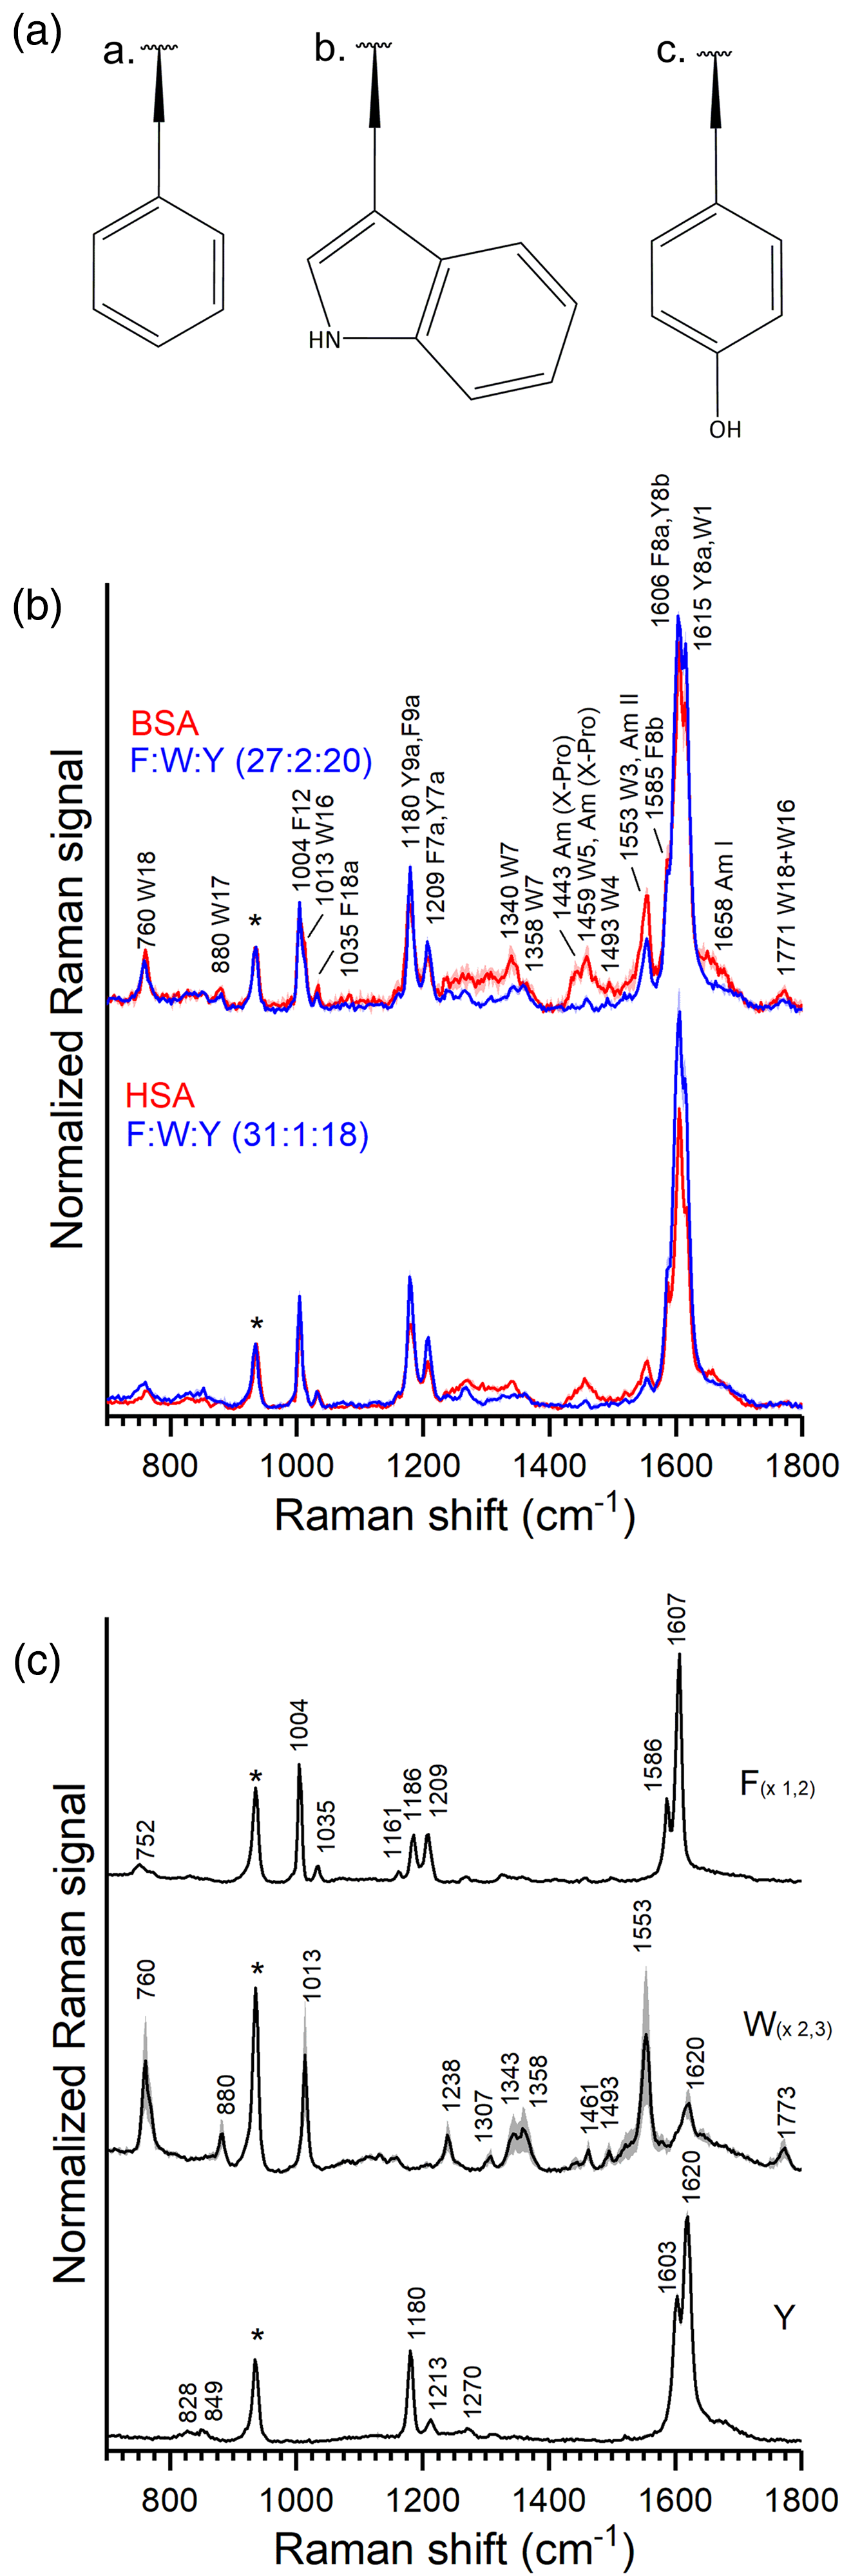
(a) Side chain chemical structures of a. phenylalanine, b. tryptophan, and c. tyrosine. (b) Average resonance Raman spectra and corresponding standard deviation of the 700–1800 cm–1 range of aqueous solutions of HSA 50 µM (bottom red trace); a solution of tyrosine, tryptophan, and phenylalanine in a concentration and ratio similar to the amino acids in the HSA solution (bottom blue trace); BSA 50 µM (upper red trace), and a solution of tyrosine, tryptophan, and phenylalanine in a concentration and ratio similar to the amino acids in the BSA solution (upper blue trace). (c) Average resonance Raman spectra and corresponding standard deviation of the 700–1800 cm–1 range of aqueous solutions of tyrosine 1 mM (Y, black trace); tryptophan 0.1 mM (W, black trace); phenylalanine 1.35 mM (F, black trace). The band at 932 cm–1 marked with an asterisk in (b) and (c) corresponds to perchlorate.
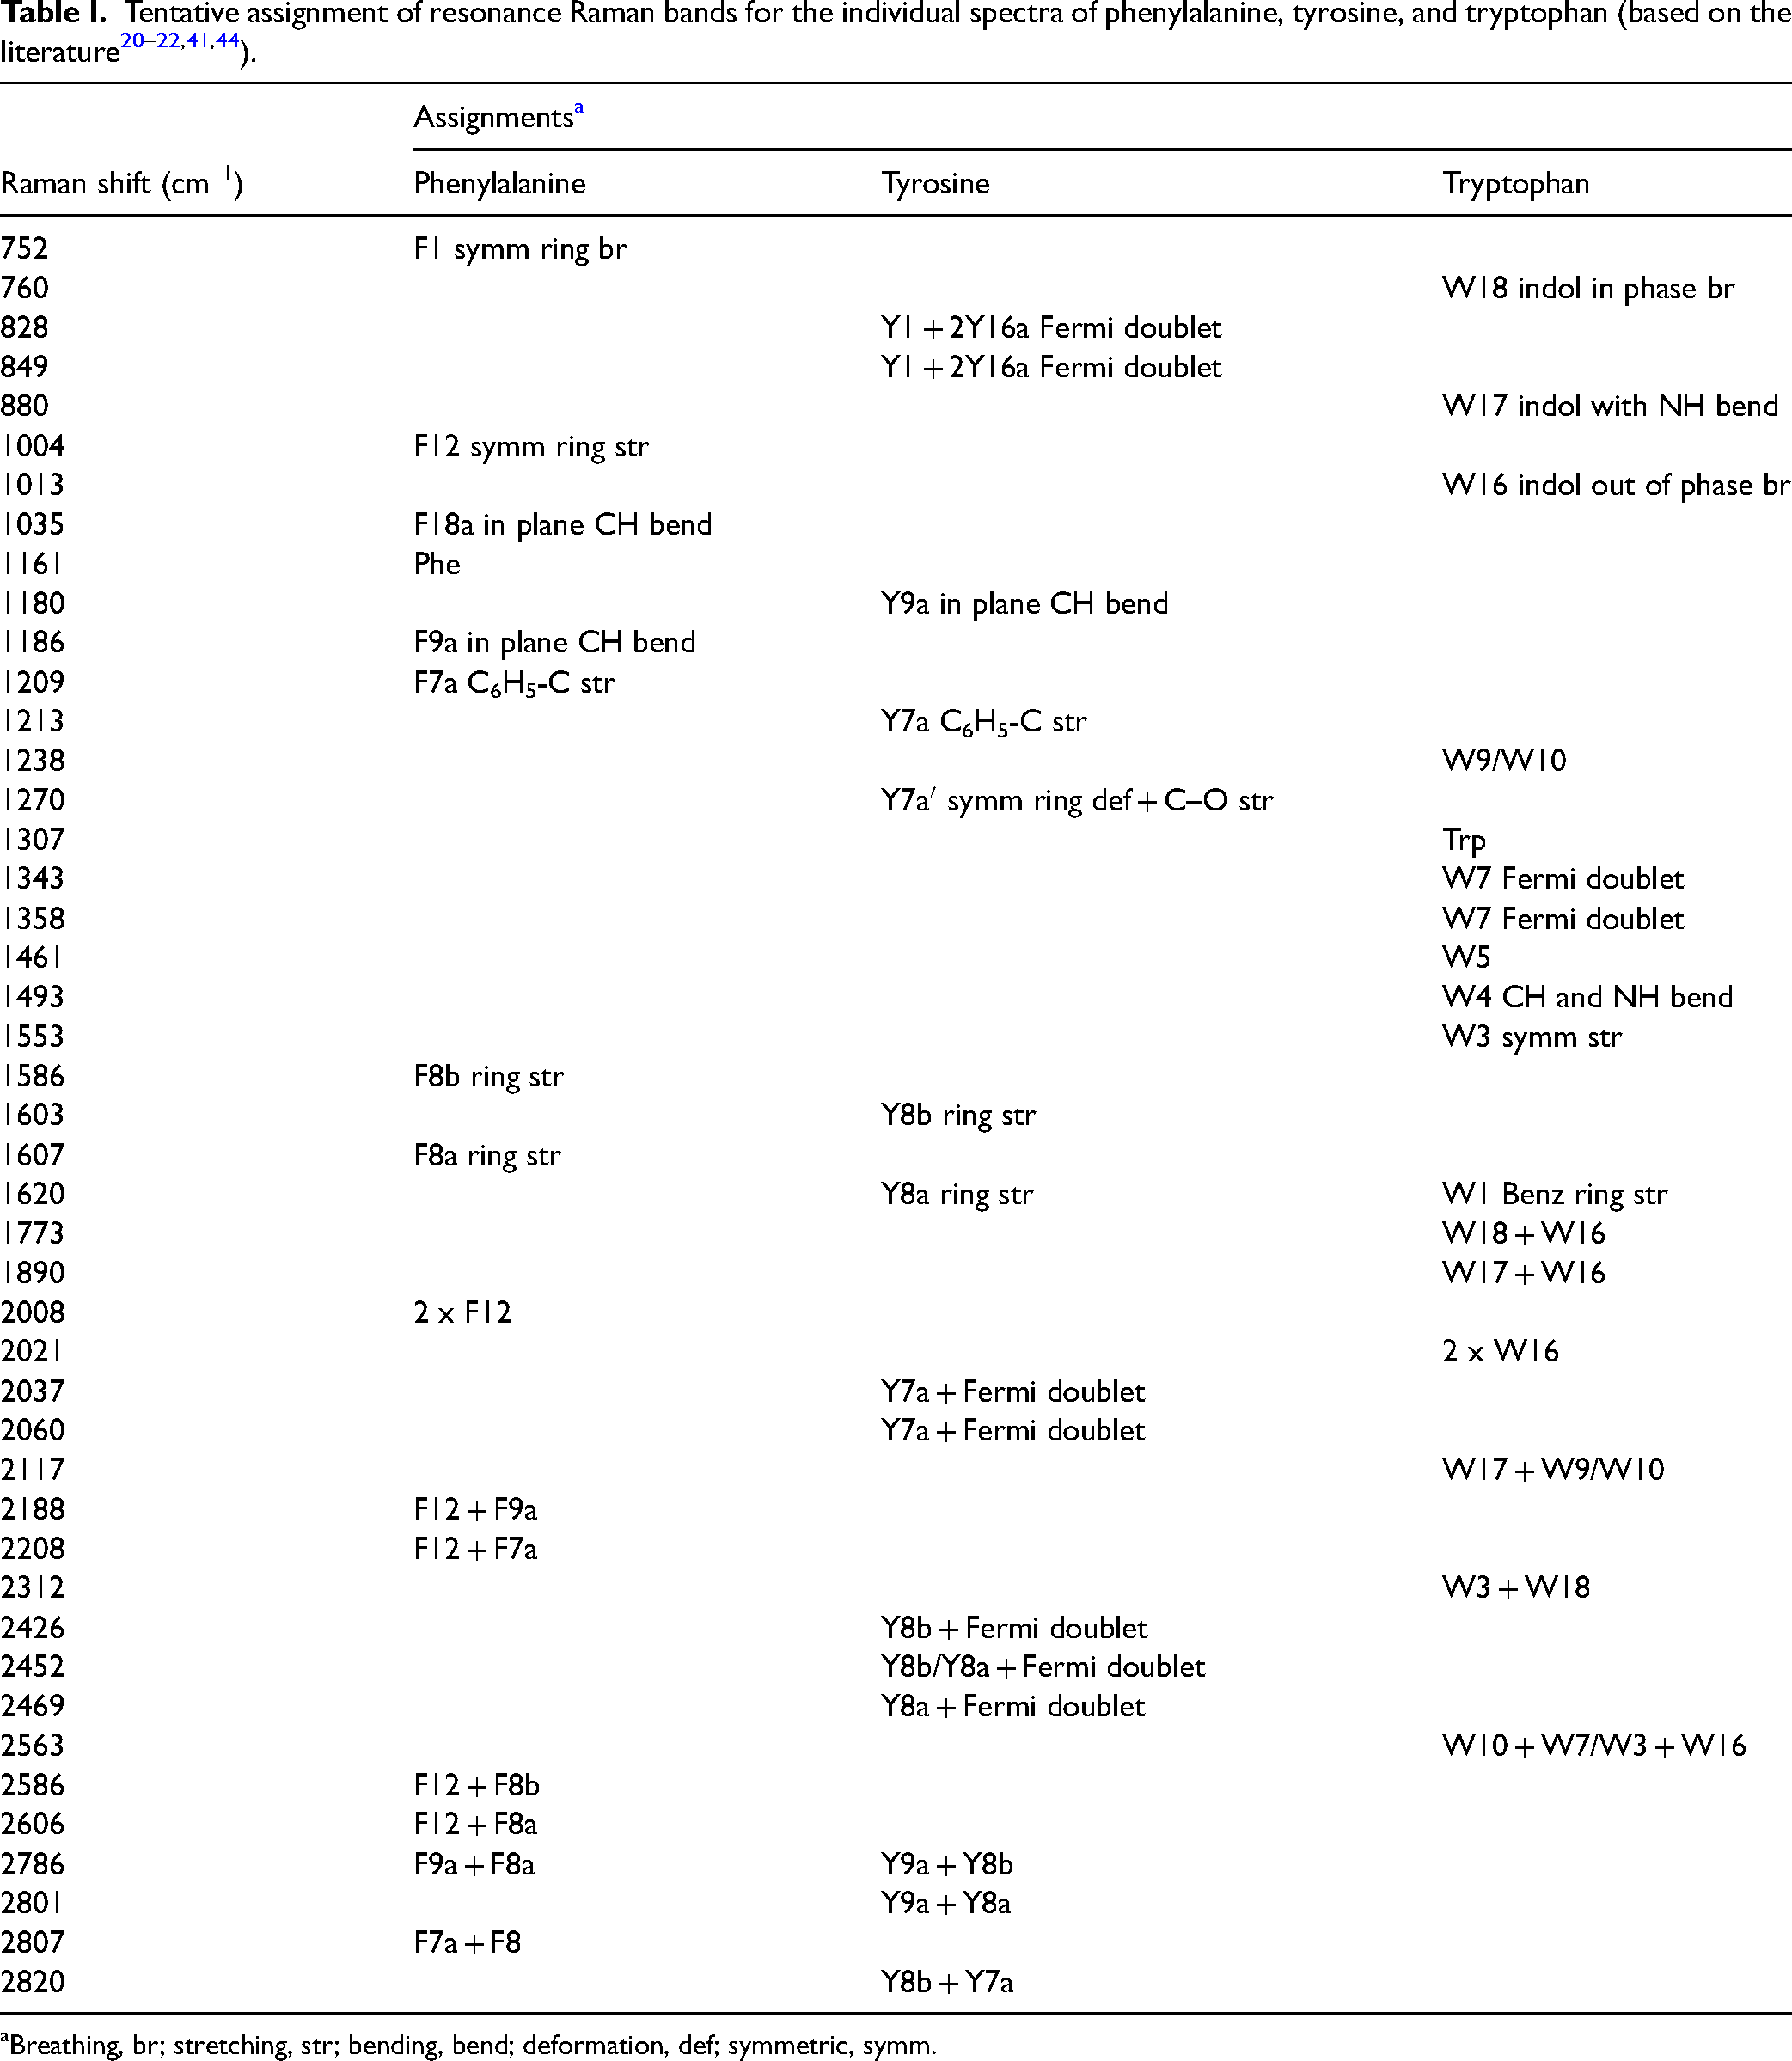
Breathing, br; stretching, str; bending, bend; deformation, def; symmetric, symm.
The electronic distributions and nuclear displacements in an electronic transition are directly connected to the enhancement selectivity. The mechanisms of the resonance enhancement and its relation to the corresponding excited states of the three amino acid chromophores at excitation wavelengths in this spectral range have been extensively discussed.20–22
The contribution of the signals from tryptophan is visible less clearly at a higher frequency due to the convolution of the different ν8 modes with W1. However, the intense W3 band at 1553 cm–1 in the spectra of the proteins, as well as pronounced signals of W7 at 1340 cm–1 and W16 at 1013 cm–1 presenting as a shoulder of the F12 phenylalanine band, show the strong contribution of tryptophan to serum albumin at this excitation wavelength, which is in good agreement with spectra from α-lactalbumin and hemoglobin.16,33 It should be noted that in BSA (Fig. 1b, top red trace), only two tryptophan residues are responsible for this relative intensity, and in HSA they are reduced accordingly (Fig. 1b, bottom red trace), as caused by a single tryptophan residue that is present in the protein.
To discriminate bands that can be assigned to other parts of the protein than the amino acid side chains, a mix of the individual amino acids in the same concentration and ratio as in the BSA and HSA solution, respectively, was measured (Fig. 1b). Although the pronounced bands of the amino acids agree well with those from the protein solutions, several additional features associated with amide bonds of the protein can be found in the region above 1200 cm–1 (Fig. 1b).
At 1658 cm–1, the spectrum of the BSA protein shows a shoulder compared to the solution of the aromatic amino acids (Fig. 1b, upper pair of spectra) that can be attributed to the amide I bands of the protein backbone (combination of mainly C=O stretching and out-of-phase C–N stretching), which are known to be relatively weakly enhanced at excitation of 220 nm.16,33 The amide II band that is usually observed at ∼1550 cm–1, albeit also with a low signal at this excitation wavelength,16,33 is superimposed here by the 1553 cm–1 W3 band of tryptophan (Fig. 1b, upper pair of spectra). Many signals of tryptophan are stronger in the protein solution compared to the amino acid mixture, particularly the former W3, the W7 doublet, W16 and W18 modes are all stronger for the protein solution than modes in the amino acid mixture. The indole side chains of the tryptophans in BSA and HSA do not participate in the formation of H-bonds, and according to the protein structure, at least one tryptophan in BSA and the tryptophan in HSA are buried in the structure in a hydrophobic pocket. Changes in the environment of the tryptophan can be reflected in the W7 doublet at 1340 and 1358 cm–1. Rava and Spiro observed an increase in the 1340/1360 band ratio when solvent exposure of the tryptophans in α-lactalbumin increased, 16 and Harada et al. 34 related ratio variations to changes in the hydrophobicity of the indol environment. The change in relative intensity is likely due to an altered environment of the tryptophan. However, the presence of broad Raman signals in the region between 1250 cm–1 and 1380 cm–1 can be attributed to the amide III vibrations from the protein backbone, albeit they are only weakly enhanced under the excitation conditions chosen here, 35 complicates a straightforward conclusion on the type of change in the environment of the tryptophan(s) in the proteins.
Between 1400 and 1500 cm–1, the spectra of the two proteins show a contribution by vibrational modes related to proline vibrations, particularly from the imide peptide group 36 that forms a shoulder to the W3 band of tryptophan at 1459 cm–1. The asymmetric band has a maximum at 1443 cm–1 that can be related to intramolecular hydrogen bonding from the carbonyl group that is weak. 37 However, the presence of 28 and 24 proline residues across the whole BSA and HSA proteins, respectively, and their possible multiple conformations can explain the broad band observed in the 1400–1500 cm–1 range as an overlap of the imide bands.
Overtones and Combinations
The resonant excitation of the Raman spectra enables the observation of overtones and combination bands that can provide additional information on the structure and interactions of the protein molecules.38–40 Figure 2 shows the spectra of the two proteins and of the three amino acids in the spectral range from 1800 to 2900 cm–1. The spectra of the proteins are dominated by the contributions of the combined bands of the phenylalanine residues, 21 which is the most abundant aromatic amino acid in both proteins, with 27 residues in BSA and 31 residues in HSA. The combination of the high-intensity F8a and F8b bands with F9a and F7a bands overlap, 21 nevertheless producing a set of distinct, well-resolved bands (Fig. 2, compare first three spectra). The bands around 2600 cm–1 can tentatively be assigned to the combination of F12 with F8a and F8b in phenylalanine, 21 also based on the combination bands that are found for toluene. 41 There are also other bands in the spectrum that we assign to combinations with F12, in particular, the signals around 2200 cm–1. The first overtone of F12 is observed at 2008 cm–1, albeit at a much lower strength than the combination bands (Fig. 2, Table I).
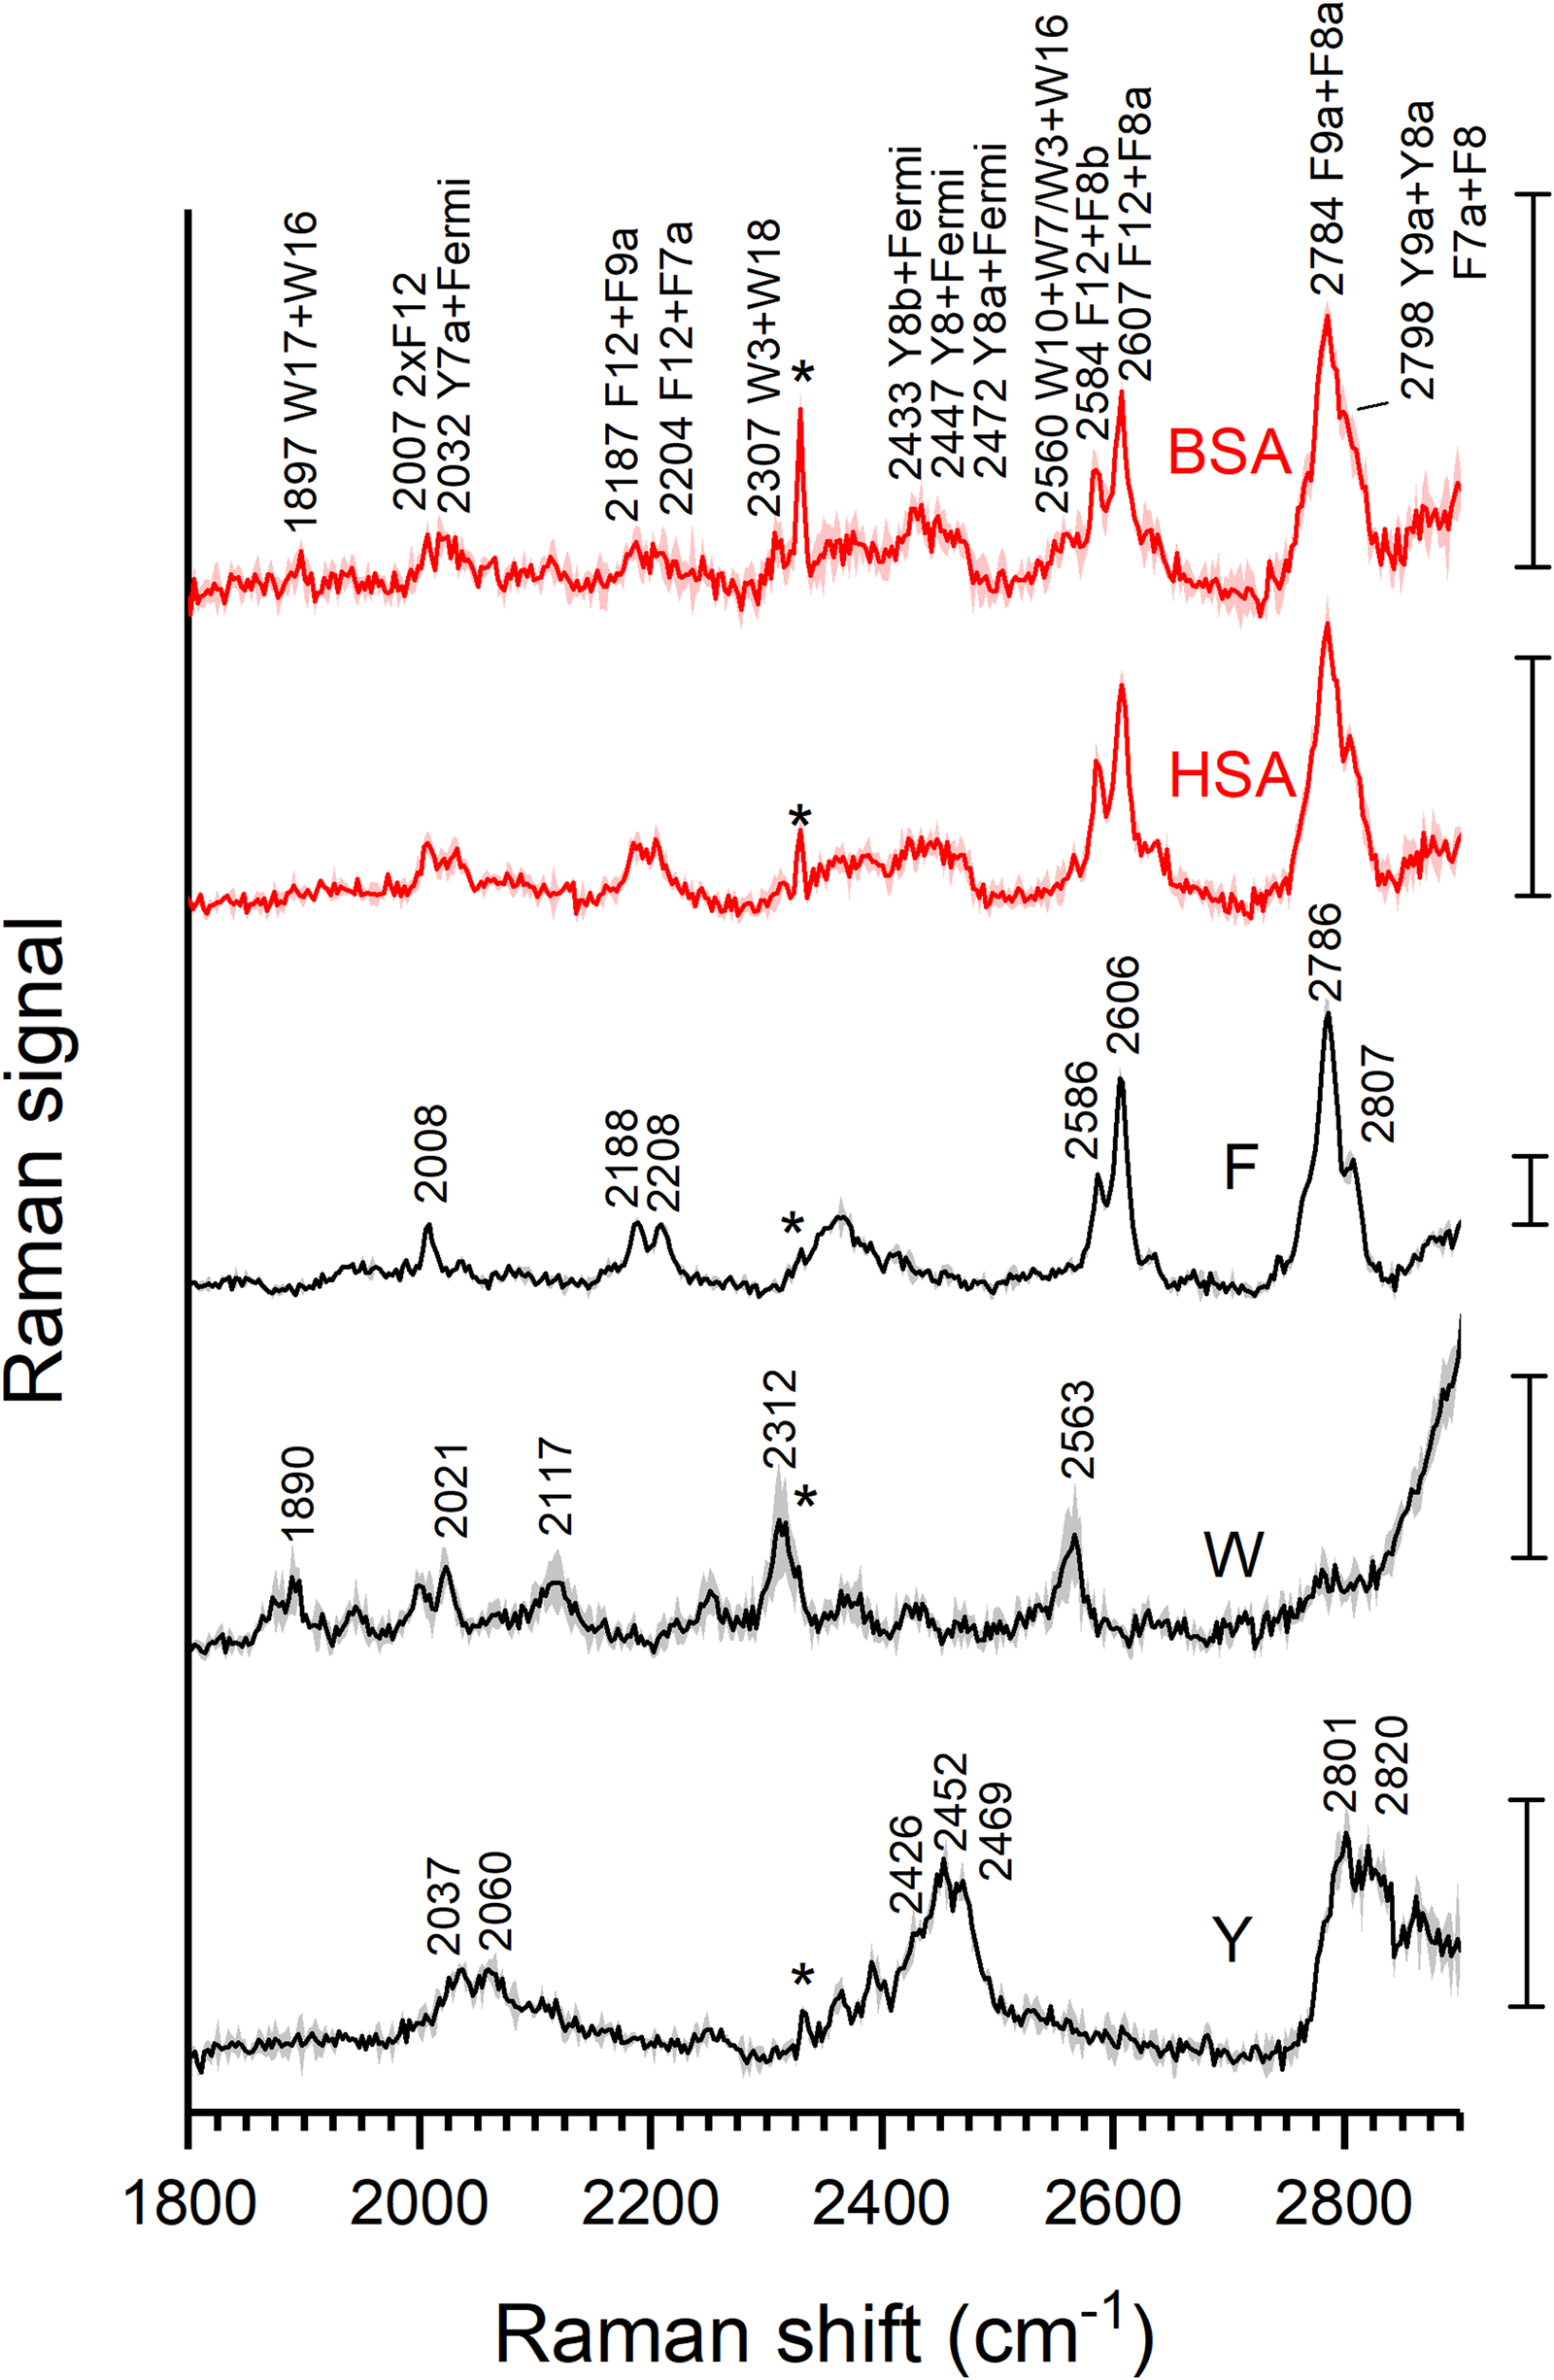
Average resonance Raman spectra and corresponding standard deviation of the 1800–2900 cm–1 range of aqueous solutions of tyrosine 1 mm (Y, black trace), tryptophan 0.1 mm (W, black trace), phenylalanine 1.35 mm (F, black trace), HSA 50 µm (lower red trace), and BSA 50 µm (upper red trace). Cell peak marked with an asterisk. Scale bar: 1 count.
Despite a spectral signature that is rich in combination bands, tryptophan shows a relatively weak contribution to the spectrum of the proteins because of its low abundance (Fig. 2). The most prominent combination bands in the spectrum of pure tryptophan (Fig. 2) are at 1890, 2312, and 2563 cm–1, and the 2021 cm–1 can be assigned to the first overtone of the W16 mode (Table I). 21 Of these, only the spectrum of BSA that has two tryptophans per protein molecule, contains the pronounced combination of W10 with W7 and W16 as a shoulder at 2583 cm–1 (Fig. 2, first spectrum). It is absent from the spectrum of HSA which has only one single tryptophan.
The combination bands brought about by the resonance enhancement of the tyrosine vibrations are less sharp than in phenylalanine (Fig. 2, bottom trace) but also quite pronounced due to the relative abundance of this amino acid. The typical Fermi doublet at 830–850 cm–1 is not greatly enhanced under excitation at 220 nm (Fig. 1c), 20 but it gives rise to the bands at 2037–2060 cm–1 and 2452–2469 cm–1 (Fig. 2). 21 In the 2750–2850 cm–1 region, several bands overlap that could be assigned the combinations of Y8a or Y8b with Y9a and Y7a. A combination band of vibrational modes similar to Y8 and Y9a was observed at ∼2800 cm–1 for the UVRR spectrum of di-substituted p-xylene where it yields a well-resolved signal at this position. 41 In the spectra of the proteins (Fig. 2, red traces), the sharp features of phenylalanine at 2786 and 2807 cm–1 are superimposed with these tyrosine signals (Fig. 2, compare red with black). Other, although weaker contributions of the tyrosine modes to the spectra of the proteins are found at 2037–2060 cm–1 and 2452–2469 cm–1. Also, in this spectral region, the spectra of the proteins are dominated by the amino acid side chains of the three aromatic residues, as is illustrated by the data from amino acid mixtures in Figs. S1a and S1b, blue and red spectra (Supplemental Material).
Assignment of some of the vibrations to tyrosine, also in the frequency range of the overtones, is facilitated by comparing the spectrum of the amino acid mixture with that of a mixture containing deuterated tyrosine (Figs. S1a and S1b, green traces). As expected, and in agreement with previous work, 42 deuteration changes the vibrational frequencies of fundamental modes in the UVRR spectrum of tyrosine (Fig. S2a). In the 1800–2900 cm–1 region, some of the combination bands in the spectrum of d4-tyrosine appear at similar Raman shifts to the bands from tyrosine. Nevertheless, they originate from combinations of other bands and coincide in the deuterated and nondeuterated molecule. In agreement with this, some of the features in the spectrum of d4-tyrosine (Fig. S2b) and the amino acid mixtures containing it (Fig. S1a and S1b, green traces, Supplemental Material) have different band shapes and widths. Specifically, the bands at 2450 cm–1 and 2467 cm–1 in the spectrum of d4-tyrosine, there (possibly) involving the combination of Yd8 with Yd9a or Yd18a modes, have similar Raman shifts as the bands at 2452 cm–1 and 2469 cm–1 in the nonlabeled tyrosine spectrum, the latter resulting from the Y8a mode and the 830–850 cm–1 Fermi doublet (Fig. S2b). 21 Similarly, the signals ∼2800 cm–1, where the combination bands of Yd8 and Yd7a′ or an unassigned band at 1203 cm–1 in the d4-tyrosine have a similar Raman shift as the combinations of the Y8 modes with Y9a or Y7a in the nonlabeled tyrosine spectrum (Fig. S2b, Supplemental Material).
A comparison with the spectra of the proteins with those of the corresponding mixtures of amino acids (Fig. S1, Supplemental Material) indicates that the spectra in this region are devoid of signals from the protein backbone, in agreement with their low contribution to the fingerprint spectra shown in Fig. 1.
Overtones in the Spectral Region From 3800 to 5100 cm–1
In the spectral region above the strong bands assigned to fundamentals of the O–H stretching region of water, we also observe bands in the spectra of the two proteins and two of the amino acids that were absent from the spectra of the cell, water, or phosphate buffer (data not shown). Despite the relatively low signal-to-noise ratio, the asymmetric band shapes of the observed signals suggest a strong overlap of different bands. The spectrum obtained with tryptophan largely represents that of a background, which can be explained by the different enhancement mechanism that is in place at this excitation wavelength compared to phenylalanine and tyrosine, which results already in differences in the enhancement of the spectrum below 1800 cm–1 discussed above,21,22 as well as in the very low abundance of this amino acid compared to that of phenylalanine and tyrosine in both proteins.
The spectrum of phenylalanine (Fig. 3) shows four broad features that are composed of several overlapping bands. The high similarity of several of these broad features or positions of their shoulders with those in the tyrosine spectrum (Fig. 3, bottom traces) suggests that similar modes for both amino acids combine in these bands at high frequency. In agreement with the absence of first overtones of the weaker fundamentals of F9a, F7a, Y9a, and Y7a their higher-order overtones are unlikely to contribute here. Overtones of the much stronger F8 and Y8 modes could contribute to the spectrum, with an overlap of the first-order overtones with the water band. Considering their combinations with other vibrational modes, several features in the spectra of the proteins and the amino acid mixtures could be explained. The broad band at ∼4384 cm–1 for phenylalanine can be tentatively assigned to the combination of the F8 overtones with the F7a or the F9a bands, and in a similar fashion, the band at ∼4399 cm–1 in the tyrosine spectrum could be a combination of the Y8 overtones in with the Y7a and Y9a modes (Fig. 3, red spectrum). For these two bands in each amino acid spectrum, the origin could be related to modes that are similar in both aromatic rings, both in the type of vibration and in their Raman shifts. For both amino acids, the band at ∼4800 cm–1 can be related to the second-order overtone of their 8a and 8b modes and their combinations. The phenylalanine band is centered at a slightly lower frequency than the band of tyrosine (Fig. 3, bottom), in accordance with the differences in Raman shifts of the F8a and F8b modes with the Y8a and Y8b modes. In agreement with this, the second overtones of the Y8 bands shift to a lower frequency by ∼80 cm–1 in d4-tyrosine (Fig. S2c, Supplemental Material) and in the two mixtures of the three amino acids (Fig. 3, compare green and blue spectra). The effect is smaller for the combinations.
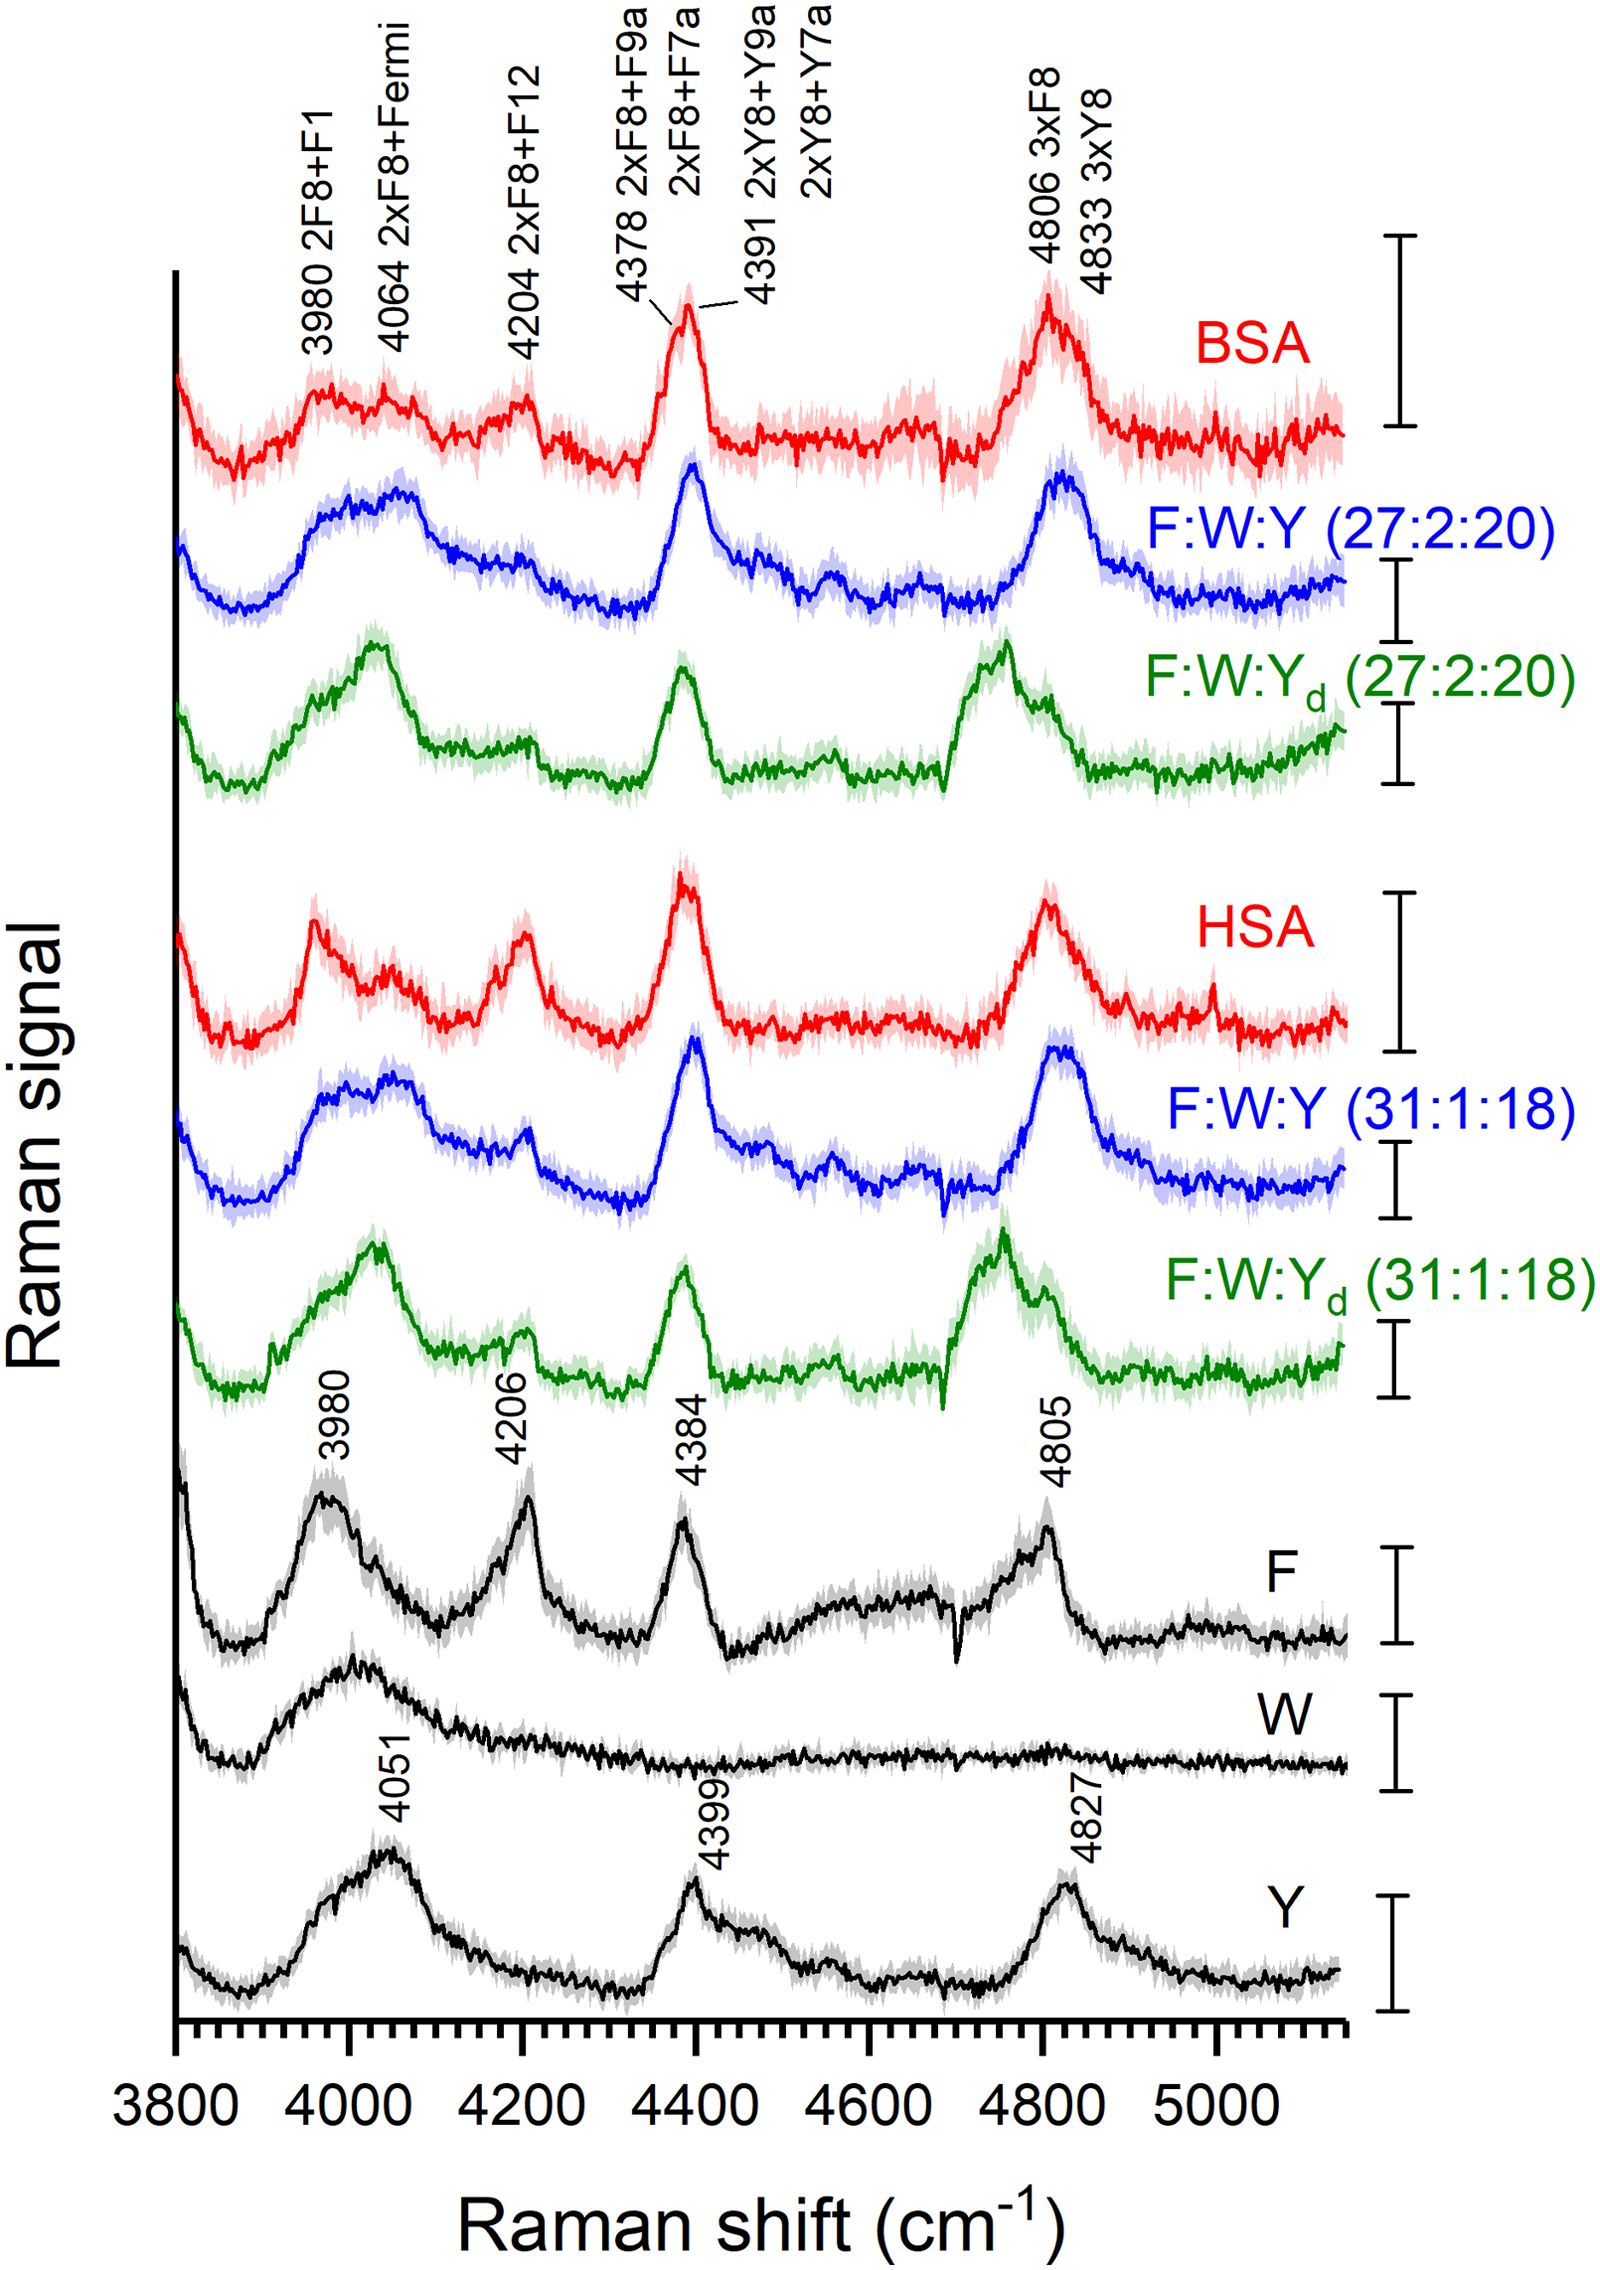
Average resonance Raman spectra and corresponding standard deviation of the 3800–5100 cm–1 range of aqueous solutions of tyrosine 1 mm (Y); tryptophan 0.1 mm (W); phenylalanine 1.35 mm (F); HSA 50 µm (red trace); a solution of tyrosine, tryptophan, and phenylalanine in a concentration and ratio similar to the amino acids in the HSA solution (F : W : Y 31 : 1 : 18, blue trace); and a solution of deuterated tyrosine, tryptophan, and phenylalanine in a concentration and ratio similar to the amino acids in the HSA solution (F : W : Yd 31 : 1 : 18, green trace); BSA 50 µm (red trace); a solution of tyrosine, tryptophan, and phenylalanine in a concentration and ratio similar to the amino acids in the BSA solution (F : W : Y 27 : 2 : 20, blue trace), and a solution of deuterated tyrosine, tryptophan, and phenylalanine in a concentration and ratio similar to the amino acids in the BSA solution (F : W : Yd 27 : 2 : 20, green trace). Scale bar: 1 count.
The lower frequency bands in this region show less similarity for the two amino acids phenylalanine and tyrosine. In phenylalanine, the band at ∼4200 cm–1 could arise from a combination of the F8 overtones with the F12 ring mode, absent in the tyrosine spectrum. The band at ∼4051 cm–1 in the tyrosine spectrum, a possible origin is a combination between the Y8 overtones and the 830–850 cm–1 Fermi doublet, rendering the broadband that is observed. The band at 4030 cm–1 in the d4-tyrosine spectrum (Fig. S2c, Supplemental Material) could be potentially assigned to the combination of the Yd9a and Yd18a modes with the first Y8 overtones, and the band at 4379 cm–1 to a combination of the Yd7a′ mode and the unassigned 1203 cm–1 mode with the first Y8 overtones. The possible origin for the feature with a maximum ∼3980 cm–1 is less clear, as a combination of the F8 overtones and the F1 mode at 752 cm–1 would include a relatively weak fundamental that does not appear to participate in other combination bands in the UVRR spectrum of phenylalanine. In agreement with the differences observed in the average spectra of the two proteins HSA and BSA in this spectral region (Fig. 3, red traces), the individual spectra of the technical replicates were subjected to a principal component analysis, using the spectral range from 3870 to 5000 cm–1 (Fig. S3a, Supplemental Material). The variance that is contained in the first two principal components points to differences in the bands at ∼4204 and ∼3980 cm–1 (Fig. S3b, Supplemental Material) that we have assigned to phenylalanine (cf. Fig. 3). This is in good agreement with the differences in phenylalanine content of four residues, with 31 such side chains in HSA and 27 phenylalanines in BSA.
So far, the frequency range discussed here has been used to characterize the overtones of structural amide and methyl bonds in HSA using NIR spectroscopy. 43 Different from the reported NIR spectra that display, for example, overtones of the amide B and amide II signals and were therefore used for studies of the secondary structure of HSA, 43 the signals in the 220 nm excited RR spectra are complementary, as they allow observation of the aromatic amino acid side chains of the proteins.
Conclusion
The UVRR spectra of the two very similar serum albumins in solution are in good agreement with the UVRR spectra of other proteins obtained under similar excitation conditions.16,33 The spectra are dominated almost entirely by the large enhancements of the amino acids tryptophan, tyrosine, and phenylalanine. The slightly varying relative intensities of the bands assigned to the three amino acid side chains reflect the small variations in their relative content, specifically the reduction from two to one tryptophan per protein when comparing HSA to BSA. The high sensitivity toward tryptophan presence and interaction that was observed could be useful to study the interaction of binding sites that are known to contain tryptophan residues of the protein with ligands in the future. The comparison of the protein spectra with solutions containing these amino acids in a concentration ratio that corresponds to those in the proteins reveals a weaker contribution by the amide I and amide III modes to the spectra of both proteins, as expected for this excitation wavelength.
The low amount of tryptophan does not enable the use of its overtones and combination bands to study this amino acid in the protein, but the spectra in the region above 1900 cm–1 were found to be rich in bands of phenylalanine and tyrosine. Making use of the overtones and combination bands in the Raman spectrum of the proteins could help better understand the structural characteristics of these biomolecules. Our assignments of spectral features in the range of Raman shifts from 3800 to 5100 cm–1 to combinations comprising fundamentals and overtones of tyrosine and phenylalanine were supported by experiments with amino acid mixtures that contain deuterated tyrosine, and by spectral differences between the two proteins that agree with a slightly varied phenylalanine content. Therefore, the high-frequency region of the UVRR spectra could provide information that is complementary to NIR absorption spectroscopy of the proteins, specifically in studies with biofluids, such as whole serum.
Supplemental Material
sj-docx-1-asp-10.1177_00037028231183728 - Supplemental material for Ultraviolet Resonance Raman Spectra of Serum Albumins
Supplemental material, sj-docx-1-asp-10.1177_00037028231183728 for Ultraviolet Resonance Raman Spectra of Serum Albumins by Cecilia Spedalieri, Julian Plaickner, Eugen Speiser, Norbert Esser and Janina Kneipp in Applied Spectroscopy
Footnotes
Acknowledgments
We thank Marco Vastag (ISAS) for technical support with the UV Raman application lab setup.
Declaration of Conflicting Interests
The authors declared no potential conflicts of interest with respect to the research, authorship, and/or publication of this article.
Funding
The authors disclosed receipt of the following financial support for the research, authorship, and/or publication of this article: This work received financial support from the Ministry of Culture and Science of the state of North Rhine-Westfalia, the Senate Chancellery of the federal state of Berlin, and the Federal Ministry for Education and Research (BMBF). Norbert Esser and Janina Kneipp received funding from project EFRE 1.8/07.
Supplemental Material
All supplemental material mentioned in the text is available in the online version of the journal.
References
Supplementary Material
Please find the following supplemental material available below.
For Open Access articles published under a Creative Commons License, all supplemental material carries the same license as the article it is associated with.
For non-Open Access articles published, all supplemental material carries a non-exclusive license, and permission requests for re-use of supplemental material or any part of supplemental material shall be sent directly to the copyright owner as specified in the copyright notice associated with the article.