
Abstract
Raman spectroscopy of fine-grained hydrothermal alteration minerals, and phyllosilicates in particular, presents certain challenges. However, given the increasingly widespread recognition of field portable visible–near infrared–shortwave infrared (Vis-NIR-SWIR) spectroscopy as a valuable tool in the mineral exploration industry, Raman microspectroscopy has promise as an approach for developing detailed complementary information on hydrothermal alteration phases in ore-forming systems. Here we present exemplar high-quality Raman and Vis-NIR-SWIR spectra of four key hydrothermal alteration minerals (pyrophyllite, white mica, chlorite, and alunite) that are common in precious metal epithermal systems, from deposits on the island of Newfoundland, Canada. The results reported here demonstrate that Raman microspectroscopy can accurately characterize pyrophyllite, white mica, chlorite, and alunite and provide details on their compositional variation at the microscale. In particular, spectral differences in the 1000–1150 cm−1 white mica Raman band allows the distinction between low-Tschermak phases (muscovite, paragonite) and phases with higher degrees of Tschermak substitution (phengitic white mica composition). The peak position of the main chlorite Raman band shifts between 683 cm−1 for Mg-rich chlorite and 665 cm−1 for Fe-rich chlorite and can be therefore used for semiquantitative estimation of the Fe2+ content in chlorite. Furthermore, while Vis-NIR-SWIR macrospectroscopy allows the rapid identification of the overall composition of the most abundant hydrothermal alteration mineral in a given sample, Raman microspectroscopy provides an in-depth spectral and chemical characterization of individual mineral grains, preserving the spatial and paragenetic context of each mineral and allowing for the distinction of chemical variation between (and within) different mineral grains. This is particularly useful in the case of alunite, white mica, and chlorite, minerals with extensive solid solution, where microscale characterization can provide information on the alteration zonation useful for mineral exploration and provide insight into mineral deposit genesis.
Keywords
Introduction
Hydrothermal gold deposits contribute a noteworthy fraction of the world’s gold endowment, with the epithermal deposit class contributing up to 13% of the global gold production. 1 These deposits have widespread hydrothermal alteration that is formed due to the interaction of hydrothermal fluids with the enclosing wall rocks, and the alteration mineral assemblages provide a record of the physico–chemical characteristics of hydrothermal fluids.2−5 The study of hydrothermal alteration is, therefore, crucial for the understanding of the geochemical processes involved during fluid–rock interaction and can be used as a tool for exploration, since specific alteration assemblages may be related to significant ore-forming events.2−5 Hydrothermal alteration routinely involves the formation of new hydrous minerals, including various phyllosilicates (i.e., sheet silicates), and, in certain systems, sulfate minerals, such as alunite. Phyllosilicates are one of the most diverse and complex groups of silicates but share the common features of being hydrous (H2O and/or OH groups) and comprising parallel sheets of silicate tetrahedra and octahedra units.6,7 Characteristic phyllosilicates found in epithermal systems include pyrophyllite, the white mica group (including muscovite, phengite, and paragonite), trioctahedral chlorite group minerals (e.g., clinochlore, chamosite), illite, and smectite.2−5
Epithermal deposits are formed at shallow depths in volcanic arc environments, where two contrasting end-member styles are defined: high- and low-sulfidation. 8 High-sulfidation epithermal Au ± Cu (±Ag) deposits are associated with quartz ± alunite ± pyrophyllite ± dickite ± kaolinite alteration assemblages genetically linked to highly acidic and oxidizing magmatic–hydrothermal fluids.2,5 The hydrothermal alteration of the host rocks commonly develops in a concentric pattern, with a core of vuggy silica (i.e., residual silica due to intense leaching of rocks by highly acidic fluids) that transitions sharply to quartz–alunite ± pyrophyllite ± kaolinite ± dickite, and then to an outer halo of propylitic (epidote + chlorite) alteration. 2 Low-sulfidation epithermal Ag–Au deposits contain vein and selvage alteration minerals formed from neutral and reducing hydrothermal fluids.4,5 Hydrothermal alteration zoning includes a highly quartz-altered (i.e., silicified) inner alteration zone characterized by the presence of chalcedony, sericite, adularia, and mixed layered illite–smectite. 4 This proximal alteration is most often surrounded by an outer alteration halo comprising chlorite, calcite, and epidote. 4 A third epithermal mineralization style, intermediate-sulfidation epithermal deposits, share many features with low-sulfidation epithermal deposits, but display an intermediate sulfidation-state assemblage indicated by minerals such as tetrahedrite/tennantite and low-Fe sphalerite. 4
Multiple studies have focused on the mineralogical and chemical characterization of hydrothermal alteration in epithermal systems through a combination of optical microscopy, scanning electron microscopy (SEM), electron probe microanalysis (EPMA), and/or X-ray diffraction (XRD).2,3,8−11 However, powder X-ray diffraction is a destructive technique, which does not preserve textural and paragenetic information, and the separation of fine-grained clay fraction minerals (mainly phyllosilicates) is a labor-intensive process that has only been implemented in a handful of hydrothermal alteration studies.11−16 In addition to the aforementioned techniques, visible–near infrared–shortwave infrared (Vis-NIR-SWIR) spectroscopy, and in particular the SWIR spectral range (1300–2500 nm), has been increasingly applied in mineral exploration and related research,17−21 linked to the availability of field-portable instruments (e.g., PIMA, Terraspec). These latter devices allow the identification of major Vis-NIR-SWIR active hydrothermal alteration minerals at the centimeter scale with widespread application to deposit-scale mapping and core logging.
The more detailed examination of phyllosilicates using microspectroscopic techniques, such as Raman microspectroscopy, benchtop infrared spectroscopy, and Fourier transform Raman (FTR) spectroscopy, is not as frequently deployed.22−30 Consequently, there is a lack of information linking the rock-scale spectroscopic features of hydrothermal alteration assemblages with the mineral-scale chemical information accessible by microspectroscopic techniques. Traditionally, this has been attributed to the challenges of fine grain size and poor crystallinity of hydrothermal alteration minerals, as well as to the presence of substantial fluorescence effects due to impurities (e.g., organic compounds, nano-inclusions, presence of sulfides and oxides, high Fe content in the mineral of interest, etc.) that limit the quantification of weak Raman signals.31,32 In addition, the application of Raman microspectroscopy to the study of phyllosilicates has the added overhead of relatively complex mineral structures and widely variable chemical compositions within this group of minerals. It is only relatively recently that Raman spectral features of phyllosilicates have begun to be studied and understood,32−34 supporting the forward use of Raman microspectroscopy for a wide range of potential applications in the study of hydrothermal ore deposits, planetary exploration,33,35−37 environmental geochemistry, 38 and natural clay pigments in historical paintings. 39
This paper presents the first integrated multi-scale spectroscopic study of key hydrothermal alteration minerals found in epithermal gold–silver systems and explores the significant potential of Raman spectroscopy in the study and characterization of phyllosilicates in hydrothermal ore systems in an effort to support the exploration and development of mineral deposits. The examples studied are from well-preserved epithermal precious metal deposits in the late Neoproterozoic rocks of the Avalon Zone terrane in Newfoundland, eastern Canada (Fig. S1, Supplemental Material), including: (i) Hope Brook high-sulfidation epithermal deposit, (ii) Hickey’s Pond high-sulfidation epithermal prospect, (iii) Heritage low-sulfidation epithermal prospect, (iv) Oval Pit pyrophyllite mine (barren high-sulfidation occurrence), and (v) Vinjer high-sulfidation epithermal prospect. The nature, textural characteristics, and compositional variations of the alteration minerals in these occurrences, in particular phyllosilicates, have been described by Arbiol et al. 11
The results reported in this contribution consist of: (i) high-quality Vis-NIR-SWIR and Raman spectra of key hydrothermal alteration minerals (alunite, pyrophyllite, white mica, and chlorite), (ii) characterization of the major spectral features of these minerals, their measurable compositional variations and their subsequent mineral classification, (iii) comparison between macro- and micro-analytical spectroscopic measurements, (iv) semi-quantitative links between Raman shift and chemical composition, and (v) implications for mineral exploration.
Major Macro- and Microspectral Features of Key Hydrothermal Minerals
This section focuses on the description of the main Vis-NIR-SWIR and Raman spectral features of key hydrothermal minerals, their band assignments, and the chemical information they provide. A detailed overview of the mineral structure, chemical formulae, and crystallographic considerations of key hydrothermal alteration minerals is provided in Supplemental Materials.
Visible–Near Infrared–Shortwave Infrared Spectroscopy
Visible–infrared–shortwave infrared (Vis-NIR-SWIR) spectroscopy is based on the absorption of incident electromagnetic radiation of wavelengths between 350 nm and 2500 nm. The absorption of specific wavelengths by minerals is mainly due to molecular bond vibrations (rotation, bending, and stretching of bonds) excited by this incident electromagnetic radiation.17,40 Bonds involving structural water (H2O) and hydroxyl (OH) groups generate the most characteristic absorption features; in particular, cation-hydroxyl bonds (i.e., vibration of OH bond in which the hydroxyl is linked to octahedrally coordinated atoms such as Al, Fe, and Mg).17,41 Phyllosilicates are hydrated, and consequently generate strong absorption features that allow their distinction and characterization. In general, SWIR spectra of phyllosilicates display absorption features close to 1400 nm (OH bond), 1900 nm (H2O bond), and additional, more variable, features close to 2200 nm (Al–OH bond), 2250 nm (Fe–OH bond), and 2330 nm (Mg–OH bond).18,41 Hydrous sulfates show a characteristic SO42– absorption band at ∼1800 nm and an OH absorption feature at ∼1400 nm. 42 However, the shape and exact position of the characteristic absorption bands of each mineral are determined by various parameters (e.g., dioctahedral/trioctahedral phyllosilicate structure, cation size, charge, and electronegativity)43,44 and thus provide information on the specific structure and composition of the mineral.17,18
Pyrophyllite
As an aluminum-rich hydrous phyllosilicate, pyrophyllite shows a strong OH absorption band at 1398 nm and a main Al–OH band at 2168 nm (Fig. 1a). Secondary OH absorption bands close to 950 nm and 1230 nm, and secondary Al–OH absorption bands at 2090 nm and 2320 nm are also observed.
45
SWIR and Raman spectra of various minerals. (a) SWIR spectra of the main groups of minerals considered in this study: pyrophyllite, white mica, chlorite, and alunite. SWIR spectra of minerals are from The Spectral Geologist (TSG) database. (b) Raman spectra of minerals belonging to the different major silicate groups and the sulfate group. Raman spectra of minerals are from the RRUFF database: forsterite (nesosilicate) from Sapat, Pakistan (RRUFF ID: R050117); epidote (sorosilicate) from the Calumet mine, Colorado, USA (RRUFF ID: R050131); elbaite (cyclosilicate) from Cruziero mine, Minas Gerais, Brazil (RRUFF ID: R050119); actinolite (inosilicate) from Harford County, Maryland, USA (RRUFF ID: R040063); muscovite (phyllosilicate) from Garnet Hill, Pennsylvania, USA (RRUFF ID: R040124); quartz (tectosilicate) from Piedras Parada, Veracruz, Mexico (RRUFF ID: R060604); alunite (sulfate) from El Indio Gold mine, Chile (RRUFF ID: R060430). (c) Raman spectra of the phyllosilicate minerals considered in this study. Raman spectra of minerals are from the RRUFF database: pyrophyllite from Cottonstone Mountain, North Carolina, USA (RRUFF ID: R050051); muscovite from Garnet Hill, Pennsylvania, USA (RRUFF ID: R040124); paragonite from Switzerland (RRUFF ID: R050447); clinochlore from the Callaghan Creek (RRUFF ID: R061080); chamosite from Slesse Creek (RRUFF ID: R060188).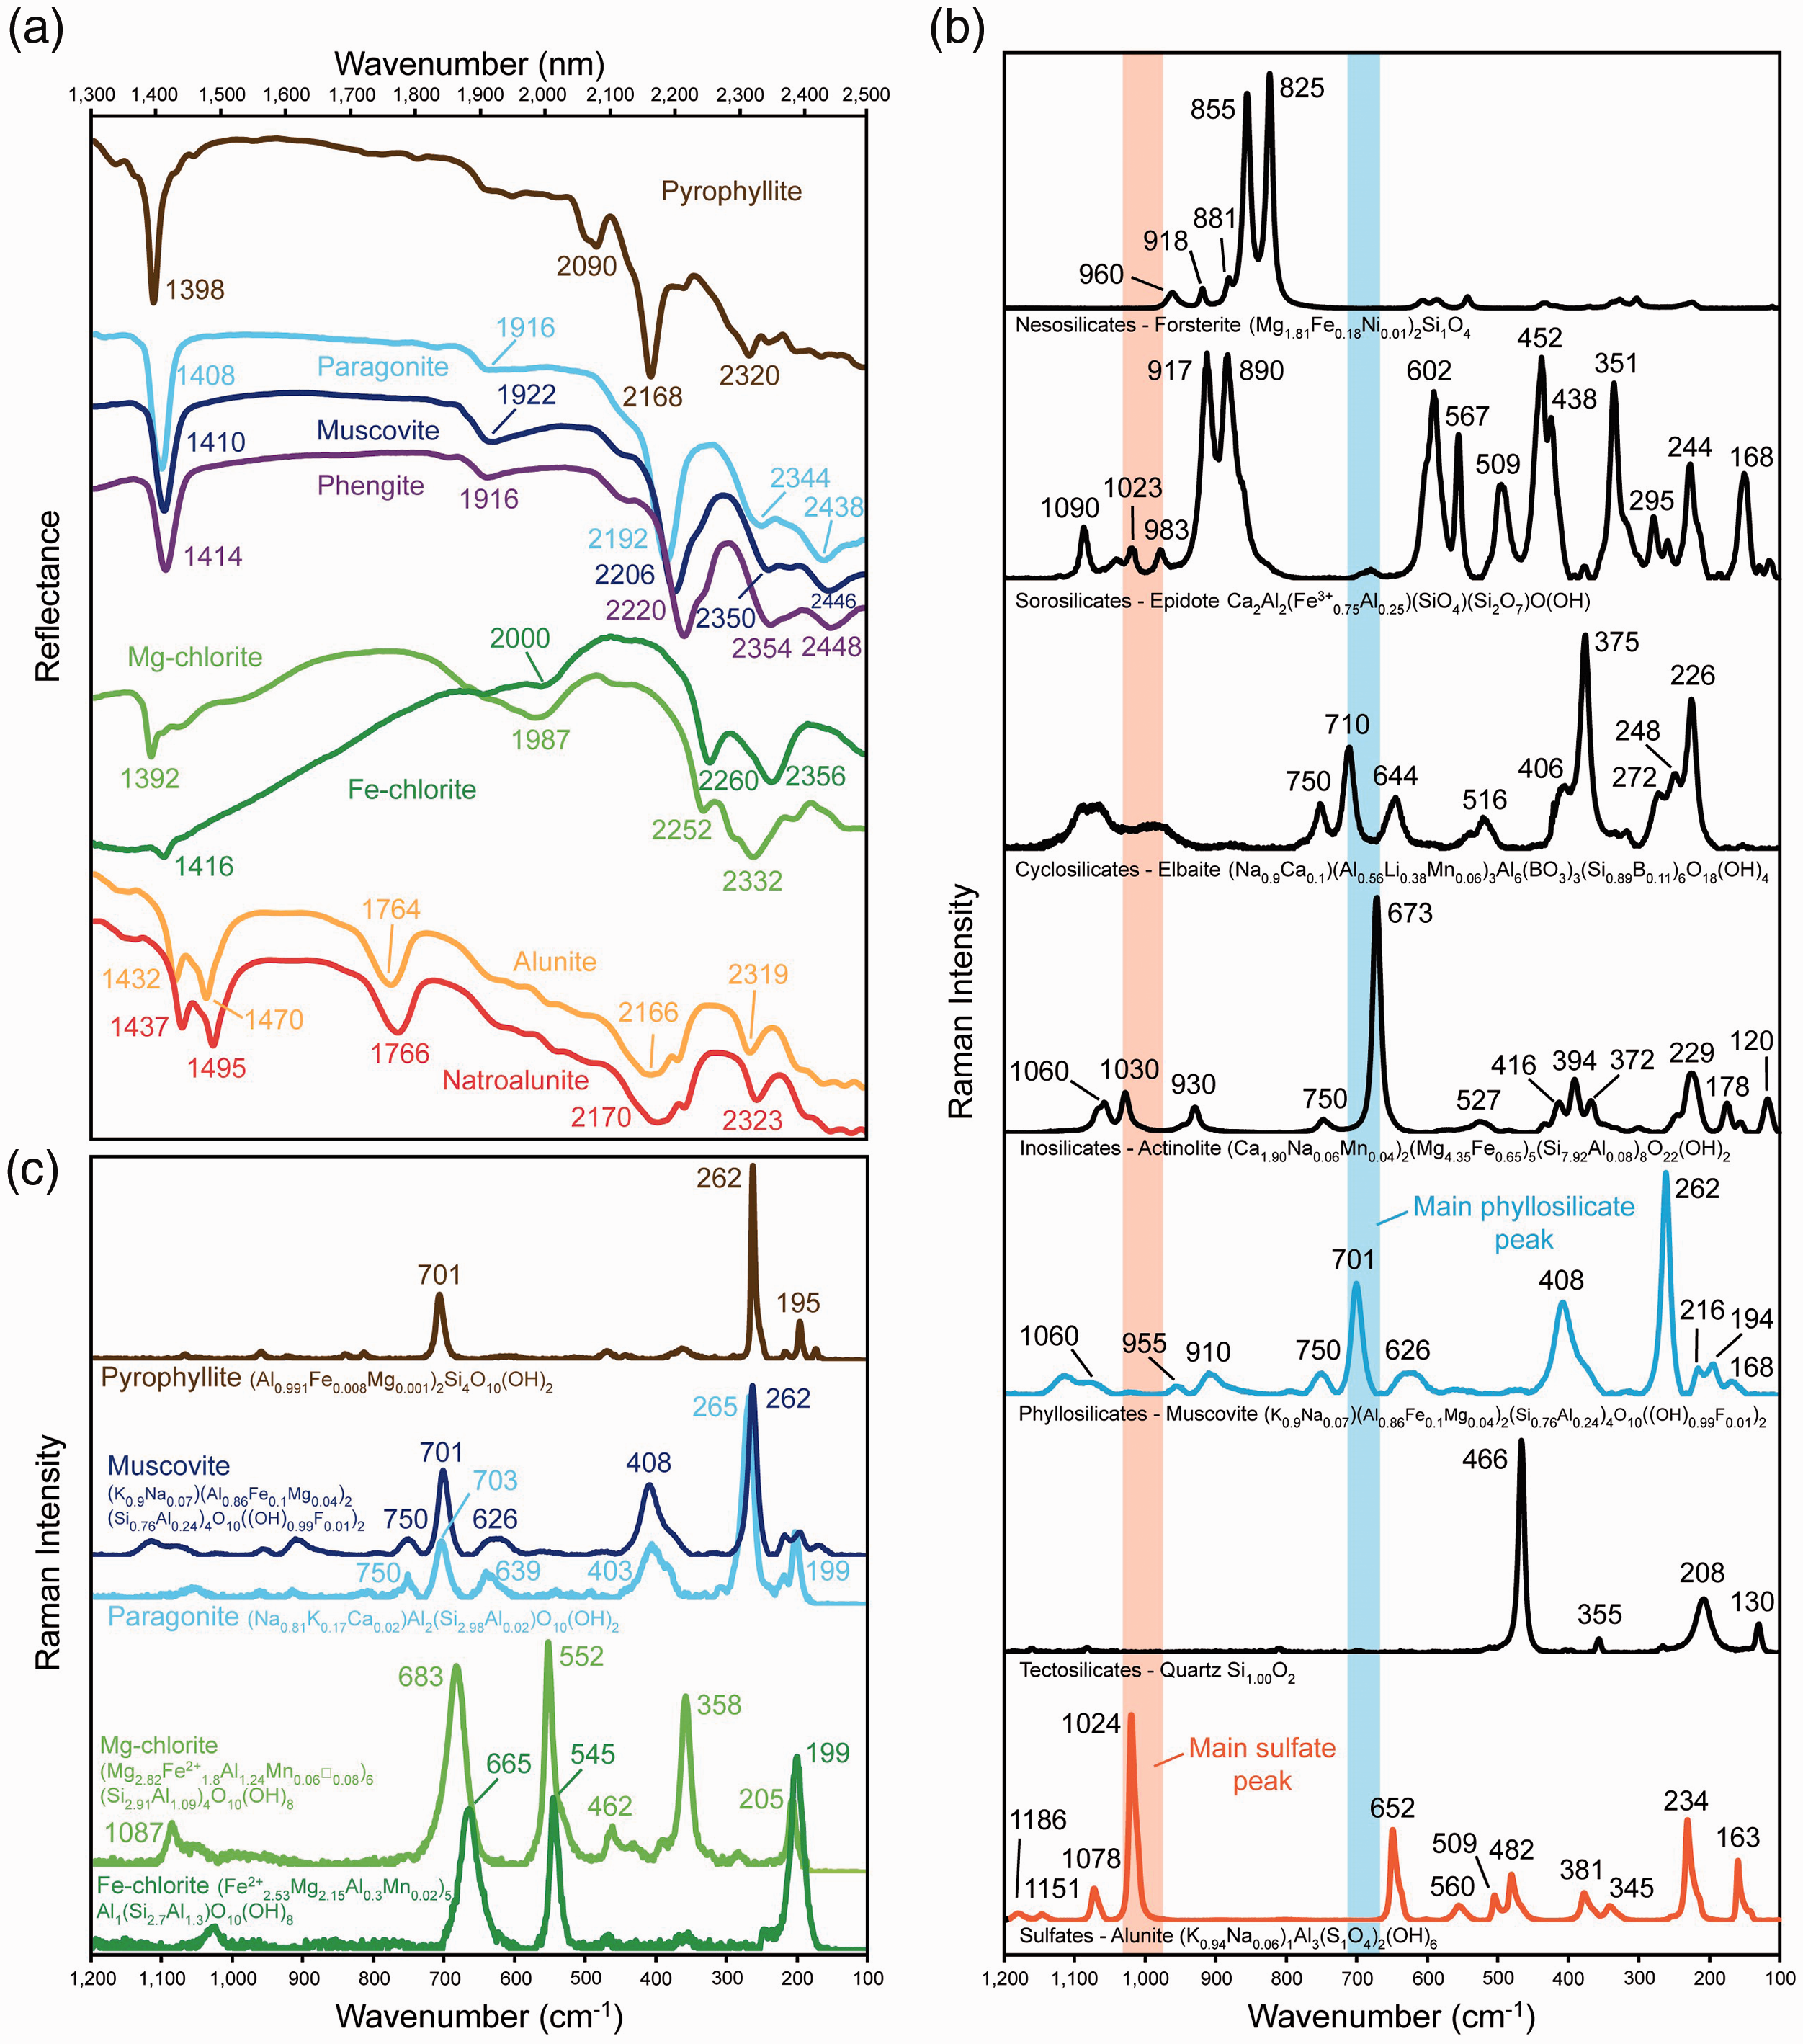
White Mica
White mica exhibits dominant absorption features close to 1414 nm (OH), 1910 nm (H2O), and 2200 nm (Al–OH) (Fig. 1a). Even though the presence of K+ or Na+ in the interlayer position of white mica does not affect the Al–OH bond length, the proportion of Al in octahedral coordination in muscovite, paragonite, and phengite is different, following the coupled octahedral–tetrahedral Tschermak substitution ((Mg,Fe2+)VI + SiIV ↔ AlIV + (Al,Fe3+)VI).43,46 The incorporation of Fe2+, Fe3+, Mg, and/or Al in the octahedral layer of white mica results in changes in the length of the Al(Fe,Mg)–OH bond, resulting in diagnostic shifts of the ∼2200 nm absorption band that are causally related to changes in white mica composition. Muscovite shows this absorption feature between 2198 nm and 2210 nm (Fig. 1a), whereas for paragonite (high proportion of octahedral Al) it is observed at lower wavelengths (<2198 nm; Fig. 1a) and phengite (low proportions of octahedral Al) shifts it to higher wavelengths (>2210 nm; Fig. 1a). 46 Discrimination between white mica and illite is only possible through observation of the absorption features at ∼1414 nm (OH) and ∼1910 nm (H2O), which are significantly deeper in illite due to the presence of hydration water in the space between T–O–T layers.18,34
Chlorite
Trioctahedral chlorite from the clinochlore–chamosite solid solution series (i.e., Mg–Fe series) presents a clear common OH absorption band at ∼1400 nm (Fig. 1a), with a weaker H2O absorption band at 1900–2000 nm (Fig. 1a). In addition, SWIR absorption bands at ∼2250 nm and ∼2350 nm (Fig. 1a) are related to the Fe–OH and Mg–OH bond, respectively. 46 Magnesium-rich and Fe-rich chlorite can be distinguished by their relative reflectance and a noticeable absorption shift between SWIR features. Clinochlore (Mg–chlorite) displays a distinct absorption band at ∼2330 nm (Mg–OH bond; Fig. 1a) and a shallower absorption band at ∼2250 nm (Fe–OH bond; Fig. 1a),45,46 consequent to the dominance of Mg2+ over Fe2+ in its structure. Chamosite (Fe–chlorite), on the other hand, exhibits a shift of the Mg–OH absorption feature to ∼2356 nm (Fig. 1a), with the presence of a deeper and shifted Fe–OH absorption band at ∼2260 nm (Fig. 1a).44,45 The precise position of such peaks depends on the exact composition of the analyzed chlorite within the clinochlore–chamosite series (e.g., Fe–Mg composition of the octahedral sheet, composition of the brucite sheet in the interlayer zone, presence of Fe3+, etc.), and peak positions intermediate between those reported for chlorite near-endmembers are most frequently observed. 46
Alunite
In the SWIR region, sulfates show a distinctive absorption feature at 1740–1800 nm (Fig. 1a) that is related to the SO42– bond. In addition to this feature, two doublet absorption bands (i.e., peaks in close wavelength proximity that produce a double peak absorption feature) are observed at ∼1430 nm and ∼1470 nm (Fig. 1a), related to OH bonds. 45 Absorption bands at ∼2170 nm and ∼2320 nm are attributed to Al–OH vibrations. 45 Wavelength variations in the ∼1470 nm band allow the distinction between K-rich alunite and Na-rich natroalunite.17,18 These spectral differences are due to the contrasting bond length/strength of K+ and Na+ linked to OH groups. 42 Specifically, an absorption band closer to 1470 nm is indicative of alunite, whereas an absorption approaching 1495 nm is indicative of natroalunite.17,18 This diagnostic variation is advantageous in exploration for high-sulfidation epithermal deposits since it can enable compositional discrimination between alunite minerals formed by hypogene and supergene processes.2,4
Raman Microspectroscopy
The major Raman peaks of a mineral derive from the chemical bonds with the highest degree of covalency, in particular, for the minerals discussed herein, Si–O–Si in silicate tetrahedra, and SO4 in sulfate groups.32,34 In the case of silicates and sulfates, the predominant Raman spectral signatures occur between 100 cm−1 and 1200 cm−1 (Fig. 1b), a wavelength range that is referred to as the spectral range of fundamental vibrations.32,34 Structural water (H2O) and hydroxyl groups (OH) produce a set of peaks in the spectral range of >3000 cm−1.32,34
Phyllosilicates display characteristic Raman spectral features that are distinct from other silicate mineral groups in (Fig. 1b). All phyllosilicates display major Raman peaks in the 600–750 cm−1 range, with a prominent Raman band consistently located close to 700 cm−1, a set of weak Raman peaks between 800–1200 cm−1, and additional peaks in the <600 cm−1 spectral range (Fig. 1b).32,34 The 600–750 cm−1 peaks are associated with the Si–O–Si vibration mode. Peaks in the 800–1100 cm−1 range are due to the symmetric stretching vibration of Si–O bonds within the (SixOy)z– unit, and the <600 cm−1 peaks are attributed to the breathing vibration mode of the T–O–T stacking sequence in the phyllosilicate structure.32,34 Hydroxyl groups (OH) foster sharp Raman peaks in the >3600 cm−1 region, and structural water (H2O) shows broad and highly variable peaks in the 3000–3700 cm−1 spectral range.32,34 Based upon the position of the strongest Raman peak in the 600–750 cm−1 spectral range, dioctahedral (>700 cm−1) and trioctahedral (<700 cm−1) phyllosilicates can be readily distinguished. 34 This is due to the effect that the difference in length of the M–O bond between dioctahedral and trioctahedral phyllosilicates has on the main Si–O–Si Raman band. 34 More subtle shifts in specific Raman peak positions can be attributed to structural or chemical changes, in particular changes in cation site occupancy, which allows the accurate identification of a wide range of phyllosilicates and provides information on mineral compositions. For a more comprehensive overview of the Raman spectral features of phyllosilicates the reader is referred to Wang et al. 32 and Gates et al. 34
Pyrophyllite
Raman spectra of pyrophyllite reported by Wang et al. 32 feature peaks at 193 cm−1, 260 cm−1, 360 cm−1, 470 cm−1, 706 cm−1, 958 cm−1, and 1075 cm−1. Figure 1c shows the spectrum of a natural pyrophyllite sample with prominent Raman peaks at 195 cm−1, 262 cm−1, and 701 cm−1. Even though the Raman bands of pyrophyllite were not attributed to specific bond vibrations by Wang et al., 32 Gates et al. 34 interpreted their vibration modes based on the scheme presented by Loh, 47 assigning the peak at 470 cm−1 to Si–O stretching modes, the peak at 958 cm−1 to Al2–OH vibrations, and the peak at 1075 cm−1 to Al–OH planar bending. The hydroxyl groups in pyrophyllite produce an extremely sharp peak at 3670–3675 cm−1, associated with the Al2–OH stretching mode.34,48−52 A second less common weak peak is located at 3647 cm−1, and it has been interpreted as the result of structural distortion 32 or as being associated with the AlFe3+OH stretching mode 44 occurring due to significant substitution of Al3+ by Fe3+ in the octahedral sheet.34,48
White Mica
Differences in the Raman spectra of discrete white mica compositions are challenging to quantify, as the solid solutions involved cause only subtle peak shifts. Pure muscovite shows distinct Raman peaks close to 196 cm−1, 263 cm−1, 411 cm−1, 702 cm−1, and 3625 cm−1 (Fig. 1b and c). 32 A characteristic feature of white mica in general is the presence of somewhat variable peaks on either side of the central phyllosilicate peak (at ∼702 cm−1), around 630–670 cm−1 and 750–760 cm−1 (Fig. 1b and c). According to Wang et al. 32 and Gates et al., 34 the exchange between Na+ and K+ in the interlayer position results in almost negligible shifts in Raman peak positions (<2–3 cm−1), and therefore, discrimination between muscovite and paragonite through Raman spectroscopy is challenging. However, discrimination between pure muscovite and more phengitic compositions is possible, given variations in a characteristic spectral feature in the 1000–1150 cm−1 spectral range. 53 Muscovite presents a broad low-intensity peak at 1050 cm−1, while phengite shows a shift of that peak towards 1115 cm−1. 53 This Raman peak shift is related to the Si (versus Al) content in tetrahedral coordination, where lower Si contents correspond to muscovite composition, and higher Si contents correspond to phengite. 53
Chlorite
In the spectral range of fundamental vibrations, clinochlore presents Raman peaks at ∼203 cm−1, 357 cm−1, 552 cm−1, and 683 cm−1 (Fig. 1c). 32 According to Wang et al., 32 an increase in octahedral Fe in the chlorite structure has a measurable impact on its Raman spectra, with a noticeable downshift of the major phyllosilicate Raman peak to ∼662 cm−1 for Fe-rich chlorite, as well as reduced intensity of the peak located at ∼357 cm−1. However, due to the lack of Raman spectral information on chamosite in the literature, further downshift of the central phyllosilicate peak due to the more complete substitution of Mg2+ by Fe2+ in the octahedral layer, together with other possible undocumented effects on spectra, cannot be excluded. In the 3400–3700 cm−1 region, chlorite usually presents three defined peaks related to OH vibrations, even though the exact peak positions are widely variable. 32 In the clinochlore–chamosite series, these variations are most probably related to octahedral substitutions. Therefore, different proportions of Mg2+ and Fe2+ in the structure of chlorite may result in complex peak shifts in the 3400–3700 cm−1 region.
Alunite
Raman spectra of sulfates consistently feature a very intense Raman band between 970 cm−1 and 1050 cm−1, associated with the S–O bond (Fig. 1b).54−56 For alunite-group minerals, this most intense band is located at 1024 cm−1, and is attributed specifically to the SO4 stretching mode of alunite.57−59 Raman spectra of alunite are characterized by an additional set of peaks in the 1000–1200 cm−1 and 100–650 cm−1 spectral ranges (Fig. 1b), mainly associated with S–O, O–H, and Al–O bond vibrations. 57 Bands at ∼390 cm−1 and ∼650 cm−1 are assigned to SO4 and Al–O stretching vibrations, respectively.59−62 When the dominant alkaline cation is Na+ instead of K+, shifts in both peak position and intensity are observed in the 1050–1200 cm−1 region, allowing the distinction between alunite and natroalunite. The alunite endmember presents secondary peaks at ∼1077 cm−1, ∼1151 cm−1, and ∼1186 cm−1, 54 the latter peak being the most intense. The natroalunite endmember shows a significant shift of those peaks to ∼1085 cm−1, ∼1163 cm−1, and ∼1183 cm−1, 54 with the peak at ∼1085 cm−1 showing higher intensity relative to that of alunite. In the >3000 cm−1 spectral region, alunite is characterized by two major peaks, at 3480 cm−1 and 3508 cm−1, derived from OH vibration modes, whereas natroalunite shows a shift of these peaks towards lower wavelengths and lower intensities. 58
Geological Setting of Studied Epithermal Occurrences
The Avalon Zone is the easternmost terrane belonging to the Appalachian orogen in Newfoundland (Fig. S1, Supplemental Material). 63 Geologically, this zone is characterized by Neoproterozoic volcanic arcs and related volcano-sedimentary sequences, 63 which host abundant epithermal occurrences (Fig. S1, Supplemental Material).64,65 The Hickey’s Pond high-sulfidation epithermal prospect and the Heritage low-sulfidation epithermal prospect are located in the Burin Peninsula (southern Newfoundland), currently the most prospective area for epithermal mineralization. 65 The Burin Peninsula is geologically characterized by Neoproterozoic arc-related volcanic, volcaniclastic, and sedimentary rocks divided into three units: The Marystown, the Musgravetown, and the Long Harbour Groups. 64 The Hickey’s Pond and Heritage epithermal prospects are hosted in volcanic and volcaniclastic rocks from the 590–570 Ma Marystown Group. 64 Rocks from the Avalon Zone have been affected by a mild lower-greenschist metamorphism and deformation during the Paleozoic Appalachian orogeny, but the epithermal occurrences are generally well preserved due to their thick overlying sedimentary sequences and consequent rapid burial. 66
The Hickey’s Pond high-sulfidation epithermal prospect is hosted in mildly deformed greenschist facies pyroclastic rocks. The hydrothermal alteration is characterized by a core of massive silicic alteration, with discontinuous zones of vuggy silica and variable amounts of alunite and pyrite. 66 The massive silicic alteration is surrounded by advanced argillic alteration dominated by quartz, alunite, pyrite, and rutile, which gradually changes to quartz–alunite(–lazulite) alteration. 66 The most distal outer alteration zone comprises quartz–sericite alteration. 66
The Heritage low-sulfidation epithermal prospect is hosted in pyroclastic andesite–basalt and rhyodacite porphyry. The distal hydrothermal alteration at Heritage is characterized by quartz, white mica, and chlorite, and the proximal hydrothermal alteration assemblage consists of quartz, chalcedony, calcite, illite, chlorite, and adularia.
The Hope Brook high-sulfidation epithermal deposit is a past-producing mine located in southern Newfoundland (Fig. S1, Supplemental Material) and hosted in altered and deformed sedimentary and mafic volcaniclastic rocks of the Whittle Hill Sandstone and Third Pond Tuff successions. 67 The host rocks display a hydrothermal alteration defined by extensive advanced argillic alteration with more confined massive silicic alteration at its core. The former is characterized by quartz–mica–pyrite–pyrophyllite, with minor kaolinite, andalusite, alunite, and rutile. 67
The Vinjer prospect and the Oval Pit mine (Fig. S1, Supplemental Material) are two barren high-sulfidation epithermal systems located in the Avalon zone and contain extensive advanced argillic alteration zones with pyrophyllite. The Oval Pit mine actively produces pure pyrophyllite for diverse industrial applications.
Experimental
Materials and Methods
Samples from Hickey’s Pond, Heritage, Vinjer, and Oval Pit epithermal occurrences were collected during a field campaign in June 2017. Samples from Hope Brook were selected from drill core archived in the Department of Earth Sciences at Memorial University. Table S1 in Supplemental Materials presents the complete list of rock samples, their summary descriptions (ore deposit type, mineralogy) and analytical methods applied for the mineral(s) of interest in each sample. Arbiol et al. 11 describe in detail the regional geology, epithermal characteristics, mineralogy, and chemistry of hydrothermal phases from the epithermal occurrences investigated in this study.
Preparation of rock samples for analysis consisted of cutting the sample with a fine kerf lapidary saw into small flat sided squares that fit within 25.4 mm diameter aluminum retaining rings. These rings were subsequently cast with two-component epoxide. The embedded samples were then polished using traditional lapidary procedures, with seven steps (of descending polishing compound grit size) until a high-quality polished surface was achieved. Final polish was accomplished with a 0.25 µm diamond polishing paste.
Visible–Near Infrared–Shortwave Infrared Spectroscopy
Laboratory benchtop Vis-NIR-SWIR spectroscopy analyses were performed with the ASD Terraspec 2 Pro instrument (Department of Earth Sciences, Memorial University), which consists of a light probe (with an analyzing area of 2 cm diameter) attached to a spectrometer module and a control computer. The light reflected from the sample reaches the spectrometer module through a fiber optic cable. The Terraspec 2 Pro is equipped with several diffraction gratings and photosensitive arrays that allow the acquisition of signal in the visible (390–750 nm), near-infrared (750–1300 nm), and shortwave infrared (1300–2500 nm) regions. The spectral resolution of the Terraspec Pro is approximately 2 nm. Calibration of the spectral response involved analyzing a manufacturer-provided high-reflectance polished Spectralon (sintered polytetrafluoroethylene) disk that reflects uniformly across the spectrum, in order to eliminate atmosphere and background spectral effects. This step was followed by an internal standard consisting of a pure polished pyrophyllite disk to confirm optimal spectral response. Analysis of both the Spectralon disk and the pyrophyllite standard was performed prior to first analysis and between sets of 20 unknown sample measurements. Individual measurements took 20–60 s. Spectral analyses were performed in both hand sample (sawn drill core) and the polished rock mounts. Analyses were performed in a naturally sunlight room in order to avoid any artificial light interference. Sawn drill core surfaces generally produced more total reflectance than polished rock mounts, but the latter generally produced a superior spectral resolution. Reflectance spectra were collected with the RS3 Spectral Acquisition software. A minimum of three analyses per sample were obtained to ensure the consistency and representativity of the spectral measurements. Acquired data were subsequently processed, hull quotient-corrected, and normalized with The Spectral Geologist (TSG; CSIRO, Australia) software. The wavelength, shape, and position of major absorption bands (Al–OH, Fe–OH, Mg–OH, H2O, OH) were compared with the TSG reference library for initial mineral identification.
Raman Spectroscopy
Two similar instruments were used to obtain Raman spectra of polished rock mounts. Both were Renishaw inVia confocal microspectrometers coupled to an optical microscope with a charge-coupled device camera to record Raman spectra (Department of Chemistry, Memorial University). One of the systems is equipped with a 633 nm He–Ne excitation laser, whereas the other uses an 830 nm diode laser source. The 830 nm laser Renishaw inVia spectrometer uses a grating system that covers the Raman stokes shift from ∼0 to 3000 cm−1, with a spectral resolution of 1 cm−1. The wattage of this laser system is 300 mW at 100% laser power. This instrument was the primary system used for the present study, given its speed and reliability. However, given its grating system, structural/hydration water spectra (both H2O and OH group spectra occur in the 3000–3700 cm−1 region) could not be measured with this first Raman instrument. The 633 nm laser Renishaw inVia spectrometer uses a grating system that covers the Raman stokes shift from ∼0 cm−1 to 4000 cm−1, with a spectral resolution of 1 cm−1. The 633 nm laser system has a wattage of 450 mW at 100% laser power and was used specifically to acquire Raman signatures of structural/hydration water. In both systems, calibration of the zero Raman shift was performed daily before spectrum acquisition and consisted of measuring and aligning the appropriate spectral peak of a pure silica disk to 520 cm−1. Therefore, errors in peak position were minimized, and routinely consisted of less than ± 1 cm−1. Spectral acquisition was made using either a 20 × or 50 × microscope objective, resulting in a focused laser spot of <20 µm diameter in both cases. Different combinations of laser power and exposure times were tested in order to minimize sample fluorescence and obtain the cleanest Raman spectra. For both instruments, best quality spectra were generally acquired using a reduced laser power of 50% to avoid mineral damage and an exposure time of 40 s for minerals in polished rock mounts. A minimum of three analyses per point were acquired to ensure the consistency and representativity of the spectral measurements.
Instrument management, calibration, measurement characteristics, and Raman spectrum acquisition were executed with the Renishaw WiRE software package. Following acquisition, Raman spectra were processed with the CrystalSleuth software (The RRUFF Project), where background noise and cosmic ray events (CRE) were removed.
Scanning Electron Microscopy (SEM)
Scanning electron microscopy (SEM) was undertaken using a FEI MLA 650FEG instrument in the CREAIT MAF Facility (Memorial University), using carbon-coated polished rock samples to refine petrographic observations and mineral identification, as well as for qualitative analyses and documentation of hydrothermal alteration minerals before Raman spectroscopy. This was accomplished with both the backscattered electron (BSE) imaging and the energy dispersive X-ray spectrometry (EDS) capabilities of the instrument. Analyses were performed at high vacuum, with an accelerating voltage of 15 kV and a sample current of 10 nA. Spectral analysis by EDS was performed using spots of 10 nm diameter and an acquisition time of 20 s.
Electron Probe Microanalysis (EPMA)
Electron probe microanalyses (EPMAs) were carried out using the JEOL JXA-8230 SuperProbe instrument in the CREAIT Hibernia Electron Beam Facility (Memorial University) equipped with five wavelength dispersive spectrometers (WDS). All analyses were performed either on the polished rock samples (described above) or in polished petrographic thin sections prepared from the same sample. Samples were coated with a 20 nm (200 Å) thick carbon layer before analysis.
In the case of white mica and chlorite, the accelerating voltage was set to 15 kV, with a beam current of 20 nA and a 5 µm spot diameter. The following major elements were determined: Si, Al, Ca, K, Na, Mg, Fe, Mn, Cr, Ti, V, Cl, and F. Mineral formulae and molar proportions of white mica (based on the general structural formula AD2T4O10(OH)2) were calculated assuming: (i) all Fe is Fe(II), (ii) Fe, Mg, Ti, Mn, Cr, and V are in octahedral sites, (iii) K, Na, and Ca are allocated in the interlayer position between TOT layers, (iv) Al is tetrahedral up to Si + Al = 4 atoms per 11 oxygens, and (v) any remaining Al is assigned to octahedral sites. For chlorite (structural formula A5–6T4O10(OH)8), the following assumptions were made: (i) all Fe is Fe(II), (ii) Fe, Mg, Ti, Mn, Cr, and V are allocated to the 2:1 (or brucite) octahedral positions, (iii) Al is allocated in tetrahedral positions up to Si + Al = 4 atoms per 14 oxygens, and (iv) any remaining Al is assigned to octahedral sites.
Alunite and pyrophyllite were measured with an accelerating voltage of 15 kV, and a beam current of 10 nA for alunite and 20 nA for pyrophyllite. The electron beam was defocused to a 10 µm diameter to avoid crystal damage and reduce alkali element migration during analysis. 68 The following elements were determined: Si, S, Al, K, Na, Mg, Fe, Ti, Ca, Mn, P, Ba, Cl, F, Sr, Ce, Cl, and F. Pyrophyllite mineral formulae (D2T4O10(OH)2) were calculated assuming: (i) all Fe is Fe(III), (ii) Fe, Mn, Mg, Ca, Na, K, and Ti are allocated to octahedral positions, (iii) Al is allocated to tetrahedral positions up to Si + Al = 4 atoms per 11 oxygens, and (iv) any remaining Al is assigned to octahedral sites. For alunite (based on the general structural formula DG3(TO4)2(OH)6), mineral formulae were calculated assuming: (i) all Fe is Fe(III), (ii) S, P, and Si are allocated to the T position, (iii) Al and Fe3+ are allocated to the G position, (iv) K, Na, Ca, Sr, Ba, Mg, Ti, Mn, and Ce are allocated to the D position.
For all analyses, counting times were 20–30 s on the optimum WDS peak for each of the major and minor elements analyzed and 10 s on background on both sides of the peak. For K and Na, the counting times were reduced to 10 s and 5 s on peak and backgrounds, respectively, and these elements were run first in the counting sequence to mitigate the effects of alkali migration under the electron beam. Limits of detection (LOD) were calculated as the minimum concentration required to produce count rates three times higher than the square root of the measured background (i.e., 3σ; 99% degree of confidence at the lower detection limit). Raw data were corrected for matrix effects using the PAP algorithm69,70 as implemented by JEOL software. The standards used for EPMA acquisition consisted of a collection of synthetic and natural silicates, oxides, and sulfates commonly used for EPMA calibrations. The Astimex biotite standard (for white mica analyses) and Astimex chlorite standard (for chlorite, pyrophyllite, and alunite analyses) were measured at the beginning and end of each sample analyzed, as well as every 25–30 points of analysis as a secondary standard to ensure the consistency of the calibration of the electron probe instrument. For quality control, EPMA totals of <96 wt% and >102 wt% in white mica after recalculation were considered erroneous and discarded. For chlorite, pyrophyllite, and alunite, analyses were discarded if the initial EPMA total values did not lie between 84–87 wt%, 94–98 wt%, and 94–99 wt%, respectively.
Results
Pyrophyllite
Pyrophyllite from the Vinjer prospect and the Oval Pit mine were analyzed in this study. Both occurrences show extensive and pervasive advanced argillic alteration zones, where pyrophyllite occurs as massive aggregates, routinely associated with minor amounts of quartz (Fig. S2a and b, Supplemental Material).
Visible–Near Infrared–Shortwave Infrared Spectroscopy
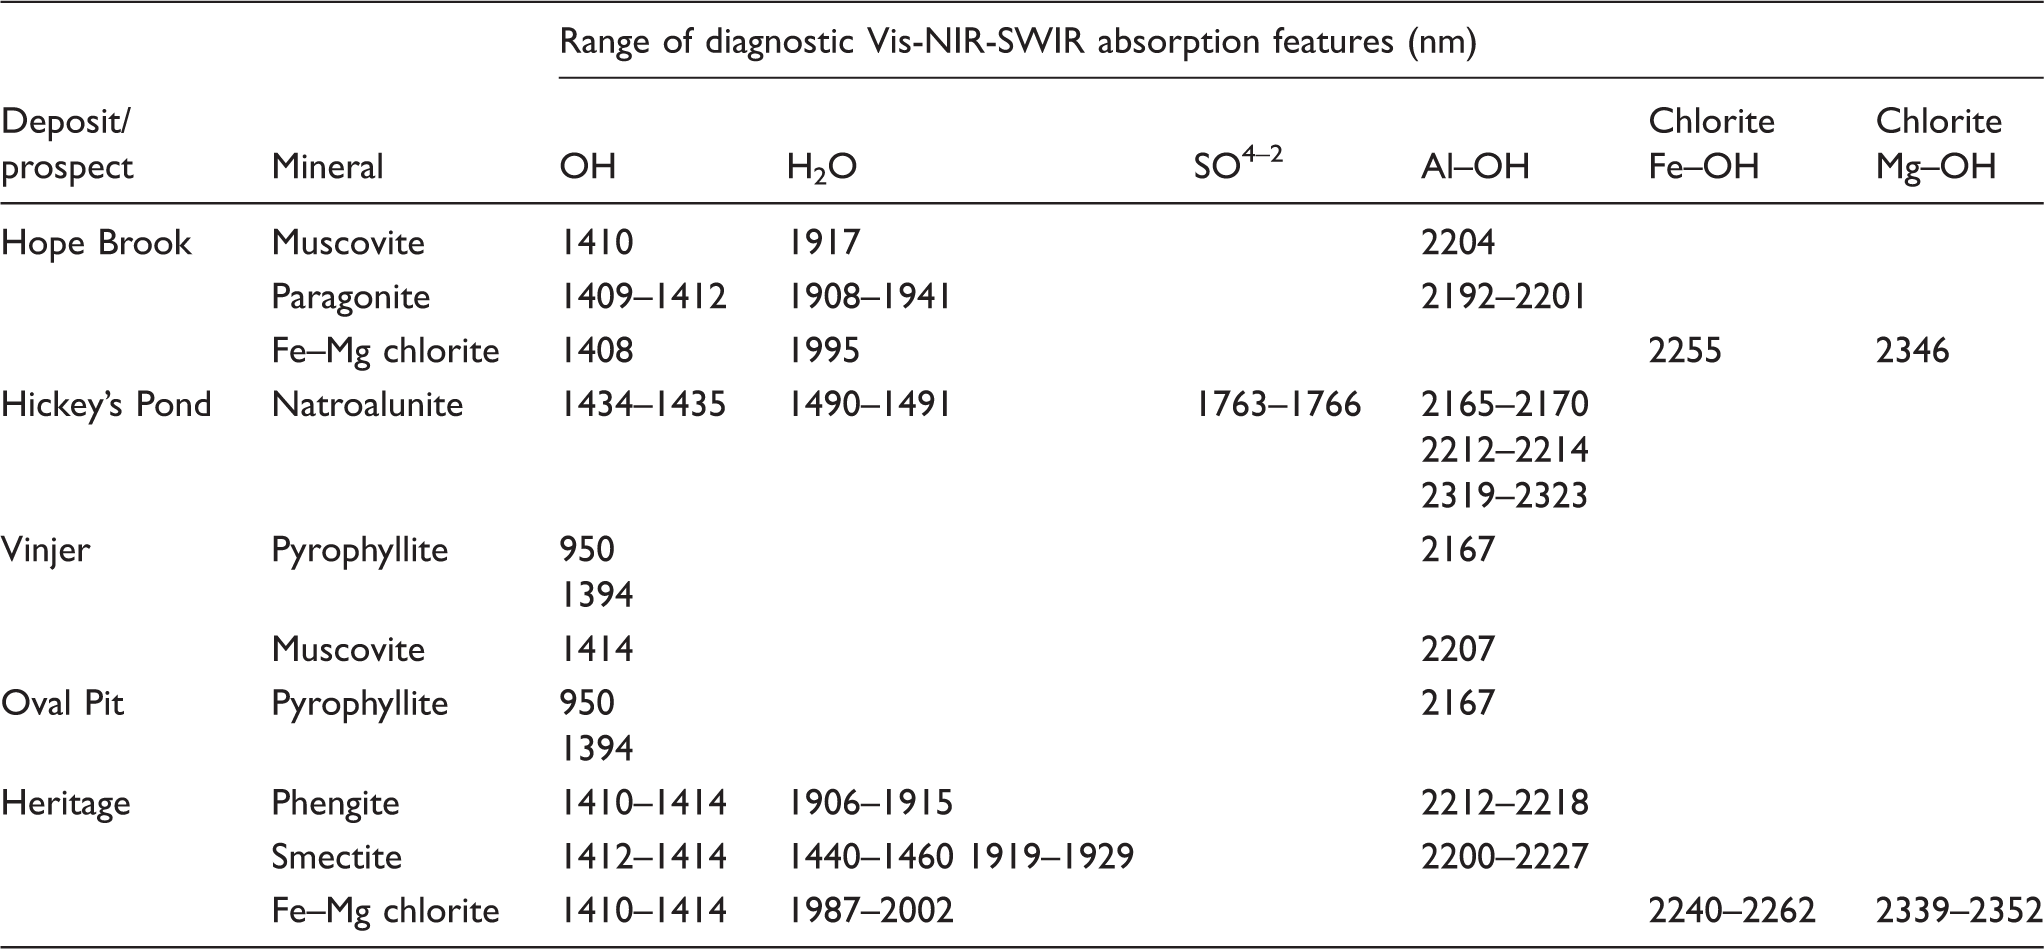
Pyrophyllite samples from both Vinjer prospect and the Oval Pit mine display an absorption band in the NIR spectrum at 950 nm, two major bands in the SWIR spectrum at 1394 nm and 2167 nm (Fig. 2a; Table I), and secondary absorption bands at 1232 nm and close to 2320 nm (Fig. 2a). In addition, bands close to 1414 nm, 1909 nm, and 2208 nm (Fig. 2a; Table I) indicate the presence of muscovite in these samples. SWIR and Raman spectra of pyrophyllite samples. (a) SWIR reflectance spectra from the Vinjer high-sulfidation epithermal occurrence (Sample VP-1) and the Oval Pit pyrophyllite mine (Sample MANUELS). Dashed lines indicate characteristic peak positions of pyrophyllite. (b) Raman spectra from the Vinjer (Sample VP-1) and the Oval Pit (Sample MANUELS) in the H2O/OH spectral range (3500–3800 cm–1) and in the spectral range of the fundamental vibrations of silicates (100–1200 cm–1). Dashed lines indicate characteristic peak positions of pyrophyllite. Vis-NIR-SWIR absorption band positions of identified key hydrothermal minerals in the studied epithermal occurrences.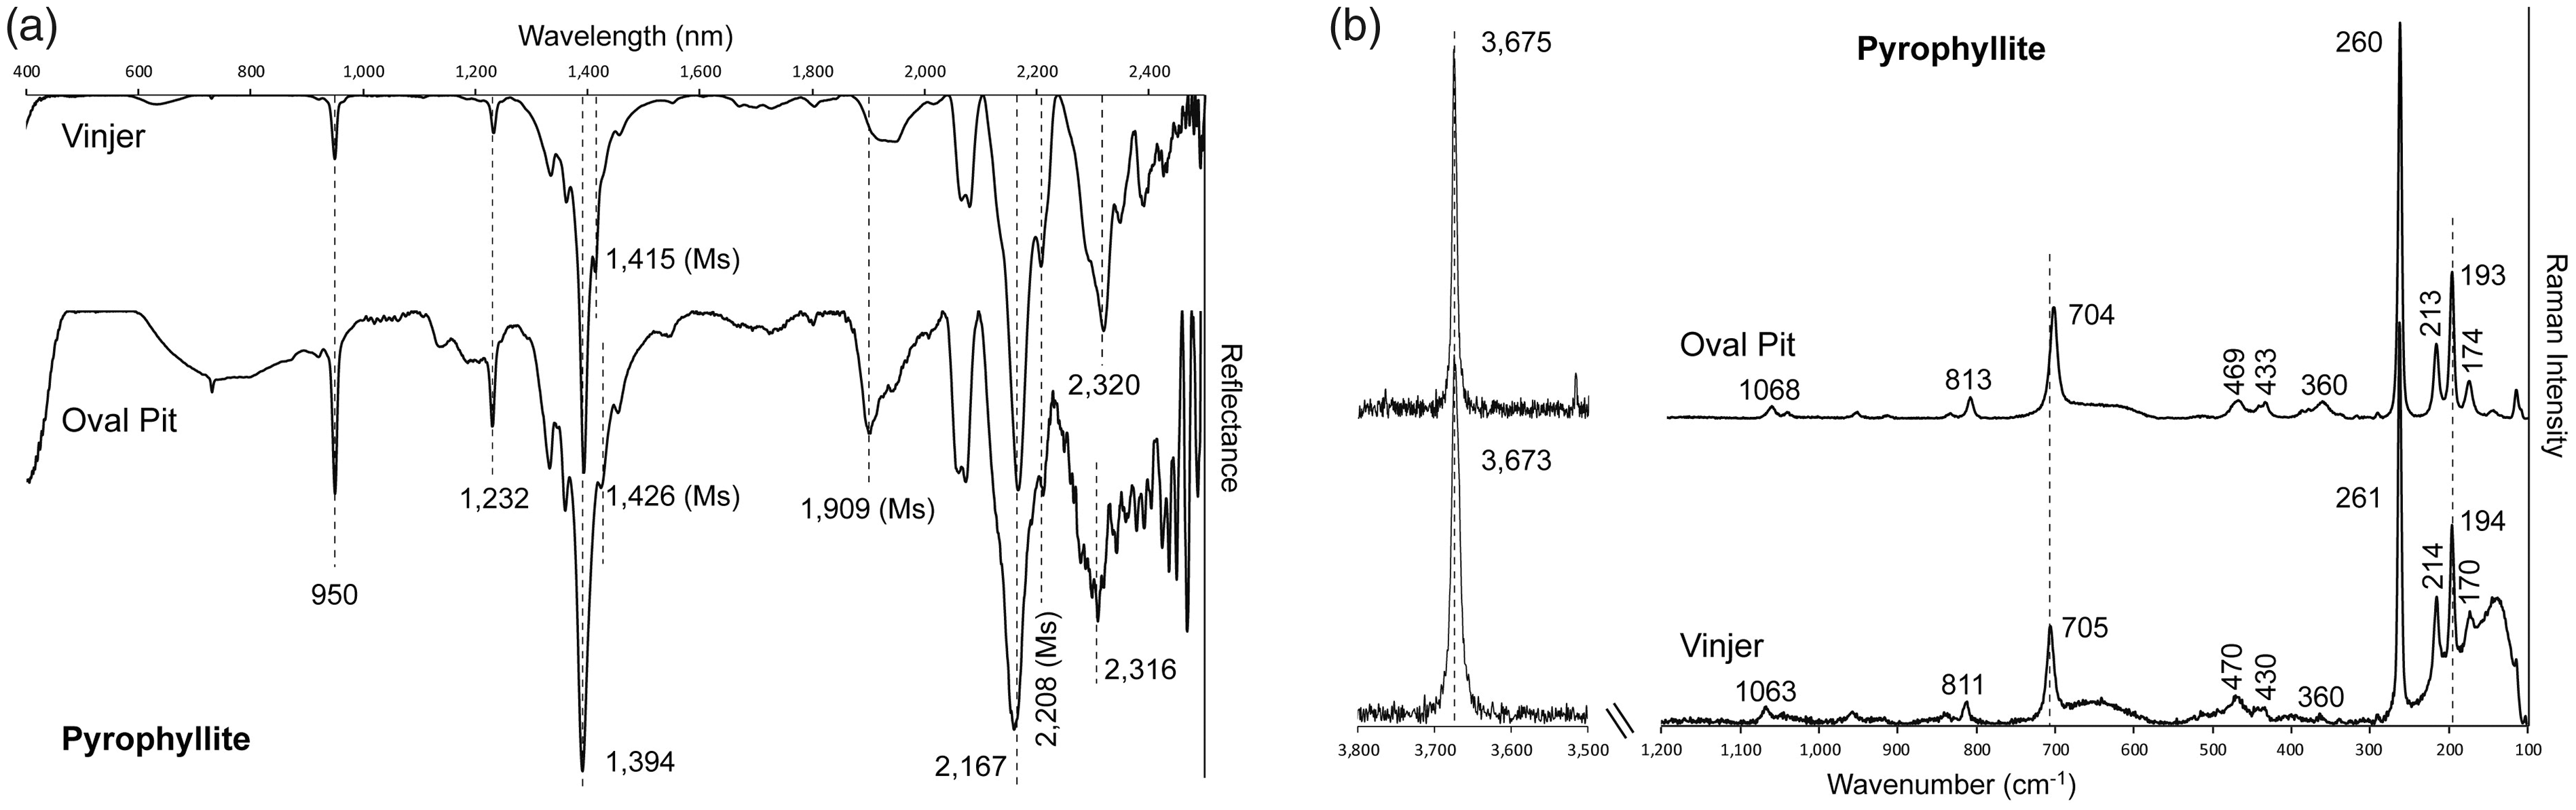
Raman Spectral Features
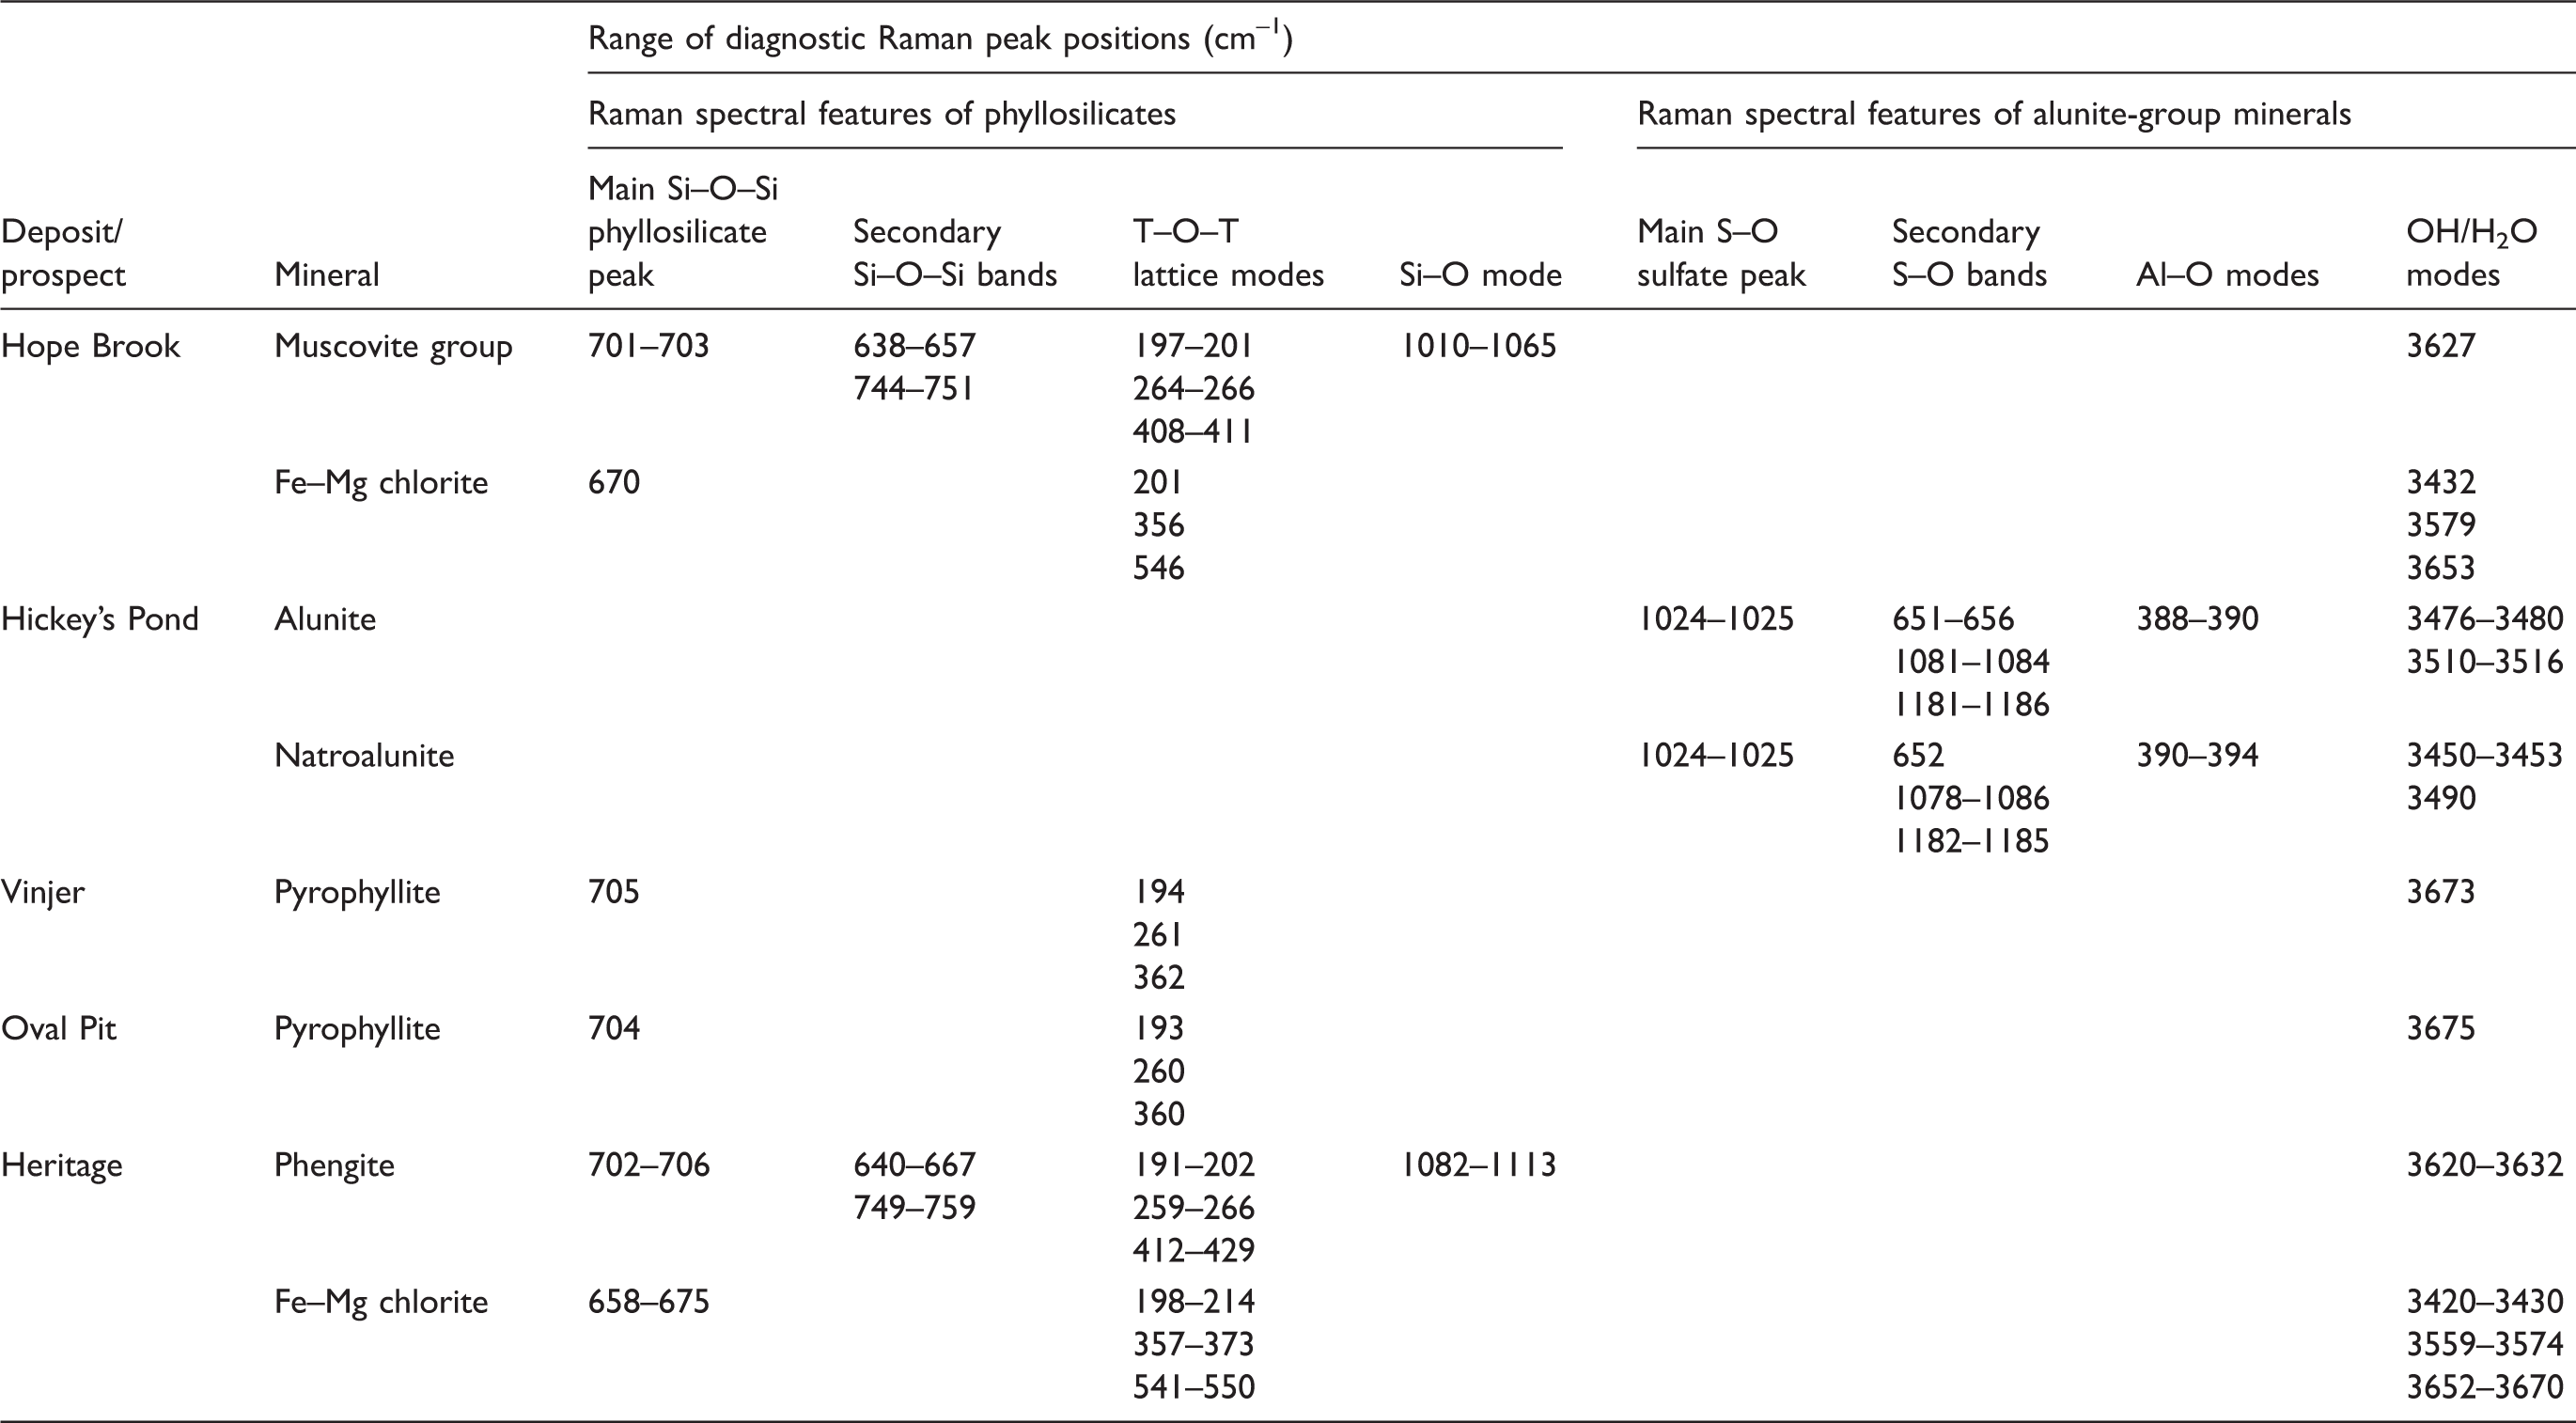
Raman spectral band positions and assignments of key hydrothermal alteration phases from the studied epithermal occurrences.
Mineral Chemistry
Electron probe microanalyses of Oval Pit and Vinjer pyrophyllite suggest a generally homogeneous chemical composition. The largest compositional variation within the analyzed samples is observed in their SiO2 and (Al2O3 + Fe2O3) contents, where lower SiO2 compositions correlate with higher Al2O3 + Fe2O3 contents (Table S2, Supplemental Material). Total Fe3+ contents are low (0.005–0.010 Fe3+ atoms per formula unit, or a.p.f.u.; Table S2, Supplemental Material), in agreement with the absence of a detectable Raman band at 3647 cm−1 (Fig. 2b).
White Mica–Sericite
At Heritage, white mica most frequently occurs in fine-grained agglomerations, as a replacement of protolith minerals (mainly feldspars), and is sometimes associated with chlorite (Fig. S2c, Supplemental Material). White mica is spatially associated with acanthite and/or native silver (Fig. S2d, Supplemental Material), as well as occurring filling the space between bladed calcite crystals (a diagnostic feature indicating fluid boiling). 71
At Hope Brook, white mica occurs as medium-grained crystals of up to 60 µm (Fig. S2e, Supplemental Material) that are occasionally intergrown with chlorite, giving rise to mica–chlorite stacks. Mica crystals are chemically zoned, with Na-rich cores and K-rich rims (Fig. S2e, Supplemental Material).
At Hickey’s Pond, white mica mainly occurs as coarse grains (up to 500 µm) in a quartz–hematite–alunite–rutile vein, where it commonly develops in close spatial association with specular hematite.
Visible–Near Infrared–Shortwave Infrared Spectroscopy
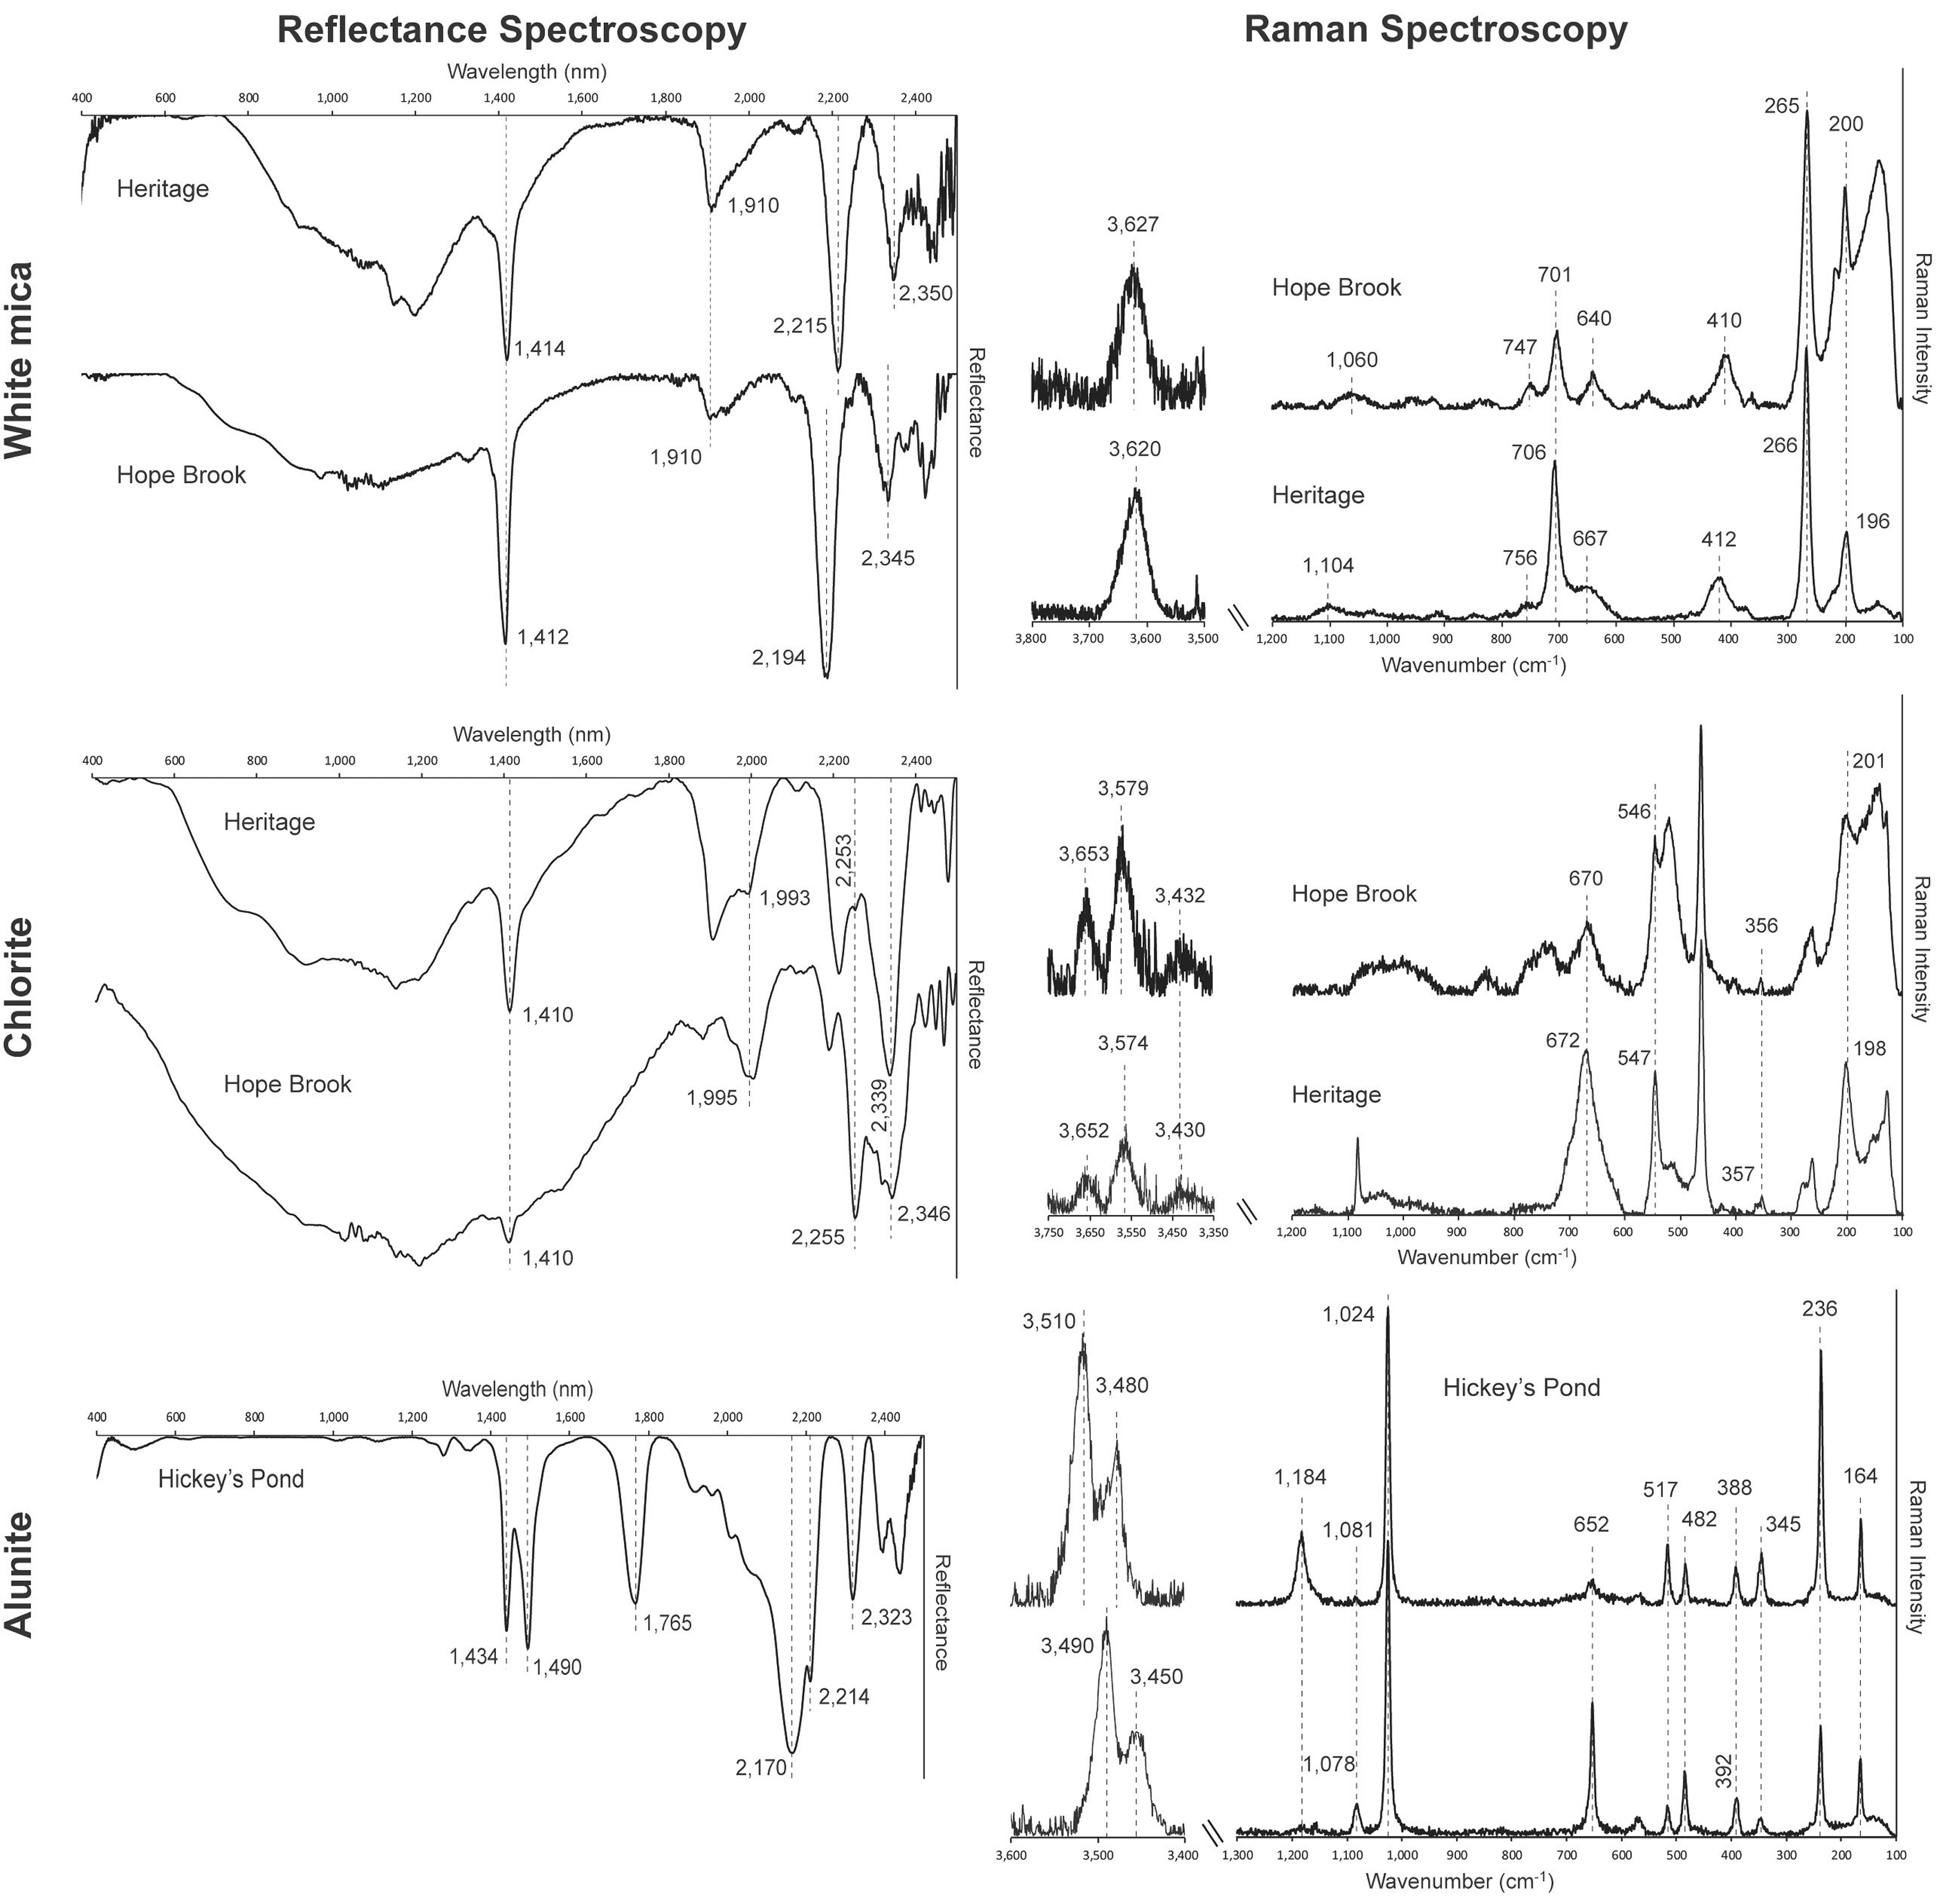
White mica at Heritage shows consistent absorption bands at 1410–1414 nm, 1906–1915 nm, and 2212–2218 nm (Fig. 3a; Table I). The Al–OH related band located at 2212–2218 nm suggests phengite is the prevalent white mica species. In addition to phengite, smectite is also recognized in some Heritage samples, evidenced by the deeper absorption band at 1919–1929 nm and the presence of an H2O band shoulder near 1460 nm in some of the acquired spectra (Fig. 3a; Table I). SWIR and Raman spectra of white mica samples. (a) SWIR reflectance spectra of phengite (Sample HE48-27) and smectite (Sample HE-24-1 R) from the Heritage low-sulfidation epithermal prospect and paragonite (Sample HB-4) from the Hope Brook high-sulfidation epithermal mine. Dashed lines indicate characteristic peak positions of white mica. (b) Raman spectra of muscovite/paragonite from Hope Brook (Sample HB-6) and Heritage (Sample HE36-107) in the H2O/OH spectral range (3500–3800 cm–1) and in the spectral range of the fundamental vibrations of silicates (100–1200 cm–1). Dashed lines indicate characteristic peak positions of white mica. Raman spectra of white mica from Hickey’s Pond were not quantifiable due to high fluorescence consequent to the presence of hematite. (c) Al versus Fe+Mg+Si (a.p.f.u.) binary diagram expressing the various degrees of Tschermak substitution of the different mica varieties (modified after Arbiol et al.
11
).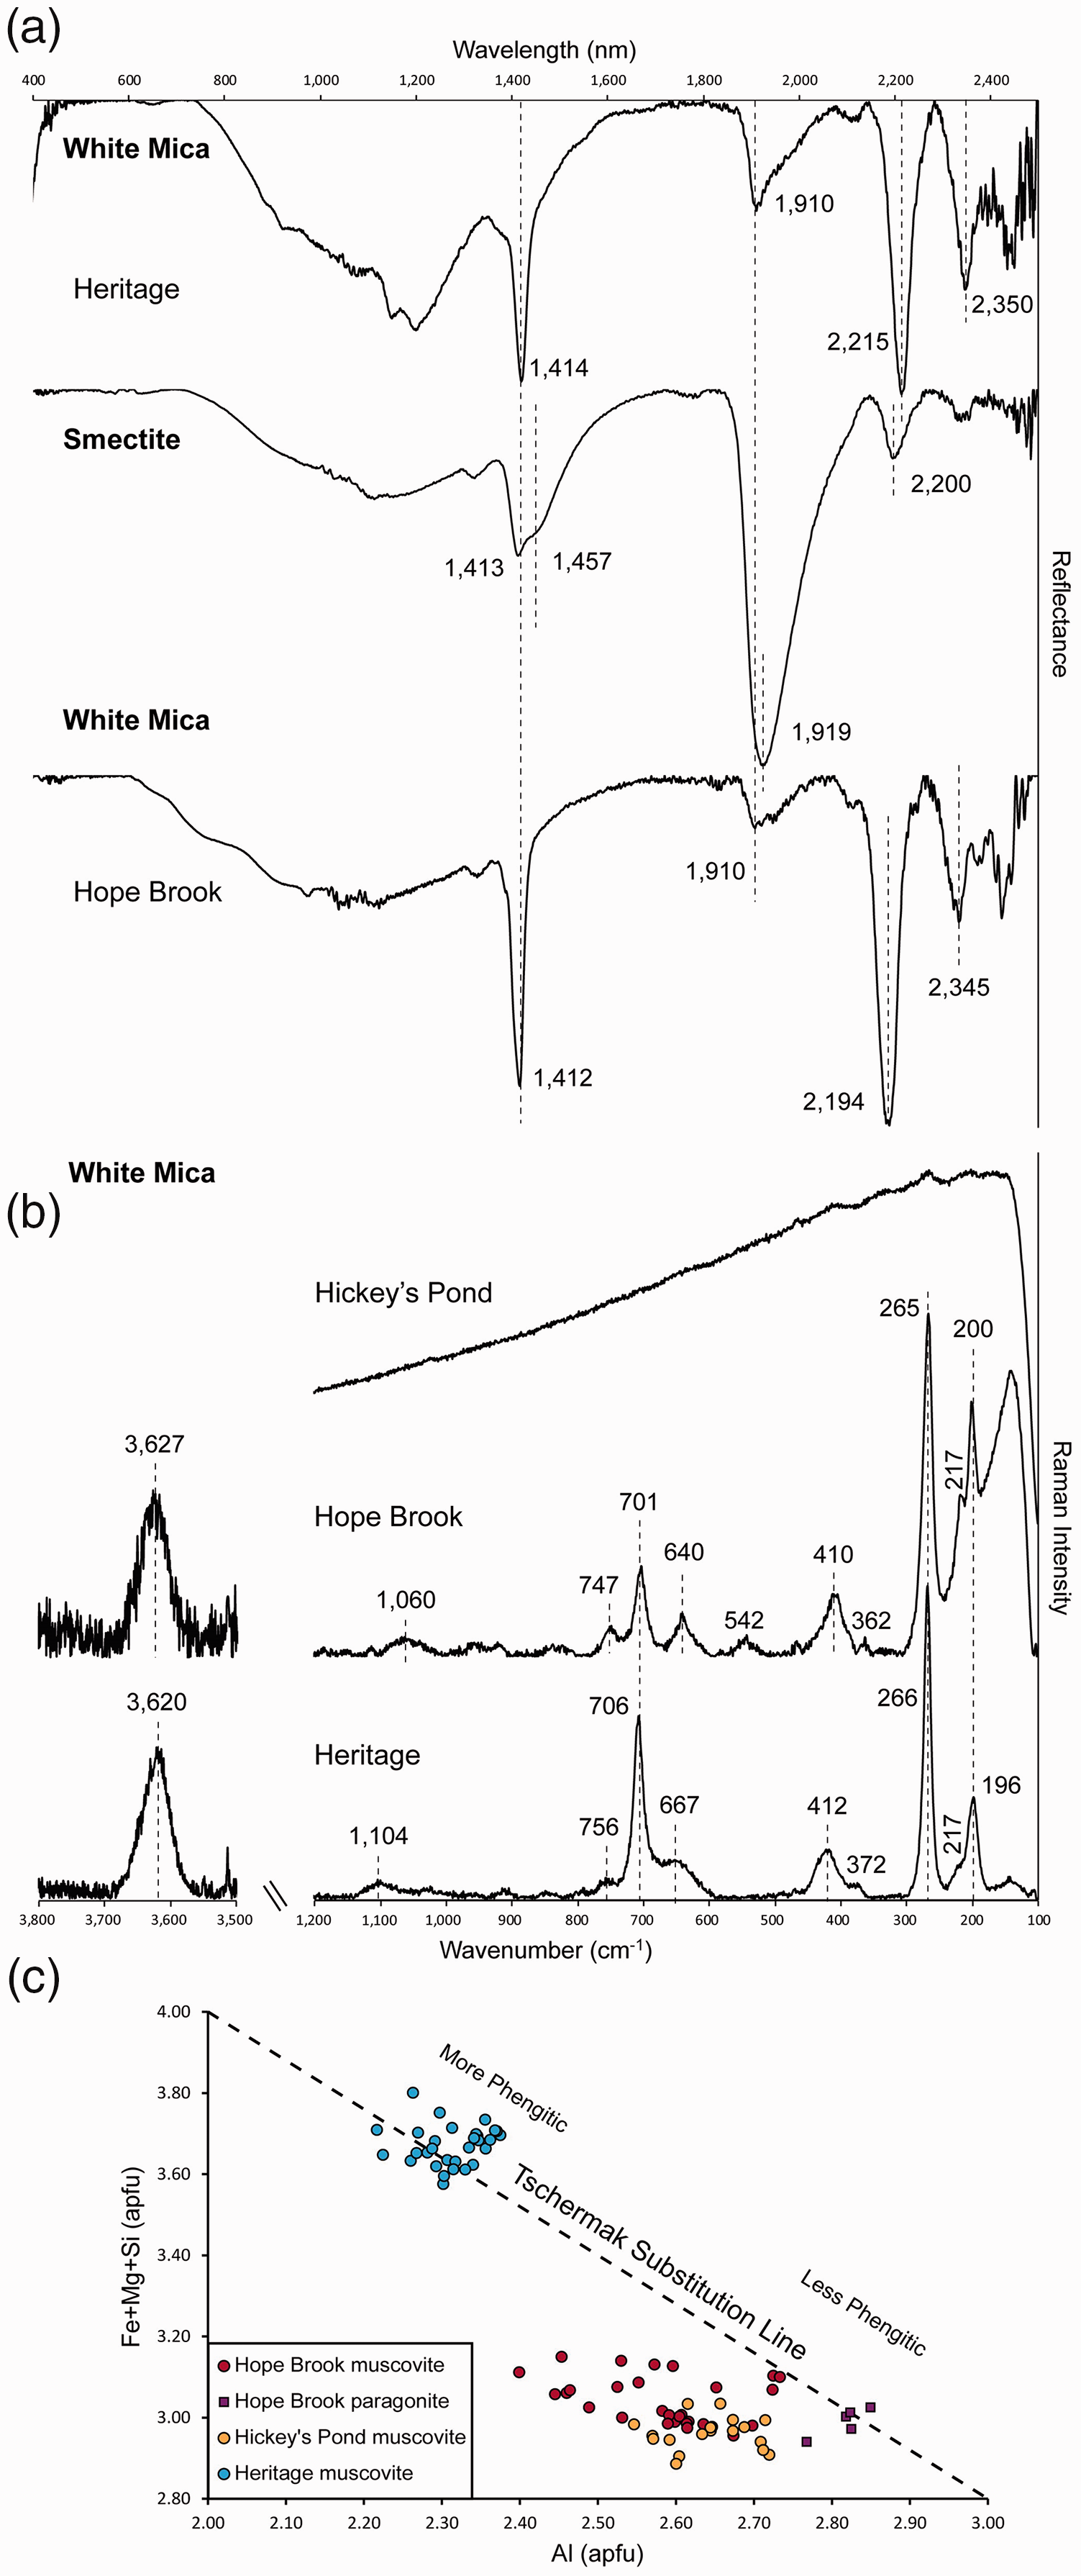
The Hope Brook samples contain white mica with absorption bands at 1409–1412 nm, 1908–1941 nm, and 2192–2201 nm (Fig. 3a). In this case, the position of the Al–OH band at 2192–2201 nm, together with the slight downshift of the water band to 1409–1412 nm, indicates the occurrence of paragonite.
White mica at Hickey’s Pond could not be identified by Vis-NIR-SWIR spectroscopy, given the fact that it is closely intermixed with specular hematite and the dominant absorption bands observed, typical of Fe–oxide phases (∼930 nm, ∼1450 nm, ∼1930 nm), obscure the spectral features of any associated white mica.
Raman Spectral Features
White mica from Heritage displays major Raman peaks at 191–202 cm−1, 259–266 cm−1, 412–429 cm−1, 640–667 cm−1, 702–706 cm−1, 748–759 cm−1, and 1082–1113 cm−1 (Fig. 3b; Table II), with a single H2O/OH vibration band at 3620–3632 cm−1 (Fig. 3b; Table II). The Raman band at 1082–1113 cm−1 suggests that white mica at Heritage is close to phengite in composition.
White mica from Hope Brook has major Raman peaks at 197–201 cm−1, 262–267 cm−1, 403–411 cm−1, 638–657 cm−1, 701–704 cm−1, 744–751 cm−1, 1010–1065 cm−1, and 3627 cm−1 (Fig. 3b; Table II). The reported band positions are typical for muscovite-group mica with low degrees of Tschermak substitution.
Accurate, well-resolved Raman spectra of white mica from Hickey’s Pond were not possible to acquire due to strong fluorescence problems consequent to the presence of hematite (Fig. 3b).
Mineral Chemistry
Electron probe microanalyses of white mica at Heritage confirmed they are part of the muscovite–celadonite solid solution series, containing high Si4+ and substantial Mg2+ (0.17–0.31 a.p.f.u.; Table S2 in Supplemental Materials; Fig. 3c) and Fe2+ (0.05–0.12 a.p.f.u.; Table S2 in Supplemental Materials; Fig. 3c), with a composition closer to phengite. This agrees with both spectroscopic techniques used in this study. In contrast, white mica at Hickey’s Pond is muscovite in composition (Fig. 3c), being K-rich (0.74–0.79 a.p.f.u. K+; Table S2, Supplemental Material) with minor amounts of Na+ (0.10–0.16 a.p.f.u.; Table S2, Supplemental Material). White mica at Hope Brook is chemically zoned, with cores of paragonite (0.78–1.02 a.p.f.u. Na+ and 0.05–0.30 a.p.f.u K+; Table S2, Supplemental Material) and muscovitic rims (0.15–0.37 a.p.f.u. Na+ and 0.62–0.77 a.p.f.u. K+; Table S2, Supplemental Material).
Chlorite
Chlorite at Heritage generally occurs pervasively as a fine-grained alteration of the groundmass of the intermediate pyroclastic and porphyritic volcanic rocks that host the deposit, as well as replacing volcanic phenocrysts. Chlorite is texturally associated with white mica (Fig. S2c, Supplemental Material).
Chlorite at Hope Brook occurs as fine-grained (15 µm) to medium-grained (70 µm) crystals with white mica and disseminated pyrite in highly deformed quartz–sericite–chlorite schists.
Visible–Near Infrared–Shortwave Infrared Spectroscopy
Chlorite at Heritage is characterized by major absorption bands at 1410–1414 nm, 1907–1993 nm, 2240–2262 nm, and 2339–2352 nm (Fig. 4a; Table I). Both the Mg–OH and the Fe–OH bands show positions lying between those reported for clinochlore and chamosite, suggesting an intermediate Fe–Mg composition of chlorite. SWIR and Raman spectra of chlorite samples. (a) SWIR reflectance spectra from the Heritage low-sulfidation epithermal prospect (Sample HE-05-03) and the Hope Brook high-sulfidation epithermal deposit (Sample HB-14). Dashed lines indicate characteristic peak positions of chlorite. (b) Raman spectra from Hope Brook (Sample HB-14) and Heritage (Sample HE36-107) in the H2O/OH spectral range (3350–3750 cm–1) and in the spectral range of the fundamental vibrations of silicates (100–1200 cm–1). Dashed lines indicate characteristic peak positions of chlorite. (c) Octahedral Fe/(Fe+Mg) versus tetrahedral Al binary diagram with the different varieties of Fe–Mg chlorite (modified from Arbiol et al.
11
).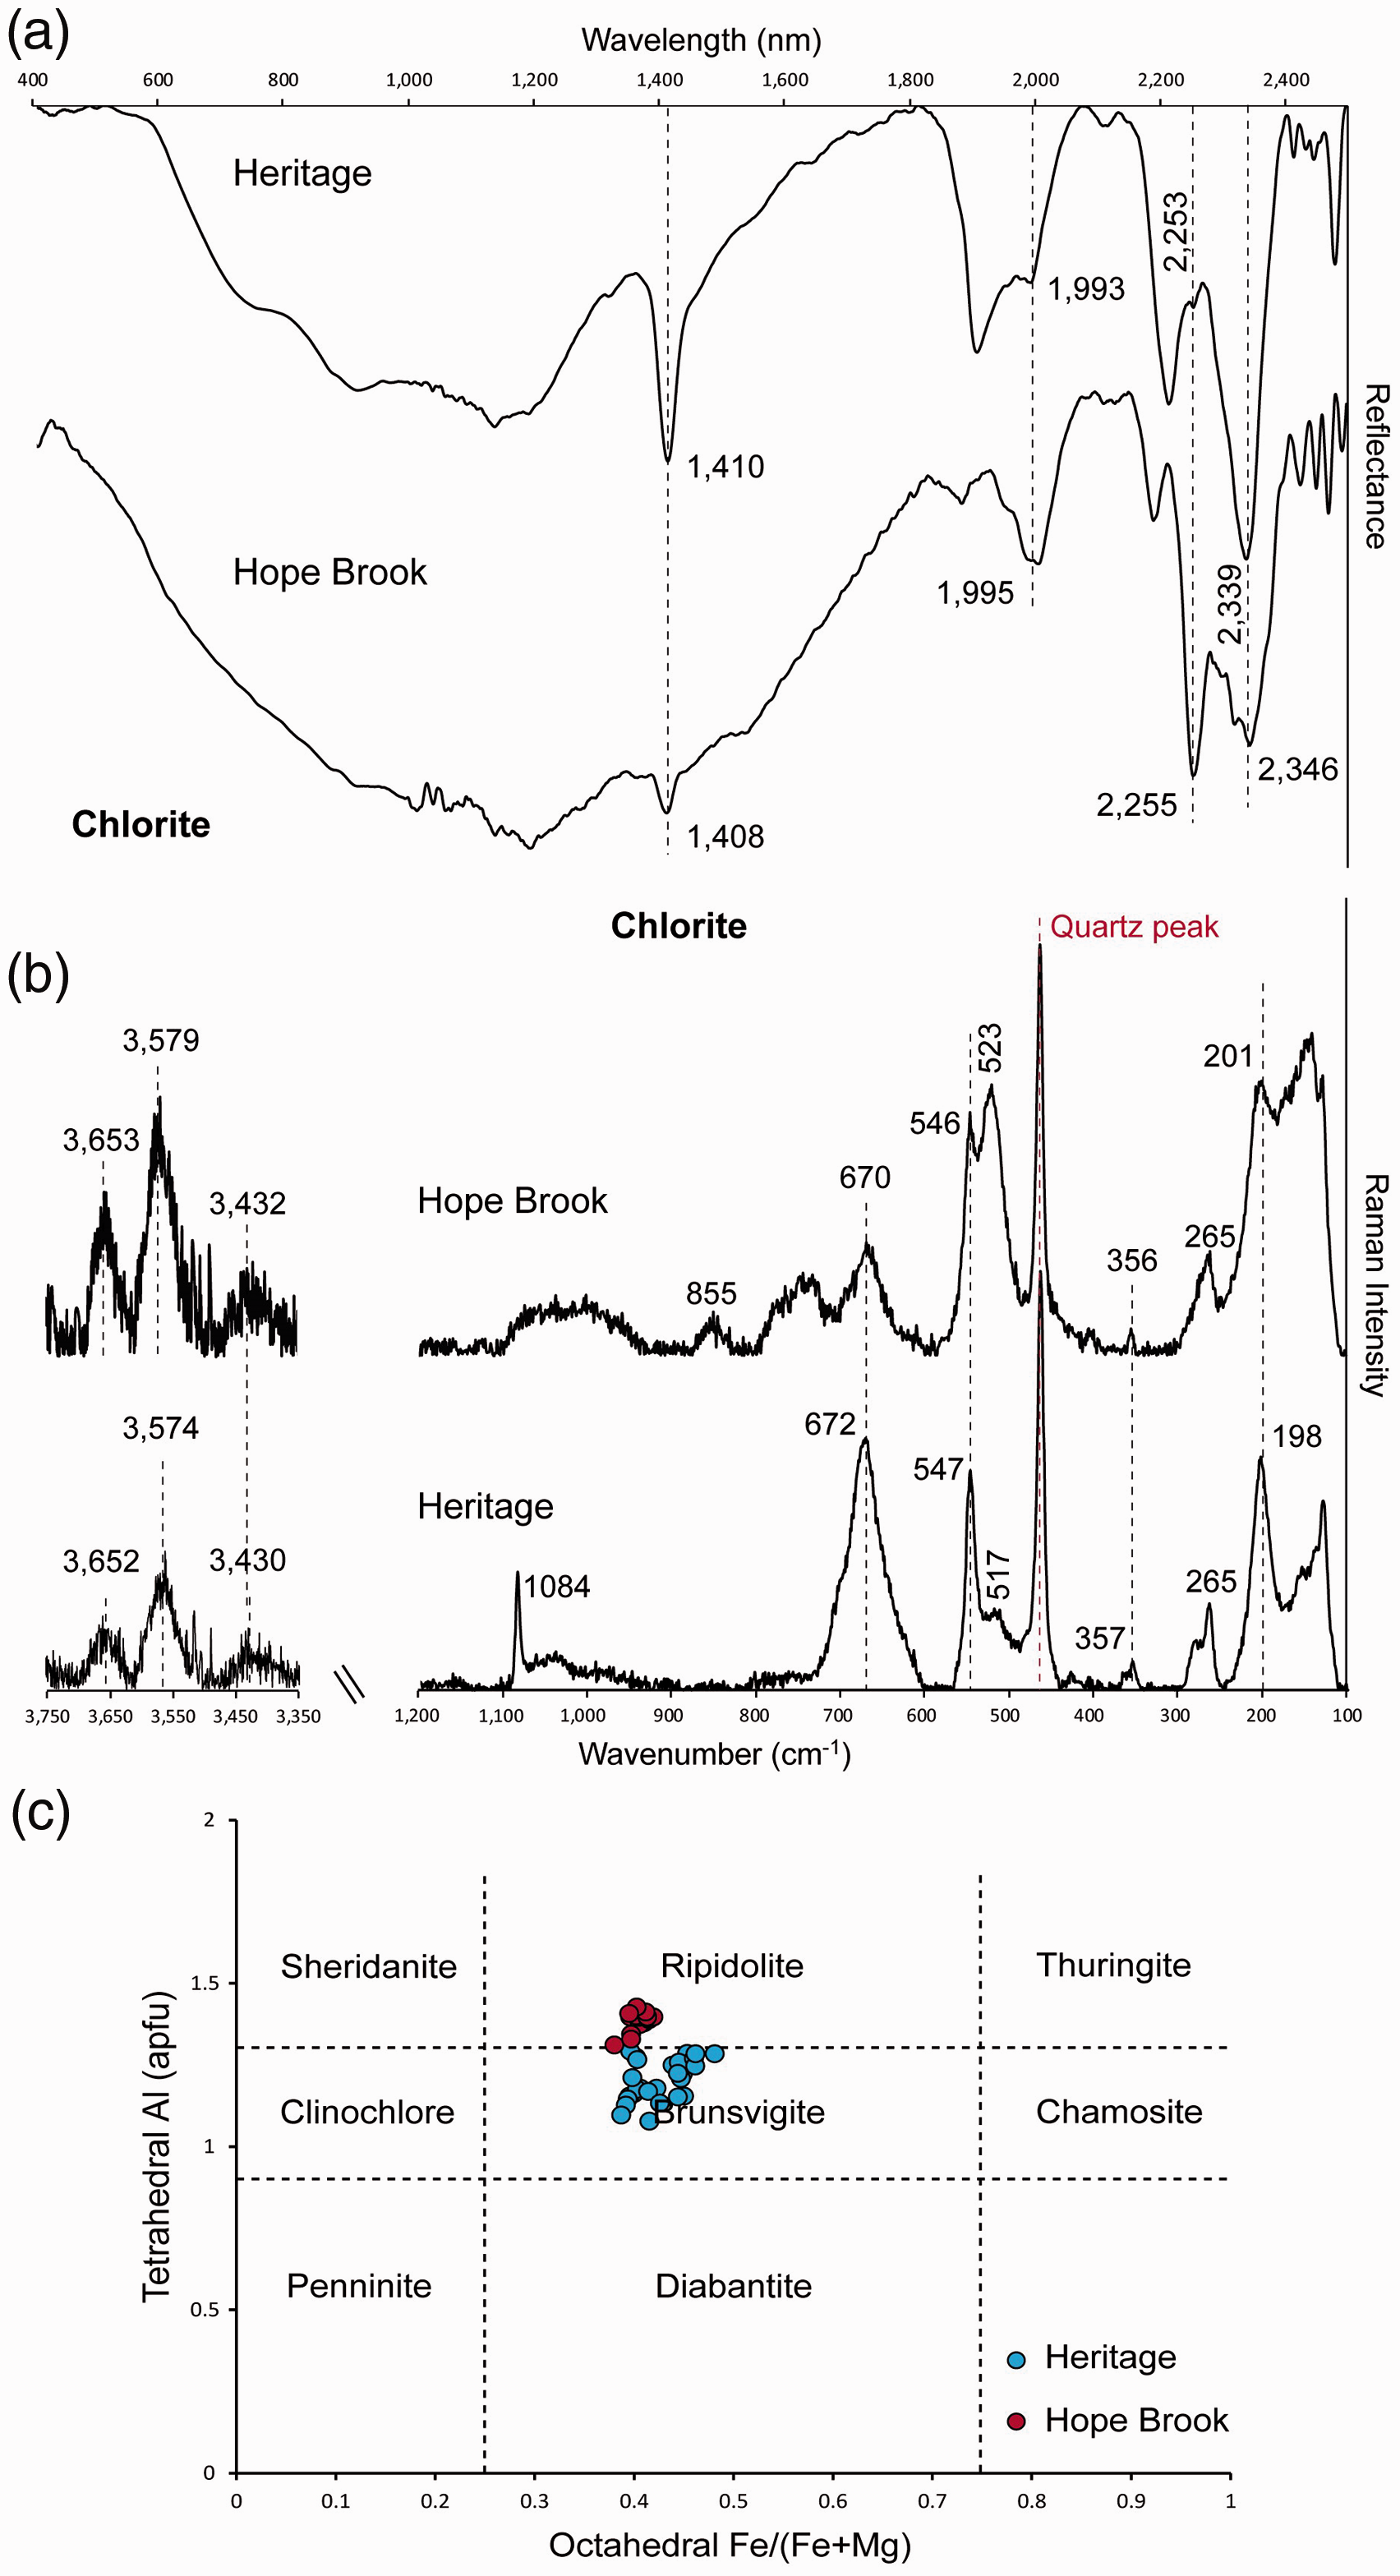
Chlorite from Hope Brook presents major absorption bands at 1408 nm, 1995 nm, 2255 nm, and 2346 nm (Fig. 4a; Table I). As in the case of chlorite from Heritage, the Mg–OH and Fe–OH bands lie between those reported for the clinochlore and chamosite end-members, indicating an intermediate composition of chlorite.
Raman Spectral Features
Chlorite at Heritage is characterized by Raman peaks at 198–214 cm−1, 357–373 cm−1, 541–550 cm−1, 658–675 cm−1, 3420–3430 cm−1, 3559–3574 cm−1, and 3652–3670 cm−1 (Fig. 4b; Table II). The evident downshift in the major Raman peak to 658–675 cm−1 (from the 683 cm−1 of Mg-rich chlorite) together with the very low intensity of the peak located at 357–373 cm−1 suggests an intermediate Fe–Mg composition of chlorite.
The acquisition of Raman spectra of chlorite from Hope Brook was particularly challenging, due to strong fluorescence effects attributed to the fine-grained nature of the chlorite and its association with disseminated pyrite. However, a small number of analyses yielded good Raman spectra, which is characterized by major bands at 201 cm−1, 356 cm−1, 546 cm−1, 670 cm−1, 3432 cm−1, 3579 cm−1, and 3653 cm−1 (Fig. 4b: Table II). As in the case of chlorite from the Heritage prospect, the low wavelength of the main phyllosilicate Raman band at 670 cm−1 and the very low intensity of the 356 cm−1 peak indicate that the chlorite at Hope Brook is an intermediate Fe–Mg chlorite.
Mineral Chemistry
Representative chlorite EPMA analyses are compiled in Table S2, Supplemental Material, and Fig. 4c. Chlorite from both the Heritage low-sulfidation epithermal prospect and the Hope Brook high-sulfidation epithermal deposit show intermediate compositions between the clinochlore and the chamosite endmembers, based on octahedral site occupancy (Fe/(Fe+Mg); Fig. 4c; Table S2, Supplemental Material). Chlorite at both Hope Brook and Heritage is substantially enriched with Fe2+ relative to the clinochlore field (1.62–1.78 a.p.f.u. Fe2+ and 1.59–2.01 a.p.f.u. Fe2+, respectively; Fig. 4c; Table S2, Supplemental Material). At Heritage, the chlorite plots within the brunsvigite field (Fig. 4c). Chlorite from Hope Brook has a tetrahedral Al+3 content of ≥ 1.3 a.p.f.u. and plots within the ripidolite field (Fig. 4c).
Alunite
In this study, alunite was only recognized, either petrographically or spectroscopically, in samples from the Hickey’s Pond high-sulfidation epithermal prospect. Here it is abundant in most of the hydrothermal alteration zones, occurring as coarse to fine-grained crystals disseminated in the altered wallrocks (Fig. S2f, Supplemental Material).
Visible–Near Infrared–Short-Wave Infrared Spectroscopy
Alunite at Hickey’s Pond shows a compositionally diagnostic absorption band between 1490 nm and 1491 nm (Fig. 5a; Table I), indicating the predominance of Na+ over K+ in the alunite structure and a predominantly natroalunite composition. Additional absorption bands occur at 1434–1435 nm, 1763–1766 nm, 2165–2170 nm, 2212–2214 nm, and 2319–2323 nm (Fig. 5a; Table I). SWIR and Raman spectra of alunite group samples. (a) SWIR reflectance spectra of natroalunite from the Hickey’s Pond high-sulfidation epithermal system (Sample HP-4B). Dashed lines indicate characteristic peak positions of natroalunite. (b) Raman spectra of alunite (Sample HP-4B) and natroalunite (Sample HP-6) from Hickey’s Pond in the H2O/OH spectral range (3400–3600 cm–1) and in the spectral range of the fundamental vibrations of silicates (100–1300 cm–1). Dashed lines indicate characteristic peak positions of alunite and natroalunite. (c) Na–K–Ca triangular plot displaying the compositional range of alunite occurring at the Hickey’s Pond high-sulfidation prospect.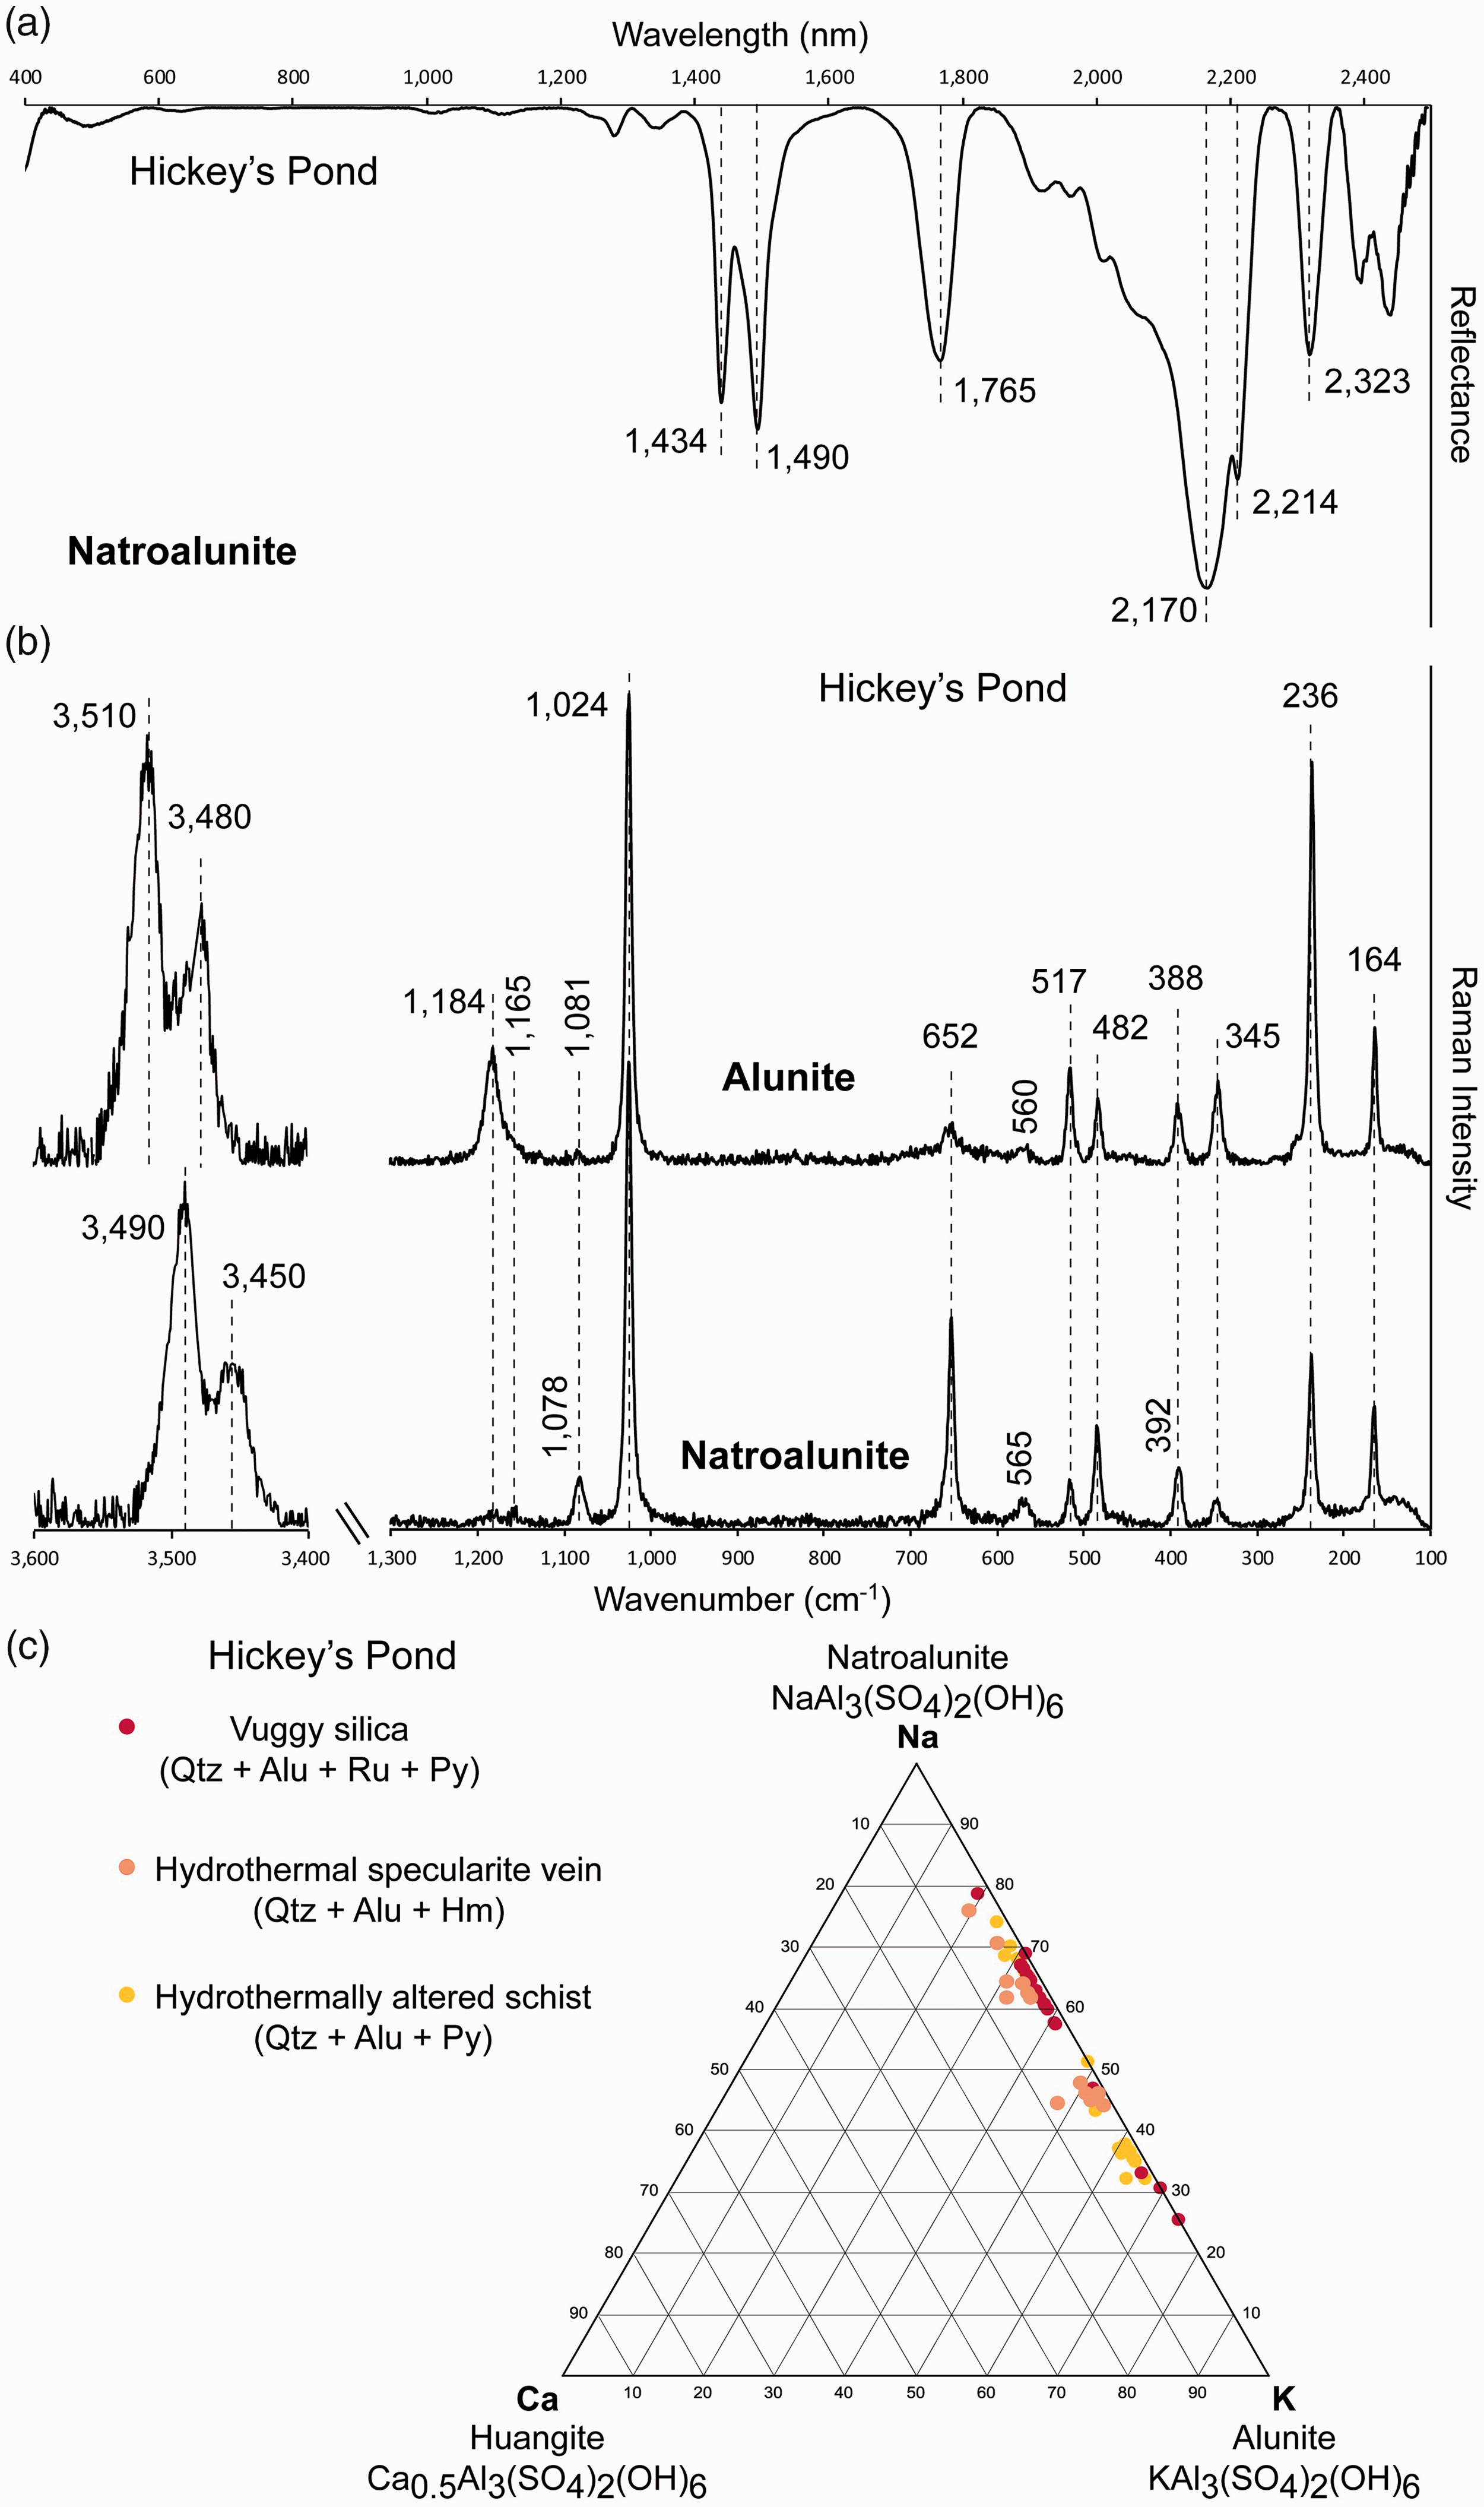
Raman Spectral Features
In the 100–1200 cm−1 spectral region, alunite from Hickey’s Pond presents two clearly distinct Raman spectral styles. Both of them have characteristic Raman bands at 388–394 cm−1, 515–518 cm−1, 560–572 cm−1, 651–656 cm−1, 1024–1025 cm−1, 1078–1086 cm−1, 1160–1166 cm−1, and 1181–1186 cm−1 (Fig. 5b; Table II). However, they differ in the relative intensity of the bands at 651–656 cm−1, 1078–1086 cm−1, and 1181–1186 cm−1. One of the spectral styles has a high-intensity Raman band at 1181–1186 cm−1, as well as the presence of a low-intensity peak at 651–656 cm−1, indicating the presence of the alunite endmember at Hickey’s Pond (Fig. 5b; Table II). The other spectral style contains a higher intensity Raman bands at 652 cm−1 and 1078–1086 cm−1, indicating the presence of natroalunite (Fig. 5b; Table II).
Mineral Chemistry
Electron probe microanalyses confirm the presence of chemical compositions intermediate to the end-members alunite and natroalunite (Fig. 5c; Table S2, Supplemental Material). Individual alunite crystals range from 0.10–0.53 a.p.f.u. K+ and 0.18–0.51 a.p.f.u. Na+ (Table S2, Supplemental Material), with common crystal chemical zonation from a core enriched in K+ (alunite) to crystal rims enriched in Na+ (natroalunite) (Fig. S2f, Supplemental Material).
Discussion
Comparison Between Vis-NIR-SWIR and Raman Spectroscopic Identification and Characterization of Hydrothermal Alteration
Visible–near infrared–shortwave infrared spectroscopy was a useful tool for the rapid identification of hydrothermal alteration minerals in the bulk samples examined in this study. Raman microspectroscopy, in most cases, allowed a better spatial and chemical characterization of hydrothermal alteration at the microscale.
Pyrophyllite was clearly recognized by both Vis-NIR-SWIR and Raman spectroscopies at the Vinjer prospect and the Oval Pit mine (Fig. 2), and the Raman spectra of pyrophyllite reported in this study closely resemble Raman spectral features of pyrophyllite reported in the literature.32,34 However, the adjacent Raman band at 3647 cm−1 reported by Gates et al. 34 and Zhai et al. 48 is not present in Raman spectra of pyrophyllite obtained in this study (Fig. 2b; Table II), which implies that pyrophyllite do not contain significant Fe3+ in the octahedral site. There does appear to be minor substitution of Si4+ by Al3+ in tetrahedral coordination (0.009–0.099 a.p.f.u. tetrahedral Al3+; Table S2, Supplemental Material) and this is consistent with pyrophyllite analyses by Rosenberg and Cliff, 72 who suggested that charge balance is obtained in this case by the formation of extra hydroxyl units. Overall, a distinctive Vis-NIR-SWIR and Raman spectrum, as well as its consistent composition, makes pyrophyllite an easily recognizable key hydrothermal alteration mineral in high-sulfidation epithermal systems using either spectroscopic technique.
The distinction of different members of the white mica group (“sericite” minerals) was of particular interest in this study. At Hope Brook, paragonite was recognized by SWIR spectroscopy, using the characteristic Al–OH band at 2192–2201 nm (Fig. 3a; Table I). However, further investigation by SEM and EPMA revealed the presence of both muscovite and paragonite (Table S2, Supplemental Material), with clearly zoned mica crystals containing Na-rich cores and K-rich rims (Fig. S2e, Supplemental Material). In these samples, Raman spectroscopy could not discern between muscovite and paragonite (Fig. 3b; Table II), showing only minor position shifts in this compositional range (<3–4 cm−1; Table II), with no systematic peak shift linked to changes in K/Na composition. This is consistent with the observations of Wang et al. 32 and suggests that variable ratios of K+ to Na+ in the interlayer position of white mica have a negligible effect on the (Si2O5)2– vibration. Conversely, the incorporation of a bivalent cation, such as Ca2+, in the interlayer position of white mica is controlled by a change in Si/Al ratio of the tetrahedral layer in order to achieve charge balance and would result in distinct Raman spectral features. 32 In contrast to Raman spectroscopy, the response of the ∼2000 nm band in the SWIR spectra allows for the distinction of the main white mica phase at Hope Brook. Shortwave infrared spectroscopy therefore remains nominally superior for discrimination between muscovite and paragonite (Fig. 3a), although it will not elucidate fine scale core-rim zoning as observed at Hope Brook and would probably only detect the most abundant white mica phase in a given sample.
At Heritage, white mica largely shows very similar Raman spectral features to those at Hope Brook (Fig. 3b; Table II). The single notable spectral difference between white mica from these two occurrences resides in the shift of the 1010–1065 cm−1 Raman band detected at Hope Brook to 1082–1113 cm−1 observed at Heritage (Fig. 3b; Table II). In comparison to white mica (muscovite–paragonite) from Hope Brook, white mica at Heritage contains significantly higher contents of tetrahedral Si4+, coupled with lower amounts of IVAl3+ (Table S2, Supplemental Material), indicating a higher degree of Tschermak substitution and a composition closer to phengite (Fig. 3c). This clearly shows that muscovite/paragonite mica compositions can be successfully discerned from more phengitic–celadonitic ones by Raman spectroscopy, based on the band shift described above. The sensitivity of the ∼2000 nm band in the SWIR spectra also allows for a fast distinction between muscovite, paragonite, and phengite, but as stated above, reflectance spectroscopy would only be able to detect the volumetrically dominant white mica phase in a given sample if multiple compositions of white mica and/or zoned white mica crystals are present.
Chlorite samples from the Hope Brook high-sulfidation epithermal deposit and the Heritage low-sulfidation epithermal prospect display coinciding Raman spectral features (Fig. 4; Tables II and SII). According to Raman spectra acquired by Wang et al.,
32
Mg–chlorite shows Raman bands at 203 cm−1, 357 cm−1, 552 cm−1, and 683 cm−1, with a peak position downshift of the 683 cm−1 peak towards 671 cm−1 for Fe–Mg ripidolite. For Heritage and Hope Brook samples, this Si–O–Si related Raman band was found at 658–675 cm−1, and at 670 cm−1, respectively (Figs. 4b and 6a; Table II), suggesting that these examples of hydrothermal chlorite contain substantial Fe2+ in their structure, as confirmed by EPMA results (Table S2 in Supplemental Materials; Fig. 4c). The range to lower wavelengths of the Si–O–Si Raman band recorded at Heritage (658–675 cm−1) in comparison with Hope Brook (670 cm−1; Figs. 4b and 6a) is also consistent with the slightly higher Fe2+ content observed in the Heritage chlorite (Table S2, Supplemental Material). The position of the Si–O–Si Raman band is obviously sensitive to chlorite composition and can be used for semi-quantitative estimation of the Fe2+ content in chlorite (Fig. 6c). Magnesium-rich clinochlore with <0.5 a.p.f.u. Fe2+ has its major phyllosilicate Raman peak at 682–683 cm−1 (Fig. 6c). With the increase of Fe2+ in the octahedral layer, Fe–Mg chlorite of intermediate composition from this study (ripidolite from Hope Brook and brunsvigite from Heritage) shows a shift of the main phyllosilicate Raman band towards lower wavelengths (670–675 cm−1; Fig. 6c). Fe-rich chamosite with >2.5 a.p.f.u. Fe2+ displays its major Raman band at 665 cm−1 (Fig. 6c). Future coupled Raman and electron probe microanalyses of chlorite of variable compositions and from diverse geological environments would help establish a better calibration of the relationship shown in Figure 6c. With regards to Vis-NIR-SWIR spectra, chlorite from both the Hope Brook and Heritage epithermal occurrences show a Fe–OH absorption band at 2240–2262 nm and a Mg–OH absorption band at 2339–2352 nm (Fig. 4a; Table I), indicative of intermediate Fe–Mg chlorite compositions. Iron-rich chlorite can be therefore easily discerned from Mg-rich chlorite by real time reflectance spectroscopy. Raman microspectroscopy, however, has the potential to be used as a tool for the semi-quantitative estimation of Fe2+ content in chlorite, providing more detailed geochemical information beneficial to decision-making during mineral exploration campaigns. (a) Raman spectra of representative samples of chlorite from the Hope Brook and Heritage epithermal occurrences. Raman spectra of near endmember Mg–chlorite (light green line trace) and Mg–Fe–chlorite (dark green line trace), shown for comparison, are from the RRUFF database: clinochlore from the Callaghan Creek (RRUFF ID: R061080) and chamosite from Slesse Creek (RRUFF ID: R060188). (b) Raman spectra of representative samples of alunite from the Hickey’s Pond high-sulfidation epithermal prospect showing the variation in spectral features between alunite and natroalunite end-member spectra. (c) Binary plot of the Raman shift (cm–1) of the main chlorite Si–O–Si Raman band against Fe2+ content (in a.p.f.u.) of chlorite from Hope Brook and Heritage epithermal systems (this study). Also shown are the data for clinochlore from the Crestmore Quarry (RRUFF ID: R060725), clinochlore from the Callaghan Creek (RRUFF ID: R061080), and chamosite from Slesse Creek (RRUFF ID: R060188) from the RRUFF database. Data for clinochlore from Zermatt, Besafotra, Angatsin, and Mg–Fe chlorite from Blausee are from Prieto et al.
44
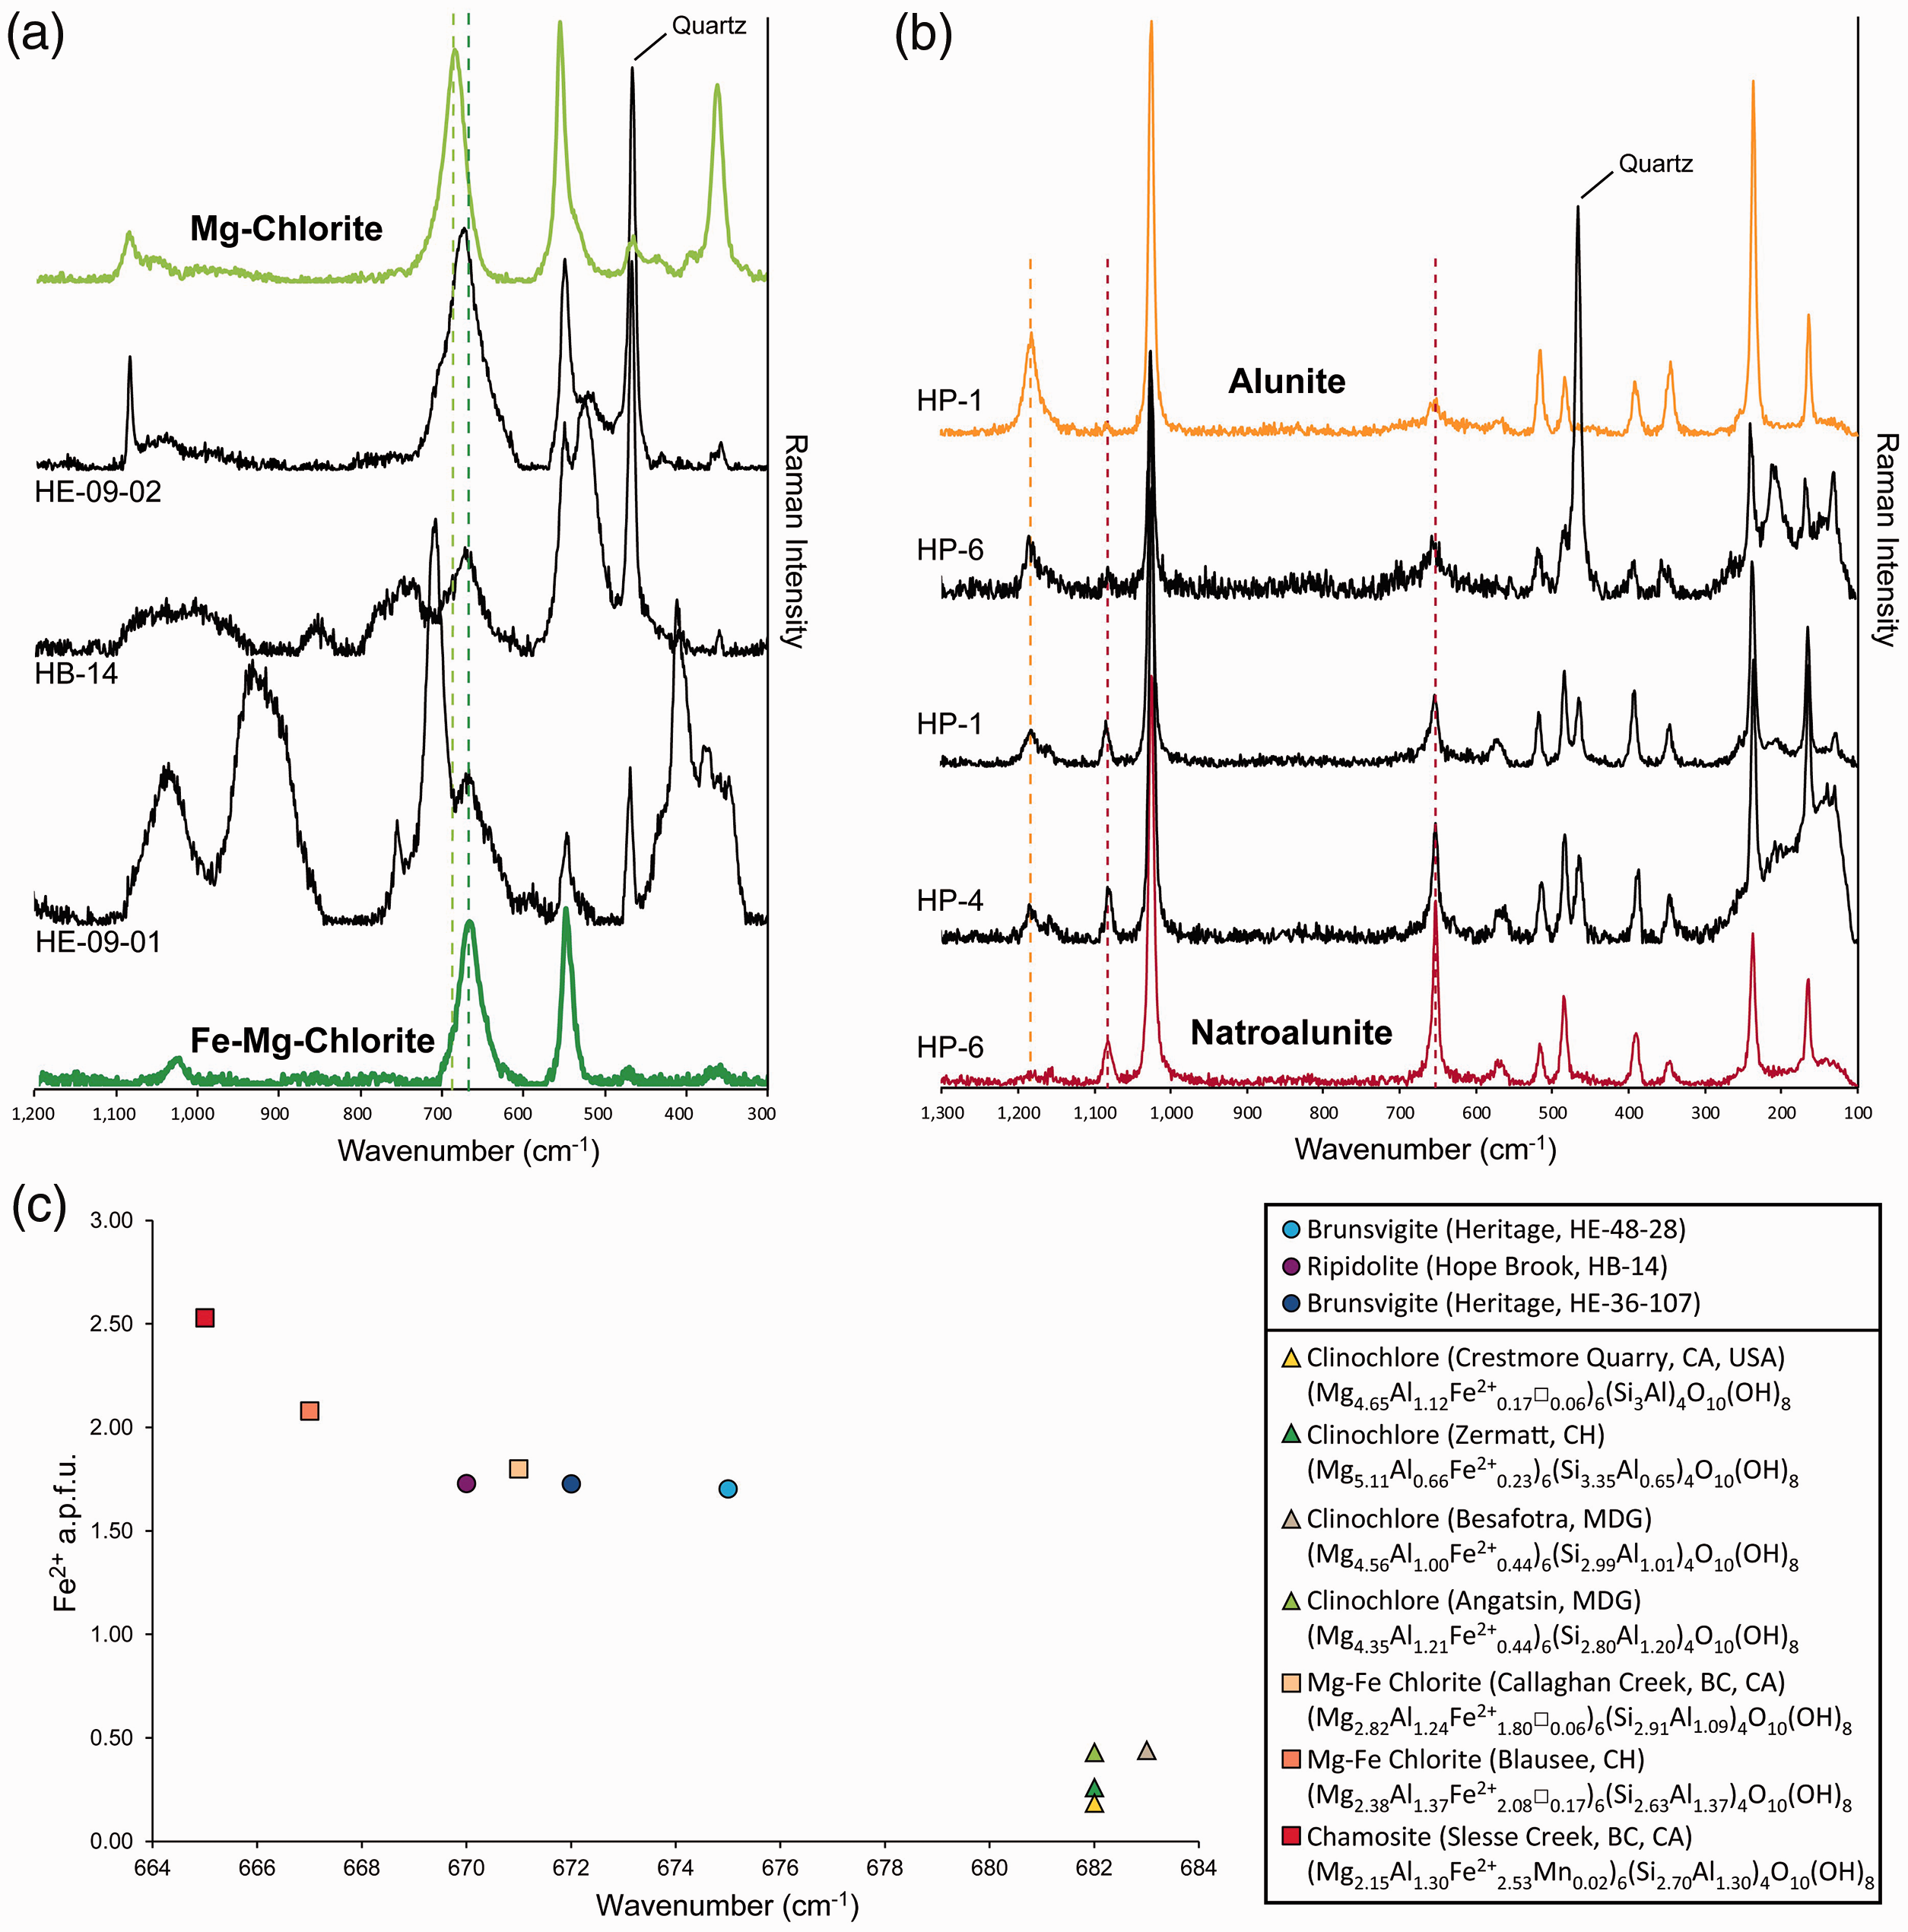
Raman spectra of hydrothermal alunite and natroalunite from the Hickey’s Pond high-sulfidation epithermal system obtained in this study are consistent with the peak positions reported for alunite group minerals by Maubec et al. 58 However, an important number of Raman spectra of alunite from Hickey’s Pond show shifted Raman band positions intermediate between those of alunite and natroalunite endmembers (Fig. 6b), and attributed to the alunite–natroalunite zoning of individual crystals observed using SEM. This interpretation is also consistent with EPMA analyses (Figs. 5c and 6b; Table S2, Supplemental Material). In contrast, Vis-NIR-SWIR spectra of samples from the Hickey’s Pond prospect only detected the presence of natroalunite (Fig. 5a; Table I). This is another example of the limitation of reflectance spectroscopy in the characterization of various phase compositions within the same sample and, in particular, the effective averaging of important microscale features such as chemical mineral zonation.
Some of the Raman and Vis-NIR-SWIR spectra of the studied minerals show peculiar artifacts after the background removal process. In Vis-NIR-SWIR spectra, those artifacts emerge as wide concave absorption features between €600 and €1600 nm (Figs. 2a, 3a, and 4a). These artifacts might be attributed to the presence and interference of Fe-rich phases. In the case of Raman spectra, artifacts are observed in the lower wavelength region of some spectra (<300 cm−1), where the background follows a wide convex medium-to-high intensity band (Figs, 2b, 3b, and 4 b). Such spectral features are attributed to fluorescence effects due to the fine-grained nature of the minerals analyzed and the presence of neighboring Fe-rich phases. The described spectral artifacts are expected in natural geological samples and do not interfere nor modify the position and intensity of the spectral bands most useful for mineral identification and geochemical characterization.
The data presented in this contribution demonstrate that Raman microspectroscopy, in combination with Vis-NIR-SWIR spectroscopy, can accurately characterize key hydrothermal alteration minerals in epithermal systems and can provide complementary high-resolution information at the microscale. A flow chart summarizing the key spectral features for these minerals for both techniques is presented in Figure 7. This figure is designed to serve as a spectral reference for geological samples displaying hydrothermal alteration during Vis-NIR-SWIR and Raman spectroscopic studies in mineral exploration or economic geology research settings. As evidenced by the results reported here, there is a clear advantage in adopting the use of Raman microspectroscopy as a complementary technique to Vis-NIR-SWIR, as it will elucidate the microspectral characteristics of the main hydrothermal alteration phases present in a sample. When combined with preliminary petrography, Raman microspectroscopy can provide further detailed chemical mineral characterization correlated to specific textures or metal delivery event(s). Mineral identification flow chart for pyrophyllite, white mica, chlorite, and alunite based on their main Vis-NIR-SWIR and Raman spectral features. High-intensity spectral features and/or those that provide chemical information and distinction of chemical varieties are marked in bold.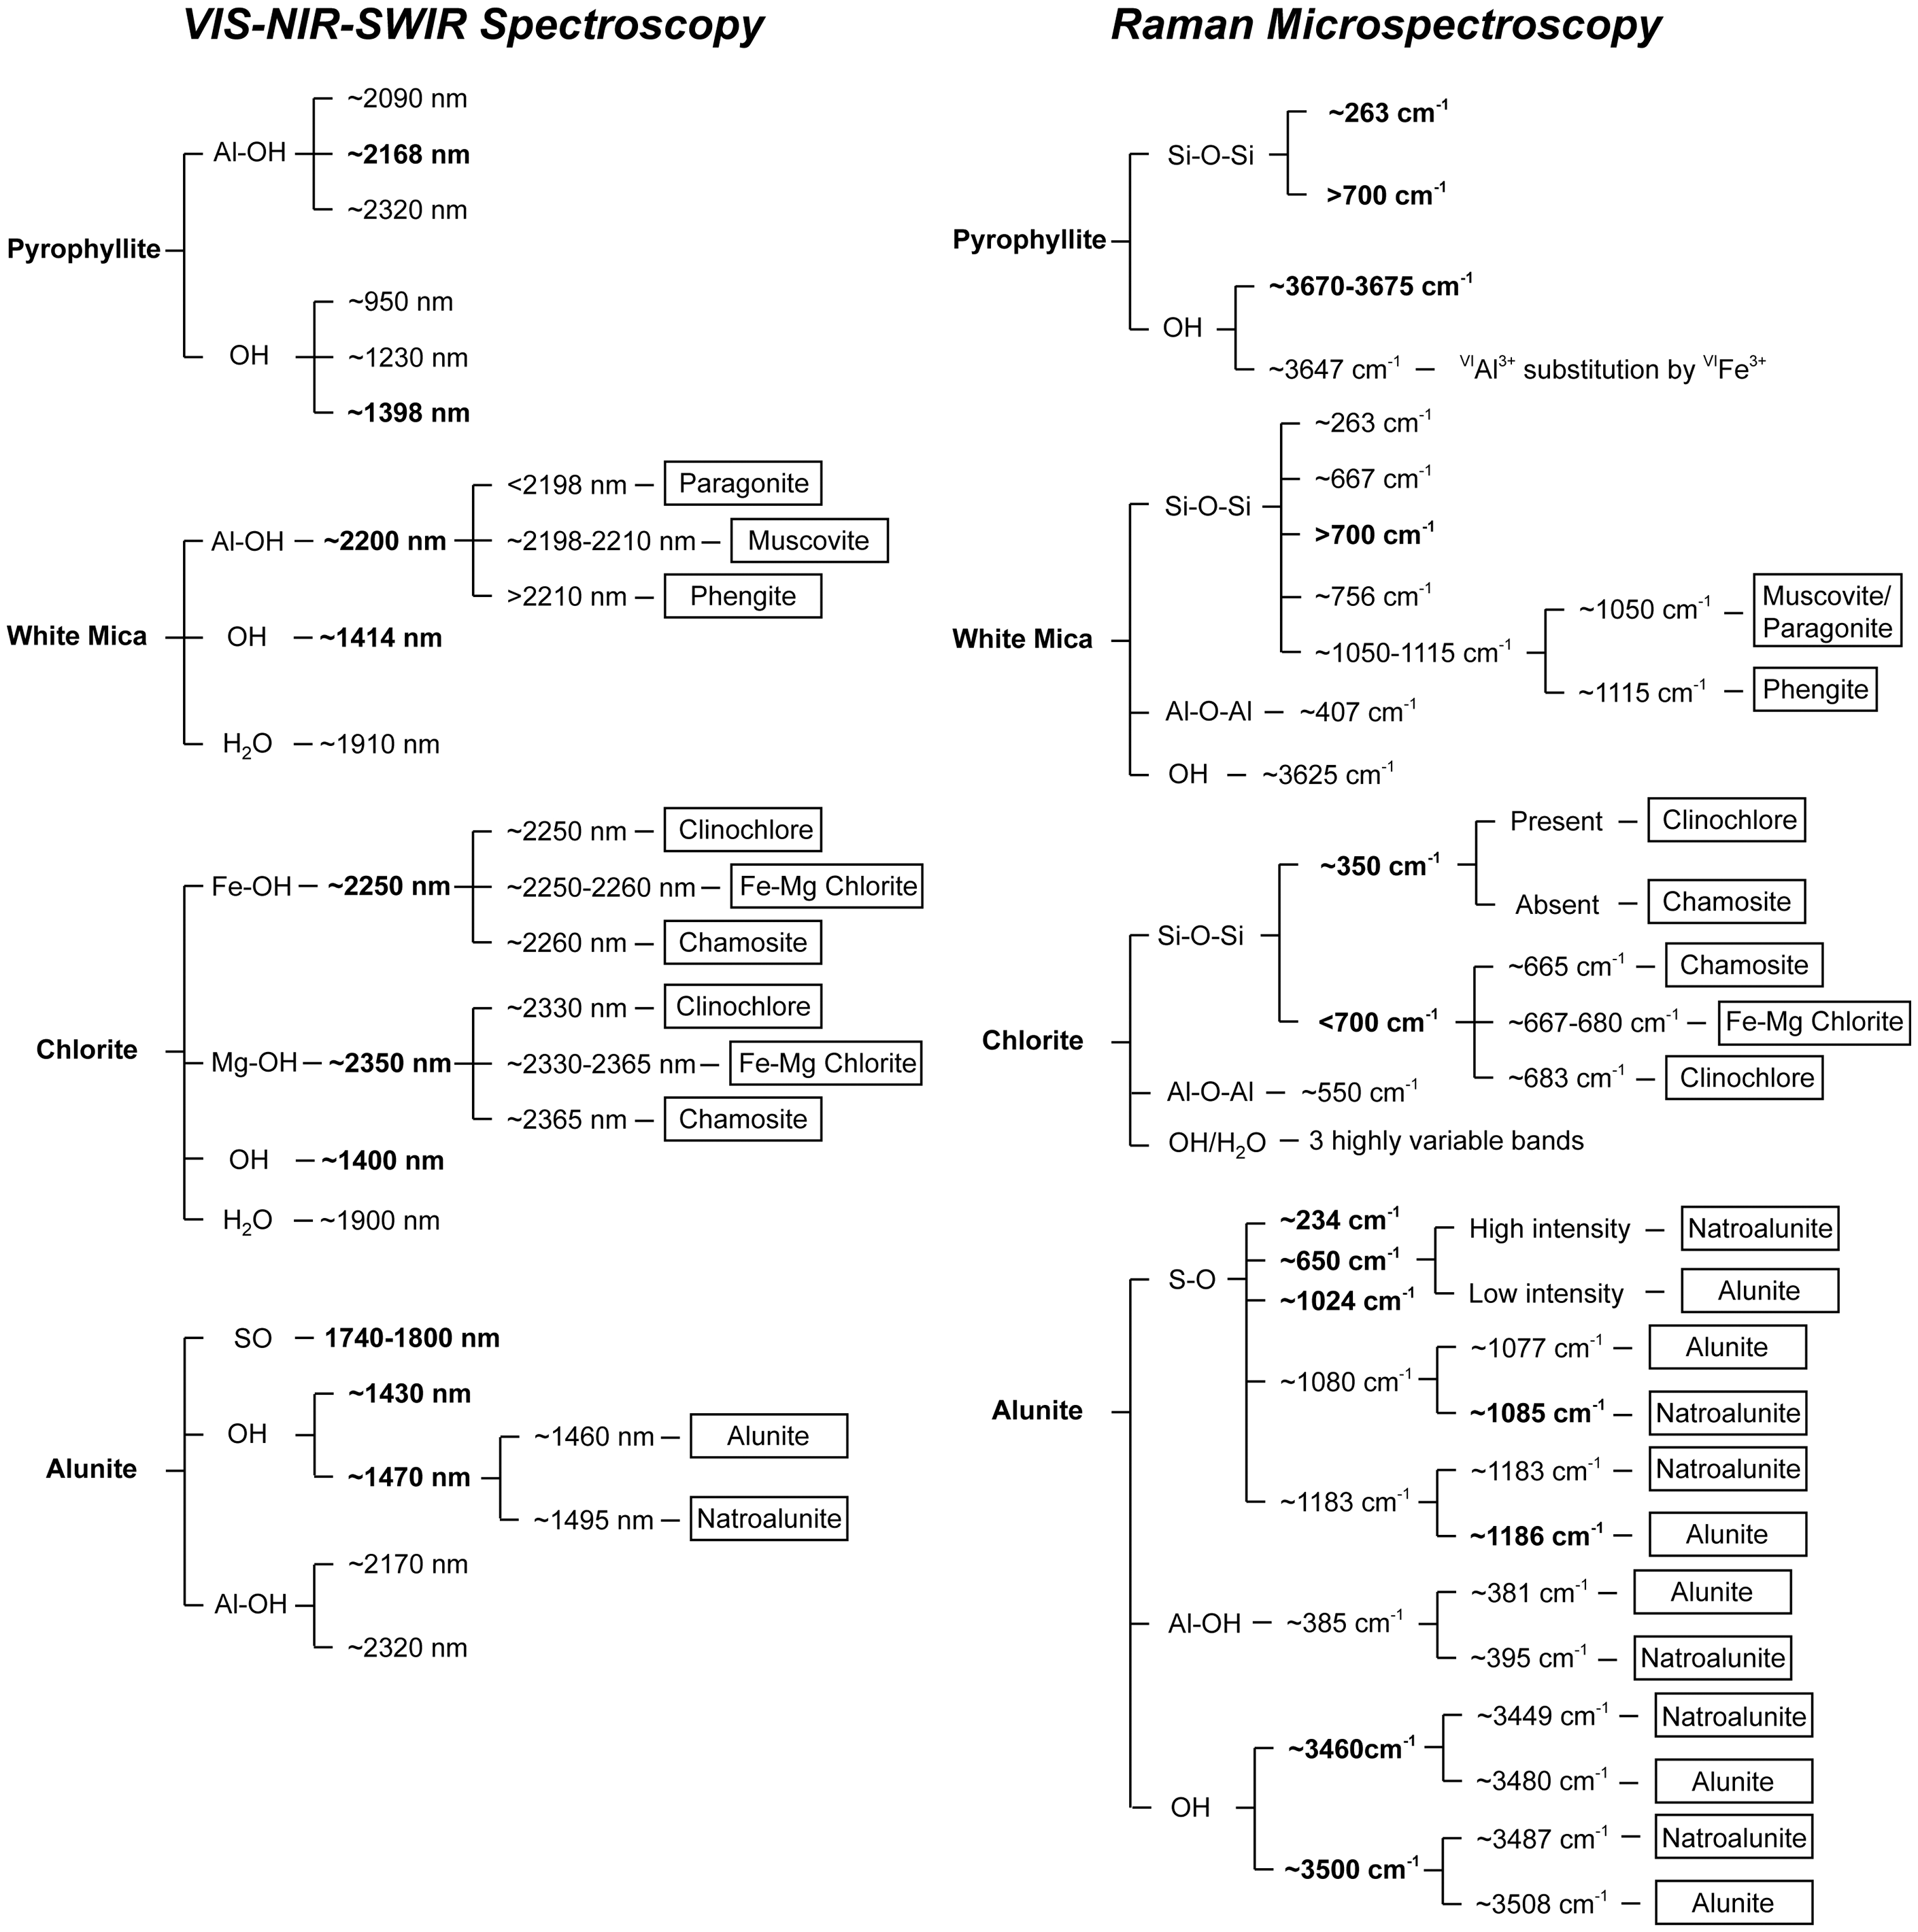
Geological Significance and Implications for Mineral Exploration
Mineralogical and geochemical characterization of phyllosilicates is crucial in hydrothermal ore deposits research and exploration, since they provide insight into the hydrothermal environment, ore-forming processes, and the timing of ore deposition within a multi-stage system.11,73
Field-portable shortwave infrared spectroscopy is currently widely deployed in the mineral exploration industry to map hydrothermal alteration assemblages at the regional-to-deposit scale in a broad range of mineral deposits, including porphyry deposits, 74 epithermal deposits,18,75 iron oxide copper–gold (IOCG) deposits, 76 skarn deposits, 77 and volcanic-hosted massive sulfide deposits.78−82 However, there are some important limitations to this technique: (i) the identification of a mineral phase depends on its ability to produce a measurable reflectance signal, (ii) sparse hydrothermal alteration can sometimes remain undetected or unquantified, (iii) minerals producing stronger reflectance signals, and the presence of multiple minerals with strong reflectance, can mask weaker signals from more diagnostic alteration phases, (iv) many specific absorption bands (e.g., OH band at ∼1400 nm, Al–OH band at ∼2200 nm) are common to a wide range of phyllosilicates, and (v) macroscale spectroscopy cannot discriminate minerals formed by successive hydrothermal events that affected an individual sample.
The mineralogical, spectral, and geochemical data of key hydrothermal alteration phases from epithermal deposits and prospects reported here have application to the initial recognition of epithermal style ore-forming environments, characterization of ore zonation and exploration vectoring, and improving insight into changes in physicochemical conditions during the evolution of hydrothermal systems.
As a component of fine-grained alteration, pyrophyllite can easily be confused with other phyllosilicates in hand specimen or thin section, including talc and the white mica group. Beneficially, it is easily recognized with both Vis-NIR-SWIR spectroscopy and Raman spectroscopy (Fig. 7). Although it can occur in other environments (e.g., high-grade metapelites), in terranes prospective for epithermal mineralization pyrophyllite is a characteristic mineral of high-sulfidation style hydrothermal alteration. It is indicative of extensive leaching of host rocks by highly acidic hydrothermal fluids and is formed in the initial stages of hydrothermal alteration, generally in zones surrounding the massive silica (vuggy silica) core of typical high-sulfidation epithermal systems.2,4
In the case of white mica, the presence of paragonitic cores and muscovitic rims at Hope Brook has been interpreted by Arbiol et al. 11 as the result of the compositional evolution of hydrothermal fluids in this high-sulfidation epithermal system. In contrast, white mica from the Heritage prospect is phengitic in composition and formed under conditions of near-neutral pH, which in the low-sulfidation epithermal environment is achieved by the successful and complete buffering of initially acidic fluids by the host rocks.11,82
Based on chemical composition, chlorite at Hope Brook is classified as ripidolite, whereas chlorite at Heritage is brunsvigite (Fig. 4c). Chlorite geothermometry by Arbiol et al., 11 based on the semi-quantitative geothermometer of Inoue et al., 83 returned estimated temperatures of formation of hydrothermal chlorite between 201 ℃ and 297 ℃ at Hope Brook and between 108 ℃ and 192 ℃ at Heritage. This is consistent with the higher temperature range generally perceived for high-sulfidation (proximal to intrusion, magmatic fluids predominate) versus low-sulfidation (more distal from intrusion, circulated meteoric waters dominant) epithermal systems. 4 According to Arbiol et al., 11 the higher content of Al in chlorite from Hope Brook is interpreted to be due to a higher degree of Tschermak substitution ((Mg,Fe2+)VI+SiIV ↔ AlIV+(Al,Fe3+)VI), which is controlled by temperature, pressure, and fluid and host rock composition. 84 Based on textural and chemical observations, as well as on geothermometry, chlorite at Hope Brook is interpreted to have formed during later stages of hydrothermal activity, forming an outer envelope to the vuggy silica core and Au mineralized zone of the epithermal system. 11 In contrast, chlorite at Heritage is widespread in all alteration zones, has elevated contents of Mn (Table S2, Supplemental Material), and is interpreted to have formed during the main stages of hydrothermal activity at Heritage due to pervasive phyllic/chloritic alteration. 11
Raman spectroscopy not only confirmed the presence of alunite at Hickey’s Pond, but also revealed two different compositional populations (Fig. 5b), in conjunction with SEM and EPMA data. In a mineral exploration and/or research setting, Raman microspectroscopy thus emerges as a reliable tool for the identification and discrimination of alunite and natroalunite (Fig. 7), as illustrated by this example. In this high-sulfidation epithermal prospect, alunite/natroalunite crystals are interpreted to be hypogene, formed during the main stages of widespread hydrothermal alteration by oxidizing and acidic fluids. 2 The progression from alunite to natroalunite in high-sulfidation epithermal systems, as observed in Hickey’s Pond, has been interpreted by various authors to record an increase in fluid temperatures.85,86 The link between the progression towards Na-rich alunite and gold deposition at Hickey’s Pond requires additional, more detailed, examination. However, meter scale alunite–natroalunite zoning might provide a vector towards core zones of precious metal mineralization.4,87
The findings of this study apply most directly to economic geology research and the mineral exploration industry, where the application of Raman microspectroscopy, coupled with Vis-NIR-SWIR spectroscopy, could provide a faster, more precise, and more cost-efficient method, in comparison to more costly and time-consuming electron probe investigations (SEM, EPMA), for the identification and chemical characterization of hydrothermal alteration minerals at the microscale. By measuring key Vis-NIR-SWIR and Raman spectral features (Fig. 7), chemical variations for some alteration minerals of interest at both the deposit-scale and the individual grain-scale can be discerned and mapped in real and near-real time, respectively, thus promoting the definition of exploration vectors toward economic mineralization in the epithermal environment and other hydrothermal systems (e.g., porphyry copper, volcanogenic massive sulfides, orogenic gold, etc.). The characterization of key hydrothermal alteration minerals associated with mineralization can provide critical information on ore genesis, physicochemical characteristics of mineralizing hydrothermal fluids, and ore precipitation mechanisms. Additionally, this approach has widespread potential applications in mineralogy, petrology, and planetary exploration. The identification of hydrothermal minerals on Mars or other planetary bodies via Raman spectroscopy could provide evidence for high-temperature hydrothermal activity during future solar system exploration missions.
Conclusion
The results presented in this paper demonstrate that Raman microspectroscopy, coupled with Vis-NIR-SWIR spectroscopy, can readily identify and distinguish many important hydrothermal alteration minerals in situ at the microscopic scale, using fairly simple and nondestructive sample preparation. High-quality Raman spectra of alunite (alunite–natroalunite series), pyrophyllite, white mica (phengite and muscovite/paragonite), and Fe–Mg chlorite (ripidolite and brunsvigite) have been obtained from drill core and surface samples using standard instrumentation.
Detailed compositional information can be extracted from the Raman spectra for some phyllosilicates, particularly chlorite, white mica with substantial Tschermak substitution (phengite/celadonite), and members of the alunite–natroalunite solid solution. This additional spectroscopic information could be applied to map solid solution compositional variations of minerals at the deposit-scale, with potential as a vector to ore mineralization during mineral exploration campaigns.
Notably, the reliable identification of specific white mica minerals present in the sample using Vis-NIR-SWIR and Raman spectroscopy can address the commonly widespread and ambiguous classification of “sericite”, a term used widely to refer to fine-grained white mica in ore deposit exploration and research. The sensitivity of the Raman band between 1000 cm−1 and 1150 cm−1 to changes in Si4+ and Al3+ in tetrahedral coordination suggests that compositional variations due to Tschermak substitution can be effectively detected by Raman microspectroscopy. Consequently, purely muscovitic/paragonitic mica compositions can be successfully distinguished from more phengitic/celadonitic compositions at the microscale by studying the wavelength of this diagnostic Raman band.
In addition to white mica, the position of the main chlorite Si–O–Si Raman band shifts from 683 cm−1 for Mg-rich chlorite to 665 cm−1 for Fe-rich chlorite. It therefore appears practical to estimate Fe2+ content of hydrothermal chlorite at the microscale using Raman spectroscopy. Further study, incorporating a larger set of samples with diverse Mg–Fe contents would be helpful in elucidating and calibrating this relationship.
These Raman spectral characteristics are potentially useful during mineral exploration campaigns and ore deposits research, where they could be applied in a complementary fashion to initial real time Vis-NIR-SWIR acquisition. The information obtained through the application of Raman spectroscopy at the microscale would be particularly valuable immediately after initial exploration efforts, when suitable outcrop or drill core samples have been collected. Based on the present study of examples from epithermal deposits, Raman microspectroscopy has been shown to be a promising, cost-effective, and near-real time method to obtain mineralogical and geochemical information of key hydrothermal phases at the microscale, with potential application to other ore deposits of hydrothermal origin.
Supplemental Material
sj-zip-1-asp-10.1177_00037028211047869 - Supplemental material for Raman Spectroscopy Coupled with Reflectance Spectroscopy as a Tool for the Characterization of Key Hydrothermal Alteration Minerals in Epithermal Au–Ag Systems: Utility and Implications for Mineral Exploration
Supplemental material, sj-zip-1-asp-10.1177_00037028211047869 for Raman Spectroscopy Coupled with Reflectance Spectroscopy as a Tool for the Characterization of Key Hydrothermal Alteration Minerals in Epithermal Au–Ag Systems: Utility and Implications for Mineral Exploration by Carlos Arbiol and Graham D. Layne in Applied Spectroscopy
Footnotes
Acknowledgments
The authors would like to thank Dr. Stephen Piercey and Dr. Erika Merschrod for facilitating access to the Vis-NIR-SWIR spectrometer and Raman spectrometers, respectively. In addition, the authors would like to acknowledge the assistance from Liam Whelan, Lucas Stewart, and Silvana Rodrigues Pereira during Raman analysis.
Declaration of Conflicting Interests
The authors declared no potential conflicts of interest with respect to the research, authorship, and/or publication of this article.
Funding
The author(s) disclose receipt of the following financial support for the research, authorship, and/or publication of this article: Analytical work was funded by the Natural Sciences and Engineering Research Council via a Discovery Grant to the second author (RGPIN/005037-2017). Fieldwork was possible thanks to a Student Research Grant (SRG) awarded by the Newmont Mining Corporation Fund via the Society of Economic Geologists (SEG) Foundation in 2017.
Supplemental Material
All supplemental materials mentioned in the text are available in the online version of the journal.
References
Supplementary Material
Please find the following supplemental material available below.
For Open Access articles published under a Creative Commons License, all supplemental material carries the same license as the article it is associated with.
For non-Open Access articles published, all supplemental material carries a non-exclusive license, and permission requests for re-use of supplemental material or any part of supplemental material shall be sent directly to the copyright owner as specified in the copyright notice associated with the article.