
Abstract
Inter- and intramolecular interactions in multicomponent polymer systems influence their physical and chemical properties significantly and thus have implications on their synthesis and processing. In the present study, chemical images were obtained by plotting the peak position of a spectral band from the data sets generated using in situ attenuated total reflection Fourier transform infrared (ATR FT-IR) spectroscopic imaging. This approach was successfully used to visualize changes in intra- and intermolecular interactions in poly(3-hydroxybutyrate)/poly(
Keywords
Introduction
Poly(3-hydroxybutyrate) (PHB) is one of the most popular biodegradable polymers derived from microorganisms. It is a semi-crystalline polyester with a glass transition temperature (Tg) of approximately 4 ℃.1–4 Poly(
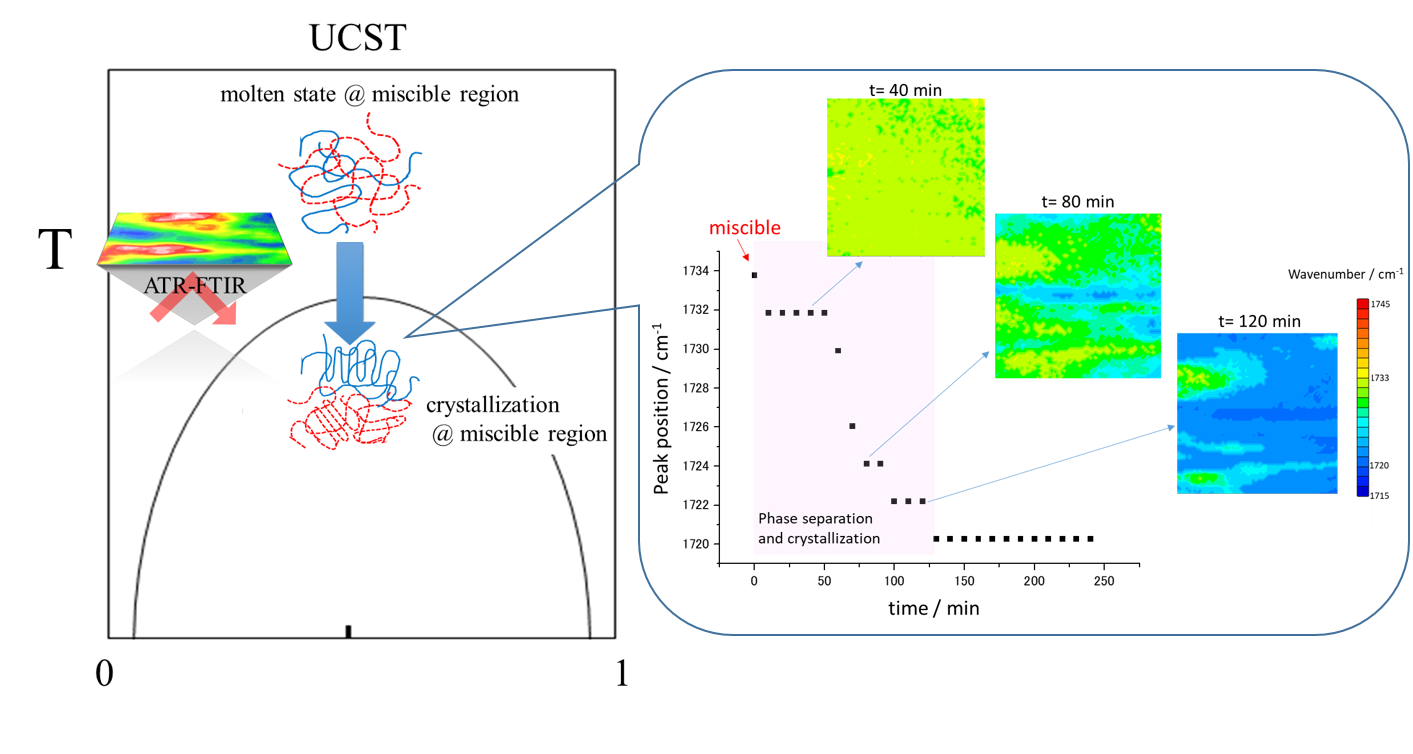
The PHB/PLLA blend shows biodegradability and good compatibility. Their properties can be controlled by the ratio of blend components, which may lead to the expansion of applications for biodegradable polymers. It has been reported that PHB/PLLA blends with high molecular weight blend components are immiscible in the molten state, while blends of PHB with a low-molecular-weight PLLA (Mw < 18 000) are miscible in the molten state.20–23 Since both PHB and PLLA are semi-crystalline polymers, these polymer blends crystallize at temperatures below their melting points. The PHB (Mw = 5000)/PLLA (Mw = 50 000) blend shows upper critical solution temperature (UCST) curves in the available temperature range. 24 In our previous study, simultaneous visualization of phase separation and crystallization in PHB/PLLA blends was realized using in situ attenuated total reflection (ATR) Fourier transform infrared (FT-IR) spectroscopic imaging. The appearance and gradual separation of crystalline polymer-rich domains were clearly shown in the time-dependent ATR FT-IR spectroscopic images. 24 These ATR FT-IR spectroscopic images were prepared using integrated absorbance of the ν(C=O) band of crystalline PHB (1730–1700 cm−1) and the ν(C=O) band of crystalline PLLA (1762–1753 cm−1).
In the PHB/PLLA blend system, crystallization and phase separation occur simultaneously because both blend components are crystallizable polymers.20,24 An important finding in our imaging study was that as the phase separation progresses, the intermolecular interactions between PHB and PLLA in the miscible state change to inter- and intramolecular hydrogen bonds between PHBs in the immiscible state. Since the situation of inter- and intramolecular hydrogen bonds can be reflected by the position of the ν(C=O) band in the spectrum, the change of intermolecular interactions results in a unique peak shift of the ν(C=O) band that cannot be observed in the immiscible PHB/PLLA blend and PHB homopolymer. 20 Therefore, the aim of the present study is to visualize the change in intra- and intermolecular interactions induced by both phase separation and crystallization using ATR FT-IR spectroscopic images obtained on the position of spectral band. This methodology was first reported by Kazarian et al. in the observation of the crystalline polymorphs of drugs. 25 Then, Shinzawa et al. reported that NIR imaging analysis by band position shift was useful in the tablet analysis containing cellulose.26,27 In the present study, we attempted to use ATR FT-IR spectroscopic imaging based on the observation of the band position to analyze inter- and intramolecular interactions in polymer blends. Moreover, through comparing the obtained images based on the observation of the band position with images obtained by plotting the distribution of integrated absorbance,28–34 we have demonstrated the potential of the analysis of the images, produced by in-situ ATR FT-IR spectroscopic imaging, based on the band position as a new approach to visualize different types of inter- or intramolecular interactions. To the best of our knowledge, this is the first study to visualize different types of inter- or intramolecular interactions between polymer molecules in the multicomponent polymer system through spectroscopic images based on the position of spectral bands.
Experimental
Samples
The PHB (Mw = 5000 g/mol, Fig. 1a) was obtained from Polysciences, Inc., and PLLA (Mw = 50 000 g/mol, Fig. 1b) was purchased from BMG Inc., Japan. The melting temperatures (Tm) of PHB (Mw = 5000 g/mol) and PLLA (Mw = 50 000 g/mol) are 163 and 182 ℃, respectively.
Chemical structures of (a) PHB and (b) PLLA.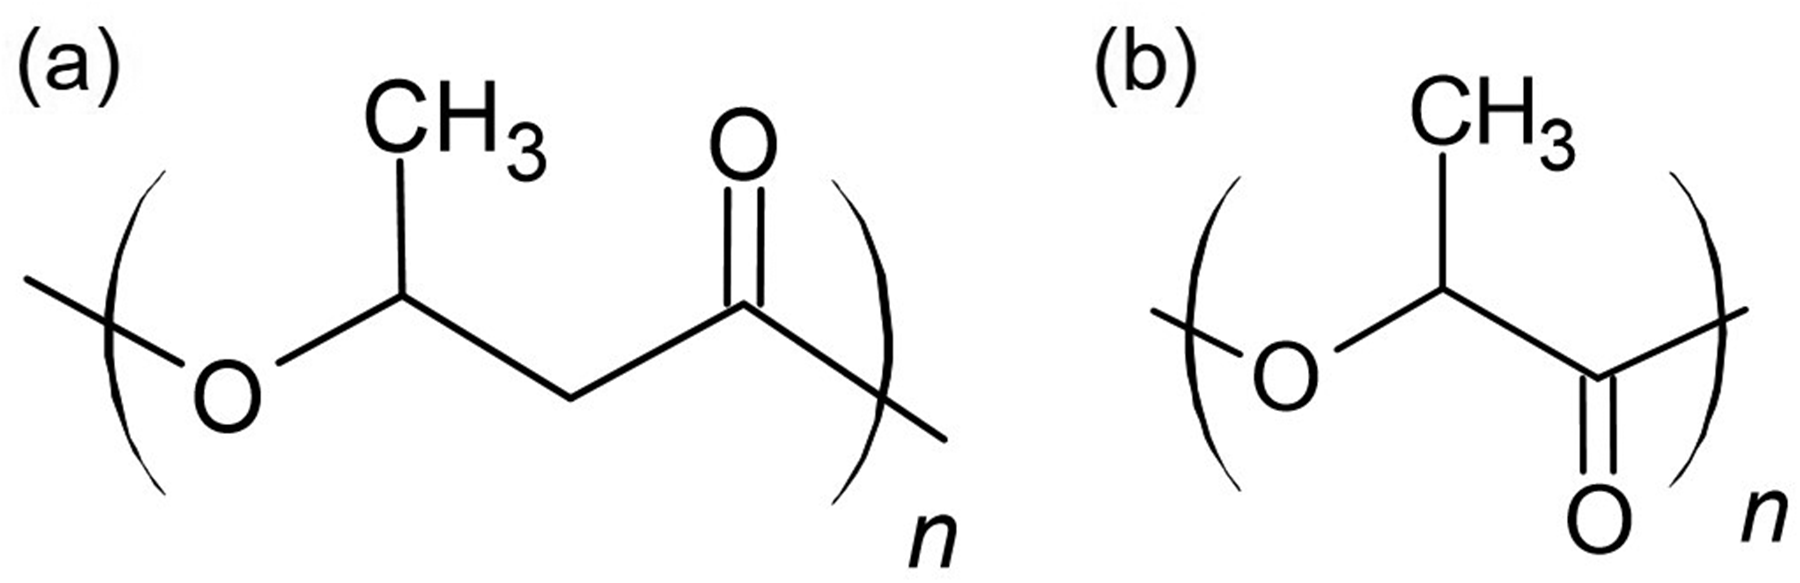
Preparation of the PHB/PLLA Blend
The PHB and PLLA were dissolved in chloroform with a weight ratio (PHB/PLLA = 75/25). The polymer blend solution was then stirred (300 rpm) at room temperature even after both PHB and PLLA were completely dissolved to prevent phase separation prior to the ATR FT-IR measurements. During the measurement, the polymer blend solution was cast on the measuring surface of the ATR crystal forming a thin film covering the whole diamond. An ATR FT-IR spectrometer was used to monitor whether the chloroform remaining in the sample had completely evaporated. The process of isothermal melt crystallization is the same as that in our previous research. 24
Macro ATR FT-IR Spectroscopic Imaging Measurement
A focal plane array (FPA) detector (Santa Barbara Focalplane), connected with a Tensor 27 FT-IR spectrometer (Bruker Corp.), was used to measure ATR FT-IR images in continuous scan mode. Spectra were collected with a 4 cm−1 spectral resolution and 64 scans in the range of 3900–850 cm−1. The FPA detector has 4096 small pixels arranged in a 64 × 64 grid format. Each pixel measures an infrared spectrum, and 4096 spectra are acquired in a single measurement. A diamond ATR accessory (Golden Gate, Specac Ltd.) aligned in the IMAC large sample compartment attached to the FT-IR spectrometer. The obtained data were recorded with Opus (Bruker Corp.) and analyzed using Matlab. According to the Beer–Lambert Law, the absorbance of a spectral band is proportional to the concentration of its corresponding component. Thus, through plotting the integrated absorbance of a certain band as colors, the concentration and spatial distribution of each component can be obtained.23,24 In terms of spectroscopic images based on the observation of the band position,25–27 the wavenumber of maximum absorbance in the ν(C=O) band region of PHB and PLLA for all of the pixels were obtained through Matlab. Spectroscopic images based on the observation of the band position were produced using GraphR to reveal the distribution of peak positions. A color bar from red (high value) to blue (low value) is attached beside the obtained images. The imaging area is approximately 0.6 × 0.55 mm 2 with a spatial resolution of approximately 10–12 µm. The size of PHB spherulites may range from ten to hundreds of micrometers depending on conditions and molecular weights.35,36
Results and Discussion
Phase Separation and Crystallization Processes of PHB/PLLA (75/25) Blend Monitored Using ATR FT-IR Images Based on the Band Position
Figure 2 shows the phase diagram of PHB/PLLA blends (Mw,PHB = 5000 and Mw,PLLA = 50 000), which indicates the critical temperature for phase separation and crystallization at different compositions. In the present study, the PHB/PLLA (75/25) blend with a higher concentration of PHB was selected as the sample, because the ν(C=O) band of crystalline PHB is more independent than that of crystalline PLLA, as shown in Figure S1 (Supplemental Material). In the PHB/PLLA (75/25) blend, phase separation and crystallization have been found to occur less than or equal to 145 ℃.
24
The phase diagram of PHB/PLLA blends (Mw,PHB = 5000 and Mw,PLLA = 50 000). Reproduced from Lu et al.
24
with permission of the American Chemical Society.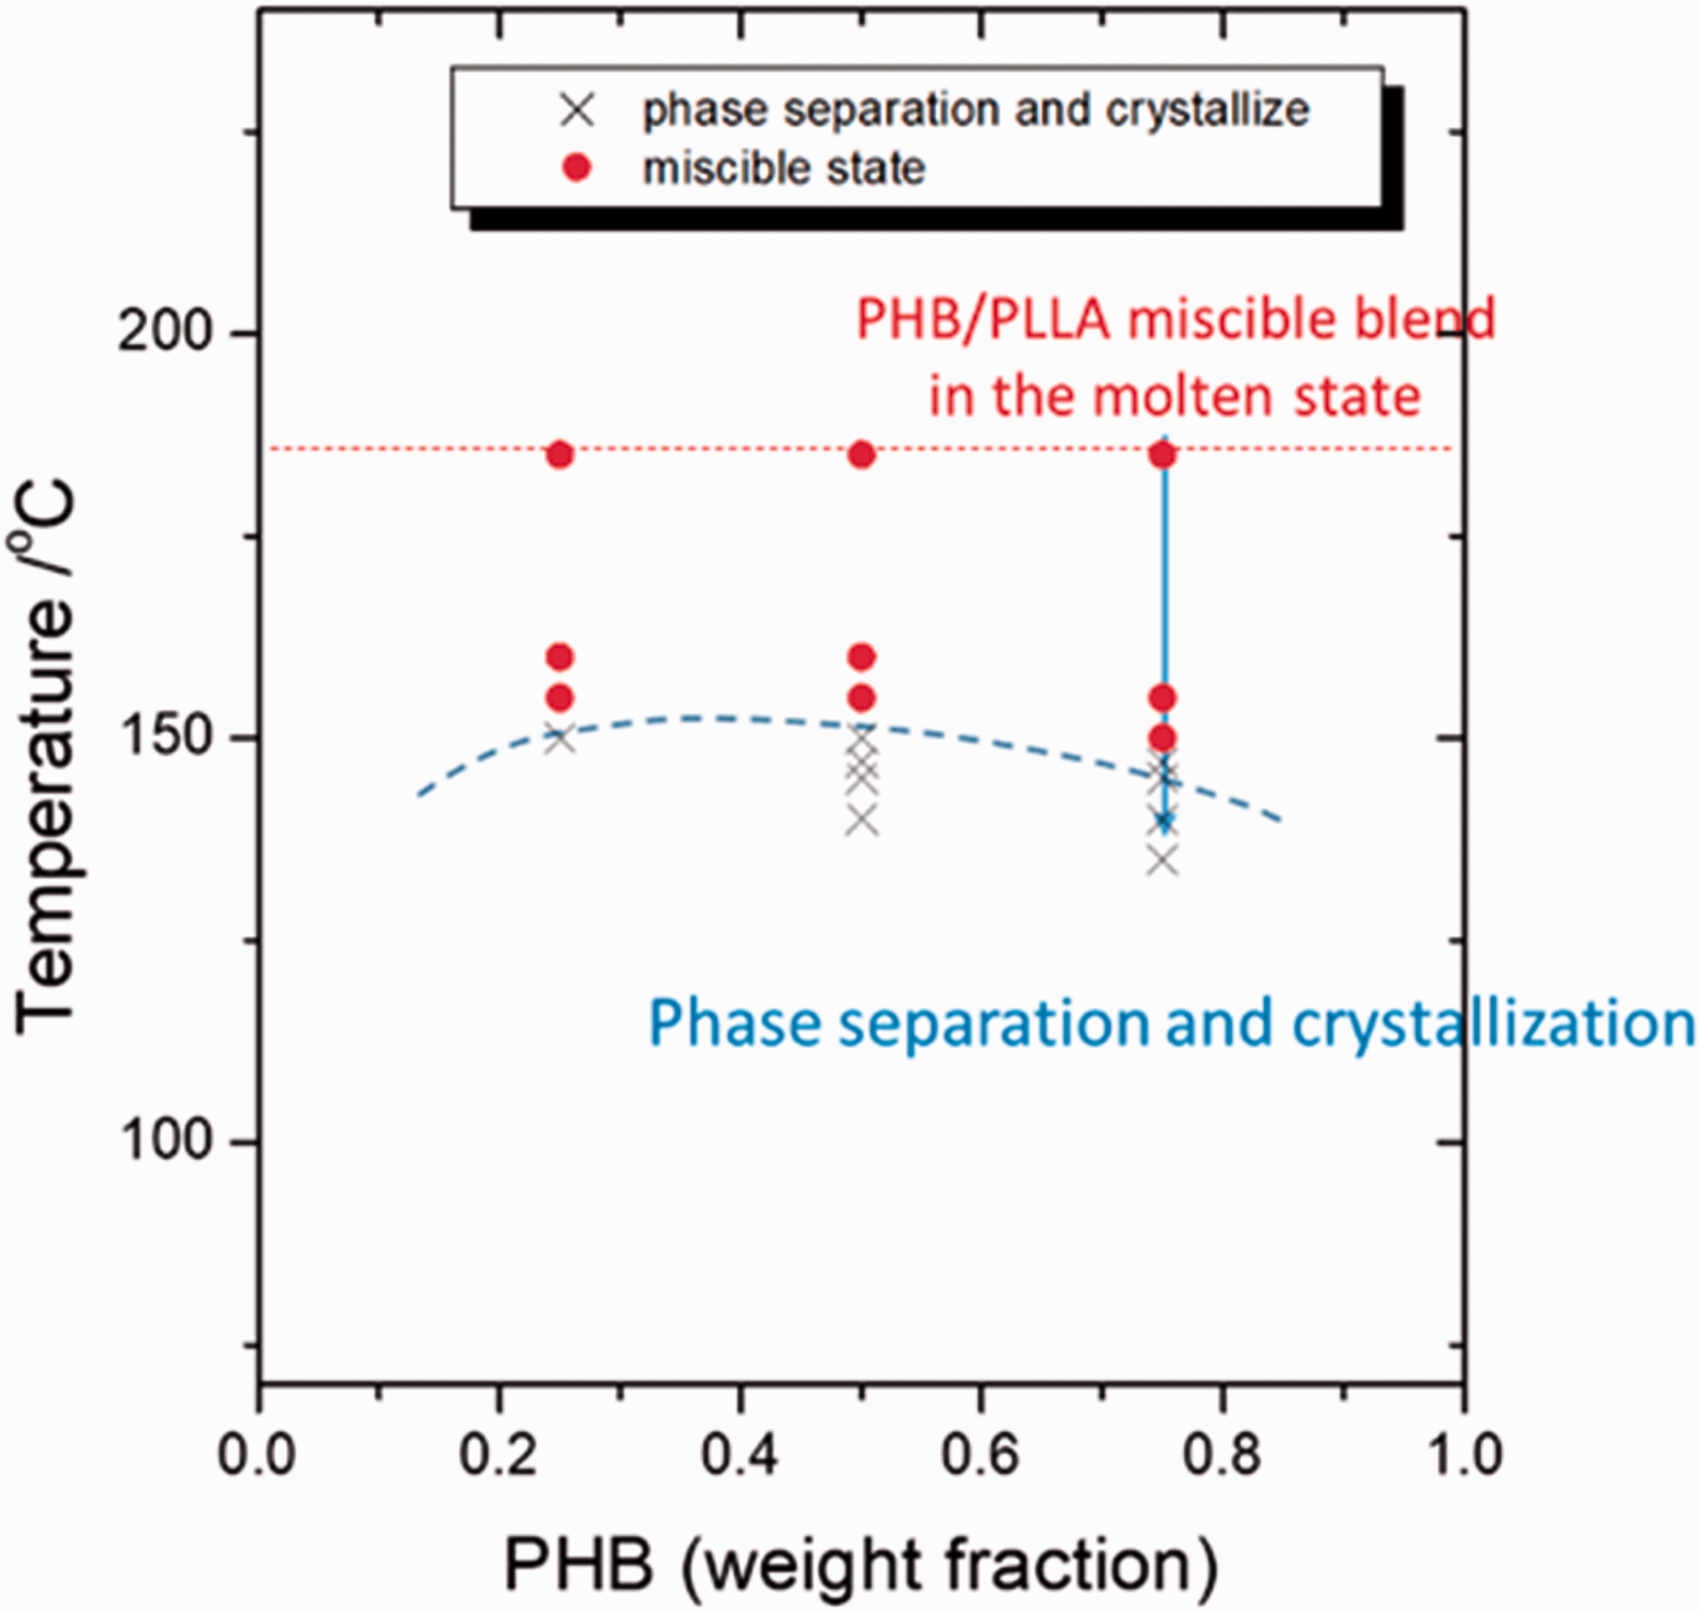
Figure 3 shows the time-dependent ATR FT-IR spectra in the ν(C=O) band region of PHB/PLLA (75/25) blend during phase separation and crystallization at 145 ℃. At least three bands at 1720, 1733, and 1756 cm−1 appear in the ν(C=O) band region. These bands are assigned to C=O stretching modes of the crystalline PHB (PHB(C)), miscible PHB/PLLA blend, and crystalline PLLA (PLLA(C)), respectively. For the PHB/PLLA (75/25) blend, the absorbance of ν(C=O) band of crystalline PLLA should be low because of its low concentration and degree of crystallization. Therefore, the research focus in the phase separation and crystallization process of PHB/PLLA (75/25) blends is the ν(C=O) band of crystalline PHB. During the isothermal crystallization process, the ν(C=O) band at 1733 cm−1 ascribed to the miscible state of PHB/PLLA blend decreases and shifts gradually as a function of time, and finally it moves to 1720 cm−1 as the ν(C=O) band of crystalline PHB. Therefore, the occurrence of band position shift may indicate the changes of the status of ν(C=O) band during phase separation and crystallization process of PHB/PLLA (75/25) blend at 145 ℃ as a function of time.
Time-dependent ATR FT-IR spectra of PHB/PLLA (75/25) blend during phase separation and crystallization at 145 ℃. The ν(C=O) bands of crystalline PHB (PHB(C)), miscible state of PHB/PLLA blend, and crystalline PPLA (PLLA(C)) are 1720, 1733, and 1756 cm−1, respectively.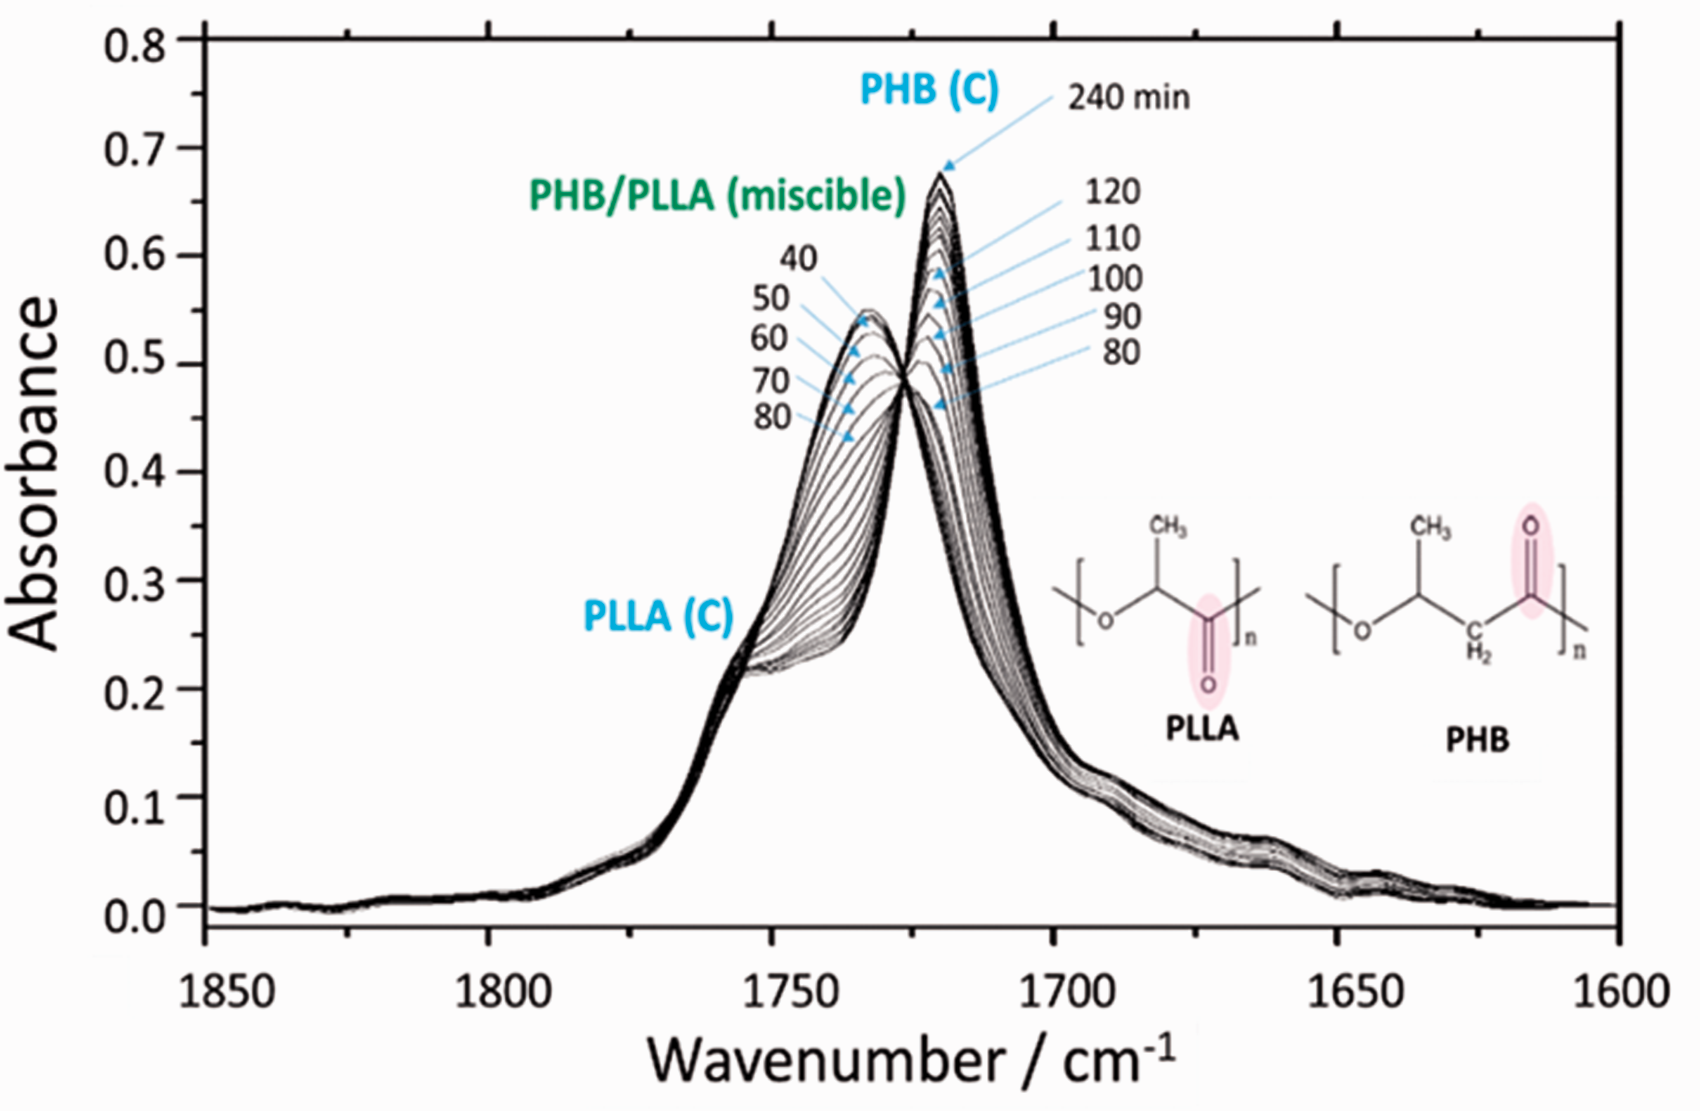
In our previous study, the peak position of ν(C=O) band did not show a shift during isothermal crystallization process of pure PHB. 20 However, a peak position shift occurs in the ν(C=O) band during isothermal crystallization process of PHB/PLLA blends. 24 It indicates that the intermolecular interaction between PHB and PLLA in the miscible state is transformed into the inter- and intramolecular interaction within PHB crystal in the immiscible state. 24 Therefore, this study laid the basis for the use of ATR FT-IR spectroscopic images based on the observation of the band position as an efficient method to visualize the changes in these inter- and intramolecular interactions during the phase separation and crystallization of PHB/PLLA blends.
Figure S2 (Supplemental Material) plots the peak position of the ν(C=O) band versus time of isothermal crystallization at 145 ℃ in PHB/PLLA (75/25) blends. It can be observed from Fig. S2 that there is no shift in the peak position after 120 min, while the absorbance increase continues. The ν(C=O) band of crystalline PLLA was also shown clearly at 1756 cm−1 in the spectra; however, it is difficult to analyze the peak shift from the miscible state to PLLA crystalline state because its absorbance is too low as shown in Fig. 3. Therefore, the analysis of the images based on the observation of the band position mainly depends on the ν(C=O) band of the miscible state and PHB’s crystalline state. The ν(C=O) band at 1733 cm−1 represents the intermolecular interaction between PHB and PLLA in the miscible state while the ν(C=O) band at 1720 cm−1 represents the inter- and intramolecular interactions within the PHB crystal.
Spectroscopic Images Based on the Observation of the Band Position of the PHB/PLLA (75/25) Blend
Figure 4 depicts time-dependent ATR FT-IR images based on the observation of ν(C=O) band position in the PHB/PLLA (75/25) blend at 145 ℃, which shows time-dependent peak position shift of ν(C=O) band in each pixel. The wavenumber range of all images is the same (maximum (red) is 1745 cm−1, minimum (blue) is 1715 cm−1). The obtained spectroscopic images clearly show the spatial distribution of the peak position of the ν(C=O) band. The peak position is defined by “the wavenumber of the band with the greatest absorbance”. Soon after reaching the isothermal crystallization temperature, the peak position of almost all pixels stays at 1733 cm−1, which indicates that the intermolecular interaction between PHB and PLLA appears in the whole polymer blend. After 1 h, the peak position of the pixels in the right part of image becomes less than 1733 cm−1, which means that the intermolecular interaction between PHB and PLLA has broken. With increasing annealing time from 60 to 120 min, the intermolecular interaction between PHB and PLLA, which is indicated by yellow and yellow green, disappears gradually in the images. On the other hand, the inter- and intramolecular interaction within PHB crystal, which is indicated by blue, start to occur in a larger area.
Spectroscopic images of the PHB/PLLA (75/25) blend generated by plotting the peak position (from 1745 to 1715 cm−1) of the ν(C=O) band during isothermal crystallization process at 145 ℃ as a function of time. The size of each image is 0.6 mm × 0.55 mm.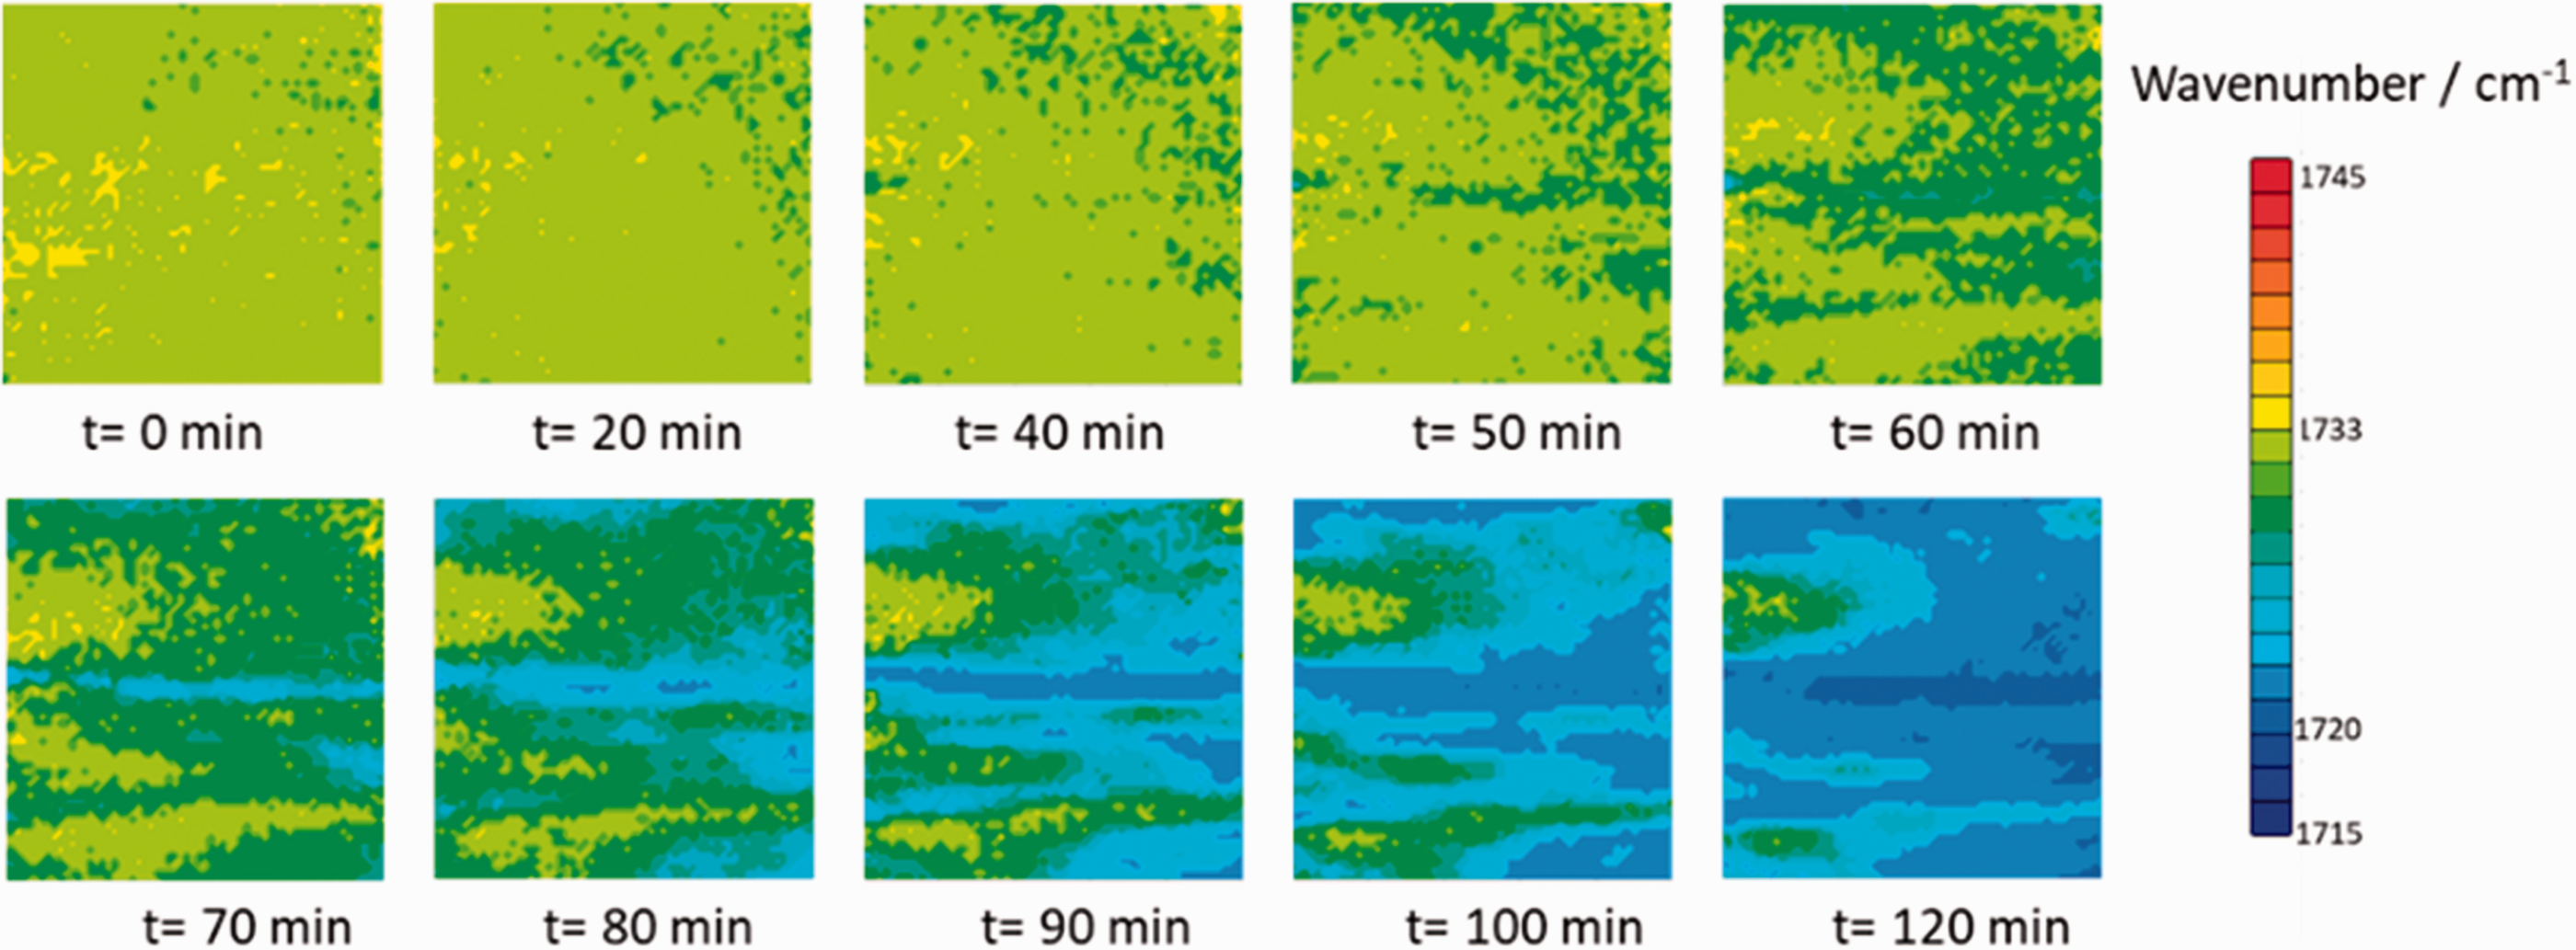
Figure 5 displays the images obtained by plotting the distribution of absorbance of spectral bands of PHB/PLLA (75/25) blend during the isothermal crystallization process at 145 ℃. It can be clearly found that PHB and PLLA are miscible in the blend soon after decreasing to 145 ℃, which agrees well with the corresponding images based on the observation of the band position: the intermolecular interaction between PHB and PLLA appears in the whole polymer blend. After 2 h, it can be seen that phase separation occurs, which is consistent with the disappearance of intermolecular interaction between PHB and PLLA shown in the corresponding images based on the observation of the band position. In addition, crystalline PHB-rich domains (Fig. 5; (120 min)) are located in the same place as the inter- and intramolecular interactions within PHB crystal occur, as shown in Fig. 4 (120 min). These results indicate that the images based on the observation of the band position are in good agreement with the images obtained by plotting the distribution of integrated absorbance.
Spectroscopic images of the PHB/PLLA (75/25) blend as a function of time during the isothermal crystallization process at 145 ℃. The images were prepared based on the distribution of integrated absorbance of the ν(C=O) band of PHB crystal (1730–1700 cm−1, top) and that of PLLA crystal (1762–1753 cm−1, bottom). The size of each image is 0.6 mm × 0.55 mm.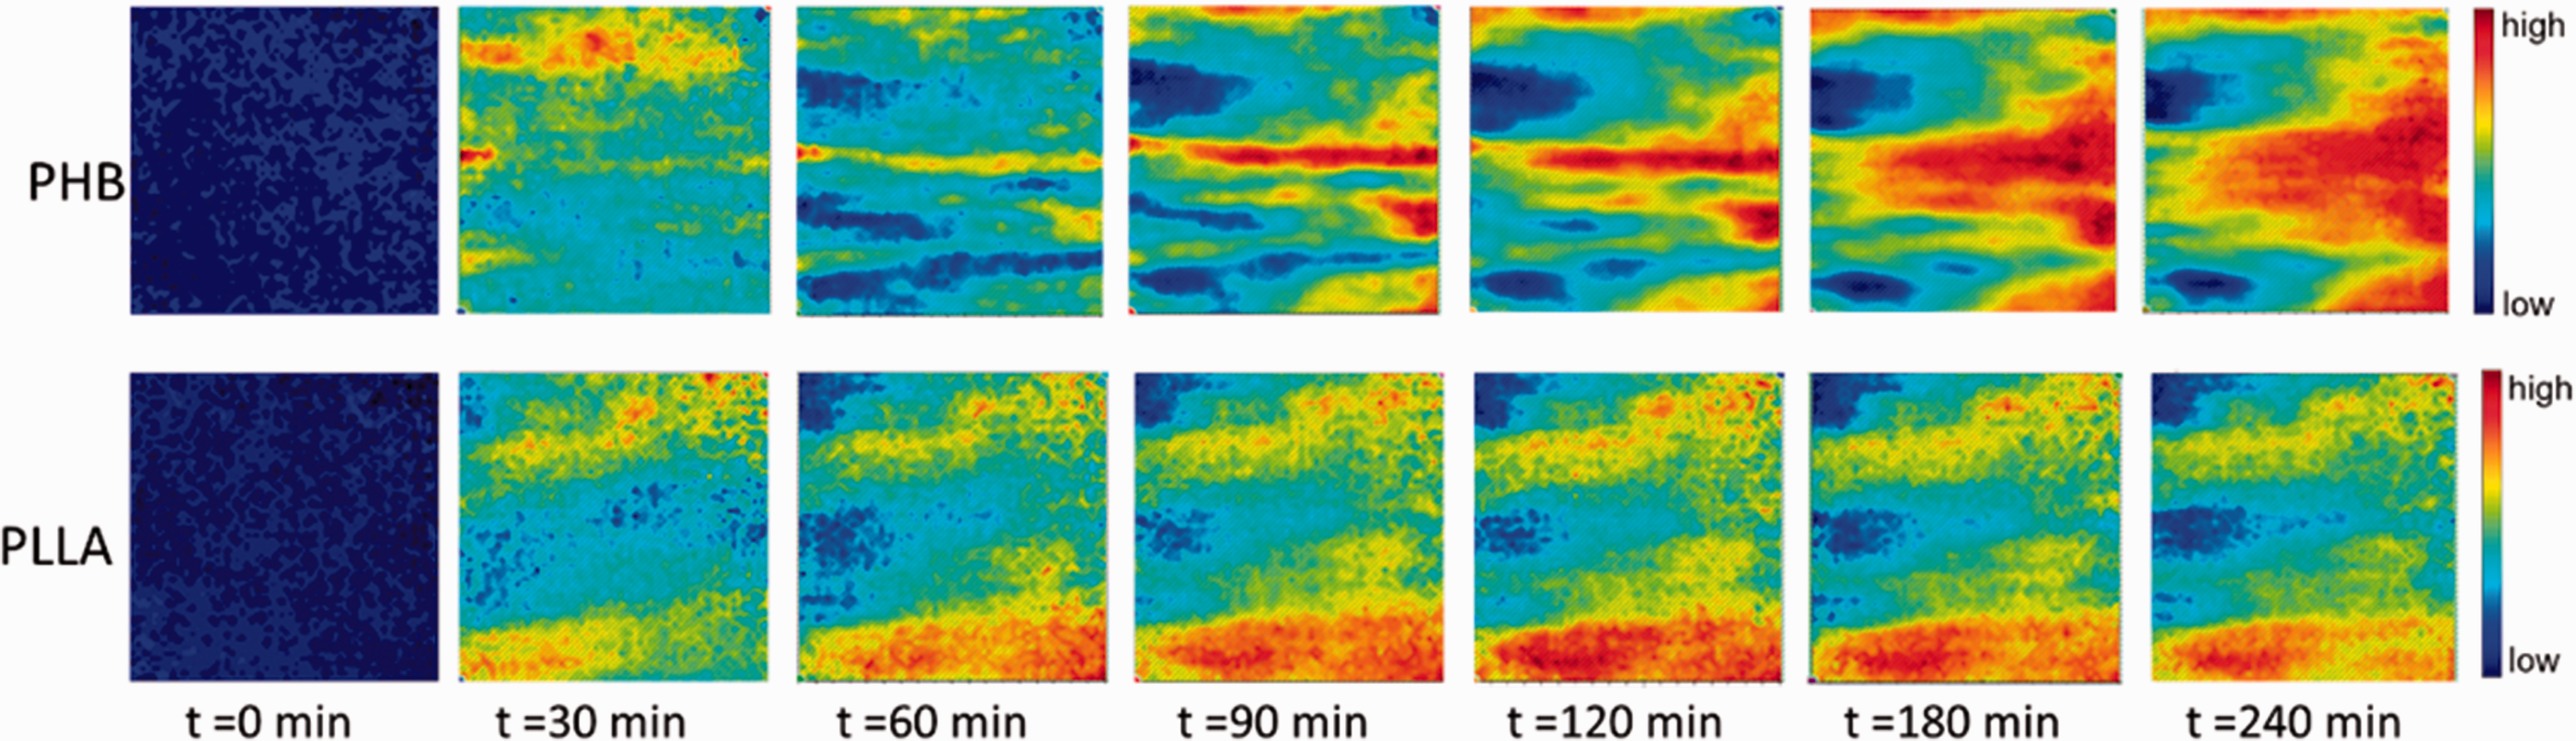
Figure 6 presents the time-dependent absorbance change of the band assigned to the miscible state of PHB/PLLA blend and crystalline PHB, the peak position of ν(C=O) band of PHB crystal, and the second derivatives intensity of ν(C=O) band of PLLA crystal. The peak of ν(C=O) band of PLLA crystal at 1756 cm−1 is clear but weak because of the low concentration of PLLA. Therefore, the second-derivative intensity of ν(C=O) band of PLLA crystal at 1756 cm−1 is plotted in Fig. 6.
Time-dependent absorbance change of the ν(C=O) band assigned to the miscible state of the PHB/PLLA blend and crystalline PHB, second derivatives intensity of ν(C=O) band of PLLA crystal, and peak position of ν(C=O) band of PHB crystal with spectroscopic images based on the integrated absorbance of the ν(C=O) band of PHB crystal at 1730–1700 cm−1 region (PHB(C)) and that of PLLA crystal at 1762–1753 cm−1 region (PLLA(C)) during the isothermal crystallization process at 145 ℃. The size of each image is 0.6 mm × 0.55 mm.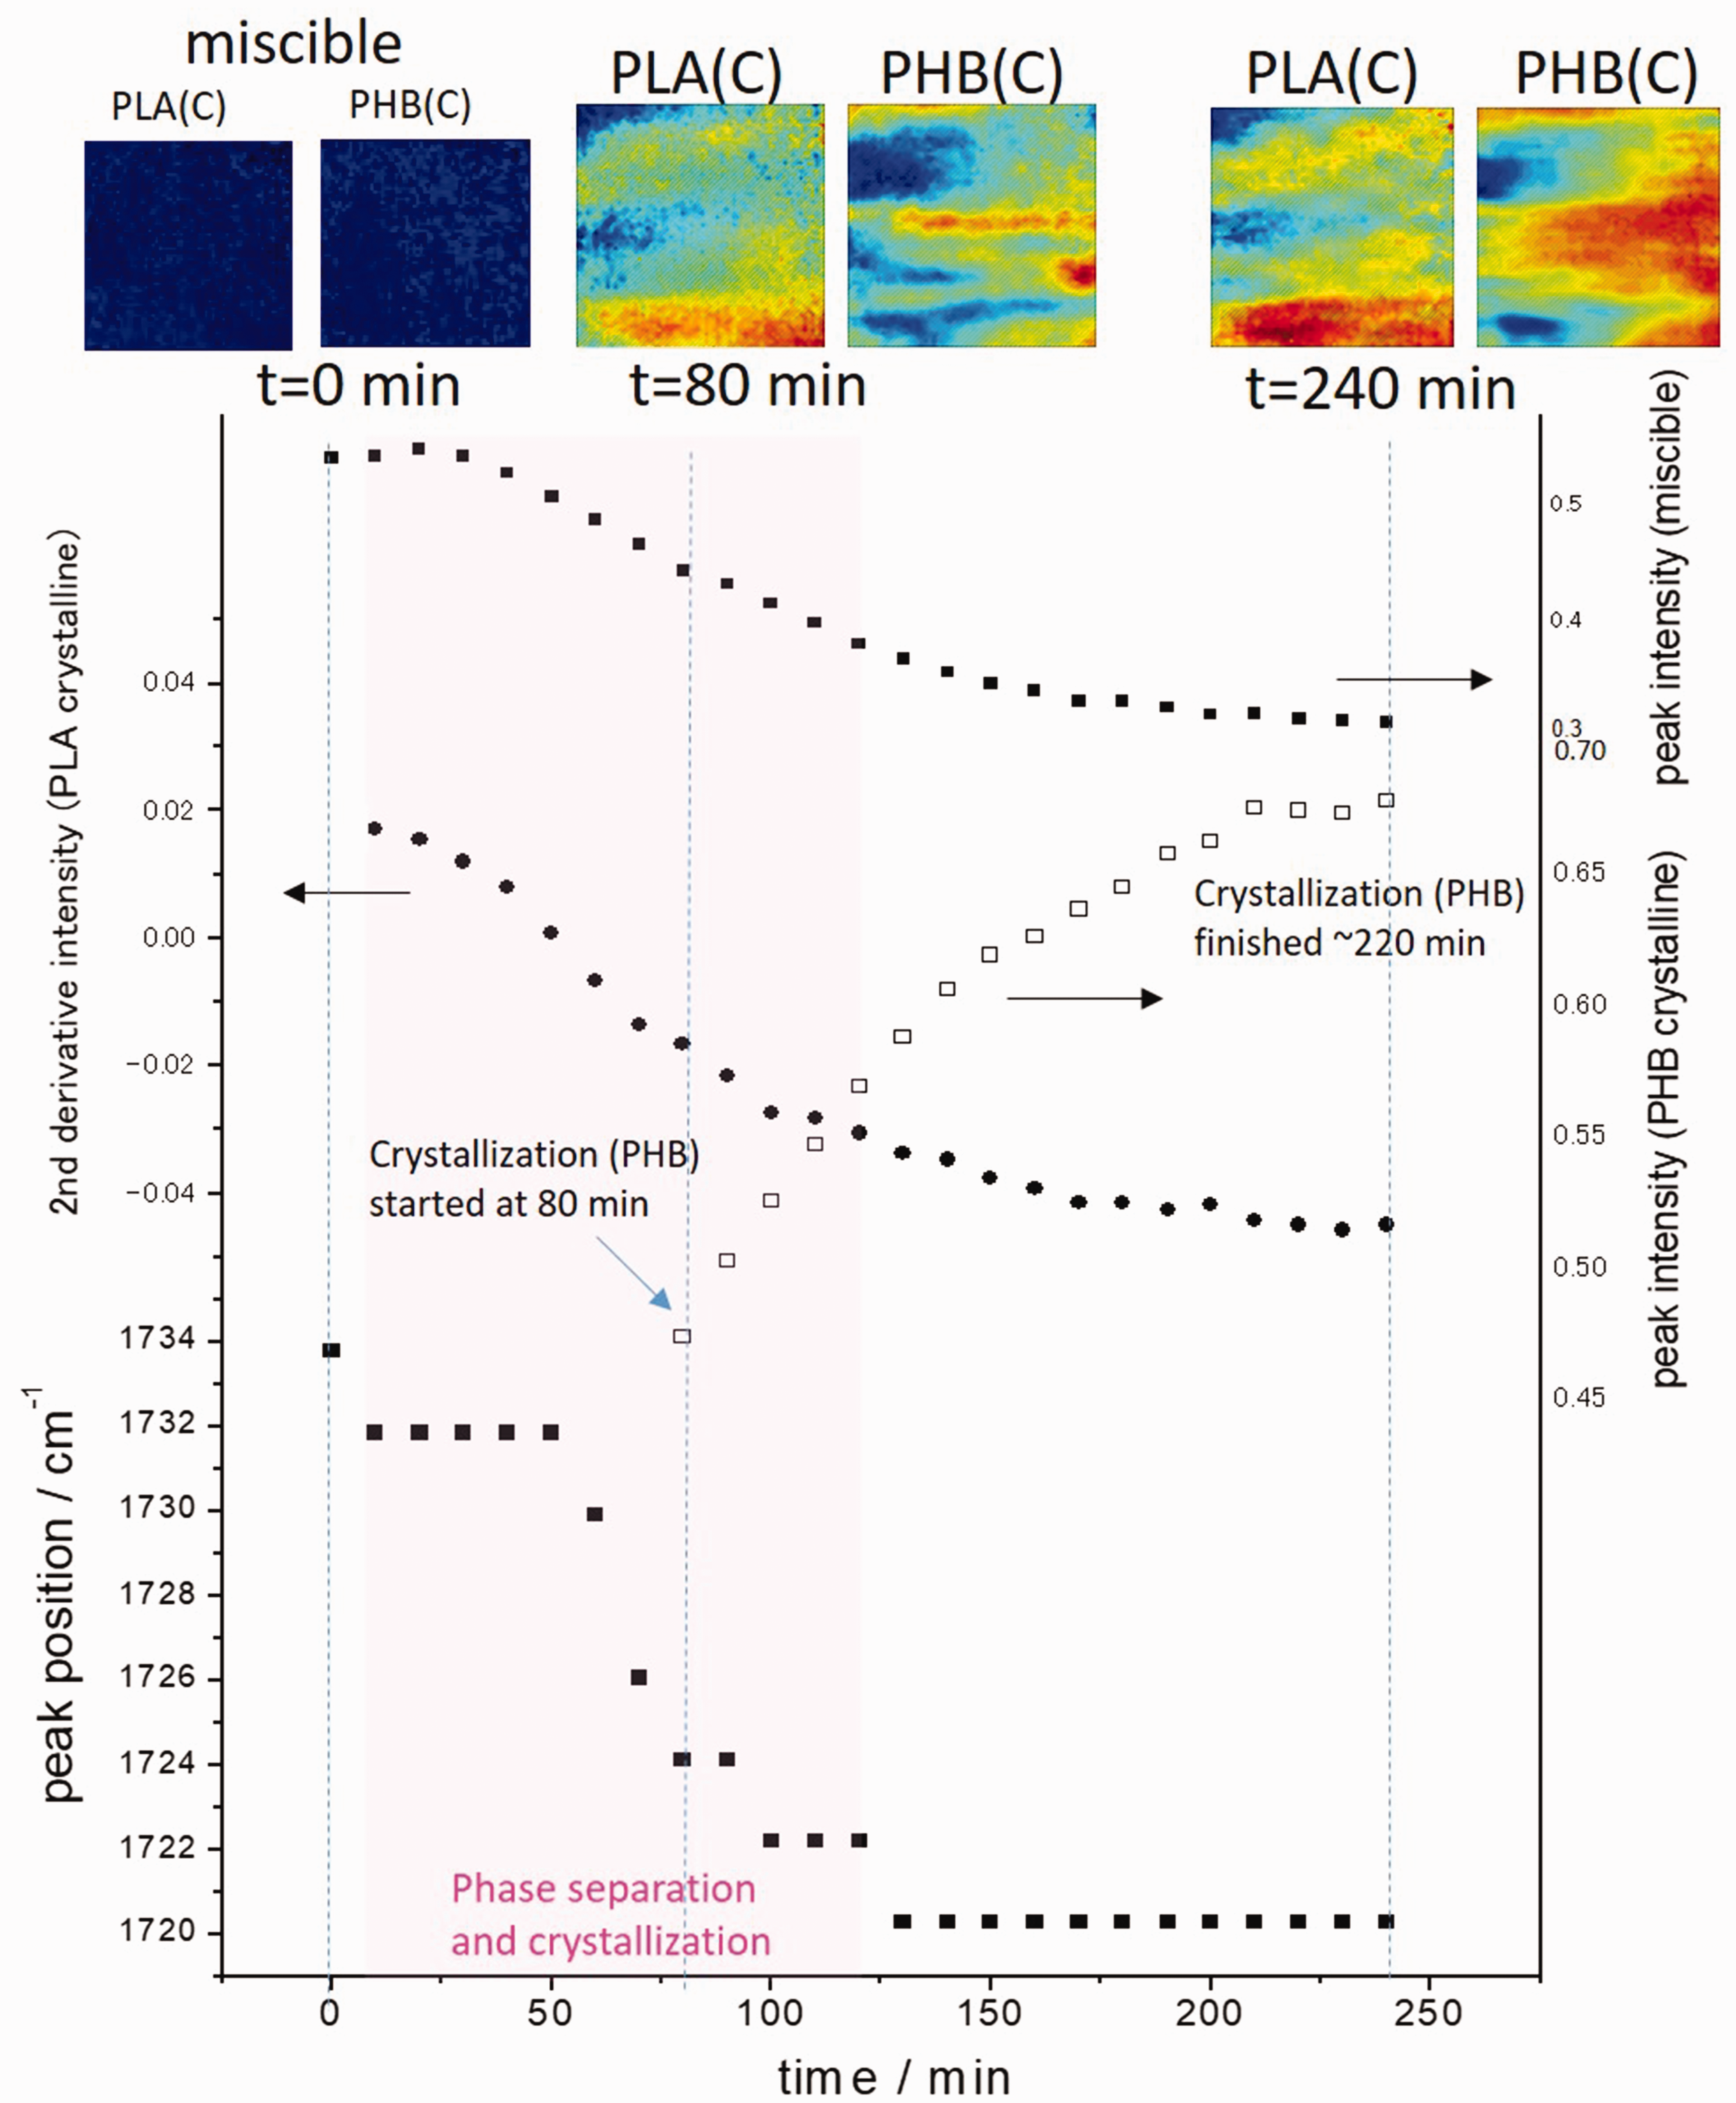
As shown in Fig. 6 after the temperature reaches 145 ℃, the absorbance of the band at 1733 cm−1, which represents the miscible state of PHB/PLLA blend, decreases gradually. Meanwhile, the ν(C=O) band of PLLA crystal appears and the ν(C=O) band of miscible state of PHB/PLLA blend starts to shift to 1720 cm−1. After around 80 min, the absorbance of ν(C=O) band of PHB crystal at 1720 cm−1 starts increasing. Since the concentration of PLLA in the PHB/PLLA (75/25) blend is low, ν(C=O) band of PLLA crystal appears as a shoulder peak. And the absorbance of ν(C=O)band of PHB crystal starts increasing when the peak shift almost finishes. In this system, the molecular weight of PLLA is larger than that of PHB. Furthermore, PLLA crystallization temperature (∼160 ℃) is also higher than that of PHB (∼150 ℃). Therefore, in the phase separation and crystallization process of PHB/PLLA (75/25) blend at 145 ℃, PLLA crystals appear first.
Comparison Between the Images Obtained by Distribution of the Position of the Band and by the Distribution of Absorbance of the Same Spectral Band
Here, the peak images are compared based on the observation of the band position with images obtained by plotting the distribution of integrated absorbance. As mentioned in the section above, both spectroscopic images based on the observation of the position of the band and integrated of the absorbance of the band show a good correspondence during the isothermal crystallization process. Fig. S3 presents the time-dependent spectroscopic images based on the observation of the band position (Fig. S3a) and images based on the distribution of integrated absorbance (Figs. S3b and S3c) in the ν(C=O) band region of PHB/PLLA (75/25) blend during the isothermal crystallization process. Comparing the spectroscopic images based on the observation of the band position (Fig. S3a) with integrated absorbance of the crystalline PHB (Fig. S3b), the green region of the images in Fig. S3a corresponds to the yellow and red regions of image at 60 min in Fig. S3b. After 90 min, the blue region of the images in Fig. S3a corresponds to the red region of the images in Fig. S3b. The appearance of the blue region shown in the image obtained based on the position of the spectral band indicates the disappearance of the intermolecular interaction between PHB and PLLA, which is consistent with the disappearance of the homogeneous region and the appearance of the red region shown in the image obtained based on the ν(C=O) absorbance. In the early stage of the isothermal crystallization process of the PHB-rich PHB/PLLA blend, the yellow and red region in the images based on the distribution of the integrated absorbance of ν(C=O) band of crystalline PHB correspond to the light blue and blue region based on the observation of the band position, respectively.
Compared with PHB/PLLA (50/50) blend, 24 the morphology of PHB/PLLA (75/25) blend after the isothermal crystallization process for 6 h is slightly different. A sea-island structure with crystalline PHB and crystalline PLLA can be observed, which is a three-dimensional continuous phase.
Feasibility of Images Based on the Observation of the Band Position to Investigate the Isothermal Crystallization Process at Different Temperatures
In order to prove that the images obtained by distribution of the position of a spectral band are feasible to investigate the isothermal crystallization process at different temperatures, the isothermal crystallization process at 140 ℃ was investigated. Figure 7 shows the images based on the observation of the band position and images based on the distribution of integrated absorbance of the ν(C=O) band of crystalline PHB (1730–1700 cm−1) of isothermal crystallization process in the PHB/PLLA (75/25) blend at 140 ℃. The disappearance of the intermolecular interaction between PHB and PLLA, which is indicated by fewer pixels with yellow and yellow green in corresponding images is based on the observation of the band position (Fig. 7a). The appearance of the inter- and intramolecular interactions within PHB crystal, which is indicated by more pixels with blue in the images based on the observation of the band position (Fig. 7a), was found to be constant with the appearance of PHB crystal-rich domains in corresponding images based on the integrated ν(C=O) absorbance of PHB (Fig. 7b). It demonstrates that the peak images based on the observation of the band position and the images based on the integrated ν(C=O) absorbance of crystalline PHB show a good correspondence and can visualize the intra- and intermolecular interactions when investigating the isothermal crystallization process at different annealing temperatures.
(a) ATR FT-IR images based on the peak position of the ν(C=O) band; (b) ATR FT-IR images generated by the distribution of integrated absorbance of the ν(C=O) band of PHB crystal (1730–1700 cm−1) during the isothermal crystallization at 140 ℃ in the PHB/PLLA (75/25) blend as a function of time. The size of each image is 0.6 mm × 0.55 mm.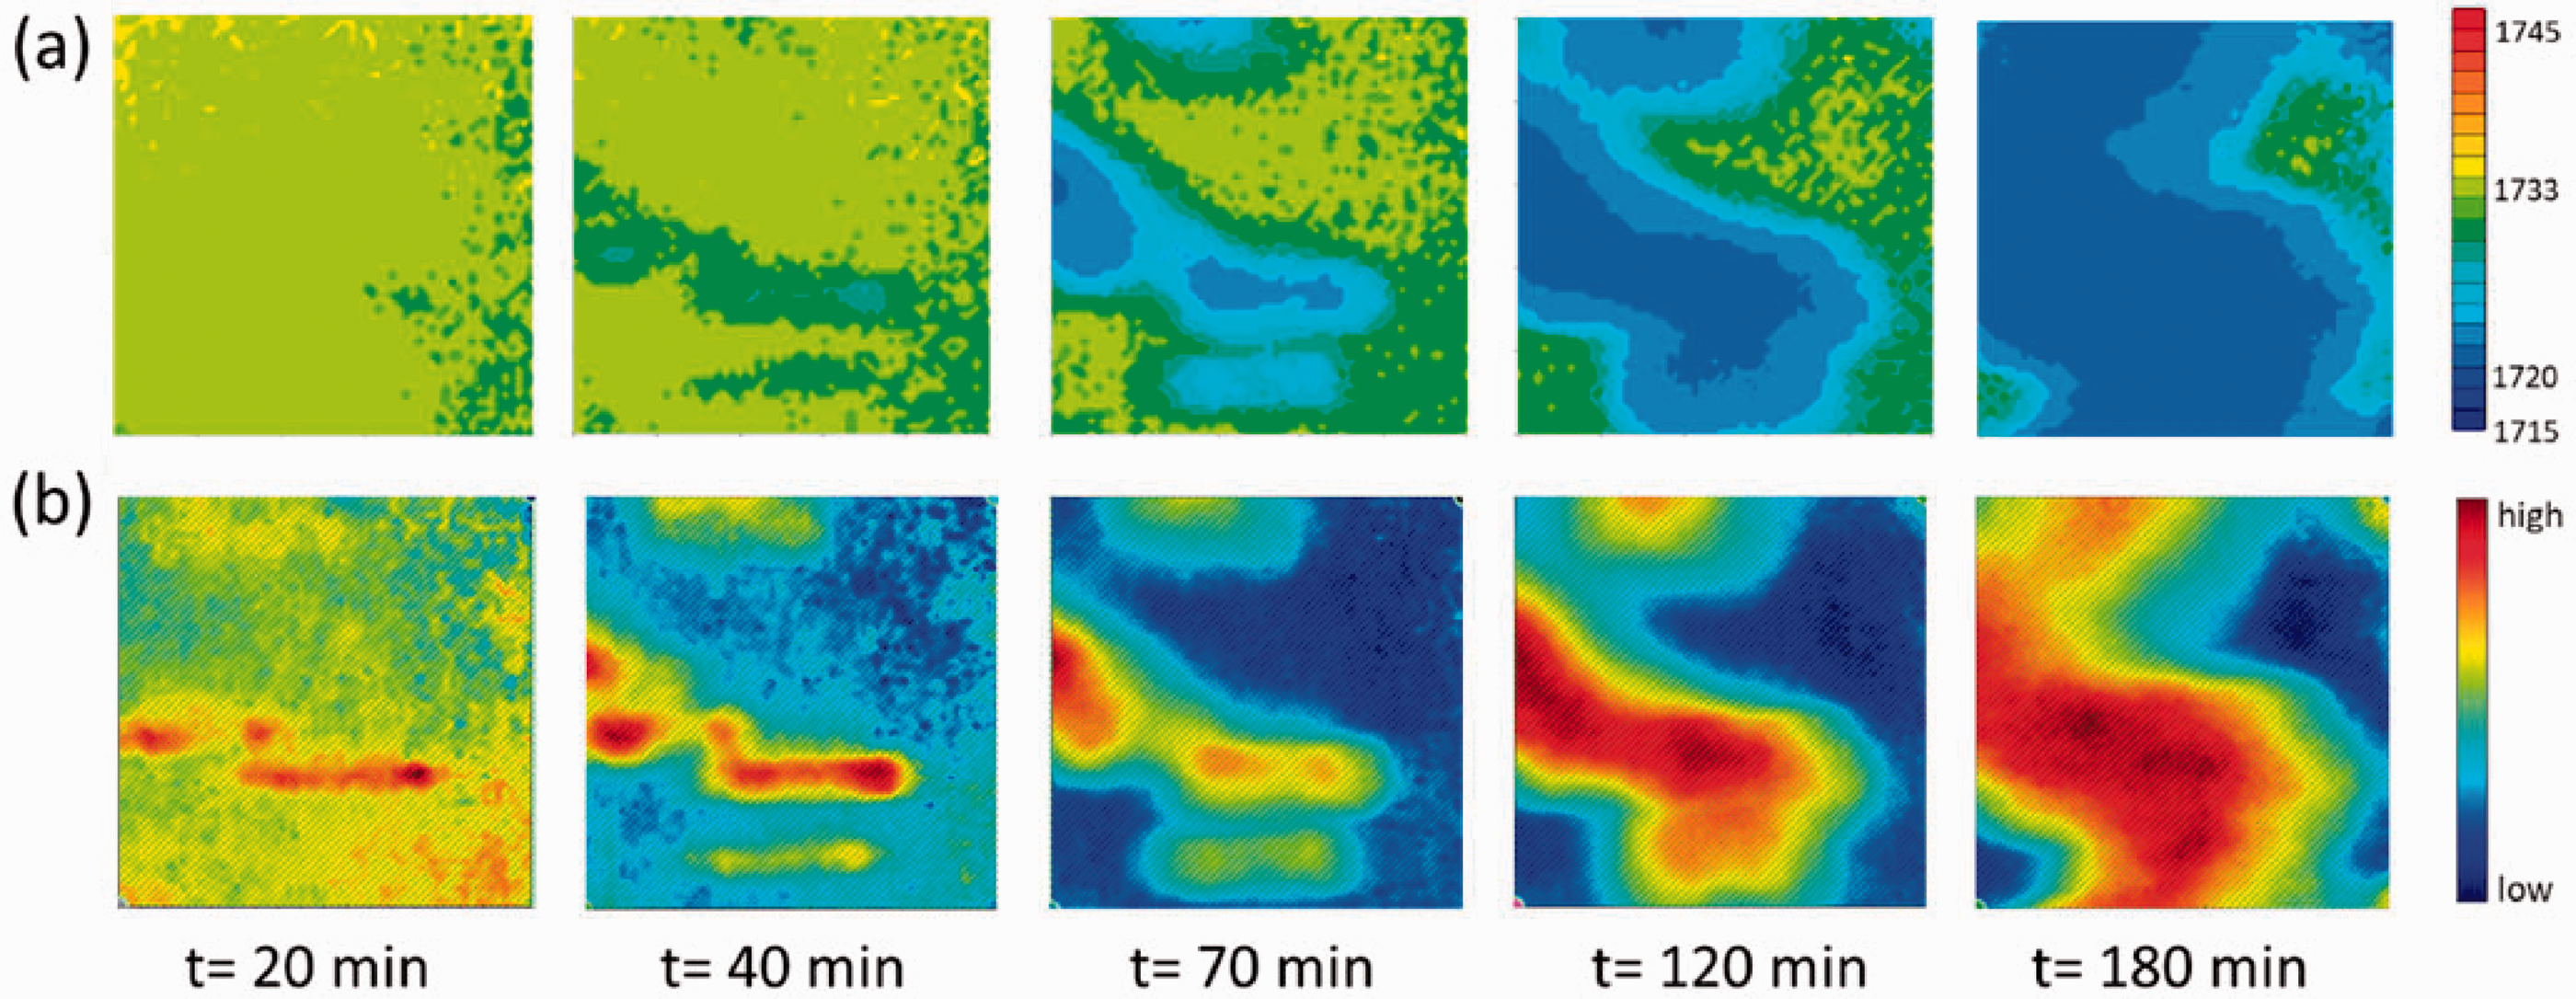
Conclusion
Physical and chemical properties of multicomponent polymer systems and their processing all depend on the inter- and intramolecular interactions occurring within them. The FT-IR spectroscopic images can reveal the distribution of component-rich domains in the imaged area, but they cannot show the areas where the intermolecular interactions occur. In order to highlight these areas, a novel technique based on the observation of the band position shift was introduced in this work. The peak shift of ν(C=O) band due to intermolecular interaction between PHB and PLLA in the FT-IR spectrum during the phase separation and crystallization process indicates the change of intra- and intermolecular interactions in the polymer blend. Thus, the images based on the observation of the band position were prepared in this study to visualize the distribution of different intra- and intermolecular interactions in PHB/PLLA blends during the isothermal crystallization process. The disappearance of the intermolecular interaction between PHB and PLLA, which is indicated in the images obtained based on the position of spectral band, agrees with the disappearance of homogeneous region shown in corresponding images based on the integrated absorbance of the ν(C=O) band. The appearance of the inter- and intramolecular interactions within PHB crystal, which is also indicated in the peak images based on the observation of the band position, agrees with the appearance of PHB crystal-rich domains in corresponding images based on the distribution of the integrated ν(C=O) absorbance of crystalline PHB. It is the first time the change of intra- and intermolecular interactions in the polymer blend has been visualized and the obtained images have been subsequently based on the observation of the band position. Compared to the images obtained by plotting the distribution of integrated absorbance of crystalline state of PHB, direct observation of specific intermolecular interactions based on band shift provides information about the strength of interactions that cannot be described by degree of crystallization. This work demonstrates that images based on the observation of the band position of spectral bands can reveal more information about the spatial distribution of different inter- and intramolecular interactions in the multicomponent polymer systems and their changes induced by various perturbations, such as temperature, pressure, concentration, and pH.
Supplemental Material
sj-pdf-1-asp-10.1177_00037028211010216 - Supplemental material for Visualization of Inter- and Intramolecular Interactions in Poly(3-hydroxybutyrate)/Poly(L -lactic acid) (PHB/PLLA) Blends During Isothermal Melt Crystallization Using Attenuated Total Reflection Fourier Transform infrared (ATR FT-IR) Spectroscopic Imaging
Supplemental material, sj-pdf-1-asp-10.1177_00037028211010216 for Visualization of Inter- and Intramolecular Interactions in Poly(3-hydroxybutyrate)/Poly(
Footnotes
Declaration of Conflicting Interests
The author(s) declared no potential conflicts of interest with respect to the research, authorship, and/or publication of this article.
Funding
The author(s) received no financial support for the research, authorship, and/or publication of this article.
Supplemental Material
All supplemental material mentioned in the text, consisting of figures, is available in the online version of the journal.
References
Supplementary Material
Please find the following supplemental material available below.
For Open Access articles published under a Creative Commons License, all supplemental material carries the same license as the article it is associated with.
For non-Open Access articles published, all supplemental material carries a non-exclusive license, and permission requests for re-use of supplemental material or any part of supplemental material shall be sent directly to the copyright owner as specified in the copyright notice associated with the article.