
Abstract
Raman spectroscopy has been used to provide a rapid, noninvasive, and nondestructive quantification method for determining the parahydrogen fraction of hydrogen gas. The basis of the method is the measurement of the ratio of the first two rotational bands of hydrogen at 355 cm−1 and 586 cm−1 corresponding to parahydrogen and orthohydrogen, respectively. The method has been used to determine the parahydrogen content during a production process and a reaction. In the first example, the performance of an in-house liquid nitrogen cooled parahydrogen generator was monitored both at-line and on-line. The Raman measurements showed that it took several hours for the generator to reach steady state and, hence, for maximum parahydrogen production (50%) to be reached. The results obtained using Raman spectroscopy were compared to those obtained by at-line low-field nuclear magnetic resonance (NMR) spectroscopy. While the results were in good agreement, Raman analysis has several advantages over NMR for this application. The Raman method does not require a reference sample, as both spin isomers (ortho and para) of hydrogen can be directly detected, which simplifies the procedure and eliminates some sources of error. In the second example, the method was used to monitor the fast conversion of parahydrogen to orthohydrogen in situ. Here the ability to acquire Raman spectra every 30 s enabled a conversion process with a rate constant of
Introduction
Molecular hydrogen (H2) exists as two nuclear spin isomers: the anti-symmetric singlet nuclear spin state parahydrogen (pH2) and the symmetric triplet spin nuclear state orthohydrogen (oH2). The equilibrium distribution of the two isomers is a function of temperature. At room temperature, the equilibrium composition is approximately 25% pH2 and 75% oH2, a mixture typically referred to as normal hydrogen (nH2). At lower temperatures the equilibrium distribution shifts to favor the lower-energy pH2 isomer, so that at its boiling point (20.3 K) the equilibrium composition of H2 is almost 100% pH2. However, as the conversion between oH2 and pH2 is forbidden, conversion between isomers is very slow unless a catalyst is used.1–5
The pH2 isomer is useful for a wide range of applications, including: liquid fuels;6–8 matrix isolation spectroscopy;9,10 certain hyperpolarization methods for nuclear magnetic resonance (NMR) spectroscopy;4,3,11,12 and as a moderator for spallation neutron sources.13,14 For many of these applications, the proportion of the pH2 isomer is of vital importance. For example, for fuel applications H2 is usually stored as a liquid. If the oH2 is not fully converted to pH2 (e.g., by passing over a suitable catalyst) before condensation from the gas state, then the slow exothermic conversion of oH2 to pH2 will liberate enough heat to vaporize up to 64% of the liquid. 7 For pH2-based hyperpolarization methods in NMR, the greater the level of pH2 enrichment, the greater the NMR signal enhancement.4,11,15 Indeed various methods of generating high purity pH2 for NMR studies have been reported15,16 and major NMR vendors also supply this type of specialized equipment. 17
The research group at the University of Strathclyde has an in-house built pH2 generator, which is used to provide gaseous pH2 for signal amplification by reversible exchange (SABRE) hyperpolarization studies on a bench-top NMR spectrometer.18–20 To validate the hyperpolarization experiments, it is desirable to be able to rapidly monitor the pH2 fraction produced by this generator. The two spin isomers differ slightly in several physical properties, such as: heat capacity, vapor pressure, speed of sound, and thermal conductivity. These properties can be used to measure the pH2 enrichment in an unknown sample.4,9,21–23 Nevertheless, many of these measurements often require that other parameters also be measured very accurately (e.g., temperature and pressure) and require calibration with known mixtures to provide quantitative results.15,21,24 However, as the two spin isomers occupy different rotational energy levels,1,3,4,25 it is possible to use Raman spectroscopy to probe the rotational transitions of H2 gas and hence determine the composition of pH2 without calibration mixtures.8,13,14,25,26
In the context of monitoring pH2 enrichment, Sundararajan et al. 10 used a Raman microscope with a 514 nm laser for off-line monitoring of H2 gas used for matrix isolation spectroscopy. They reported that even with 1000 scans, the analysis could not be conducted quantitatively. Teshigawara et al. 14 used a Raman microscope for off-line monitoring of H2 moderators in a neutron source. They did not report the analysis time but did claim that sufficient signal was obtained for quantitative analysis. Matthews et al.8,26 reported the use of a specialized gas cell for off-line monitoring of H2 gas from a liquid hydrogen storage tank. They used a 532 nm laser and reported an integration time of only 60 s. However, the density of the gas measured (and hence pressure) was much higher (12 g L−1) than typically produced by the pH2 generator used here (0.5 g L−1). Sutherland et al. 13 reported an on-line method using a fiber optic coupled probe to monitor the pH2 fraction in a H2 moderator used for a neutron source. However, they reported relatively long analysis times of around 20 min per measurement.
Here we report that by using a Raman spectrometer fitted with a non-contact optic, with a backscattering 180° geometry, the acquisition of Raman spectra of H2 gas from the in-house built pH2 generator can be greatly simplified. This allows Raman spectra from at-line samples to be easily acquired using existing infrastructure (i.e., conventional NMR tubes). Also, this configuration allows the facile set-up of an on-line method of monitoring the performance of the generator, by focusing the laser onto a simple glass flow tube in the flow path of the generator. The rapid nature of the Raman procedure (every 30 s) enables in situ monitoring of the fast back conversion of pH2 to oH2 inside contaminated NMR tubes.
Experimental
At-line and on-line Raman analysis was used to characterize an in-house built pH2 generator, the schematic of which is shown in Fig. 1. nH2 gas with a room temperature equilibrium content of pH2 was produced from water using a hydrogen generator (HG) electrolysis cell (Peak Scientific), operating at 4 bar for at-line experiments and 5 bar for on-line experiments. The nH2 gas then flowed into a two-way valve (V1), which directed the gas into either a chamber for enrichment of the pH2 content or directly into the rest of the system. The chamber for the enrichment of pH2 content was of similar design to that reported previously in the literature.4,27 Briefly, it consisted of a copper coil (C) (OD = 9.5 mm, ID = 7.7 mm, L = 3 m) packed with charcoal (Sigma-Aldrich), which was submerged in a Dewar (D) filled with liquid nitrogen. The charcoal was held in place with two 40 µm in-line filters (F) at either end of the coil. On-off valves (V2, V3, V4) were used to control whether nH2- or pH2-enriched gas was provided to the outlet of V4. The system was equipped with a pressure transducer (P) (Omega) to check the pressure of the gas as well as a vacuum pump (V) (Vacuubrand, ultimate vacuum of 7 mbar) to allow the system (and any connected flow tube (FT) or NMR tube) to be evacuated of gas.
Schematic of the in-house built pH2 generator. H2 gas at 4 bar for at-line experiments, or 5 bar for on-line experiments (as shown in figure), was produced from water using a hydrogen generator (HG) electrolysis cell. The gas flowed into a two-way valve (V1), which directed the gas into either a chamber for enrichment of the pH2 content or directly into the rest of the system. The chamber for the enrichment of pH2 content is a copper coil (C) (OD = 9.5 mm, ID = 7.7 mm, L = 3 m) packed with charcoal, which was submerged in a Dewar (D) filled with liquid nitrogen. The charcoal was held in place with two 40 µm in-line filters (F) at either end of the coil. On-off valves (V2, V3, V4) were used to control whether nH2- or pH2-enriched gas was provided to the outlet of V4. The system pressure was measured using a pressure transducer (P). A vacuum pump (V) was used to allow the system (and any connected flow tube (FT) or NMR tube) to be evacuated of gas.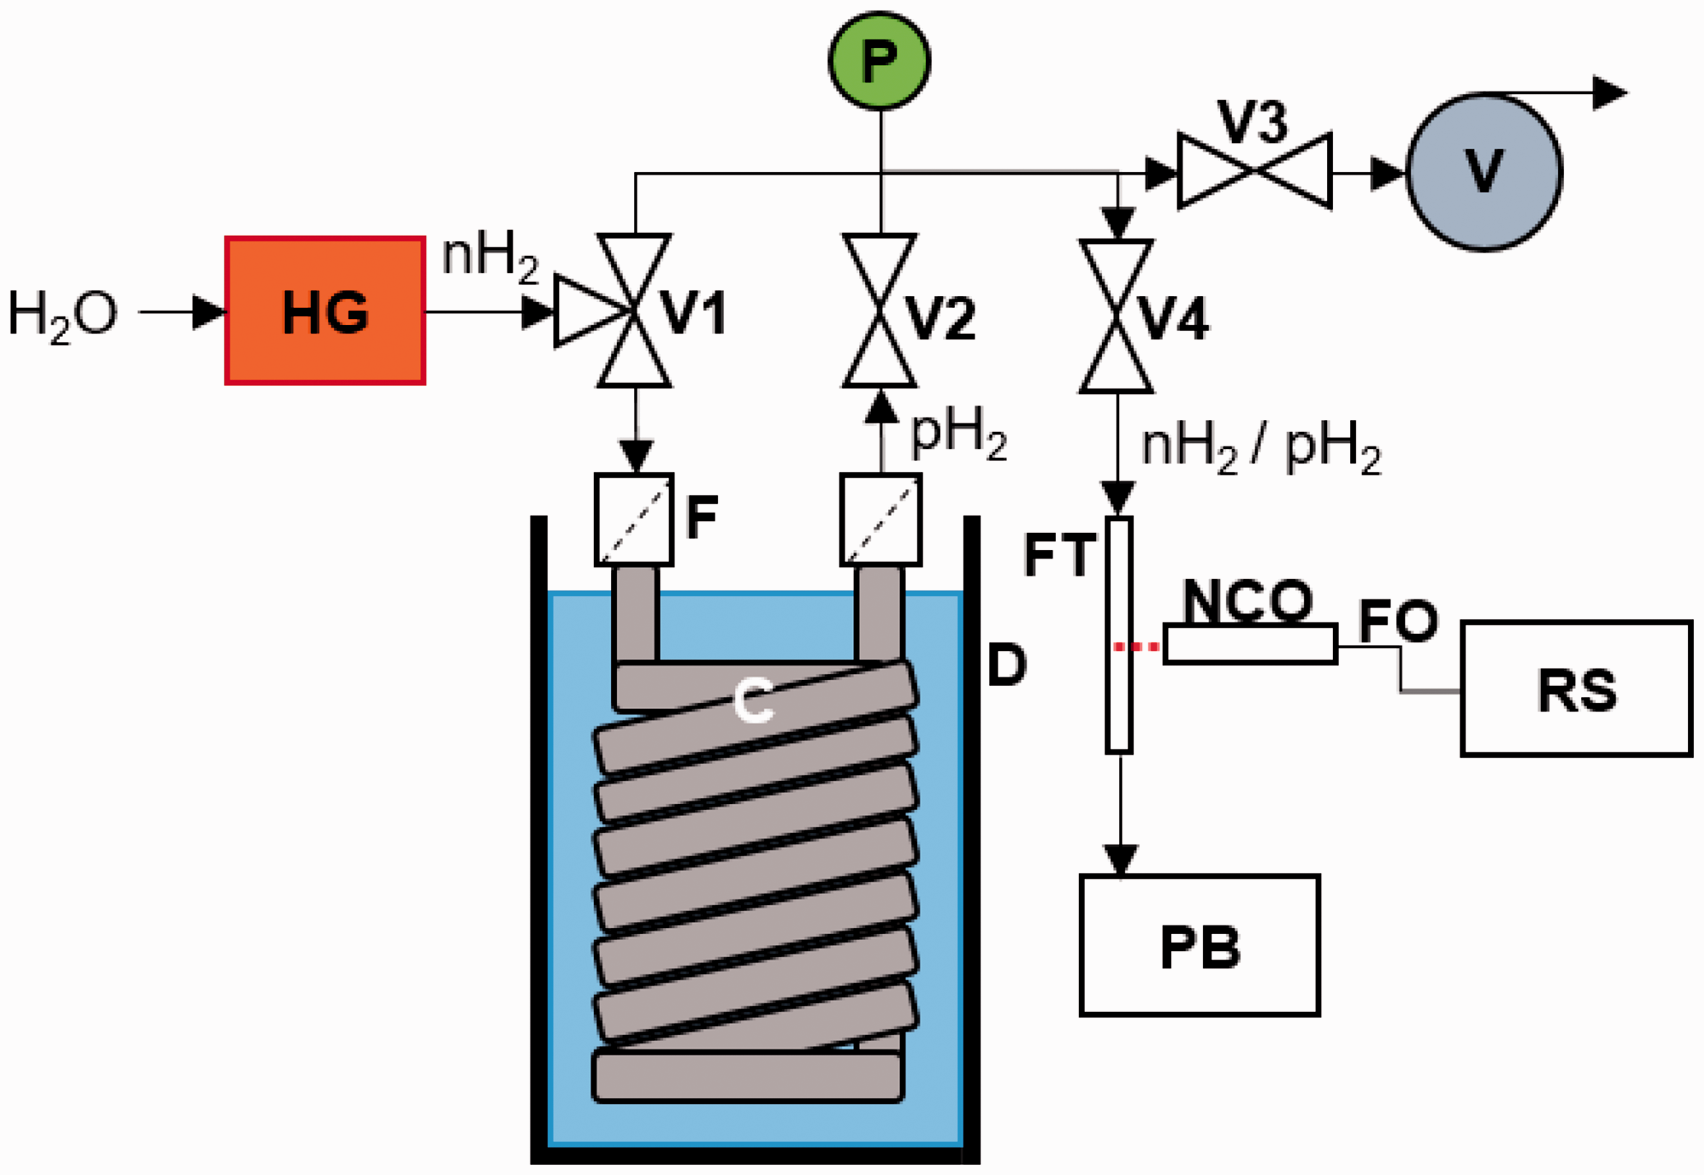
At the start of each experiment, the copper coil was filled with H2 to the desired pressure without being cooled. The coil was then purged so that the pressure was just above atmospheric and filled again to ensure that only H2 gas was entering the system. The coil was then cooled with liquid nitrogen and the purge process repeated. Once the pressure in the coil had again reached the desired level (usually after around 15 min), this was regarded as the start of the generator running time.
For at-line Raman analysis, the outlet of V4 was connected to a standard NMR tube (Wilmad Precision, 527-PP-7) equipped with a Young’s valve (GPE Scientific) (not shown in Fig. 1). For on-line analysis, V4 was connected to a FT which had a 40 mm section of the same type of NMR tube partway along its length. The outlet of the FT was connected to a pneumatic control unit (Bruker) for a polarizer box (PB) (as shown in Fig. 1), which controlled when gas flowed along the FT into the PB and then out into the atmosphere. The PB was used to allow gas to flow for 15 s, with a desired interval (typically around every 5 min) between each flow duration. Between intervals, the PB held the gas pressure constant at 5 bar in the FT. The PB has previously been used to automate SABRE NMR experiments,19,20,28,29 but in this case it was simply used to control the flow of gas out of the pH2 generator.
The Raman spectrometer (RS) used to record the spectra of the gas samples was a RamanRxn1 analyzer (Kaiser Optical Systems), which utilized a CW diode laser with a maximum output of 400 mW at 785 nm. The axial transmissive spectrograph (f/1.8) was equipped with a holographic transmission grating (HoloPlex). The detector was a charged coupled device cooled to −40 ℃ (Peltier cooling). The spectral range was 100–3425 cm−1 (Raman shift) with an average spectral resolution of 4 cm−1. The spectrometer was coupled with a 5 m fiber optic (FO) cable to a filtered MR probe fitted with a non-contact optic (NCO). This NCO was used to focus the laser onto the center of the NMR tube for at-line or in-situ analysis, or the center of the NMR tube section within the FT for on-line analysis. The same optic was used to collect the backscattered light (180° geometry) from the sample. The NCO had a 10 mm focal length and the size of the focused beam was approximately 100 µm at the focal point. The laser power was around 270 mW at the sample. The spectrometer was calibrated with a neon atomic line source and a NIST traceable white light source for wavelength and intensity accuracy, respectively. The calibration was verified using a cyclohexane standard before any analysis. A single scan with an integration time of 25 s was used for each spectrum. A dark spectrum, also of 25 s, was recorded before each scan and used for dark correction, giving a total acquisition time of around 50 s. For the experiments studying the stability of pH2 in an NMR tube using a sampling frequency of 30 s, a single dark spectrum was recorded just before presenting the tube to the laser and used to correct all of the recorded spectra for that sample.
Immediately after recording the at-line Raman spectrum of H2 contained in a standard NMR tube, the 1H NMR spectrum was also recorded in a method similar to that reported previously.15,16,21,27 The sample was placed in a bench-top NMR spectrometer (Magritek Spinsolve) operating at a 1H Larmor frequency of 43.5 MHz. A spectrum was recorded using a standard 90° pulse and detect sequence, with a bandwidth of 200 kHz, and 512 points per free induction decay (acquisition time of 2.56 ms) zero filled to 2048 points. A repetition time of 300 ms was used between scans. This duration is sufficiently larger than the T1 of oH2, which is reported as being in the range of 3–15 ms, 27 to allow for quantitative analysis. A total of 256 scans were acquired, resulting in a total acquisition time of 77 s.
All data analysis was conducted in the R programming environment. 30 The hyperSpec package 31 was used to load the Raman data, and the robust baseline correction algorithm provided by the baseline package 32 (with a span setting of 0.1) was used to remove the influence of the glass background in the Raman spectra.
Results and Discussion
Raman Spectra of Hydrogen Gas
Gas analysis by Raman spectroscopy can be challenging, because the small scattering cross-sections and low densities of the molecules in the gas phase lead to weak Raman signals.33–35 Therefore, to confirm if sufficient signal could be obtained using our Raman set up, the spectra from an evacuated NMR tube (≈7 mbar), a tube filled to 4 bar with H2 gas directly from the hydrogen generator (i.e., nH2), and a tube filled to 4 bar from the pH2 generator after it had been running for 2 h were compared. The resulting spectra are shown in Fig. 2. From this figure, it can be seen that peaks for the first two rotational bands of hydrogen at the expected Raman shifts of 355 cm−1 and 586 cm−1 are clearly visible in the spectra of the two gas samples. These correspond to the rotational transitions Raman spectra of an evacuated NMR tube, a tube filled with nH2 at 4 bar, and a tube filled with pH2-enriched H2 at 4 bar.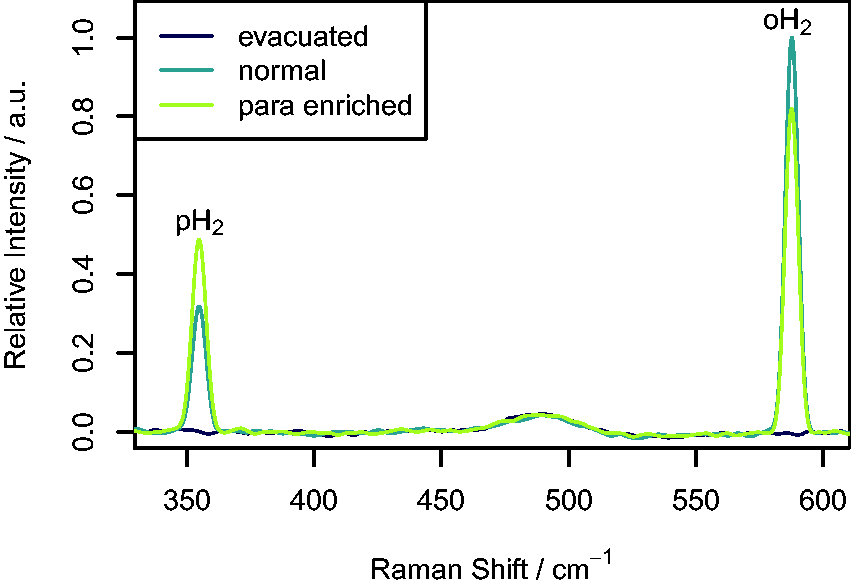
As pH2 and oH2 isomers occupy different rotational energy levels, with pH2 occupying even values of J (0, 2,…) and oH2 occupying odd values of J (1, 3,…),1,3,4,37 the ratio of these bands can be used to determine the para : ortho ratio.
25
Here we used the same calculation method as reported by Matthews et al.8,26 Briefly, the Raman scattering intensities, IJ, of the rotational bands of H2 are given by Eq. 1


This can be simply rearranged to give the pH2 fraction,

pJ must be considered, as not all pH2 molecules will occupy the J = 0 ground rotational energy level (likewise not all oH2 molecules will occupy J = 1) at the measurement temperature (294 K).1,3,37 Values for pJ were calculated using Boltzmann’s distribution law,1,3 with a rotational temperature of hydrogen, θR, of 87.6 K.3,38 The values reported by Hunt et al.
39
were used for
Using this method,
At-Line and On-Line Monitoring of Generator Performance
Normally it is assumed that when H2 gas is passed over a catalyst, such as the charcoal used here, the thermodynamic equilibrium position is obtained rapidly, usually within a few minutes.4,11,40 However, as discussed above, it appears that the generator used here requires considerably longer to reach the equilibrium Plots of parahydrogen fraction (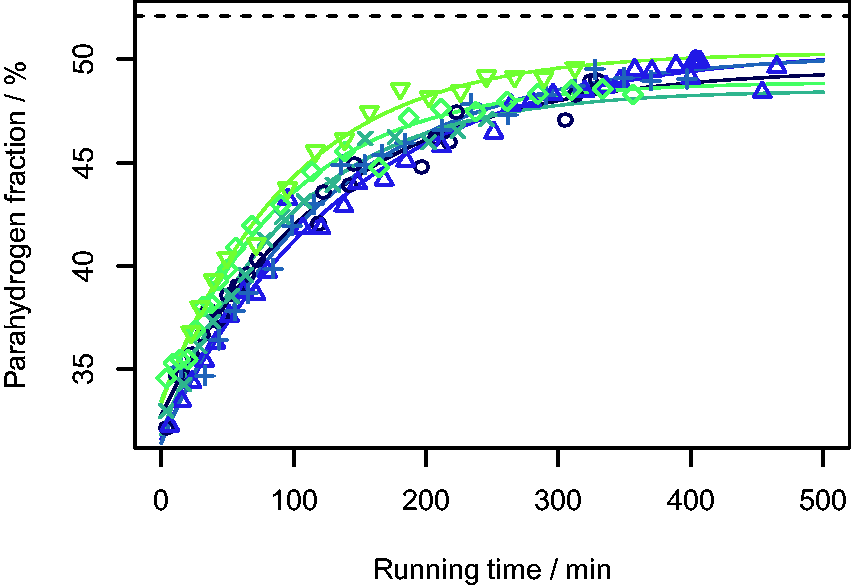

where
Gamliel et al.
27
also used a liquid nitrogen cooled pH2 generator (although with an iron(III) oxide catalyst), and used NMR spectroscopy to measure
To monitor the performance of the pH2 generator on-line, a simple glass tube was inserted between the outlet of the generator and the inlet of a pneumatic control unit, as shown in Fig. 1. This control unit is normally used to control the input of pH2 into a mixing chamber used for hyperpolarization experiments.19,20,28 In this case the pneumatic control was used to regulate the pressure in the flow tube and to control the flow of gas out of the pH2 generator. The Raman laser was focused onto the inside of the glass tube to provide in-situ analysis of the composition of the H2 gas flowing directly out of the generator and into the control unit.
Figure 4 shows the result of the calculated values of Plots of 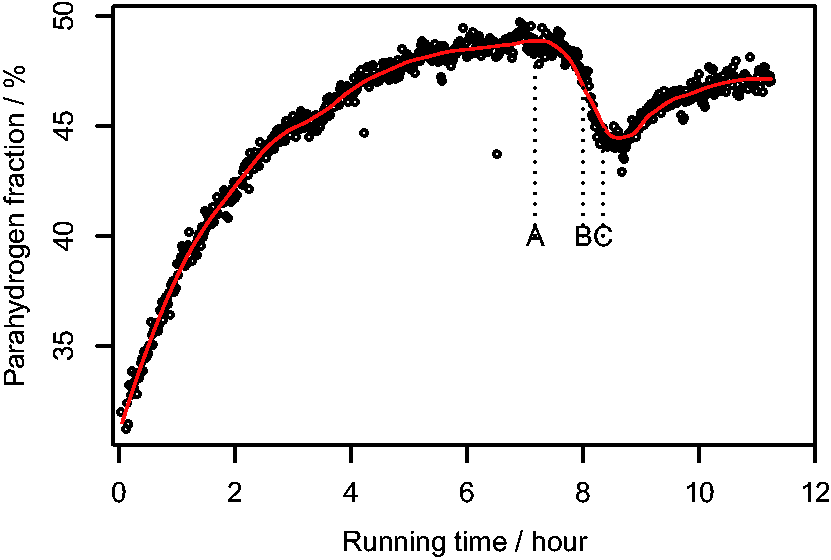
The sampling frequency used in hyperpolarization studies that also use a similar pneumatic control unit is reported as being in the range of 10–45 s,20,28,41 which is much more rapid than the once per 340 s used here. Therefore, after reaching steady state, the performance of the pH2 generator was tested by increasing the sampling frequency of the pneumatic control unit to once every 160 s (between points A and B on Fig. 4) and then to once every 100 s (between points B and C on Fig. 4). From Fig. 4, it can be seen that
These results clearly show that the generator used here would not be suitable for use with very high sampling frequencies, as the
Comparison and Validation with Nuclear Magnetic Resonance Measurements
To validate the Raman measurements, NMR analysis was also conducted on the pH2-enriched gas provided from the generator. As the samples taken for the at-line study with Raman were in standard NMR tubes, the exact same samples could be used for NMR analysis by simply inserting the sample into the bore of the NMR instrument. Here we used a bench-top NMR instrument (1H frequency of 43.5 MHz). While this provided less signal intensity than a high field instrument, it allowed the analysis to be conducted at-line, i.e., the pH2 generator, Raman spectrometer, and NMR spectrometer were all located within the same laboratory.
Quantification of
Figure 5 compares the NMR spectra of a tube filled with nH2- and pH2-enriched H2 at 4 bar. As expected, the signal is very broad16,27 (around 100 ppm or 4350 Hz) and the area is lower for pH2-enriched gas. As can also be seen from the spectra of an evacuated NMR tube in Fig. 5, there is a significant background signal. To correct for this, the background signal was subtracted from the spectra of the nH2 samples and the at-line samples (see Fig. S2 for example corrected spectra) in a similar method to that reported by Hövener et al.
16
Nuclear magnetic resonance spectra of an evacuated NMR tube, a tube filled with nH2 at 4 bar, and a tube filled with pH2-enriched H2 at 4 bar.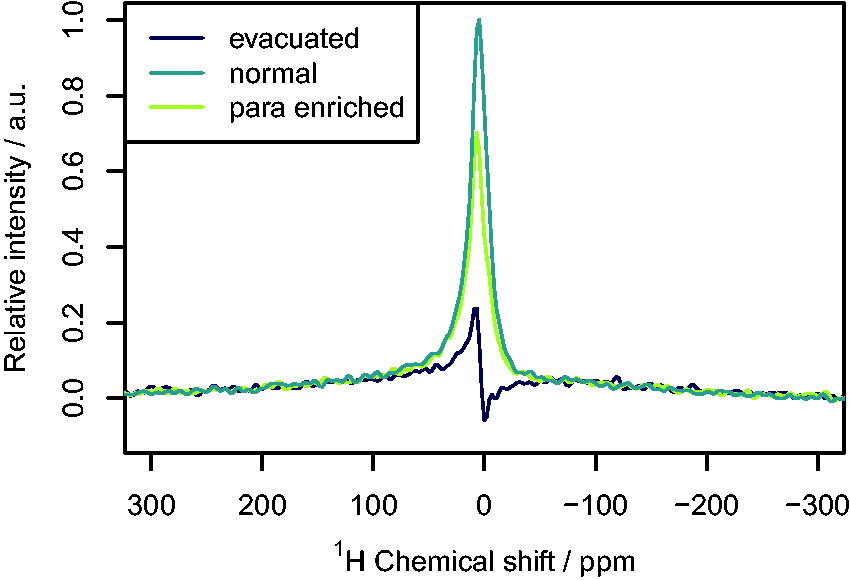

where S0 is the area of the oH2 peak in the NMR spectrum of an unknown sample and Sref is the area of the oH2 peak in the NMR spectrum of a sample with a known oH2 composition Plot of 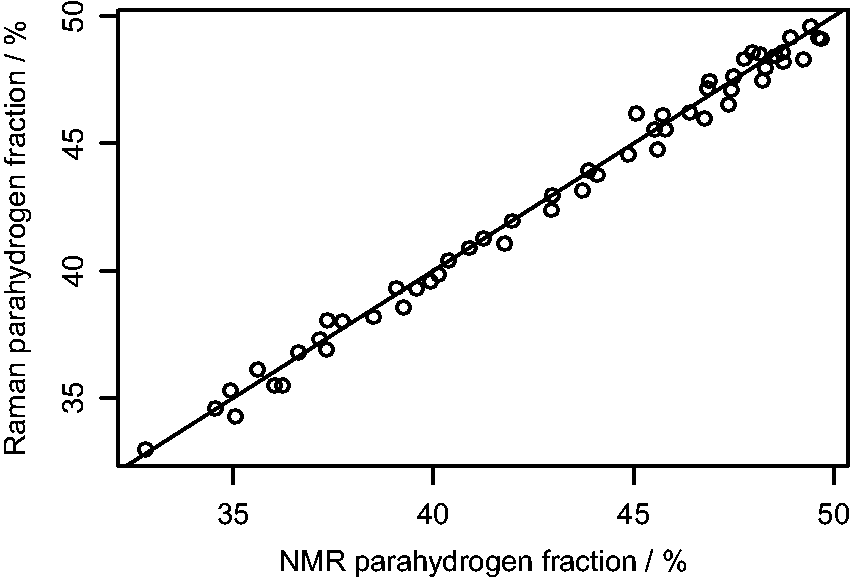
Although there is excellent agreement between the two measuring techniques, Raman analysis has several advantages over NMR for this application. The Raman technique does not require a reference sample, as both spin isomers can be directly detected, which simplifies the procedure and eliminates some sources of error. In NMR analysis, pH2 is only measured indirectly by measuring the change in the oH2 signal. While accurate results can be achieved with the pH2 fractions analyzed from the generator used in this work (
The temperature of the laboratory was measured with a standard kerosene-in-glass thermometer with an accuracy of ±1.5 K, and the pressure of the gas in the tube was measured with a pressure transducer with an accuracy of ±0.008 bar. Taking into account the density of H2,
42
this added an uncertainty of ±1.1% to the values of
Both the Raman and the NMR methods require calculation of the Boltzmann distribution between rotational energy levels of H2, to calculate p0 and p1 in Eq. 2 for Raman, and to calculate
In Situ Monitoring of the Conversion of pH2 in Nuclear Magnetic Resonance Tubes
Conversion between oH2 and pH2 spin isomers is forbidden, so spontaneous gas phase conversion is very slow.3,5,37 However, the glass wall of an NMR tube (e.g., as used for a SABRE hyperpolarization experiment) offers a surface for the heterogeneous conversion between spin isomers, which is more rapid.15,37 Various paramagnetic species in the glass wall (or in the sample) may also accelerate the conversion. 37 In fact, storage of samples under nH2 at liquid nitrogen temperatures before thawing and NMR detection led to one of the first reports of parahydrogen-induced polarization (PHIP), as pH2 enrichment was built up during sample storage.4,43,44 Additionally, if there is an imperfect seal when filling the NMR tube, small amounts of oxygen could be introduced. This oxygen could then also act as a paramagnetic catalyst for the conversion of the spin isomers. 21
Gamliel et al. 27 measured the conversion of pH2 in NMR tubes (type of glass not specified), using an NMR method similar to that described above to determine the pH2 fraction in the gas. They reported that no conversion of pH2 occurred; however, they only monitored the samples for 20 min. Tom et al. 21 also measured the conversion of pH2 in NMR tubes using NMR to monitor the pH2 content. They reported that the back conversion to oH2 at room temperature for a sample starting with ≈ 99.9% pH2 enrichment was 0.4% h−1 in tubes made from the same type of borosilicate glass as used here. Similarly, Feng et al. 15 monitored the conversion of pH2 to oH2 every 8 min for 64 h in an NMR tube. They found that the conversion profile followed an exponential function with a time constant of around 846 min. Hövener et al. 16 observed a similar profile in a borosilicate glass vial monitored over 41 h, again using NMR to determine the pH2 fraction; they reported a similar time constant of around 820 min.
To determine whether conversion of pH2 to oH2 was occurring inside the NMR tubes used here, five different tubes were filled with H2 from the pH2 generator at 4 bar and then analyzed with Raman spectroscopy every 30 s for 40 min. The sampling was done in a similar manner to the at-line study described above, except that the NMR tube was left in the beam path of the laser between measurements, resulting in an in situ measurement of any conversion occurring inside the NMR tube. For three of the tubes it was found that almost no back-conversion occurred within 40 min. For instance, for one sample
For two of the NMR tubes used, conversion from pH2 to oH2 occurred rapidly with a significant decrease in pH2 fraction within 40 min. To investigate this further, these two tubes were refilled with fresh pH2 to 4 bar and analyzed every 30 s for 3 h. The results are shown in Fig. 7, which shows that Plots of parahydrogen fraction (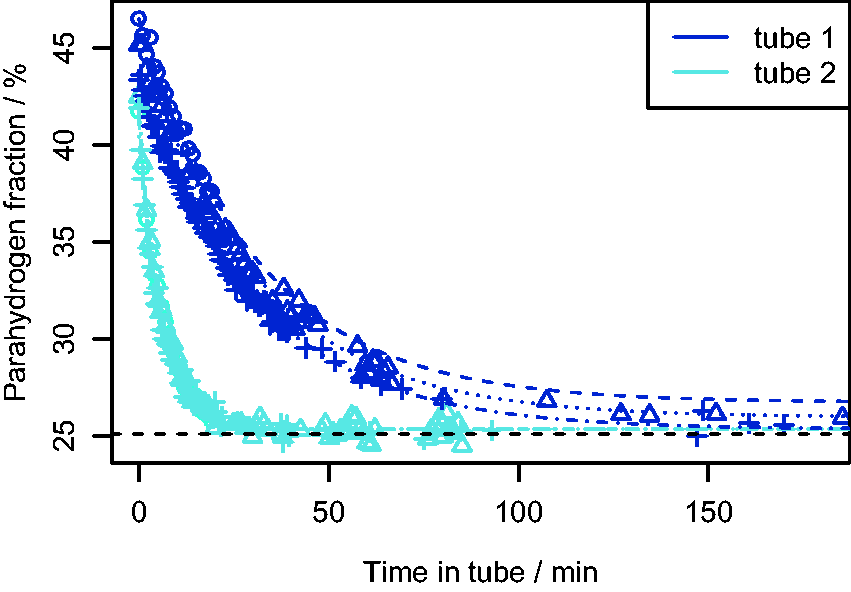
These results show that by using in-situ Raman analysis it was possible to monitor a rapid reaction in the gas phase, which may have gone unnoticed with other analysis techniques. The results also highlight the need to check glassware used when working with pH2-enriched gas, as many different types of impurities can promote the back conversion to oH2.2,5,37
To determine the long-term stability of pH2 in a non-contaminated tube, a fresh sample was analyzed every 20 min for a period of 18 h. This sample started with a
Conclusion
In this work, we have presented a rapid method to determine quantitatively the pH2 fraction in H2 gas using Raman spectroscopy. The Raman method has several advantages over other analytical techniques for determining pH2 fraction, most notably that no calibration samples are required. Here, we used a NCO to acquire Raman spectra of H2 gas at moderate pressures (≤ 5 bar) from within standard NMR tubes or a glass flow tube. This approach greatly simplifies the set-up and allows for much more rapid analysis compared to previous literature reports of using Raman spectroscopy to measure pH2 fraction.8,10,13,14,26
The performance of an in-house built pH2 generator was measured on-line by recording Raman spectra from a flow tube at the outlet of the generator. It was found that the generator required much longer than anticipated to reach steady state output (around 7 h). It was also found that increasing the flow rate of the gas within the generator reduces the enrichment achieved, presumably because of a reduction in residence time of the gas flowing in the generator. This result has important implications for hyperpolarization experiments requiring pH2 such as SABRE, as the NMR signal enhancement achieved is proportional to the enrichment level of the pH2 gas used.4,11,15 The on-line monitoring method reported here could be used in the future to correlate the enhancement of the NMR signal by SABRE to the pH2 fraction and to assess any changes to the pH2 generator design.
The rapid nature of the analysis used here permitted Raman spectra to be acquired every 30 s, so that the fast interconversion of the spin isomers of hydrogen from an enriched composition back to the room temperature equilibrium fraction within contaminated NMR tubes could be followed in detail. This interconversion may have been unnoticed with other slower analytical methods. Our results reveal a clear challenge when working with what is predicted to be essentially identical NMR tubes. It is also vital to take note that many PHIP approaches use sealed NMR tubes and often monitor product formation over minutes to hours.4,11,45,46 Significant care must therefore be taken in excluding sample preparation effects in such studies.
The results reported here for on-line and in-situ monitoring using commercially available hardware, represent close to a 500-fold increase in sensitivity compared to some previously reported work.13 Improvement and customization of the experimental set-up, e.g., by the use of multiple optical passes, could be expected to further increase the signal. More generally, this work demonstrates that Raman spectroscopy can be used to quantify the pH2 fraction in H2 gas in a fast and convenient manner. This is important in many other applications which require pH2, such as storage of H2 for fuel.
Footnotes
Acknowledgments
The authors thank Mr. Neil Hodgson for assistance constructing the pH2 generator, Dr. Thomas McGlone for support with the initial testing of the Raman analysis of H2 gas, and Dr. Charlotte Matheson for proofreading assistance.
Conflict of Interest
The authors report there are no conflicts of interest.
Funding
This project was funded by EPSRC (EP/M020983/1).