
Abstract
Objectives:
Chronic rhinosinusitis and related rhinologic disorders are common in routine otolaryngologic practice. Common presenting symptoms include nasal obstruction, facial pain, facial pressure, headache, and a subjective feeling of the face feeling “swollen,” a perceptual distortion. No validated scale exists to assess facial pain in addition to perceptual distortion or headache. The objective was to develop a novel scale for assessment of facial symptoms experienced by patients presenting for rhinologic evaluation.
Methods:
This was a prospective validation cross-sectional study. A patient questionnaire, the 12-item Facial Complaints Evaluation Scale (FaCES-12), was created to evaluate facial symptoms based on clinical experience and the literature, including severity and timing of facial pain, facial pressure, facial perceptual swelling, and headache. Each item was assessed utilizing an 11-point Likert scale ranging from 0 to 10 in severity. Data was collected prospectively from 210 patients in 1 private and 2 academic otolaryngologic practices from August to December 2019 along with the PROMIS Pain Intensity Scale 3a and 22-Item Sino-nasal Outcome Test. Construct validity was determined using Pearson correlation and exploratory factor analysis. Internal consistency and test-retest reliability were assessed by calculating Cronbach’s alpha and assessing test-retest scores.
Results:
A new 12-item scale named FaCES-12 was developed. FaCES-12 demonstrated high reliability with a Cronbach’s alpha of .94 and high test-retest reliability (r = .90). The scale revealed very strong correlation with the PROMIS Pain Intensity Scale 3a (r = .81) and moderate correlation with the Sino-nasal Outcome Test (r = .48). Exploratory factor analysis demonstrated the scale contained interrelated variables that measured unique components of facial sensations.
Conclusion:
The FaCES-12 is a valid and reliable instrument for use in the evaluation of facial symptoms. Further research into the application of this scale is warranted.
Keywords
Introduction
Chronic rhinosinusitis (CRS) and related rhinologic disorders are common in routine otolaryngologic practice with approximately 12% of adult patients in the United States reporting a sinus-related infection each year. 1 Common symptoms include nasal obstruction (80%-95%), facial pain, facial pressure, and headache. Up to 76% of patients present with facial pain or pressure, and for 47%, this is the symptom of greatest severity. 2
Some patients presenting for evaluation of sinusitis describe the subjective feeling of facial swelling. This feeling of a change in the appearance of the face in the absence of swelling on physical exam is a neurosensory process referred to as perceptual distortion (PD).3,4 PD can be defined more broadly as a lack of correspondence between the way a stimulus is commonly perceived and the way an individual perceives it under a given condition. Although swelling is the most common reported symptom in rhinologic conditions, perceptual distortions can also include feelings of numbness, drooping, or collapse. Studies in the neurology and oromaxillofacial literature have shown a significant incidence of PD in different non-rhinologic diagnoses of orofacial pain, with symptoms of PD present in patients with trigeminal neuralgia, temporomandibular joint disorder (TMJD), and persistent idiopathic facial pain (PIFP). 4
There are a number of instruments that have been developed to measure disease-specific quality of life symptoms in patients presenting for sinus and facial complaints. 5 Perhaps the most widely studied in the context of rhinosinusitis are the 16-item, 20-item, and 22-item Sino-nasal Outcome Tests (SNOT-22), Rhinoconjunctivitis Quality of Life Questionnaire (RQLQ), and Sinus Control Test (SCT).6,7 Of these, the SNOT-22 is the most widely used and has proven valuable in predicting treatment response and surveillance for CRS.8,9 The SNOT-22 has a component that evaluates facial pain/pressure as a single measure, but does not investigate other facial sensations, including headache, PD, location of pain, or each individual component of pain and pressure. These latter symptoms are commonly thought to be involved with sinusitis but are less frequent and/or severe than in extreme headache conditions such as migraines. Likewise, headache scales focus on pain related to the headache alone without considering that some patients may have concomitant facial pain or pressure. To our knowledge, no validated scales exist to assess facial pain in addition to PD or headache in CRS.
The purpose of this study was to develop and assess the reliability of a novel scale of facial sensation in a patient presenting for sinonasal complaints called the 12-item Facial Complaints Evaluation Scale (FaCES-12). This tool was designed to aid in objective assessment of subjective patient symptoms experienced in common rhinologic and non-rhinologic conditions affecting the face and commonly presenting to otolaryngologists.
Methods
Scale Development and Procedures
The FaCES-12 scale was created by the corresponding author (TSH) to describe the severity of facial complaints following literature review. Previous validated scales for pain were examined. The Patient Reported Outcomes Measurement Information System—Pain Intensity Scale (PROMIS Pain Intensity; Healthmeasures.net) is a validated study to evaluate pain that describes the timeframes of average, most severe, and current pain. Other validated scales studied included the Brief Pain Inventory, Short Form McGill Pain Questionnaire, 10 and the Global Pain Scale. Initial drafts of the scale were utilized in patients during the development phase to help clarify wording and to determine if they understood the questions being asked. Feedback was brought to the study team over a series of meetings in which variations of FaCES-12 were evaluated until the content was finalized. The scale contains 4 parts (or symptoms), each divided into 3 items based on timing and severity. The symptoms utilized in the scale are facial pain, facial pressure, facial perceptual swelling, and headache. The 2 extremes of PD are the sensations of the face being swollen (outward) or sunken (inward). While perceived facial swelling tends to be common in patients with facial pain the perceptual sensation of the face being sunken is quite rare in both non-rhinologic and rhinologic conditions; therefore, this variable was not included in the scale. 4 The last symptom of the scale is headache since this symptom can be comorbid with facial pain and pressure. The 3 items describing timing within each symptom component—at present, at most severe, and on average—were included to maintain consistency with other previously validated pain scales. An 11-point scale was chosen to provide both the best sensitivity and easy comprehension by patients.
Participants and Procedures
Data were collected prospectively from new patients presenting to the otolaryngologist for sinonasal complaints from August 2019 to December 2019 at 3 locations: Louisville, Kentucky; Indianapolis, Indiana; and Los Angeles, California. Data was collected from 1 private practice and 2 academic institutions. Exclusions included non-English speakers, age less than 18 years old, intracranial or sinonasal mass, the presence of prior craniomaxillofacial hardware, and evidence of facial trauma or edema, palsy, or numbness. Each patient underwent initial examination in the office. This included a thorough history and physical examination, the SNOT-22 (2006, Washington University, St. Louis, MO), and the PROMIS Pain Intensity (Healthmeasures.net). At the time of their clinical encounter, patients were asked to rate the severity of facial symptoms, including facial pain, facial pressure, perceived facial swelling (PD), and headache, at the present time, the most severe in the past month, and on average in the past month. The symptoms were assessed utilizing a 11-point Likert scale ranging from 0 to 10. The scale was named the 12-Item Facial Complaints Evaluation Scale (FaCES-12) and is demonstrated in Figure 1. The scale is calculated as a total sum of the responses, ranging from 0 to 120. A score for each symptom can also be calculated as the sum of each of its 3 respective scores, ranging from 0 to 30. Institutional review board approval was obtained through each of the respective institutions, University of Louisville, Indiana University, and Cedars-Sinai Medical Center.
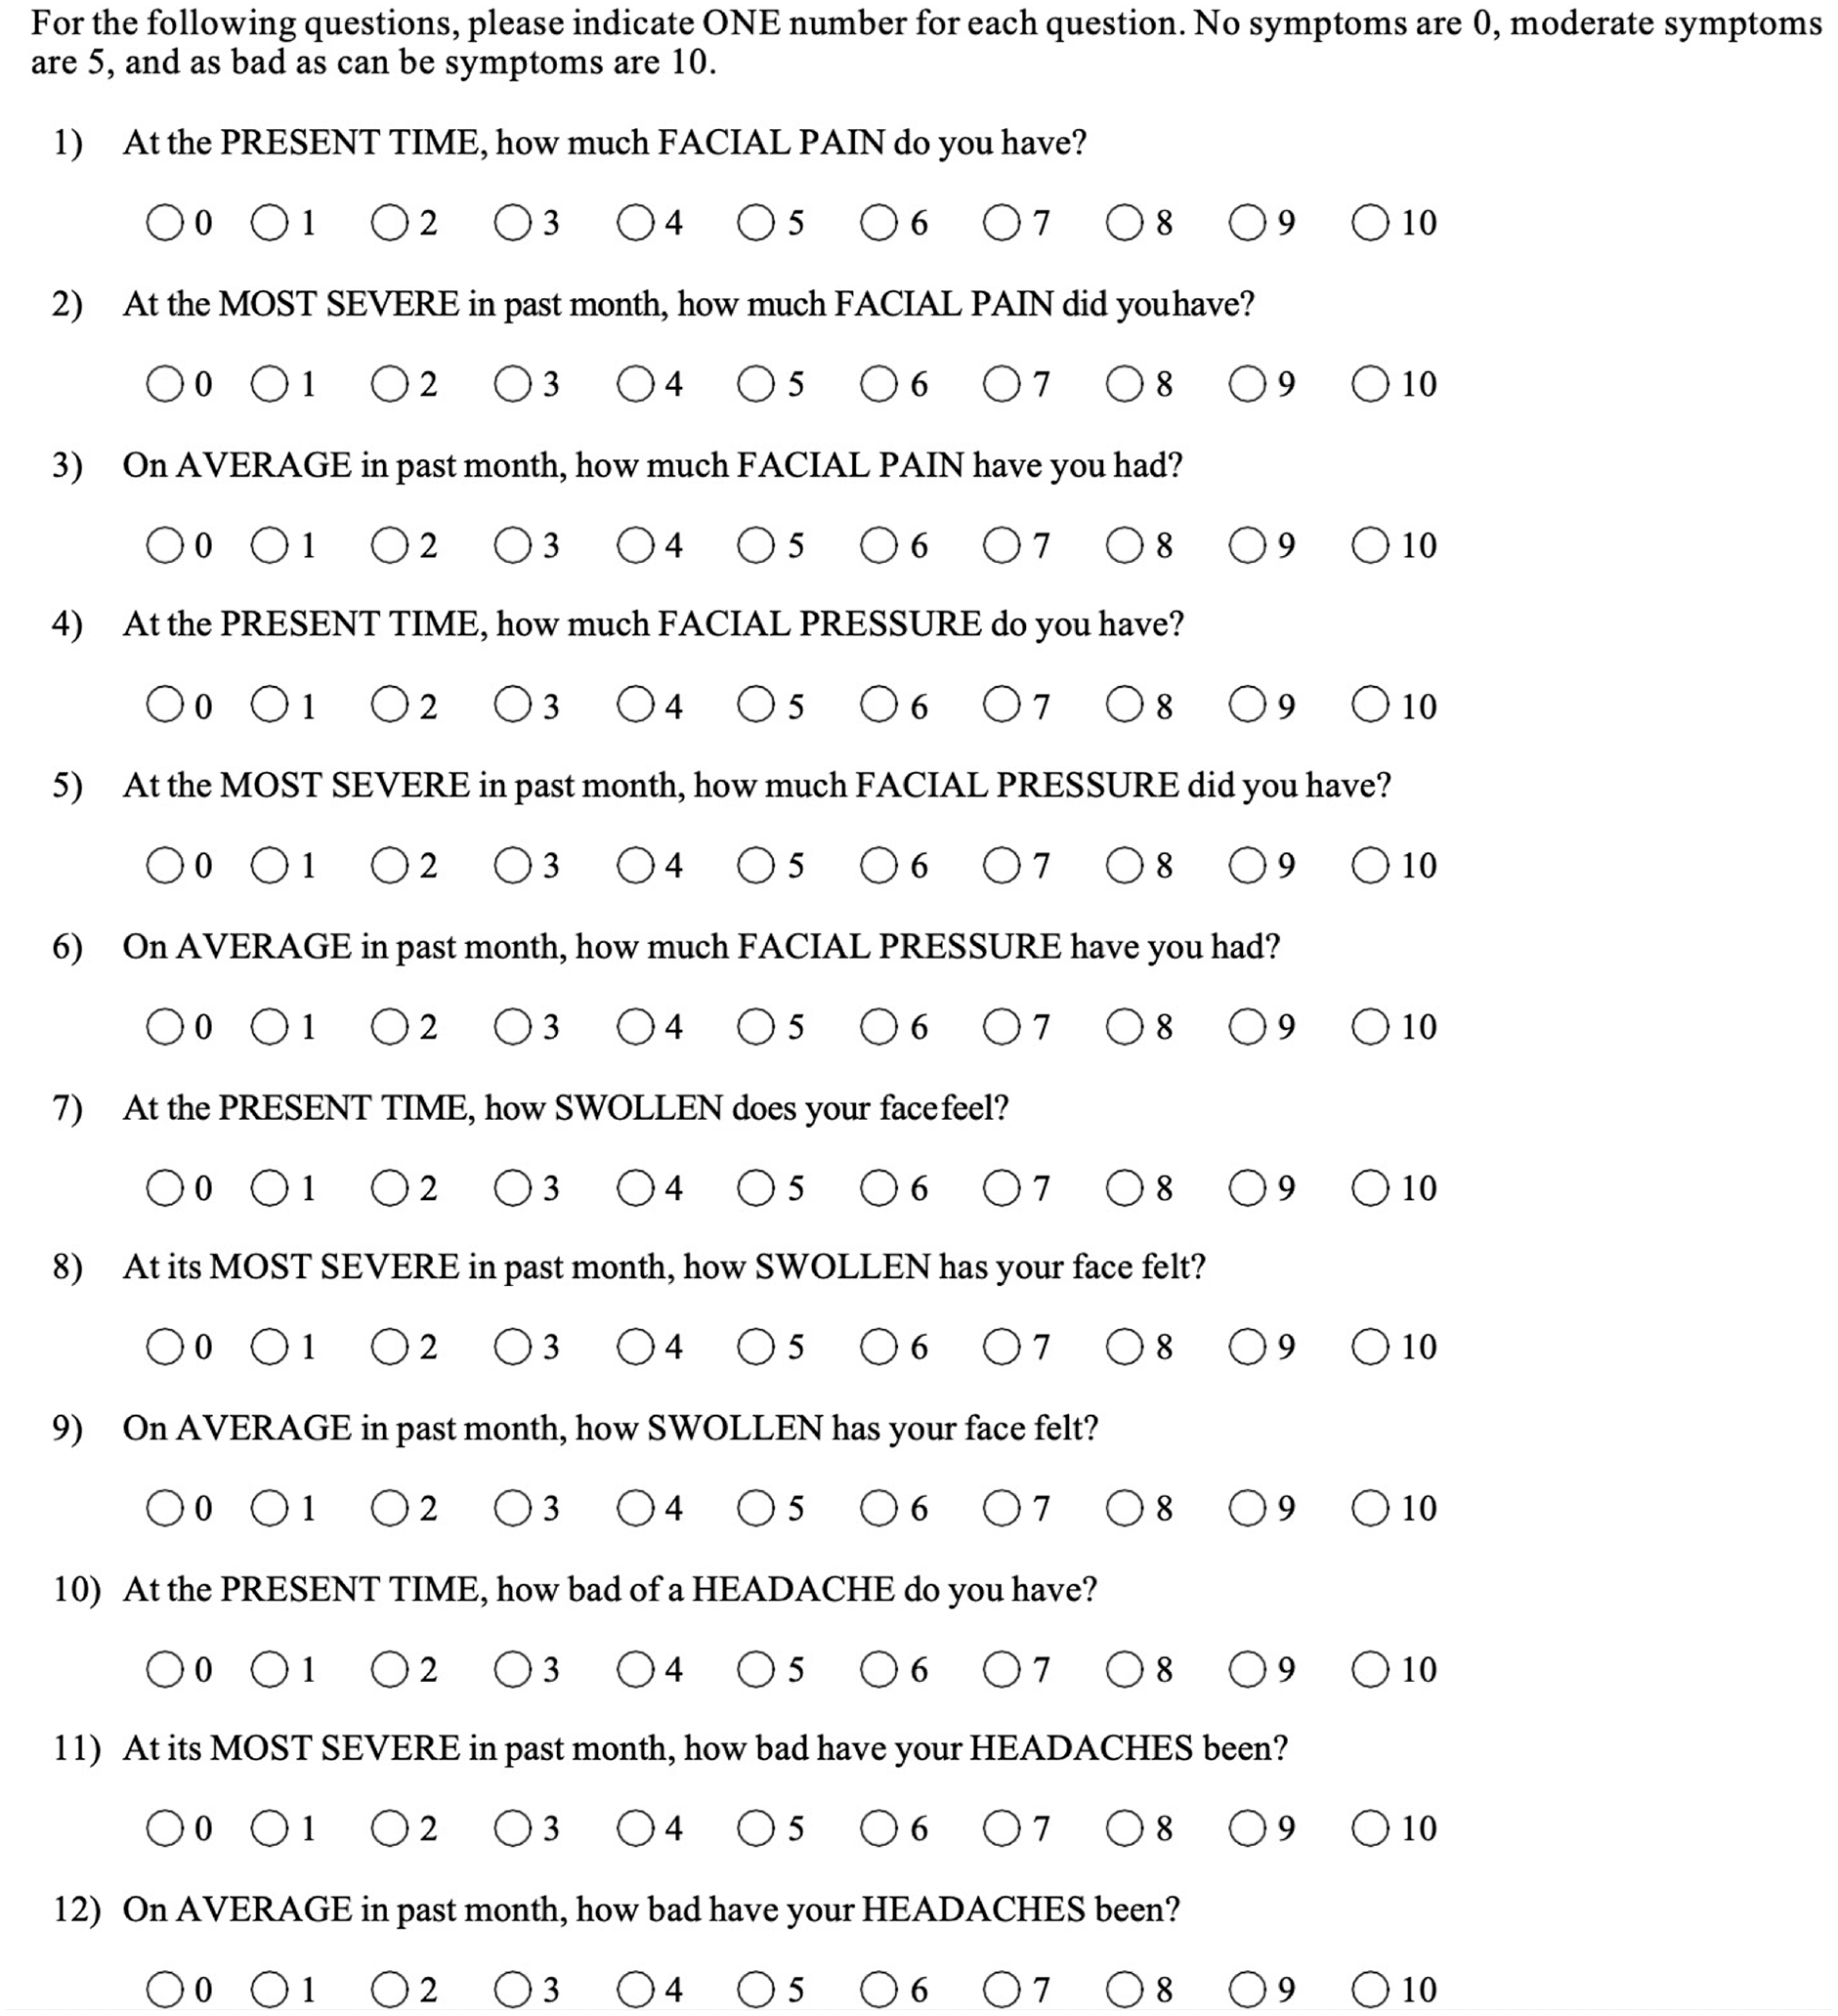
12-item facial complaints evaluation scale (FaCES-12) questionnaire.
Validity and Reliability
Content validity was assessed by discussing the components of the scale with experts in the fields of otolaryngology, pain, oromaxillofacial surgery (OMFS), and neurology. Construct validity can be referred to as the degree to that a symptom is measured by an instrument and was assessed via exploratory factor analysis (EFA). 11 Concurrent validity was measured by comparing the correlation coefficients of the FaCES-12 to the PROMIS Pain 3a, total SNOT-22 score, and facial pain/pressure variable of the SNOT-22. Criterion validity could not be established for PD as this scale is the first scale to provide validation information for PD and no gold standard exists. Reliability was assessed using the internal consistency and test-retest reliability. Cronbach’s alpha was obtained to evaluate internal consistency. Test-retest reliability was assessed by comparing tests administered to the same individual within an interval of 2 to 3 weeks who reported no change in symptoms and had had no therapeutic intervention.
Data Analysis
Normality testing of interval variables demonstrated normal distribution; therefore, parametric tests were utilized. Pearson’s correlation was performed to compare individual items. An EFA was used to determine if the items within each part of the FaCES-12 tended to measure the same components. A principal components analysis was initially performed, and the components with Eigenvalues of 1 or greater were kept for further analysis. Multiple linear regression was then utilized to evaluate the extent to which these factors accounted for the variance among the variables, and a component matrix was created. Variable maximization rotation was performed to redistribute factor loading and form the final component matrix. Cronbach’s alpha was calculated. Test-retest reliability was calculated using Pearson’s intra-class correlation coefficient. P-values less than .05 were considered statistically significant. All statistical analysis was performed using IBM SPSS version 25 (Released 2017. IBM SPSS Statistics for Windows, Version 25.0. Armonk, NY: IBM Corp.).
Results
Cohort characteristics
Of the 220 patients asked to participate, the final analysis included 210 patients. Exclusions included 2 patients with sinonasal malignancy, 1 with facial palsy, 3 with physical exam evidence of facial numbness, and 1 who was not an English speaker. Four patients declined to complete the questionnaires. The demographics are summarized in Table 1. The mean age of the subjects enrolled was 52. There was a female predominance, with 132 female patients and 78 males. Table 2 summarizes the mean and standard deviation of patient-reported scores.
Baseline Patient Demographics and Diagnosis.
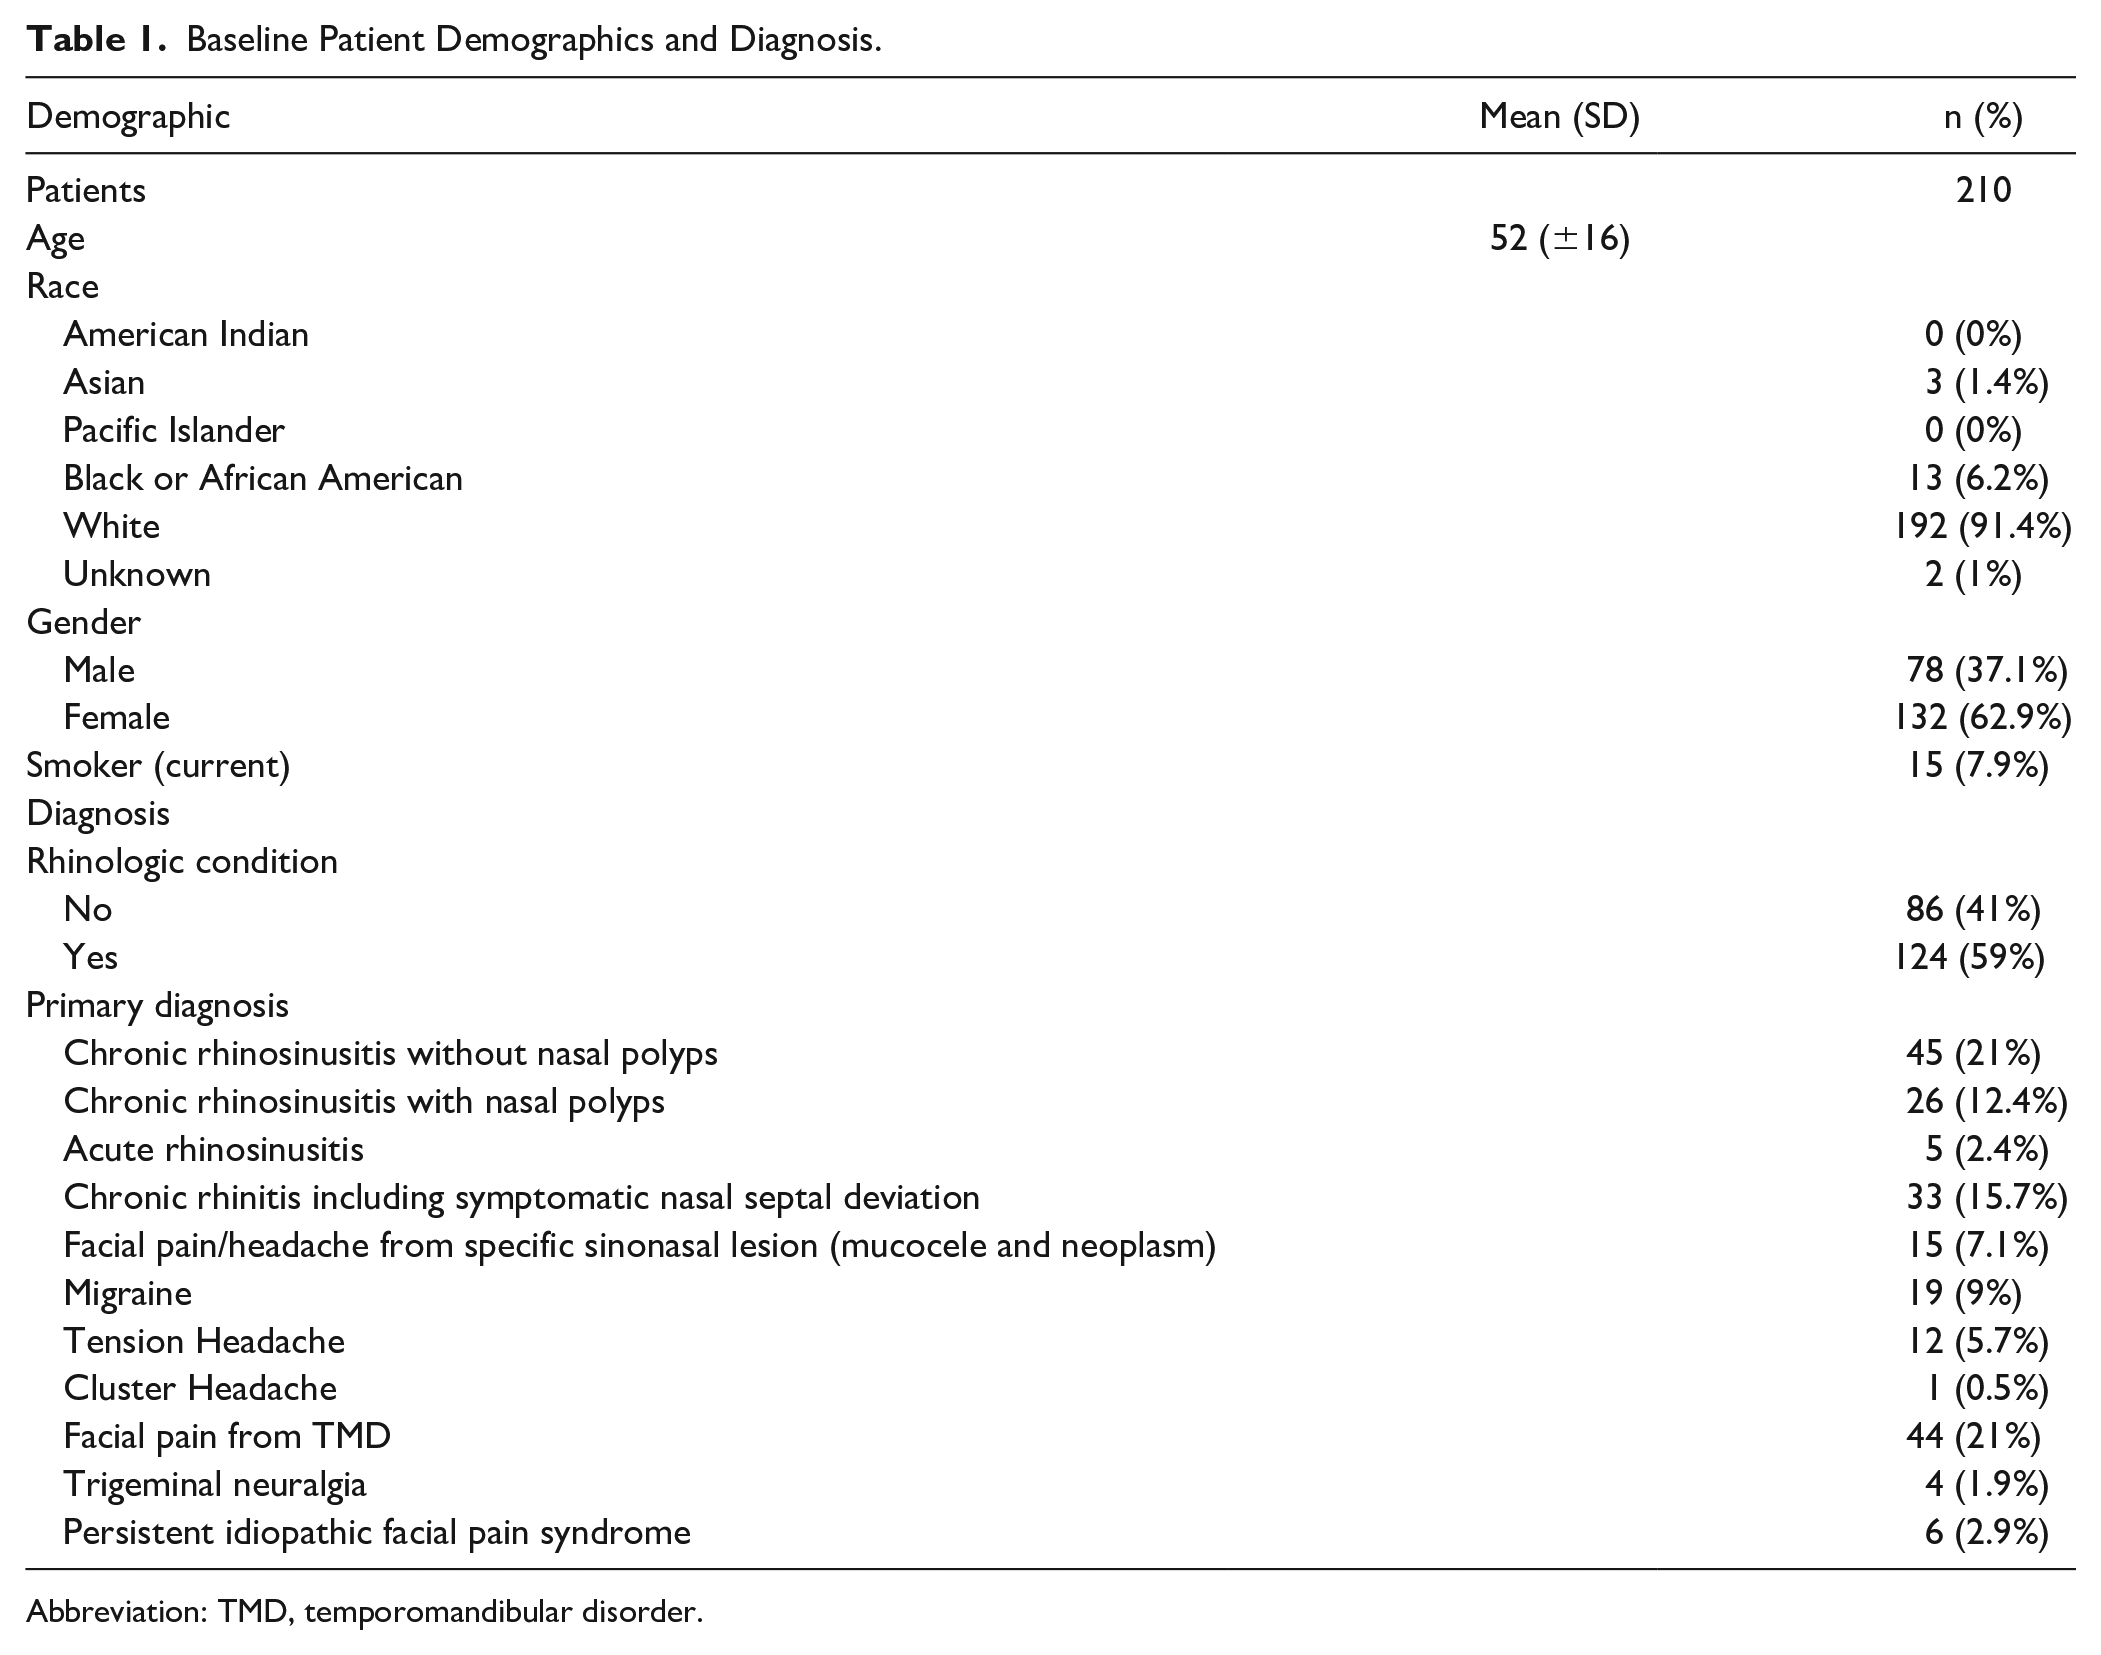
Abbreviation: TMD, temporomandibular disorder.
Scores for the Facial Complaints Evaluation Scale (FaCES-12), Patient Reported Outcomes Measurement Information System—Pain Intensity Scale 3a (PROMIS Pain 3a), and 22-item Sinonasal Outcome Test (SNOT-22).
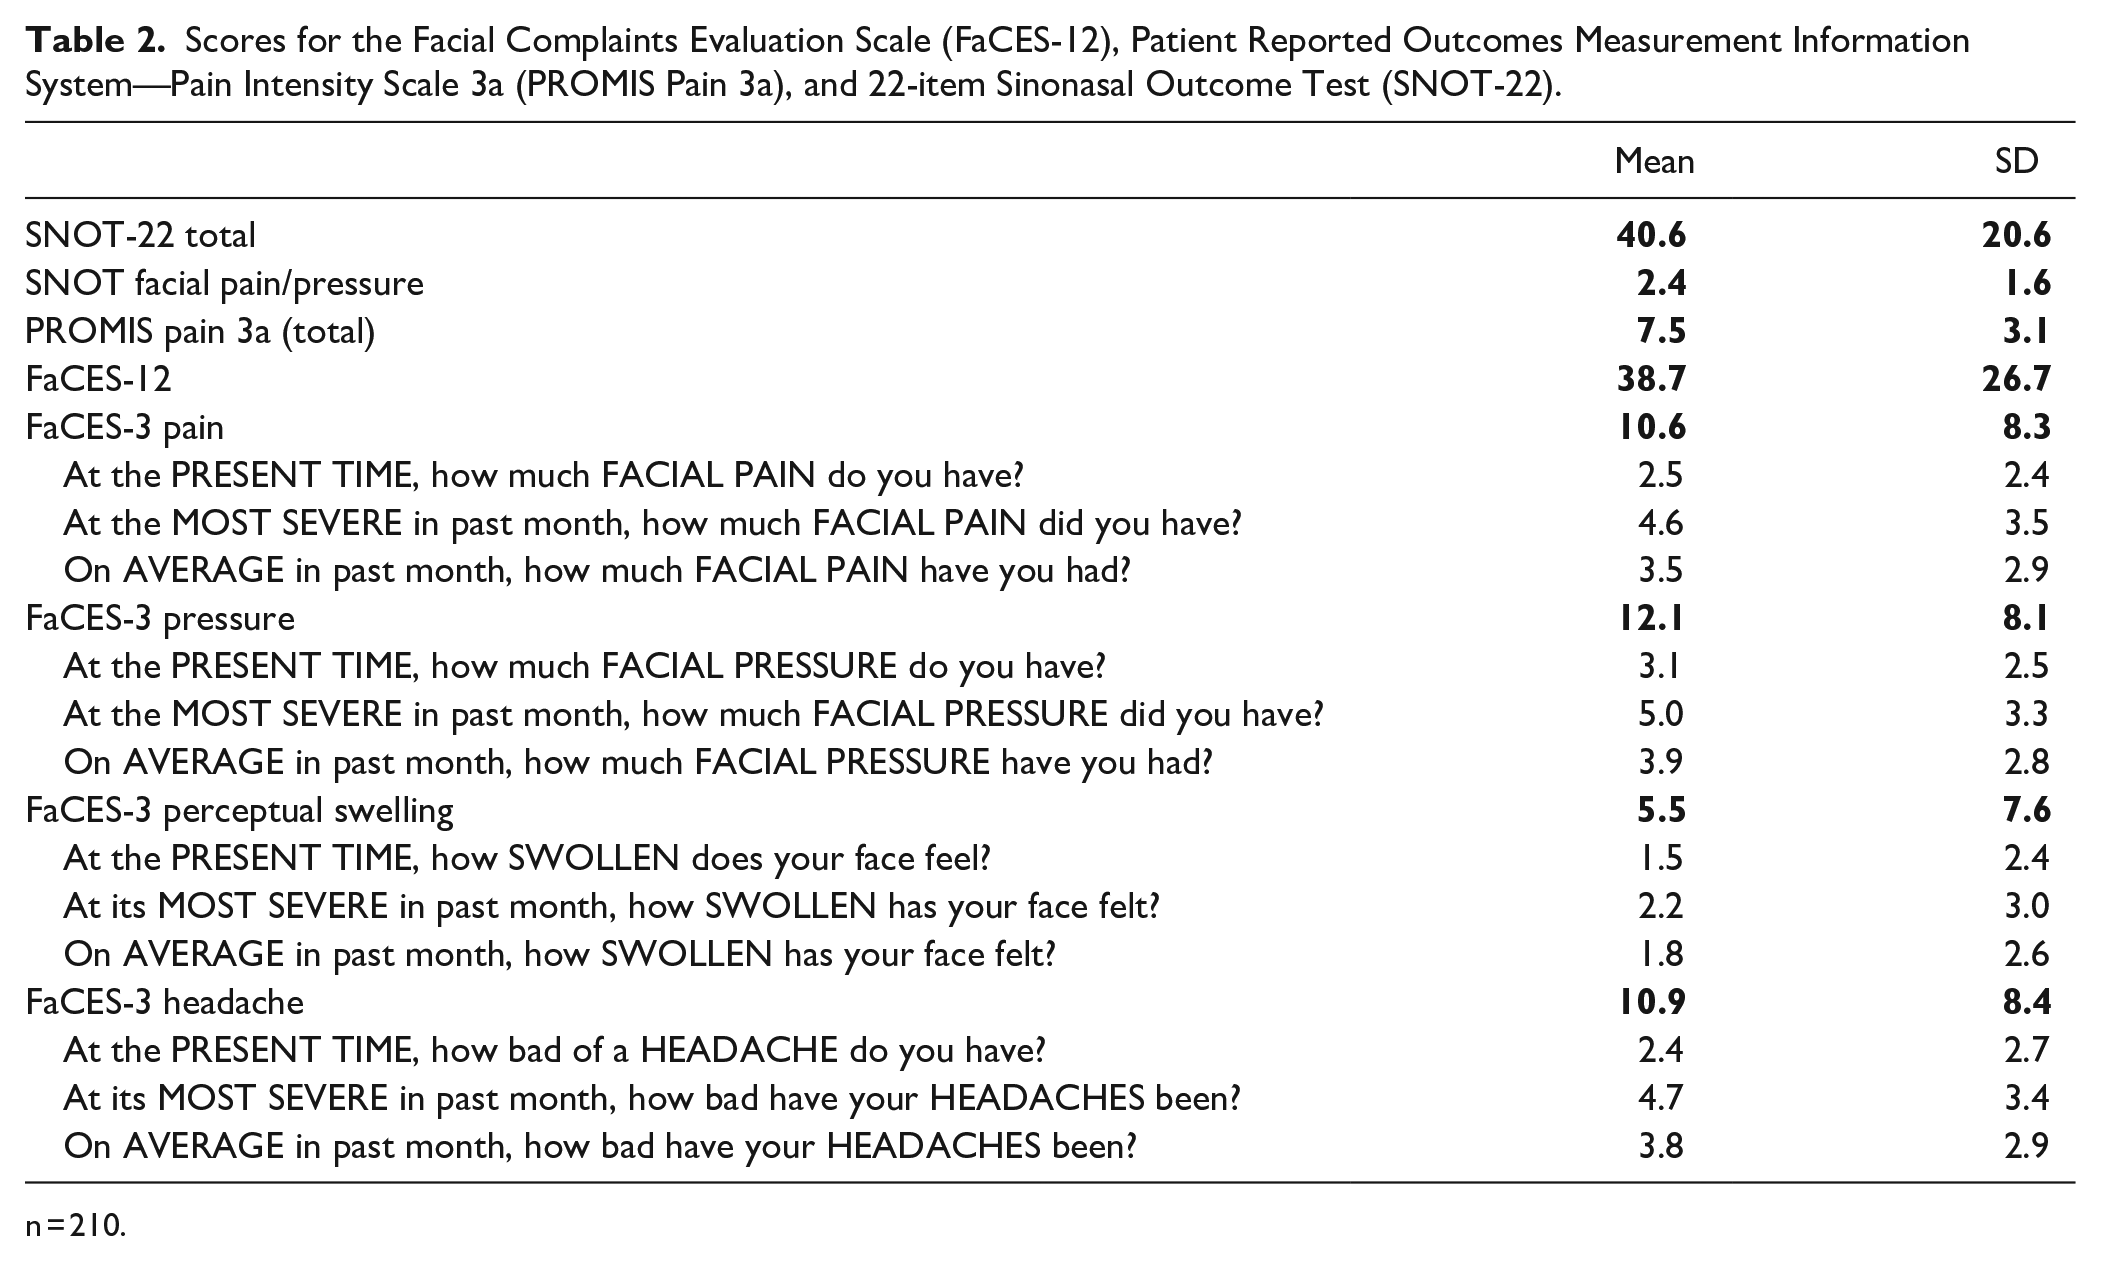
n = 210.
Construct Validity
The EFA of the FaCES-12 items demonstrated interrelated variables measuring different components. The analysis converged in 6 iterations to extract 3 domains of interrelated variables with all of the variable fitting in the model. The domains included a Facial Pain and Pressure domain, Perceptual Distortion domain, and Headache domain. Although Facial Pain and Pressure fit the same domain, the level of scores differed significantly between FaCES-3 Pain scores and FaCES-3 Pressure (Mean Difference −1.5, 95% CI ±0.7, P < .001).
Concurrent Validity
FaCES-12 correlated very strongly with PROMIS-Pain 3a (r = .81, P < .001), strongly with the Facial Pain/Pressure variable of the SNOT-22 (r = .68, P < .001), and moderately strongly with the total SNOT-22 (r = .48, P < .001).
Internal Consistency Reliability
Cronbach’s alpha of the FaCES-12 was .94 (95% CI 0.93-0.95). Reliability testing was also assessed for each of the components of the scale and demonstrated in Table 3. Cronbach’s alpha of these scales was, respectively, .93 (FaCES-3 Pain), .93 (FaCES-3 Pressure), .96 (FaCES-3 Perceptual Swelling), and .92 (FaCES-3 Headache).
12-Item Facial Complaints Evaluation Scale (FaCES-12) Reliability.
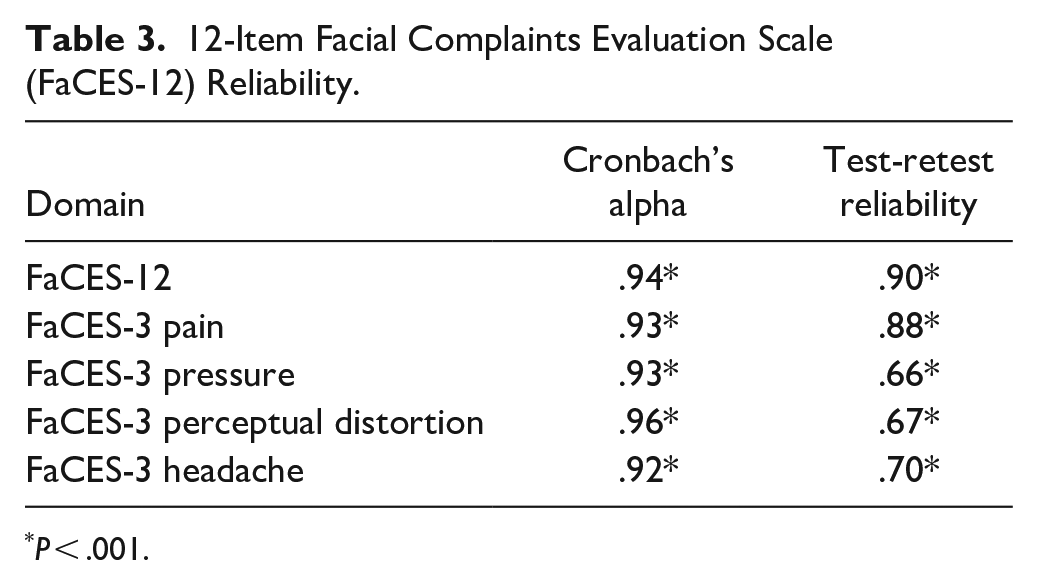
P < .001.
Test-Retest Reliability
Repeat testing using the FaCES-12 was performed on the first 20 patients who returned to clinic in an interval within 2 to 3 weeks having been given no therapeutic intervention and having no change in their condition. In these patients, the FaCES-12 demonstrated very strong test-retest reliability (r = .90, P < .001). Test-retest reliability for each component was: r = .88 (FaCES-3 Pain), r = .66 (FaCES-3 Pressure), r = .67 (FaCES-3 Perceptual Swelling), and r = .70 (FaCES-3 Headache).
Discussion
This preliminary development study of the FaCES-12 scale found it to be a reliable scale to assess facial sensations of patients presenting for sinonasal complaints. It is a brief and easy to administer tool, which can be completed in under a minute. Of significance, it can provide objective data of subjective symptoms of pain, pressure, headache, and PD. This is important as these symptoms have been described in many different diagnoses that affect the head and neck.2,10,12 -16 Future study requirements to further establish the FaCES-12 scale as valid and reliable include formal cognitive and pilot testing, factor analysis, and testing in condition-specific or co-morbid condition scenarios.
The most common shared symptom of rhinologic and non-rhinologic conditions is pain. Deconde, et al, used validated pain scales to demonstrate the distribution and quality of pain experienced in patients with chronic rhinosinusitis. 10 The majority of patients experienced pain in the cheeks, forehead, or between the eyes. The most common descriptor used to describe the pain was “throbbing.” Interestingly, up to 30% of patients experienced pain in the temporal region, 15% in the parietal region, and 18.2% in the occipital region. This distribution has significant overlap with trigeminal neuralgia, TMJD, PIFP, and others. While pain has been described in CRS, the incidence and prevalence of PD has not been described. Rates of PD are high in non-rhinogenic causes of facial pain with PD present in up to 81% of patients with trigeminal neuralgia, 41% of patients with TMJD, and 37.5% of patients with PIFP. 4 It is likely that many patients presenting to the otolaryngologist for evaluation of sinusitis, in fact, suffer from non-rhinologic conditions. It is important to identify these patient populations to provide appropriate treatment and referral and future research with the FaCES-12 may be beneficial.
Headache is also a common symptom that overlaps between rhinologic and non-rhinologic conditions. One report indicated that up to 88% of patients presenting for sinus disease met the diagnostic criteria for migraine. 15 Other headaches that are mistaken for sinus disease include tension-type headaches and temporomandibular disorders. Headaches can also be found in sinus conditions, particularly in patients with sinonasal mucoceles and sinonasal neoplasms. 16
PD of the face is associated with facial pain and facial numbness. Patients predominantly complain of the sensation of swelling as opposed to sunken appearance. 3 The exact mechanism of perceptual distortions is unknown but appears to be multifactorial related to both acute and chronic stimuli. One proposed mechanism of PD in chronic pain conditions is that chronic noxious stimuli produce a reorganization of the primary somatosensory complex in the parietal lobe. This mechanism has been investigated in non-head and neck conditions such as chronic back pain and chronic regional pain syndrome. 17 One study showed a positive correlation between pain intensity and perceived body perception disturbances in patients with chronic back pain. 18 In this study, eliciting painful stimuli resulted in an awareness of pain but difficulty with localization and with identifying the boundaries of the limb. The authors concluded that chronic pain likely resulted in a reorganization of the primary somatosensory cortex.
We would like to pursue further investigation into whether the FaCES-12 questionnaire can be valuable as a diagnostic tool. Chronic rhinosinusitis has a significant burden on the healthcare system and can be hard to diagnose solely on subjective patient descriptions. Additionally, previous pain scales that take facial pain into account have not been found to aid in CRS diagnosis. While the otolaryngologist has the advantage to perform nasal endoscopy for objective findings of CRS, primary care providers, allergists, and other specialties are often reliant on those subjective patient descriptions and imaging. Given that the symptoms of CRS are variable and have a high degree of overlap with primary headache and orofacial disorders and prevalence of abnormal CT imaging in rhinosinusitis ranges only from 65% to 80%, CRS diagnosis and management are difficult.19,20 Further studies will be required to assess discriminant validity and determine if this scale will be able to discriminate between different disease states. If FaCES-12 can be used to aid in the diagnosis of CRS, the tool may allow non-otolaryngologists (ie, neurologists, dentists, and primary care physicians) to diagnose the condition earlier, prompting earlier referrals to otolaryngology and potentially decreasing the burden on the healthcare system.
This study has certain limitations. First, a structured iterative process of multidisciplinary experts was not used to decide the components of the scale. Rather, the scale was developed utilizing pain-related facial and head symptoms commonly seen in the authors’ clinical experiences and found in an extensive multidisciplinary literature search, including OMFS and neurology literature, and applying them to a standard pain scale model. Since this methodology was agreed upon at the initial meeting, no further iterative process was undertaken. However, we do believe that further development and modification of the scale should include input from a multidisciplinary expert panel. Given that this was a preliminary developmental study of this scale, future study requirements include formal cognitive and pilot testing, factor analysis, and testing in condition-specific or co-morbid condition scenarios. Second, while items in the study assessed the severity of symptoms, the specific timing of events, that is, morning, evening, are not assessed by this tool and will be important parts of the thorough patient history. Because of this variability, the scale includes 3 periods of time: present symptoms, average symptoms over a month, and most severe symptoms in the past month. The scale also does not include additional questions on location of symptoms and associated symptoms. This was done in an effort to maximize completion rate by limiting the questionnaire to 1 side of a page. Additionally, as no current instrument exists for the assessment of PD, there is no comparison to obtain criterion validity on the FaCES-3 PD portion of the tool. The study would additionally benefit from a larger test-retest cohort to establish reliability of the PD component, although overall test-retest reliability of the study was quite high. Ideal subjects for test-retest reliability with pain-related symptoms of chronic sinusitis should have stable symptoms and not receive treatment in between testing. We found that these criteria limited the sample size of the test-retest cohort as the symptoms of chronic sinusitis often failed to remain stable over the 2 to 3 weeks between measurements, and many patients declined to forego treatment for the interval period. In future studies, we would also like to evaluate the scale’s consistency in monitoring a change in symptoms based on characteristics such as treatment. This study uses a Likert Scale in lieu of continuous VAS-style scales for data collection, which limits the data to interval data and not ratio data. A Likert Scale was utilized because of its ease of use as it has been used in many previous clinical tools such as the SNOT-22, NOSE, ETDQ-7, and others. Lastly, although the study evaluated test-retest reliability, this study did not test for responsiveness to detect clinical changes over time, effects of various treatments, or attempt to discriminate between various headache and non-headache diagnoses. Further studies will be needed to evaluate these concerns.
Conclusions
This preliminary study of the FaCES-12 scale suggests it to be a reliable scale to assess facial sensations in patients presenting for sinonasal complaints, including headache, facial pain, pressure, and PD. Further research with a larger patient population is aimed at establishing whether the FaCES-12 scale can be used in the diagnosis and/or outcome assessment of rhinologic and non-rhinologic conditions. We believe that the FaCES-12 questionnaire could be a promising addition to the current valid and reliable instruments for use in outcomes research in rhinology, neurology, and oromaxillofacial surgery.
Footnotes
Acknowledgements
We want to thank Crystal Howard for help with naming the scale.
Declaration of Conflicting Interests
The author(s) declared the following potential conflicts of interest with respect to the research, authorship, and/or publication of this article: Dr. Thomas Higgins is a speaker and advisor for Optinose, Regeneron/Sanofi, and Genentech. Dr. Arthur Wu is a speaker and investigator for Regeneron/Sanofi and an investigator for Optinose. None of the authors have published, presented, or submitted any related papers from the same study or have any conflicts of interest to report.
Funding
The author(s) received no financial support for the research, authorship, and/or publication of this article.