
Abstract
This study compared the predictive power of the systemic immune-inflammation index (SII) and Naples prognostic score (NPS) in determining the severity of coronary artery disease (CAD). The study included 1138 patients who underwent coronary computed tomographic angiography (CCTA). The primary outcome was the evaluation of CAD severity, determined by the Coronary Artery Disease-Reporting and Data System (CAD-RADS) obtained from the CCTA scans. A basic statistical model including age, gender, chest pain, diabetes mellitus, hypertension, hyperlipidemia, and smoking was built, and categorical variables, NPS (Naples 3,4 vs 0,1,2) and SII, were added to the basic statistical model. The net benefits of the predictive parameters were determined by a decision curve analysis, and the association between CAD-RADS and NPS, SII was quantified by odds ratios (OR) and 95% confidence intervals (CI). The decision curve analysis showed that adding SII to the statistical model had a better full range of probability of clinical net benefit compared with the baseline model (OR: 5.77, 95% CI 4.15–8.02, P < .001). However, adding the NPS (P = .11) to the model did not outperform the basic statistical model. In conclusion, the SII may have a net predictive effect on top of traditional risk factors.
Keywords
Introduction
Coronary artery disease (CAD) remains a significant cause of mortality and morbidity. 1 Coronary computed tomographic angiography (CCTA) has become an important diagnostic tool in patients with CAD as it provides detailed information about the severity of CAD, plaque morphology, congenital abnormalities, microvascular structure, and is widely used in low and medium-risk patients with CAD. 2
Recent studies have shown that inflammation plays an active role in the formation of coronary atherosclerosis and calcification. 3 In addition, viral or bacterial microbiomes have been found in many atherosclerotic plaque specimens from the coronary or carotid vasculature. 4 Studies assessing the effect of anti-inflammatory and anti-hyperlipidemic treatment have shown delays and regressions in atherosclerotic formation. 5 The Canakinumab Anti-Inflammatory Thrombosis Outcomes (CANTOS) trial showed that the incidence of cardiovascular (CV) mortality, myocardial infarction, and stroke was significantly lower compared with placebo in patients receiving anti-inflammatory therapy, and the rate of recurrent CV events was also lower in the group with decreased C-reactive protein (CRP). 6 There is a direct proportion between the atherosclerotic formation and the elevation of indicators of inflammation activity, such as CRP and interleukin-6. Failure to suppress inflammation leads to an increase in the frequency of CV events.
The systemic immune-inflammation index (SII) was first used in cancer patients and provided important prognostic data. It has since been successful in predicting short and long-term clinical outcomes in acute and chronic coronary syndromes7,8 and has statistically significant power in predicting CAD severity in patients undergoing conventional coronary angiography. 9 The Naples prognostic score (NPS), a scoring system using albumin, total cholesterol, and inflammation cells, has been used to predict the presence, severity, and prognosis of patients with various cardiac conditions.10-12 Although there have been several studies investigating the effectiveness of albumin, cholesterol, and inflammatory cells, there is limited data evaluating the value of the Naples score in predicting the presence and severity of CAD.13,14
The aim of the present study is to investigate the correlation between coronary severity and the NPS and SII scores in people with stable CAD. We have previously found an association between the NPS and in-hospital and follow-up outcomes in ST-segment elevation myocardial infarction (STEMI) patients. 15
Methods
The study retrospectively evaluated 1600 consecutive patients who presented to the outpatient clinic with symptoms of stable angina pectoris between August 2021 and January 2022. These individuals were considered to be at intermediate risk for CAD (pre-test probability value between 15 and 85%) and underwent CCTA as a diagnostic tool. Patients (n462) were excluded from the study due to various criteria such as history of CAD, presence of certain heart conditions, active infections, low glomerular filtration rate, and poor image quality in CCTA. The demographics and laboratory and clinical characteristics of 1138 patients were obtained from the digital medical archives of the institution and analyzed. The plaque types and CAD-RADS scores obtained from CCTA were also analyzed.
This study was conducted in accordance with the ethical principles stated in the Declaration of Helsinki and was approved by the institution’s ethics committee.
All blood samples including triglycerides, high-density lipoprotein cholesterol (HDL-C), and low-density lipoprotein cholesterol (LDL-C), and glucose levels were drawn after a minimum 8-h fast. Basic laboratory parameters, including hemoglobin, albumin, monocytes, lymphocytes, and cholesterol levels, were recorded before the procedure. The glomerular filtration rate (GFR) was estimated using the formula recommended in the Modification of Diet in Renal Disease Study. 16 Hypertension was defined as a systolic and diastolic blood pressure of ≥140 and ≥90 mmHg, respectively, or using antihypertensive medication. Diabetes Mellitus was defined as a fasting glucose level of ≥126 mg/dL, a diagnosis of diabetes, or use of medication. Dyslipidemia was defined as total cholesterol levels ≥240 mg/dL, LDL-C levels ≥130 mg/dL, HDL-C levels ≤40 mg/dL, triglyceride levels ≥150 mg/dL, or use of lipid-lowering medication. Participants were considered smokers if they were active smokers in the month prior to the study.
The systemic inflammatory index (SII) was determined by multiplying the absolute platelet count (PLT) by the absolute neutrophil and lymphocyte count ratio (NLR). 9 The NPS consisted of 4 parameters: serum albumin level, total cholesterol level, NLR, and lymphocyte monocyte ratio (LMR). A score of 1 was assigned for albumin concentration <4 g/dL, total cholesterol concentration <180 mg/dL, NLR ≥2.96, and LMR <4.44, and a score of 0 was assigned for albumin concentration ≥4 g/dL, total cholesterol ≥180 mg/dL, NLR <2.96, and LMR ≥4.44. The NPS score was the sum of these 4 scores. All patients in the study were divided into 2 groups based on their NPS scores, with patients having a score of 0, 1, or 2 placed in group 1, and those with a score of 3 or 4 assigned to group 2. 17 Left ventricular ejection fraction was measured by Biplane Simpson’s method, Teichholz’s method, or visual assessment. The patients’ pre-test probability scores were calculated according to the 2019 Chronic Coronary Syndrome European Society of Cardiology (ESC) guideline. 18
CCTA Scan
The images were acquired using a 640-slice CT (Aquilion, Canon, Ōtawara, Tochigi, Japan) scanner. Patients with a heart rate of >65 beats/min before the scan were given a 50 mg metoprolol tablet. Nitroglycerin tablets or a 5 mg isosorbide dinitrate metered tongue spray were also administered before the scan. The tube voltage was 120 kV and the tube current was determined by the built-in automatic exposure control system (SureExposure System), and the images were reconstructed using Adaptive Iterative Dose Reduction (AIDR)-3D (Canon Medical, Ōtawara, Tochigi, Japan). A 50 mL nonionic contrast agent (Opaxol [Iohexol] 350 mg I/mL; Nycomed, Zürich, Switzerland) was injected via the antecubital vein at 5 mL/sec using a dual power injector (Stellent, Torrance, California, U.S.), followed by 40 mL of saline solution at 5 mL/sec. CT timing was taken using the automatic bolus tracking option (SUREStartTM, Canon, Ōtawara, Tochigi, Japan) in the descending aorta with an initial threshold of 300 HU to achieve proper coronary artery contrast enhancement.
The system automatically adjusted the best parameters based on the patient’s ECG during the breathing exercise, and in cases where it was not possible, multiple reconstructions were performed using different cardiac stages. Prospective ECG gating was used to minimize radiation doses in all patients, and a backward pass technique was used to synchronize the data reconstruction with the ECG signal. The reconstruction interval with the least motion artifact was chosen for further analysis.
CCTA Data Analysis
An experienced radiologist, blind to patient information and study design, interpreted all images. Any abnormal structure in the coronary artery wall in 2 separate image planes was defined as coronary artery plaque (CAP). The coronary system was divided into 16 segments for CAP classification according to a modified American Heart Association (AHA) classification. All coronary arteries, including the left main coronary arteries, were modeled on the AHA classification and divided into 16 segments for proximal, middle, and distal segments of the LAD, diagonal, circumflex (Cx), broad marginal branches, and right coronary arteries, using original axial views, thin section, maximum intensity projections, and cross-sectional reconstructions (.5 mm thickness). 19 All plaques were recorded according to their segments.
The Coronary Artery Disease-Reporting and Data System (CAD-RADS) score for the most critical stenosis in any coronary vessel was calculated and graded as follows: CAD-RADS 0 (no stenosis or plaque, 0%), CAD-RADS 1 (1–24% stenosis or non-stenotic plaque with positive remodeling), CAD-RADS 2 (25–49%, mild stenosis), CAD-RADS 3 (50–69%, moderate stenosis), CAD-RADS 4a (70-99%, severe stenosis in 1 or 2 vessels), CAD-RADS 4b (70-99%, severe stenosis in 3 vessels or left main 50%), and CAD-RADS 5 (total occlusion). 20 Given that categories CAD-RADS 3, 4, and 5 require further evaluation, the groups were divided into 0,1,2 and 3,4,5 based on the 2022 CAD-RADS results: Expert Opinion Outcomes. 21 The Agatston scoring method was used to calculate the amount of calcification in the coronary arteries. Lesions with a CT density of over 130 HU in a 1 mm2 balanced area in 2–3 adjacent pixels were considered calcifications. A special software program was used to calculate the Agatston score. Calcifications were marked on axial sections and detected by a radiologist. The detected coronary artery plaques (CAPs) were categorized into 4 categories: (1) None, (2) Calcified Plaque (CP)- higher CAP density compared with the contrast-enhanced lumen, (3) Noncalcified Plaque (NCP)- CAP density with a gray scale between the contrast-enhanced lumen and surrounding tissue, and (4) Mixed Plaque (MP)- both calcified and noncalcified plaque features, with calcified tissue occupying <50% of the plaque area. The software automatically measures the area and density of the lesions, and the calcium score, particularly for calcified lesions, was found by multiplying the density score by the lesion area and density. The total calcium score of the patient was calculated by summing the calcium scores of the 4 main coronary arteries. A calcium score of 0 indicates no calcific atherosclerotic plaque. Low, medium, high, and very high risk were defined as 1–10, 10–100, 100–400, and >400, respectively. In addition, the percentage values determined by age and gender were also considered, and the patient was included in the higher risk group if the calcium score was above 75%.22,23
Statistical Analysis
Numerical variables were expressed as mean ± standard deviation (SD), while categorical variables were expressed as absolute numbers and percentages (%). The primary objective of the study was to predict the severity of CAD using NPS and SII scores. The one-way ANOVA or Wilcoxon rank test and χ2 statistics were applied to assess the baseline and clinical characteristics of patients based on the <SCII 600 and ≥600 groups. A cutoff of 600 was used because a previous study 24 and our non-linear regression showed that values >600 were associated with poor prognosis.
The statistical model was developed using multivariable logistic regression. The baseline model included variables such as age, gender, chest pain, diabetes mellitus (DM), hypertension (HT), hyperlipidemia (HL), and smoking. The categorical variables Naples 3, 4 vs 0, 1, 2, and SII were then added to the baseline model. The predictive accuracy (likelihood ratio X2 and R2) and discrimination receiver operating characteristic area under the curve (ROC-AUC) of the models were evaluated. The models were compared using the likelihood ratio X2 and corresponding P-values were presented.
The association between CAD-RADS, Naples, and SII was quantified using the odds ratio (OR) and 95% confidence interval (CI). Continuous variables were included in the models using restricted cubic spline transformation with 3 knots to account for non-linear relationships between predictors and outcomes. The partial X2 value for each predictor was used to estimate the relative importance of each predictor in the models and to estimate the independent contribution of each predictor to the variance of the outcome. Decision curve analysis was used to assess the net benefit of the full score compared with the baseline score for clinical net benefit. Continuous variables missing in <5% of cases were imputed using the “areg” function of the Hmisc R package (Open source). A two-tailed P < .05 was considered statistically significant. All statistical analyses were performed using the “rms,” “proc,” and “rmda” packages in R studio version 4.2 (R Project, Vienna, Austria).
Results
Baseline Demographic Clinic Characteristics Comparison According to Group 1(SII <600) and Group 2 (SII ≥600).
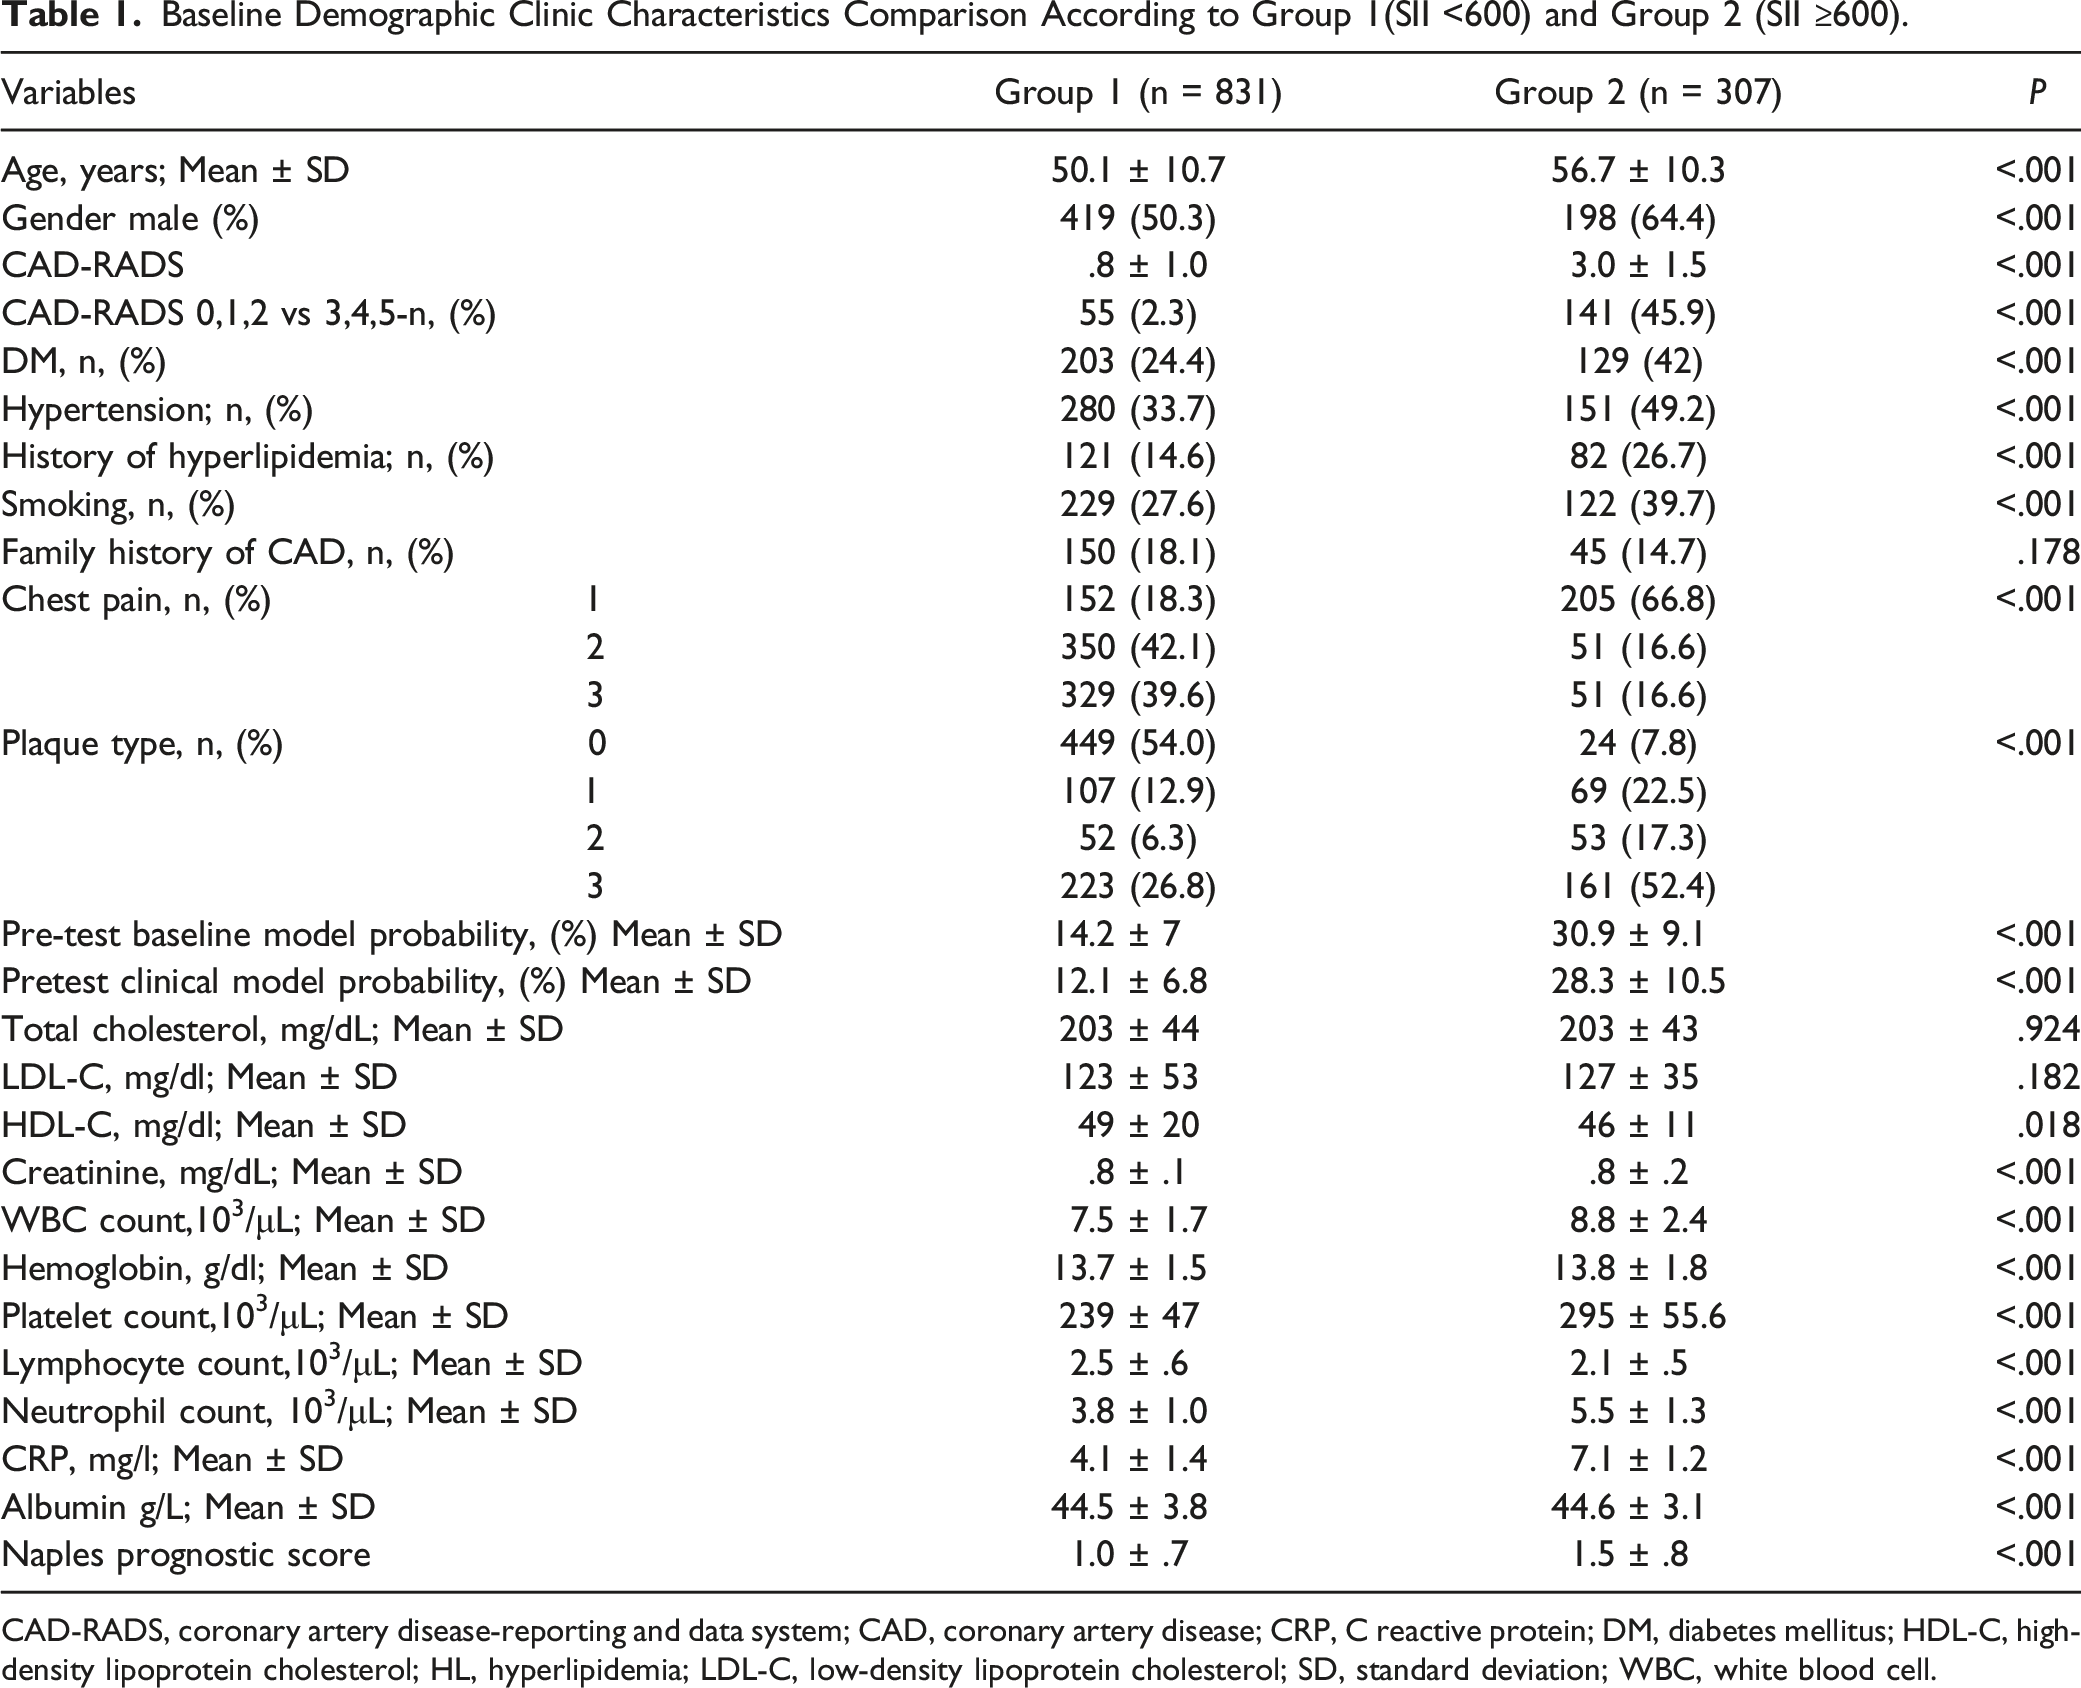
CAD-RADS, coronary artery disease-reporting and data system; CAD, coronary artery disease; CRP, C reactive protein; DM, diabetes mellitus; HDL-C, high-density lipoprotein cholesterol; HL, hyperlipidemia; LDL-C, low-density lipoprotein cholesterol; SD, standard deviation; WBC, white blood cell.
Multivariable Logistic Regression for CAD-RADS 3-4-5 Development Probability According to Baseline SII and Naples Score.
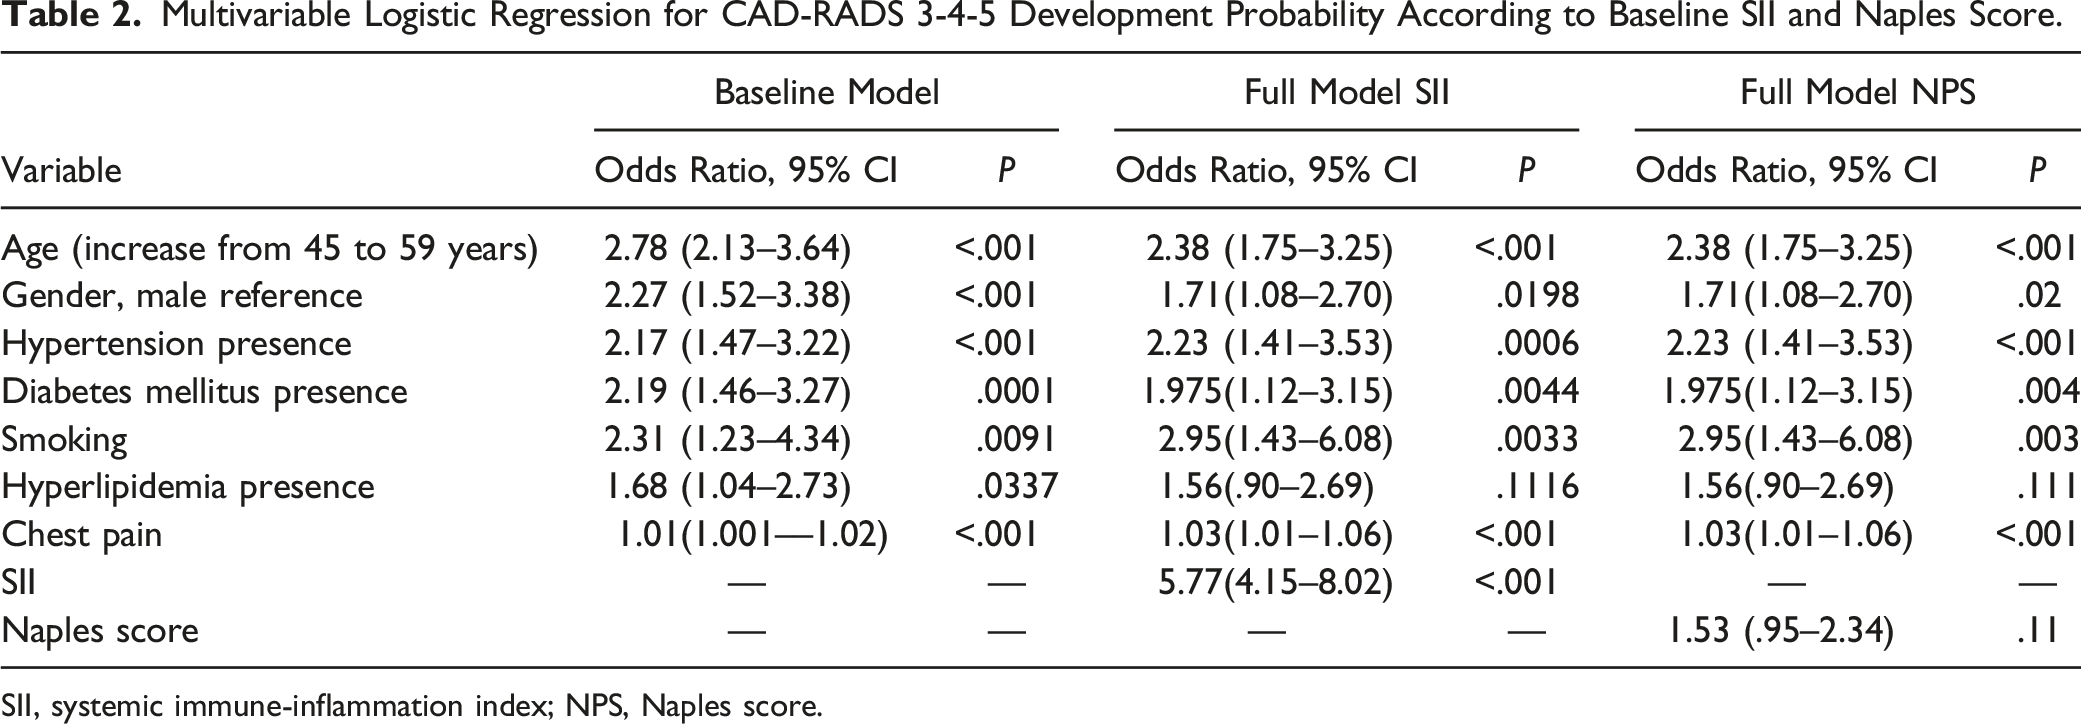
SII, systemic immune-inflammation index; NPS, Naples score.
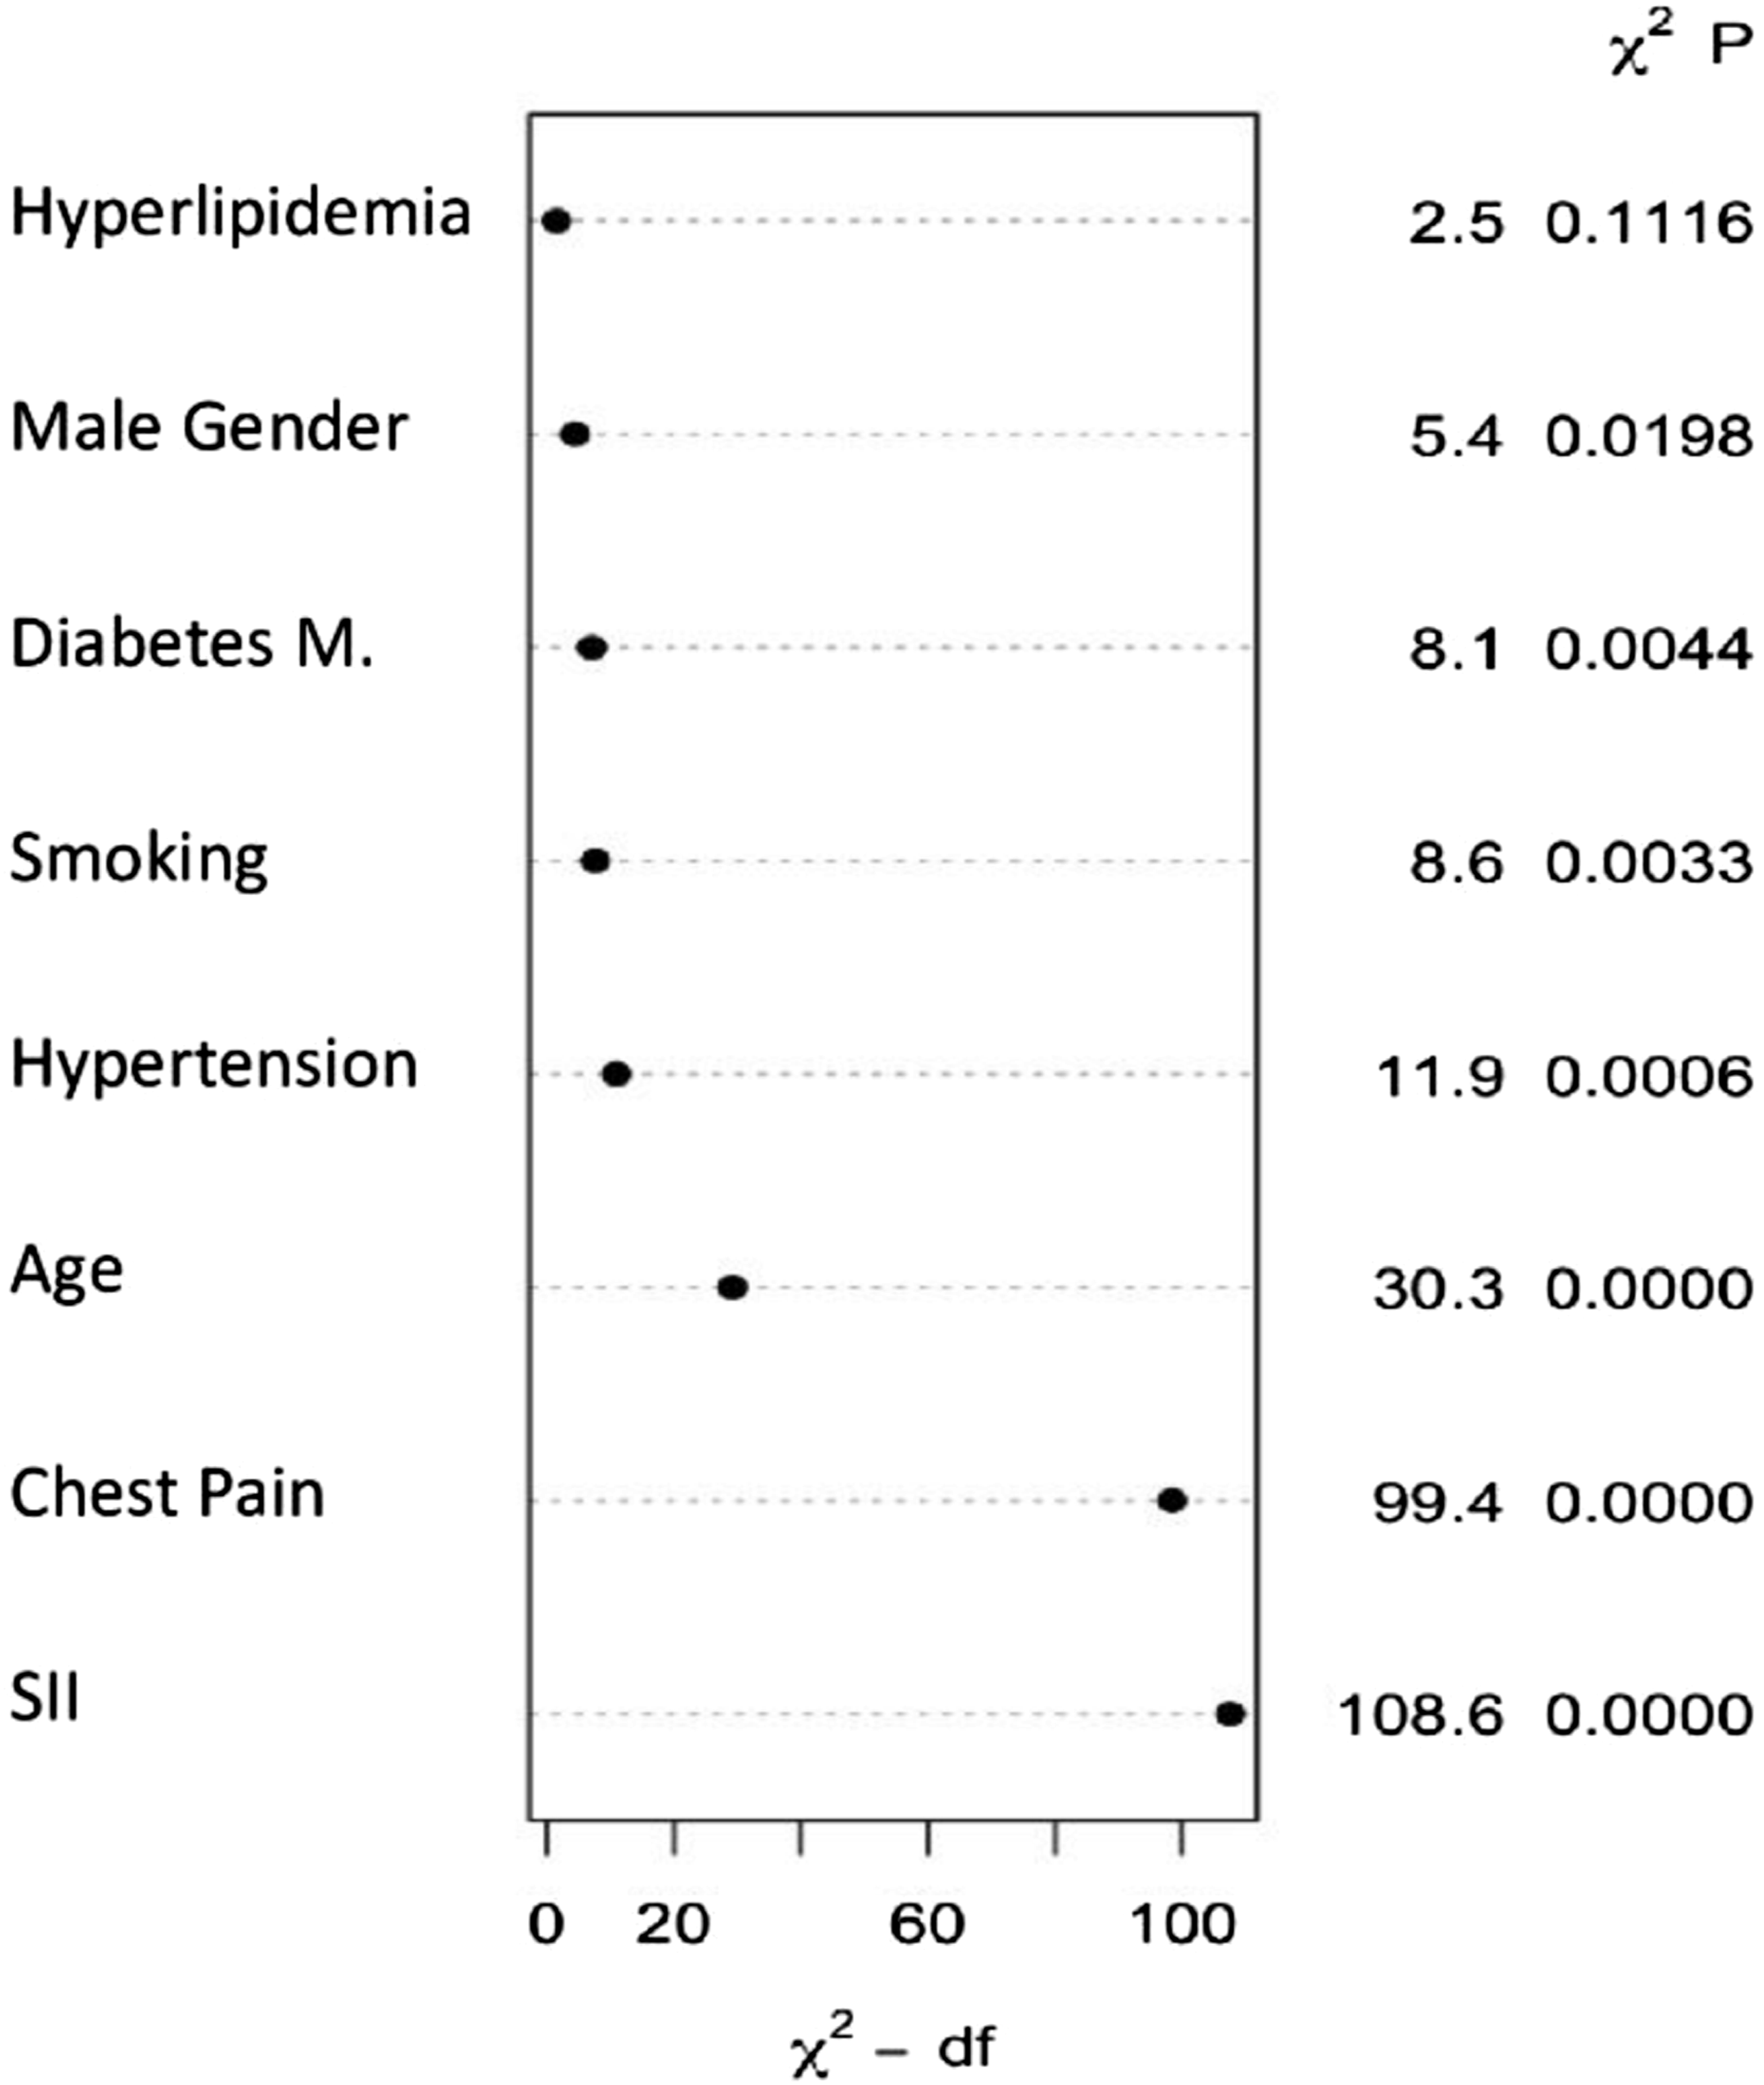
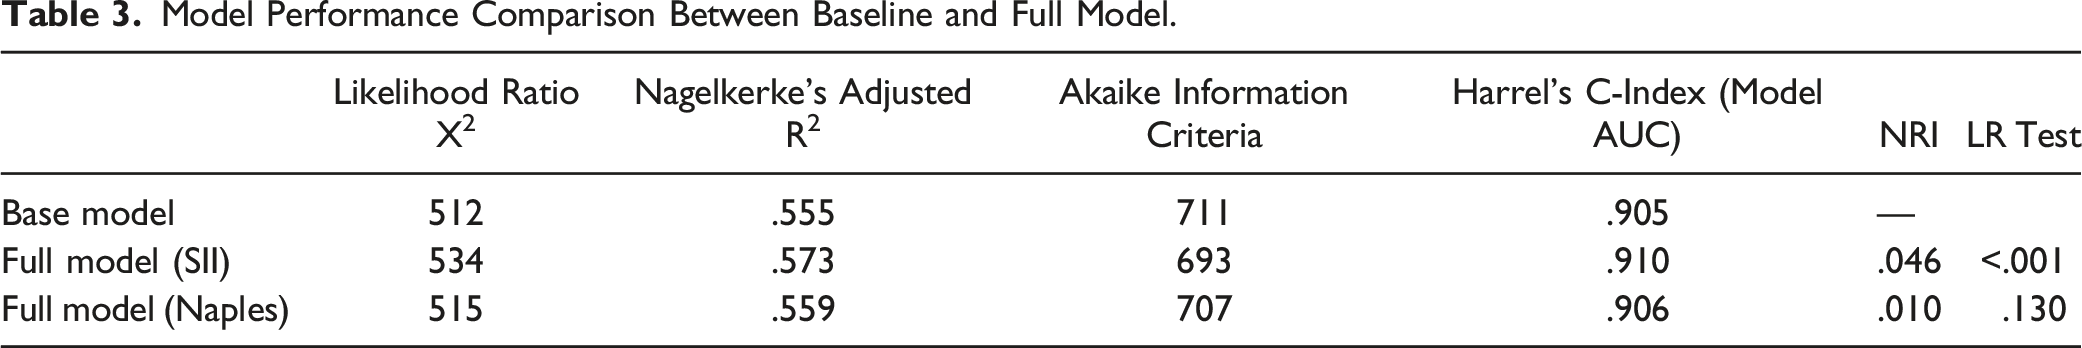
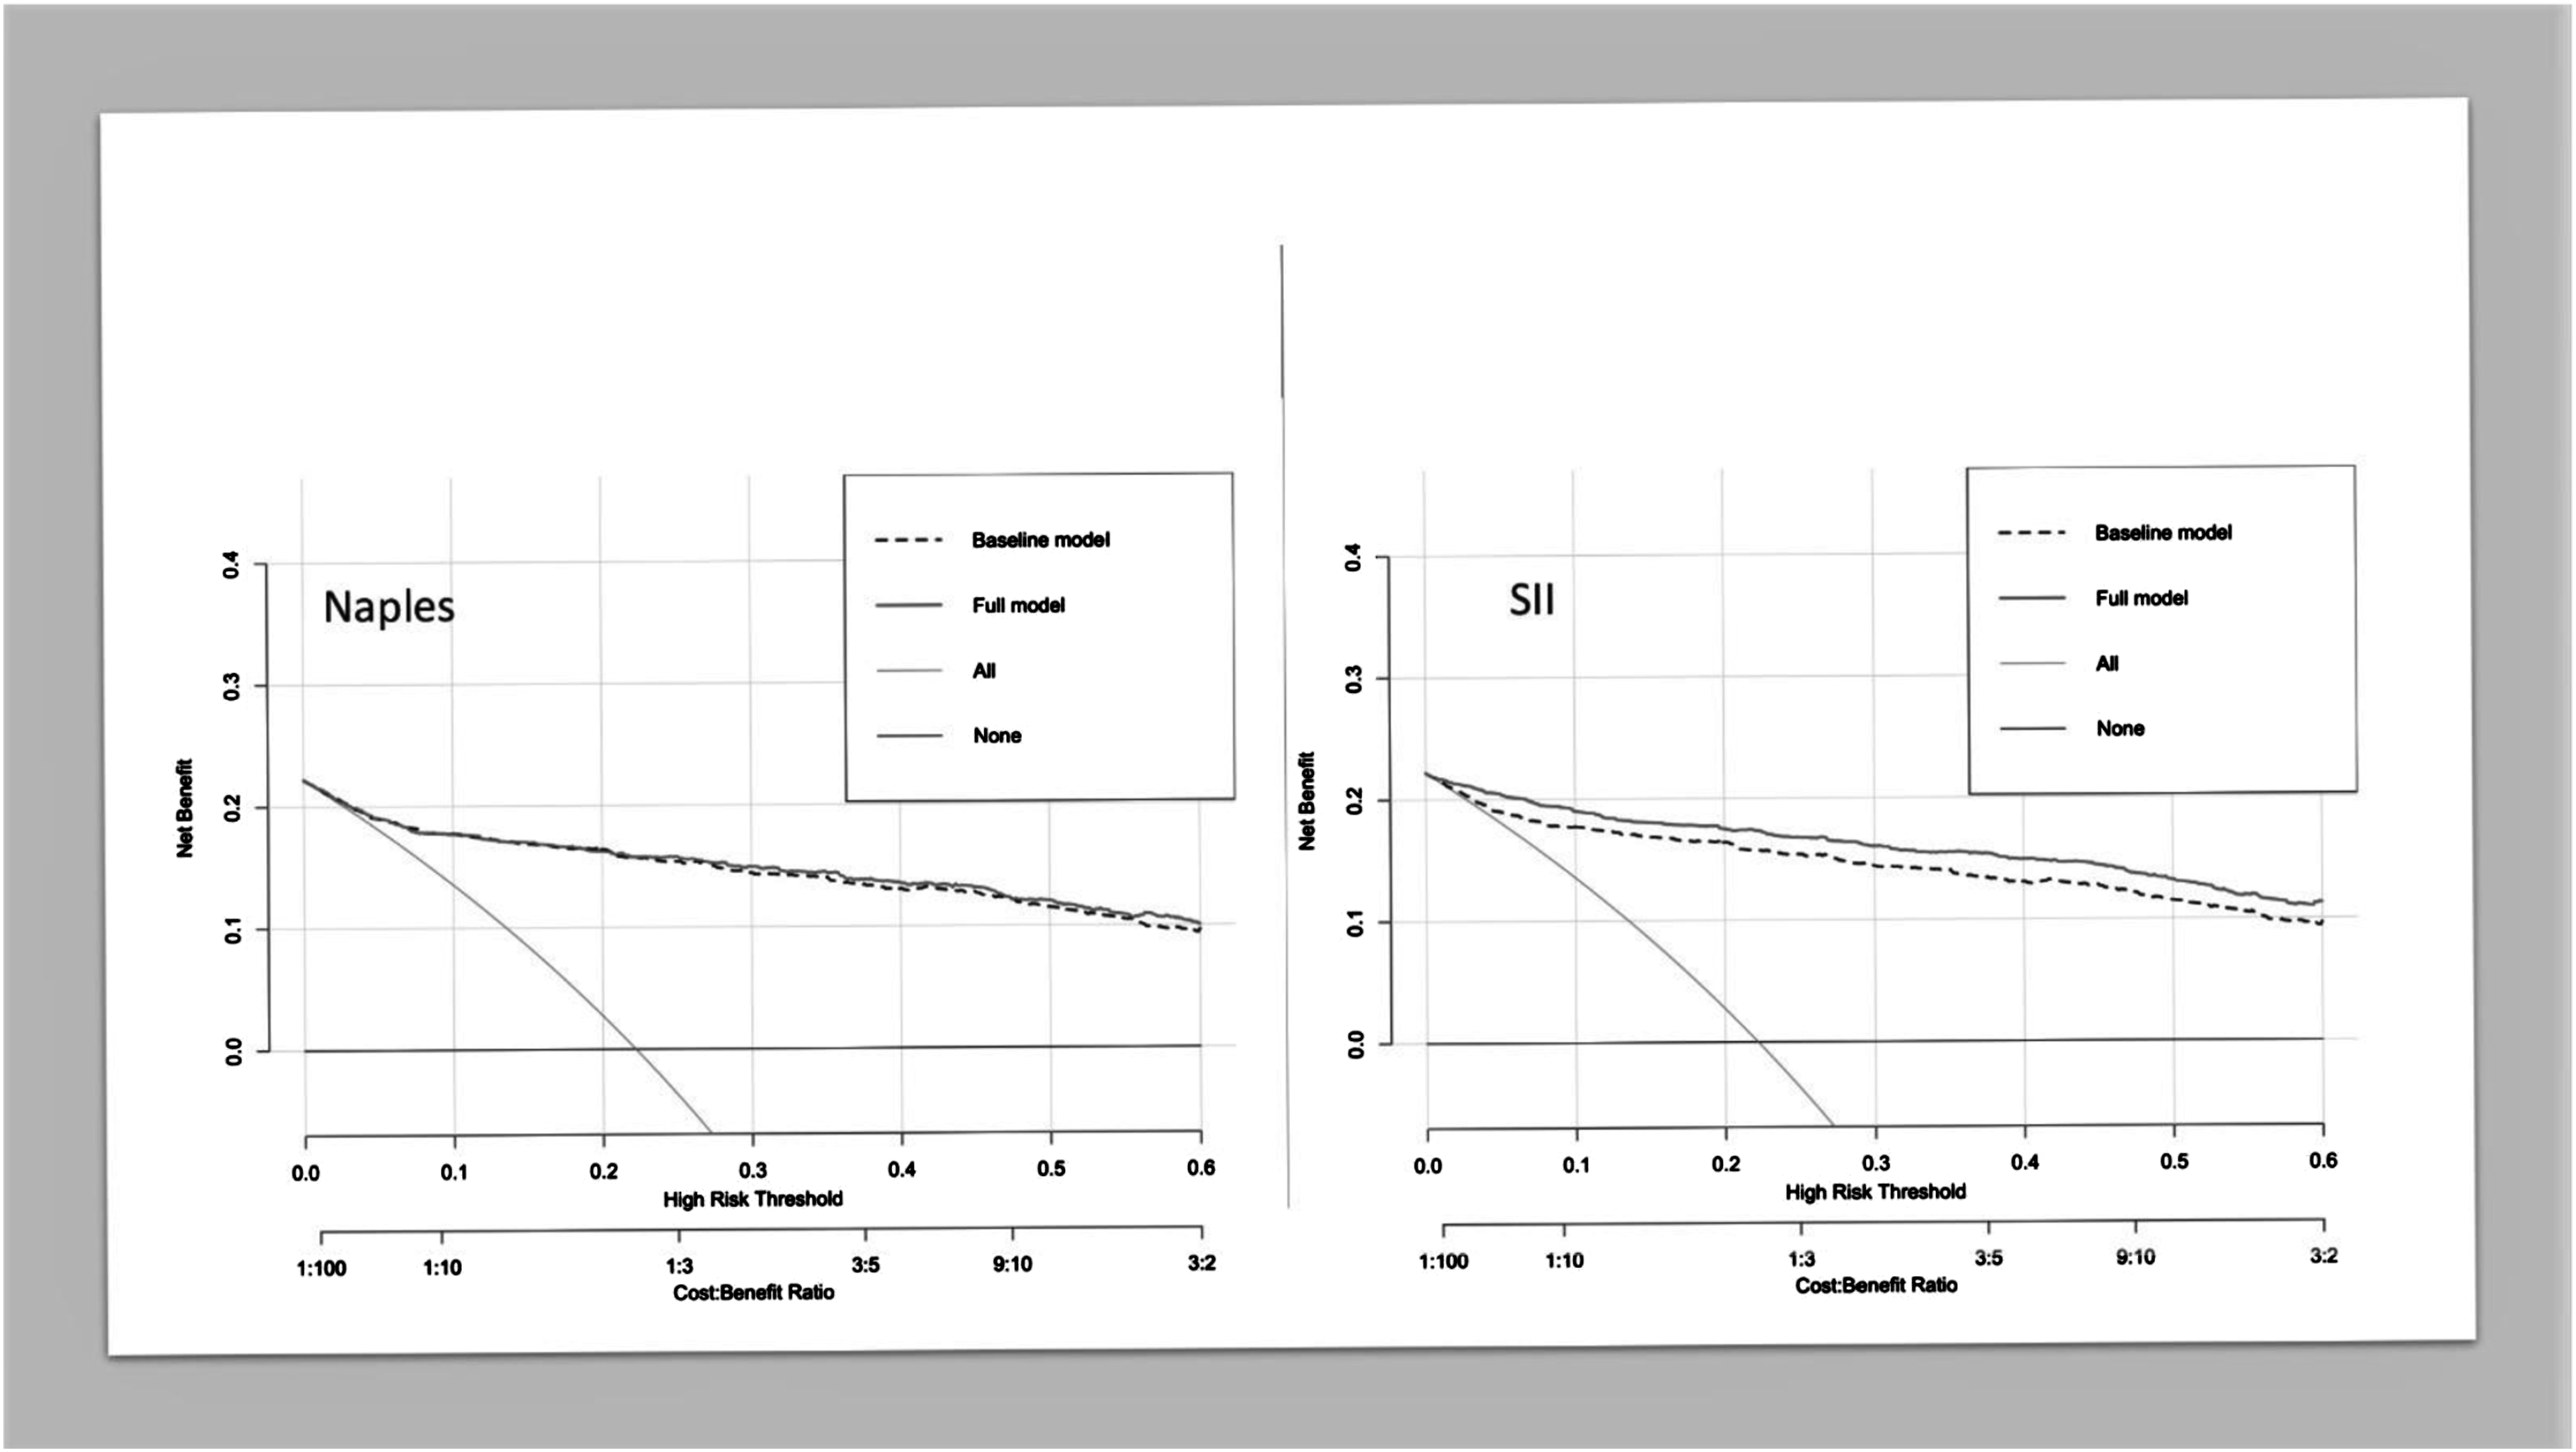
The probability of CAD-RADS score increased steeply until the SII value reached 600, after which the increase continued at a slower pace (Figure 1). The relative importance of individual variables in the model was determined based on their partial X2 value, with the SII value being the most important predictor, surpassing gender, age, DM, HL, smoking, and chest pain, which were important predictors for the severity of CAD (Figure 2). The performance of the SII full model and the baseline models was analyzed (Table 3), and the model with the best predictive performance (LRX2 and R2) and discrimination (ROC-AUC) was the model that included SII as a continuous variable (Figure 3). The C-index of the base and full models that included SII continuous scores was significantly higher than that of the base model (P < .001) (Table 3). The net reclassification of the SII model was .046 (P < .001), and the likelihood ratio test showed a difference between the base and SII models (P < .001). The decision curve analysis also indicated that the full SII model had a wider range of probability of clinical net benefit than the baseline model, while the NPS model did not outperform the base model (Figure 4). Spline knots plot of the relationship between SII value and coronary artery disease severity. Log-odds of CAD-RADS 3-4-5 presences were sharply increasing until 600 SII value, after that it slightly increased. Coronary Artery Disease-Reporting and Data System (CAD-RADS), Systemic Immune-Inflammation Index (SII). Relative importance of each factor in regression analysis. Systemic Immune-Inflammation Index (SII). Model Performance Comparison Between Baseline and Full Model. AUC-ROC comparison of base and full model. Receiver Operating Characteristic Area Under the Curve (ROC-AUC). The net benefit comparison by decision curve analysis, full model Naples and SII. Footnote: the SII full model outperformed the Naples score full model according to net benefit. Systemic Immune-Inflammation Index (SII).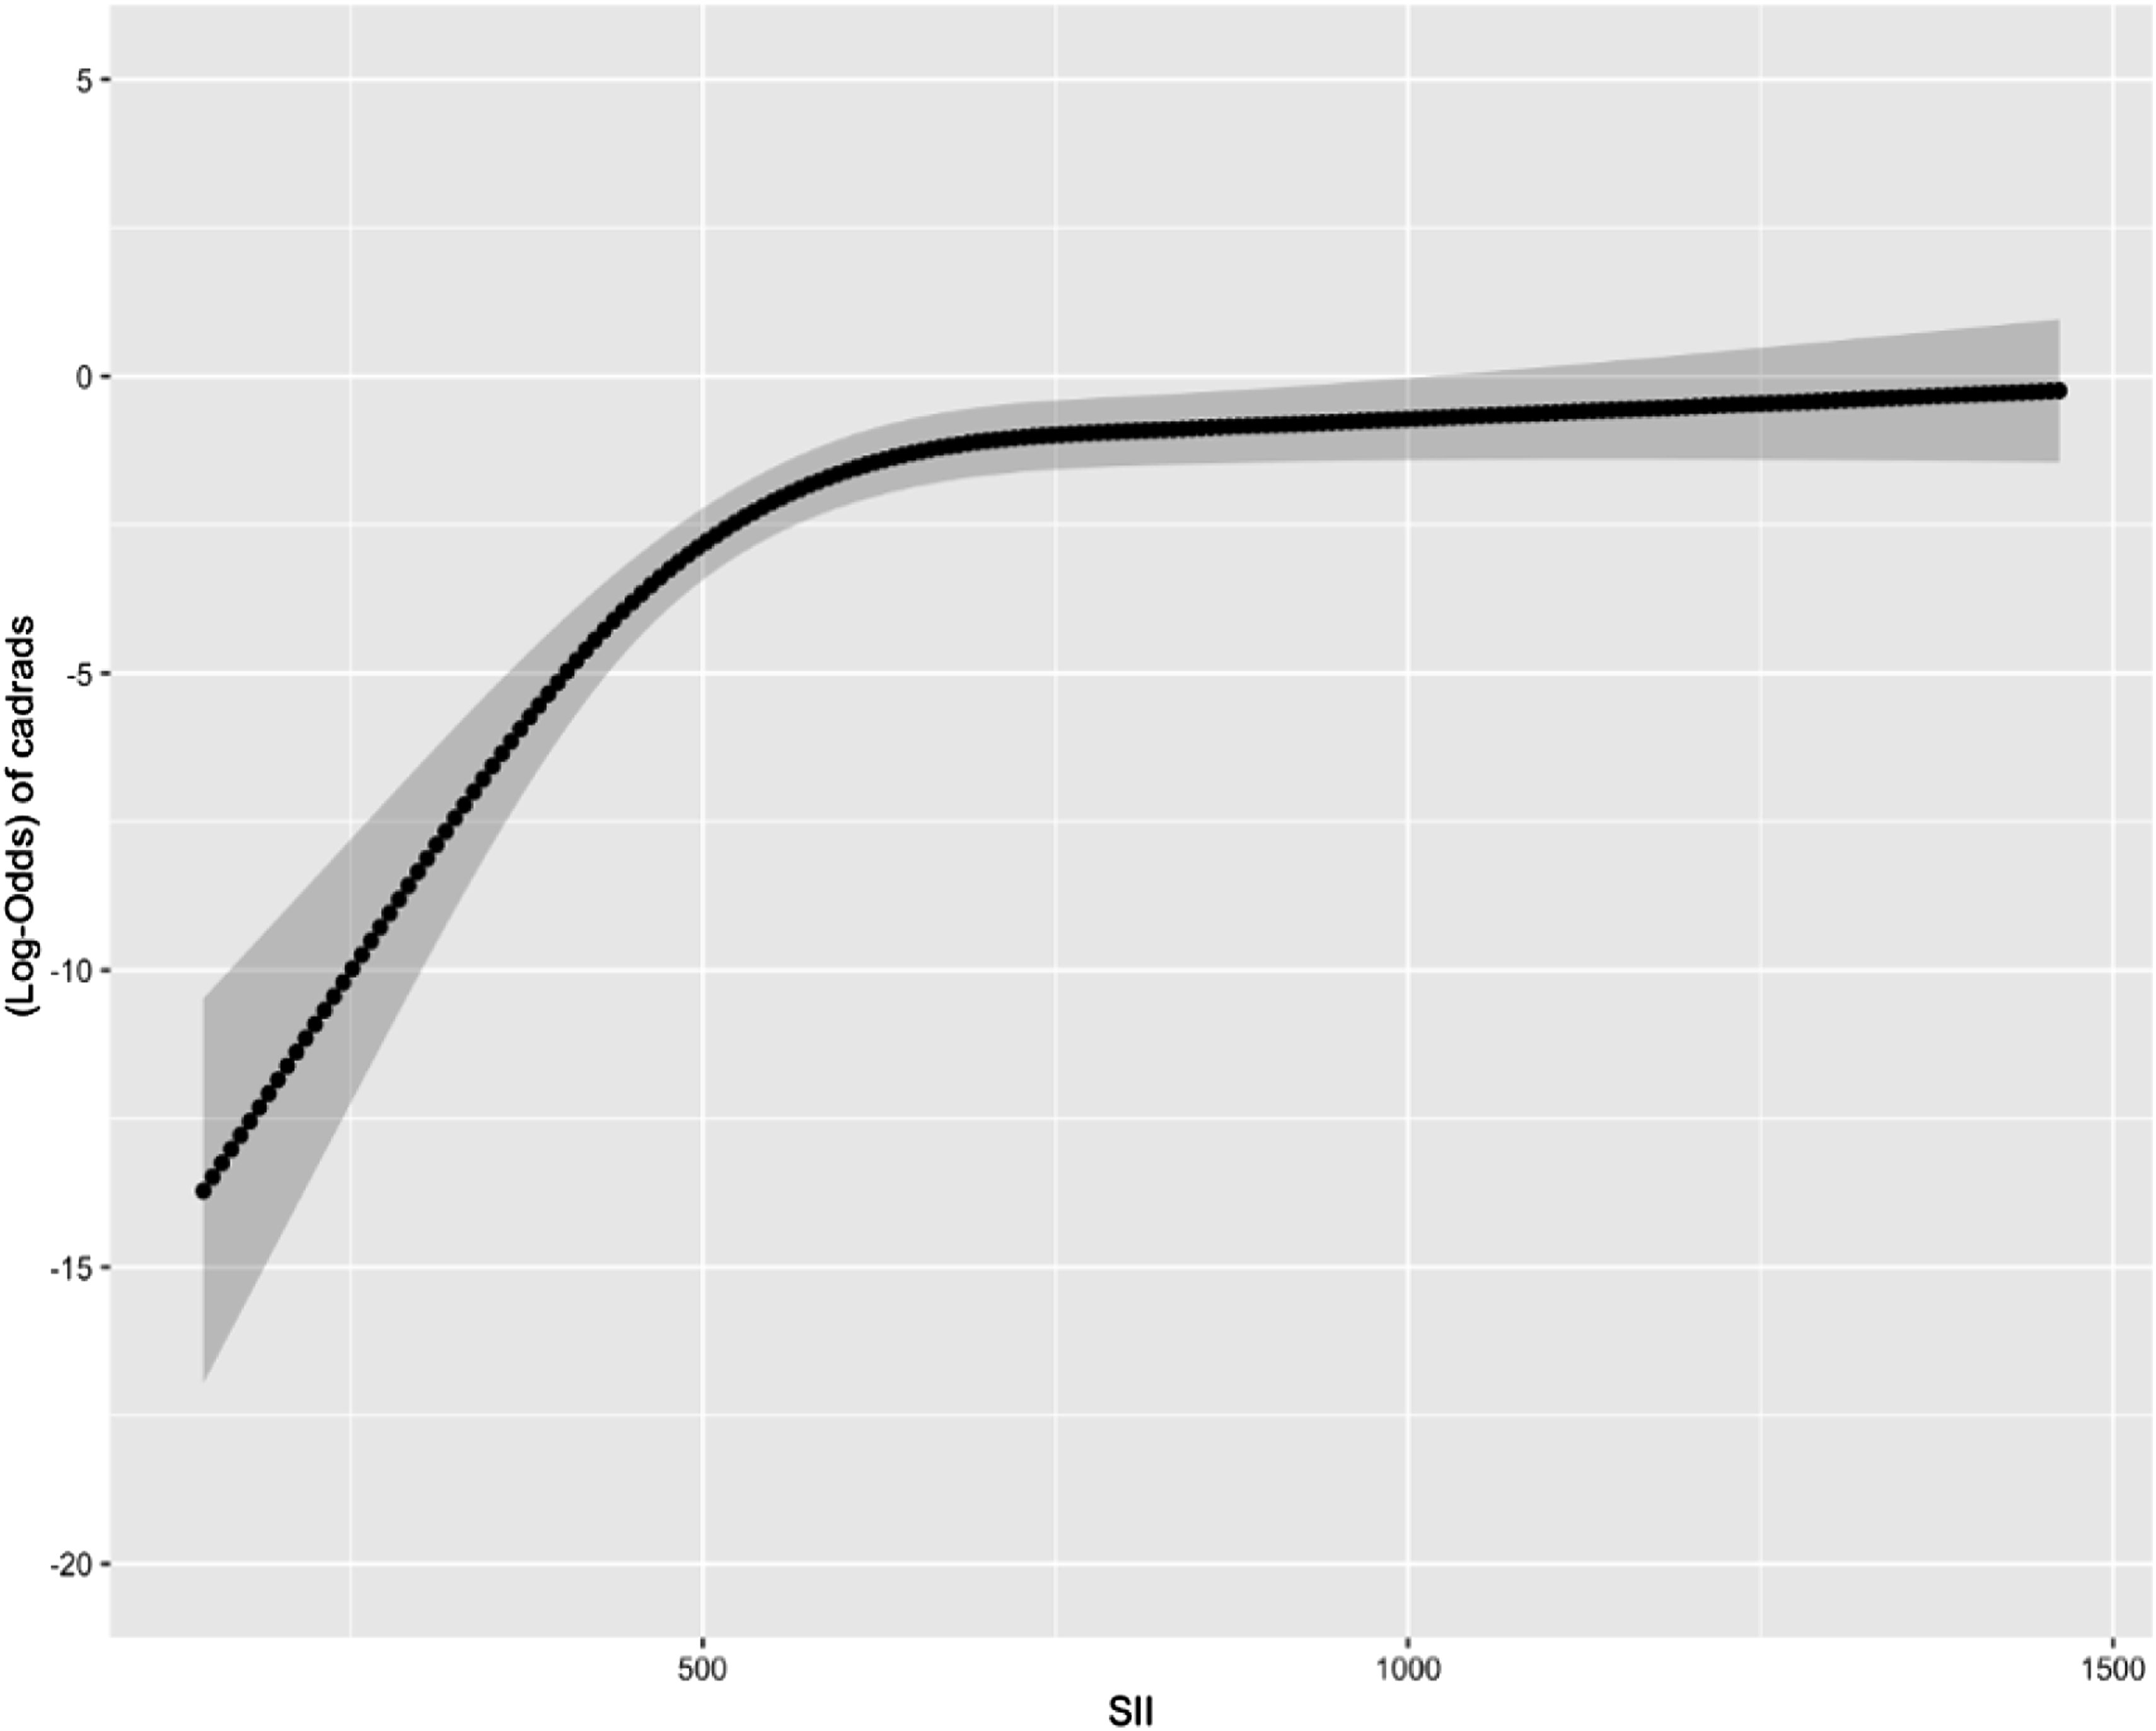
Discussion
The present study found a strong predictive effect of SII in addition to traditional CAD risk factors such as DM, HT, HL, and age. Our study is the first, to the best of our knowledge, to compare the predictive power of SII and NPS using decision curve analysis on CAD severity in patients undergoing CCTA.
Severe inflammation caused by infections can increase the risk of CAD due to unstable atherosclerotic plaques and microvascular dysfunction. 25 Inflammatory cells such as neutrophils, leukocytes, and monocytes play important roles in various steps of atherosclerotic plaque formation. 9 When arterial endothelium is exposed to bacterial products or proinflammatory cytokines, expression of adhesion molecules increases, promoting the adhesion of blood leukocytes to the arterial wall. Activated leukocytes and endothelial cells collaborate in cell proliferation, differentiation, apoptosis, and the formation of the lipid-rich “necrotic” core of the plaque. 26
Platelets reflect both prothrombotic potential and plaque composition due to their interaction with the vascular wall and plaque. Genomic examination has tried to obtain information about plaque sensitivity by examining the mRNA level of platelets in plaques. 27 Platelets have been found to play a role in the development of CAD. 28 Platelet activation has also been observed to actively contribute to plaque formation, and chemokines such as platelet factor 4–5 are present in plaque content.29,30 There is an inverse correlation between platelet and albumin levels. It has been shown that an increase in albumin levels reduces platelet reactivity and prevents thrombosis. 31
Many studies have demonstrated the use of inflammatory cells in the diagnosis, assessment, and prognosis of CV diseases and their underlying pathophysiology. 32 NLR has been linked to critical stenosis, disease extent, and plaque morphology in CAD, 33 and is also a predictor of poor prognosis in CAD and heart failure. 34 High mean platelet volume values have been associated with high Gensini and Syntax scores, which indicate the severity and complexity of CAD. 35 SII, which includes key inflammatory cells such as neutrophils, lymphocytes, and platelets, has been shown to have a stronger predictive effect compared to individual components.36,37 SII has been established as a powerful marker for predicting prognosis and survival in patients with inflammatory diseases and malignancies.38-40 It has been linked to pathologies that may result in serious cardiac adverse events such as an ectatic coronary artery, slow flow phenomenon, and microvascular dysfunction.41-43 Recent studies have found that SII is a reliable predictor of the severity of CAD and poor long-term prognosis in patients with acute coronary syndrome.9-44 It is also an independent predictor of hospitalization, non-fatal MI, ischemic stroke, and death in CV diseases. 45 While the NPS has a strong predictive effect on the severity and prognosis of cancer patients, 17 it was not significantly associated with chronic coronary syndrome in this study. Although the NPS includes inflammatory parameters, like the systemic inflammatory index, the presence of other parameters that affect albumin and total cholesterol levels may have prevented a significant correlation with chronic coronary syndrome. Nutritional status, liver function, and body fluid balance significantly impact albumin levels, 46 and total cholesterol levels are also affected by short-term eating habits. Not using the LDL-C value, which is considered the main risk factor for atherosclerosis, may have reduced the predictive power of the NPS. 47
At the same time, while studies suggest that the SII index can be used to evaluate the severity of CAD, these studies involve patients who underwent traditional coronary angiography and had a high pre-test probability of CAD.25-48 Determining CAD in intermediate-risk patients and predicting its severity remain significant challenges. Although CCTA is widely used, its cost, risk of contrast nephropathy, radiation exposure, and patient-dependent imaging quality limit its usage. 49 Our study demonstrated the benefit of the SII index, which is an easily calculated and low-cost parameter in addition to traditional risk factors.
Our study has several limitations, including being a single-center study with a retrospective design that hinders generalization to the wider population. NPS is a novel marker that has not been investigated in sufficient studies in cardiac diseases. Conventional angiography is still considered the gold standard for assessing CAD severity, and the fact that severe lesions evaluated with CCTA cannot be confirmed by conventional angiography is another limitation. Additionally, the lack of long-term results limits our ability to obtain information about prognosis and make comparisons.
In conclusion, SII may provide additional information to predict the severity of CAD in intermediate-risk patients.
Footnotes
Author Contribution
All authors contributed to substantial contributions to conception and design. Acquisition of data, analysis and interpretation of data were performed by [OE], [EA], and [KA]. The first draft of the manuscript was written by [OE]. The previous of manuscript was revised for important intellectual content by [OE], [KA], and [THI]. All authors read and approved the published version.
Declaration of Conflicting Interests
The author(s) declared the following potential conflicts of interest with respect to the research, authorship, and/or publication of this article: The authors report no conflicts of interest. The authors alone are responsible for the content and writing of paper.
Funding
The author(s) received no financial support for the research, authorship, and/or publication of this article.
Ethics Approval
The study was approved by the Basaksehir Cam and Sakura City Hospital Ethics Committee.