
Abstract
Background
Predicting trauma center need is imprecise with current population-based models. Population activity level may help to estimate trauma demand. We compared daily trauma admissions (TA) and population-level cellular mobility patterns during large fluctuations caused by the COVID-19 pandemic.
Methods
TA from all level I trauma centers in one state (January 2020 to August 2021) were aggregated and compared to the Device Exposure Index (DEX), a standardized measure of daily cellular device interactions per county. Mean, standard deviation and range for daily DEX and TA were calculated. Spearman’s rank correlation was calculated, followed by regression adjusted for autocorrelation and seasonality. Chi-square test assessed associations between categorized DEX and categorized TA. A 7-day moving average was utilized to smooth values.
Results
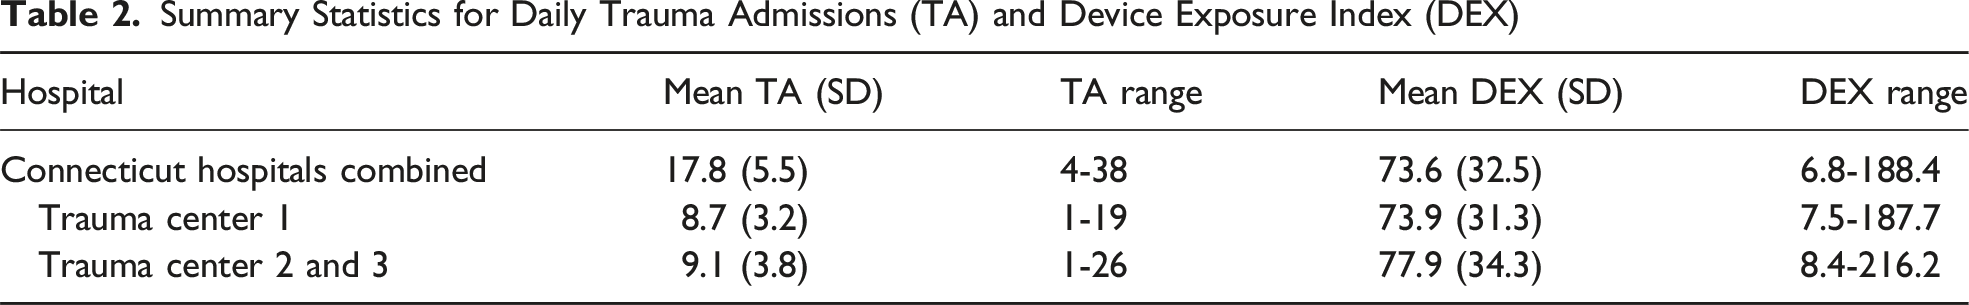
The combined average TA was 17.8 per day (SD 5.5, range 4-38). Mean DEX was 73.6 (SD 32.5, range 6.8-188.4). Both measures declined sharply following pandemic lockdowns and demonstrated parallel trends across centers. TA and DEX were correlated (Spearman’s rho = 0.2, P < .001). In regression, DEX remained significantly associated with TA (P < .05). In Chi-square analysis, nearly half (48.2%) of low DEX days (DEX <70) were also low TA days (<17), whereas just over one-third (37.2%) of high DEX days (DEX ≥ 70) were low TA days (P = .008).
Discussion
Changes in TA at the onset of the COVID-19 pandemic corresponded with DEX patterns, suggesting DEX may serve as an additional tool to inform trauma system planning, especially during periods of rapid behavioral change. Daily DEX may also provide short-term insight into fluctuations in TA.
• Trauma admissions correlated with device exposure index during COVID-19. • This relationship was also shown in chi-square analyses and regression models. • Overall, cell phone activity data holds promise for predicting trauma admissions.Key Takeaways
Introduction
Trauma centers are designated based on state regulations, with many states requiring verification by the American College of Surgeons or a state specific organization. A significant body of literature has focused on trauma system planning, which aims to optimize trauma center placement to reduce morbidity and mortality while minimizing costs.1,2 This planning has focused on population characteristics, transport times, stakeholder support, and the distribution of trauma centers by level and patient volume. The American College of Surgeons recently developed the Needs-Based Assessment of Trauma Systems (NBATS) which combines these elements to estimate the necessary distribution of trauma centers. 3 When information on injured patients is unavailable or difficult to compile, alternative population-level predictors of injuries may be helpful.
The onset of the COVID
The pandemic also led to significant shifts in population mobility, activity, and interactions. These changes in population activity have been objectively measured and developed into a database that, in a de-identified fashion, is a publicly available repository of nationwide smartphone activity. 7 This database documents the home location of the device, county to county travel of the devices, and most importantly, the number of times devices co-locate as a potential marker of viral spread. Simultaneously, multiple studies have documented changes in the volume of traumatically injured patients, most specifically, increased rates of penetrating trauma. Most of these studies have been single center or several centers within a city.8,9 Under ordinary conditions, correlations between mobility and trauma volume may be difficult to detect, particularly when data from lower-level or non-trauma centers are unavailable. However, the dramatic fluctuations in activity and trauma volumes during the pandemic may have amplified these correlations, allowing detections even with incomplete regional trauma data.
During the pandemic, trauma surgeons were frequently redeployed to address surges in critically ill COVID-19 patients, forcing hospitals to adapt rapidly to shifting clinical demands. Limited ability to predict trauma volume hindered efficient resource allocation. Similar challenges may arise during future public health emergencies, underscoring the need for tools that can anticipate changes in trauma volume. Real-time measures of population mobility and interaction may provide such predictive capability.
We predicted that changes in smartphone mobility and interactions over the period of the COVID-19 pandemic would be correlated with changes in the volume of both blunt and penetrating traumatic injury presenting to level I trauma centers in a single state. Should these data demonstrate evidence of correlation in this proof of concept study, the potential would exist to use these data to supplement trauma system planning, and possibly for future real-time trauma center preparedness.
Methods
Trauma Data Acquisition
This study was deemed exempt by each center’s Institutional Review Board and a waiver of informed consent was granted. We obtained data from the trauma registries of American College of Surgeons (ACS) verified level I trauma centers in a single state. As required by ACS verification, trauma centers maintain registries including patient demographics, injury mechanism, severity, complications, and outcomes. Three trauma centers were identified. Two of those trauma centers are in the same county and were therefore combined for analysis purposes. This left us with two regional trauma locales for the study. We collected data for the period covering January 2020 through August 2021. Each center queried its registry for patients meeting national trauma database inclusion criteria. Each center provided de-identified demographic data including age, sex, location of injury, date of injury, mechanism of injury, injury severity score, length of stay, and discharge disposition to the lead site which was then combined. The STROBE guideline was used to ensure proper reporting of methods, results, and discussion (Supplemental Digital Content Table 1).
Cell-Phone Data Acquisition
Due to privacy concerns and the proprietary nature of cellular (cell) phone tracking, individual phone tracking occurs but is used by the cell phone service provider for their own business uses or for sale to other corporations. PlaceIQ purchases and curates these data, which are based on location and movement information collected through smartphone applications that request access to users’ location services. These data are used primarily for business forecasting and marketing. For typical use, businesses purchase these data to track individual visits to their locations. For the purposes of potentially identifying geographic areas at risk for viral outbreaks during the pandemic, researchers from several business schools collaborated with PlaceIQ to create a publicly available dataset that establishes the home location for a smartphone and then reports smartphone travel across county borders (LEX) and simultaneous co-location of smartphones at all places of business (DEX) within a county. 7 These data are provided as a two-part database, the location index (LEX) and the device exposure index (DEX) that provide count data for each of the above measures at the county level. Specifically, the DEX is derived from aggregated GPS location data, collected via third-party smartphone applications that generate location “pings” when users interact with these apps. These location pings have high spatial precision, generally within meters, and are recorded when smartphones remain within or immediately adjacent to defined geographic polygons corresponding to commercial establishments (eg, restaurants and stores). Visits used to compute DEX must exceed a predefined threshold for attribution confidence, ensuring that only meaningful presences—rather than transient events, such as simply driving past a location—are captured. Thus, DEX measures concurrent co-location (overlapping visits) of individuals within specific venues, rather than broader geographic mobility or travel between locations. To approximate population movement and interactions, DEX data for the state of interest were obtained and analyzed in conjunction with trauma data.
Data Analysis
We used the trauma data to examine the changes that occurred within the first year of the COVID pandemic. We compared changes in level I trauma center patient volume, over the time frame of January 2020 through August 2021 and correlated these changes with smartphone activity interactions as a function of population density. Spearman’s rank correlation was calculated between daily trauma admissions (TA) and DEX. A linear regression model was built for TA and DEX, adjusting for seasonality and differences between weekdays and weekends. Chi-square test was used to test the relationship between a categorized DEX and categorized TA. For chi-square analysis, daily trauma volume was classified into low and high categories using a cutoff of 17 admissions per calendar day, which is close to the mean value of 17.8. Similarly, DEX values were categorized using a threshold of 70 overlapping device visits per day as it was a round number close to the overall DEX average of 73.6 overlapping device visits per day. “Overlapping device visits per day” refers to the number of distinct smartphones simultaneously detected at the same venue within a given day, indicating concurrent physical presence. A higher number of overlapping visits suggests increased social interactions and population density at those venues, while fewer overlapping visits indicate reduced interpersonal contact or activity. Data were smoothened with a 7-day moving average and displayed in line plots. All analyses were performed using Stata (Version 17, StataCorp LLC, College Station, TX).
Results
Patient Characteristics
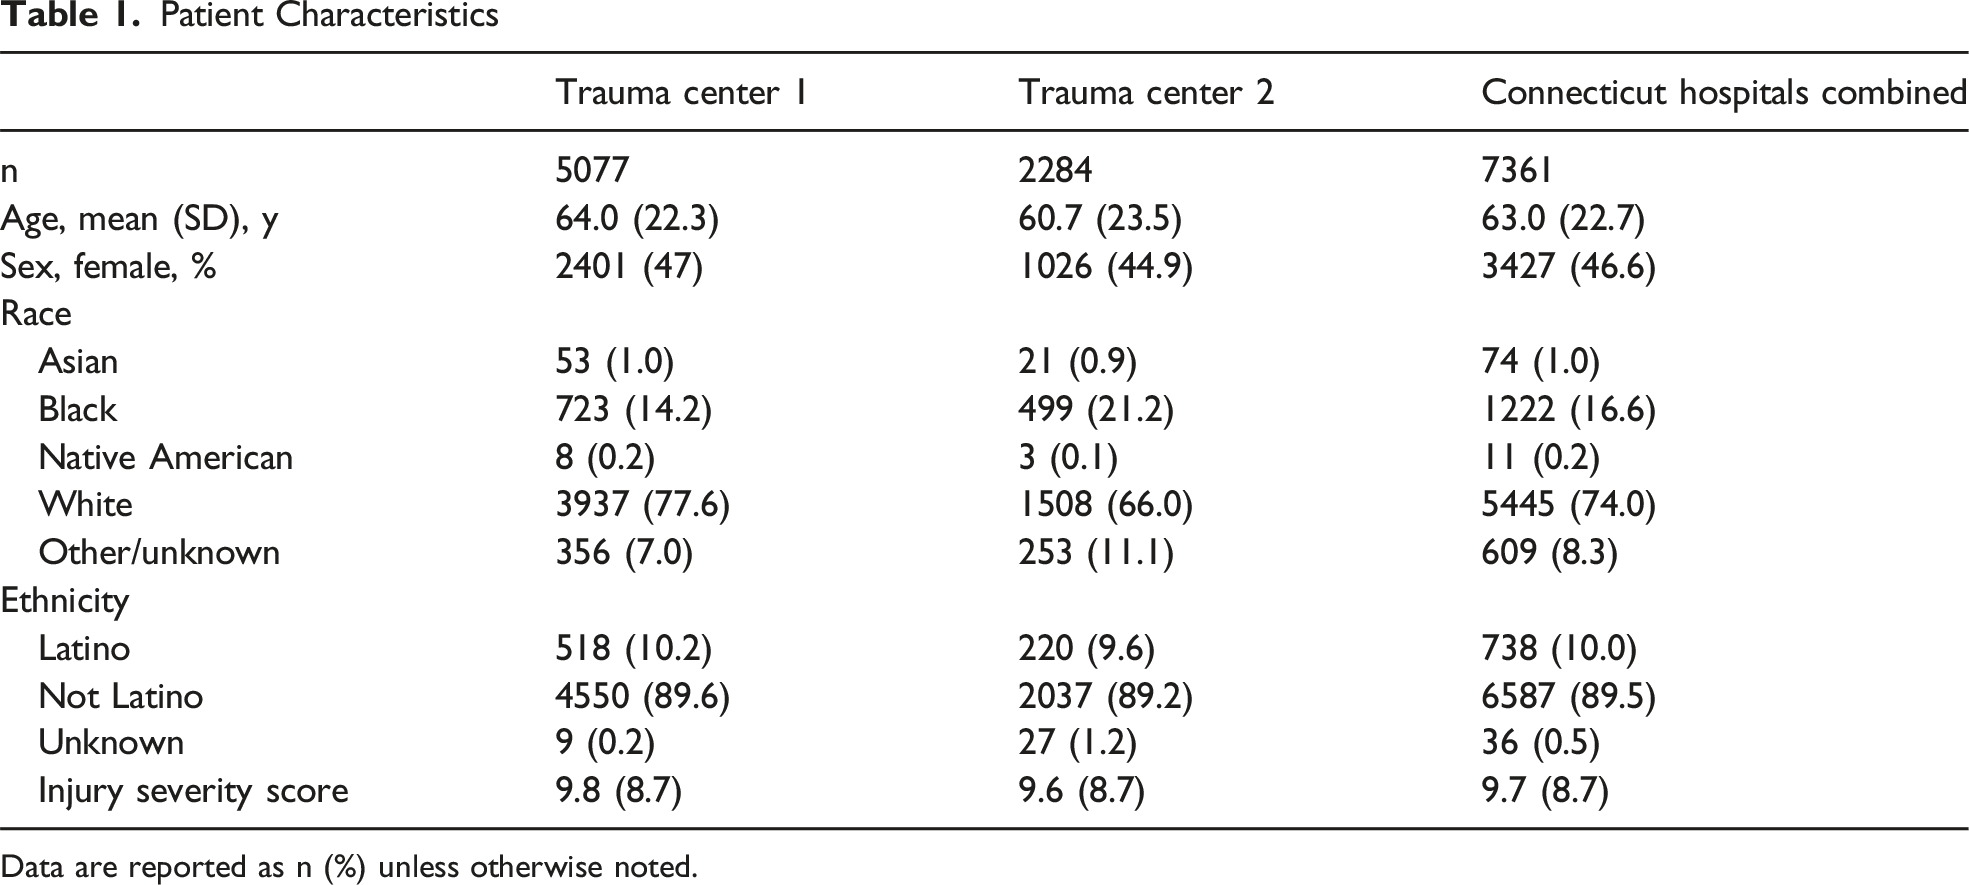
Data are reported as n (%) unless otherwise noted.
Summary Statistics for Daily Trauma Admissions (TA) and Device Exposure Index (DEX)
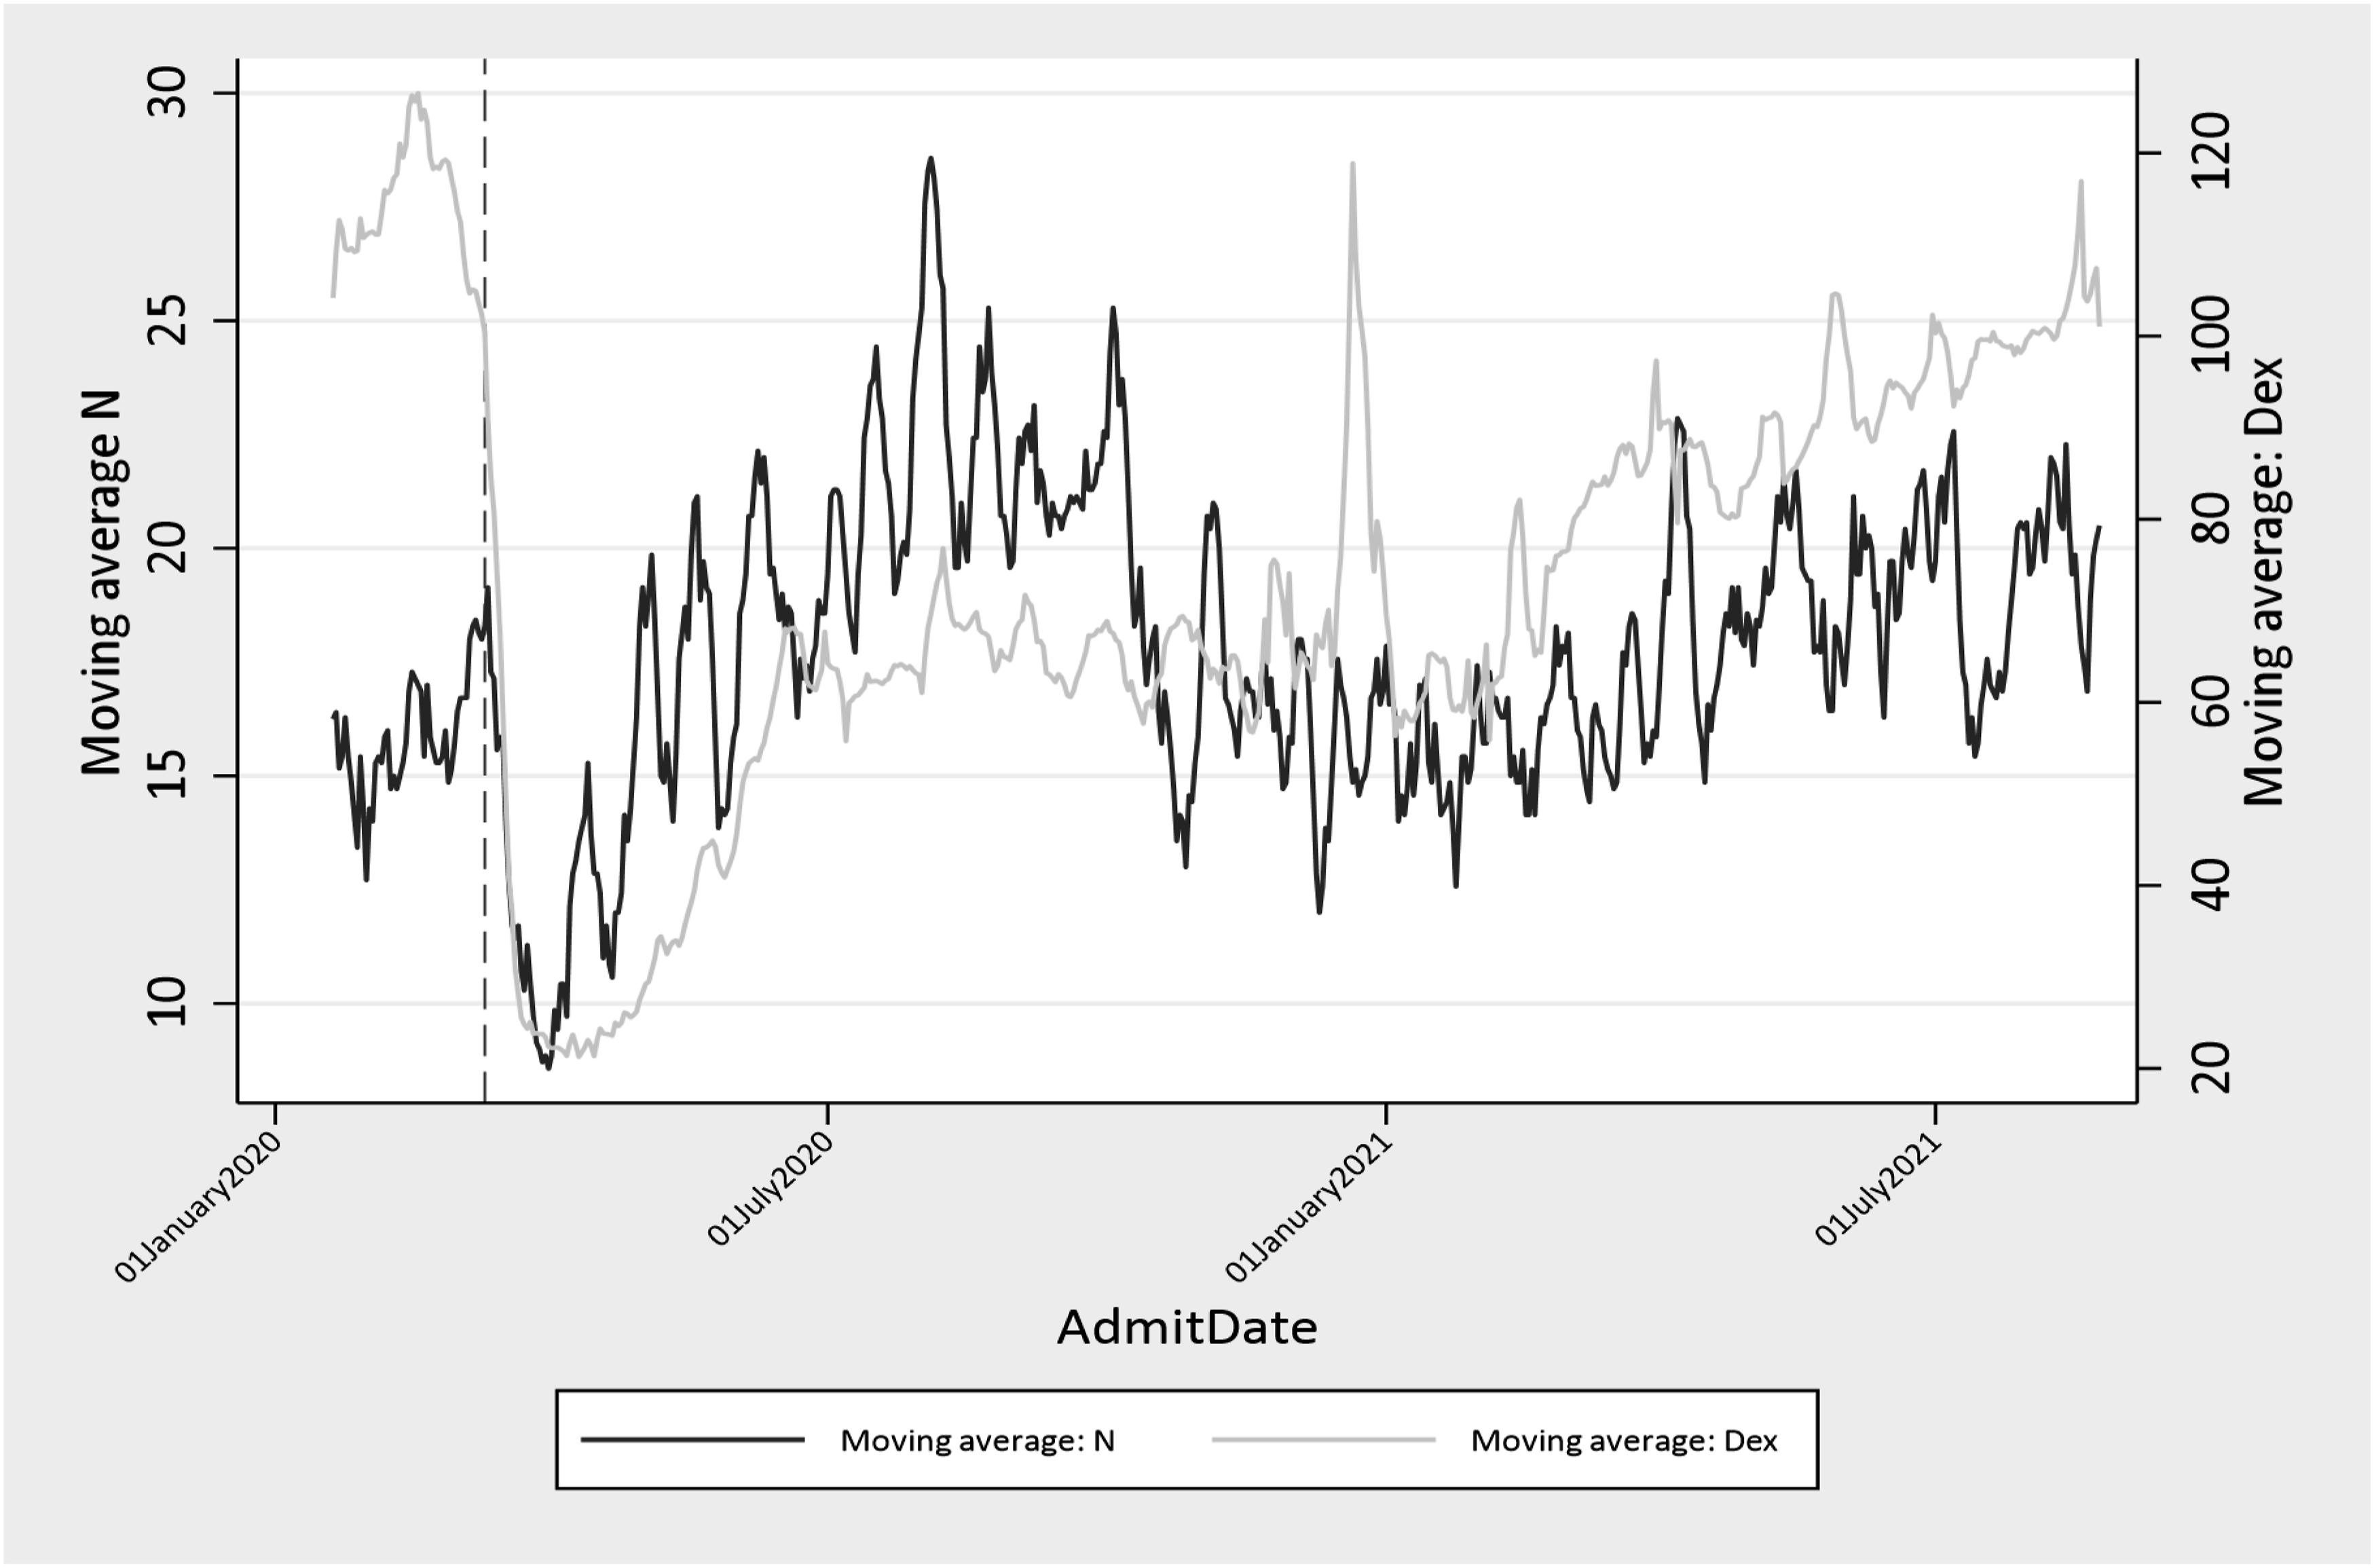
Number of Trauma Admissions vs Device Exposure Index (DEX) Utilizing 7-Day Moving Average
Spearman’s Rho by Period
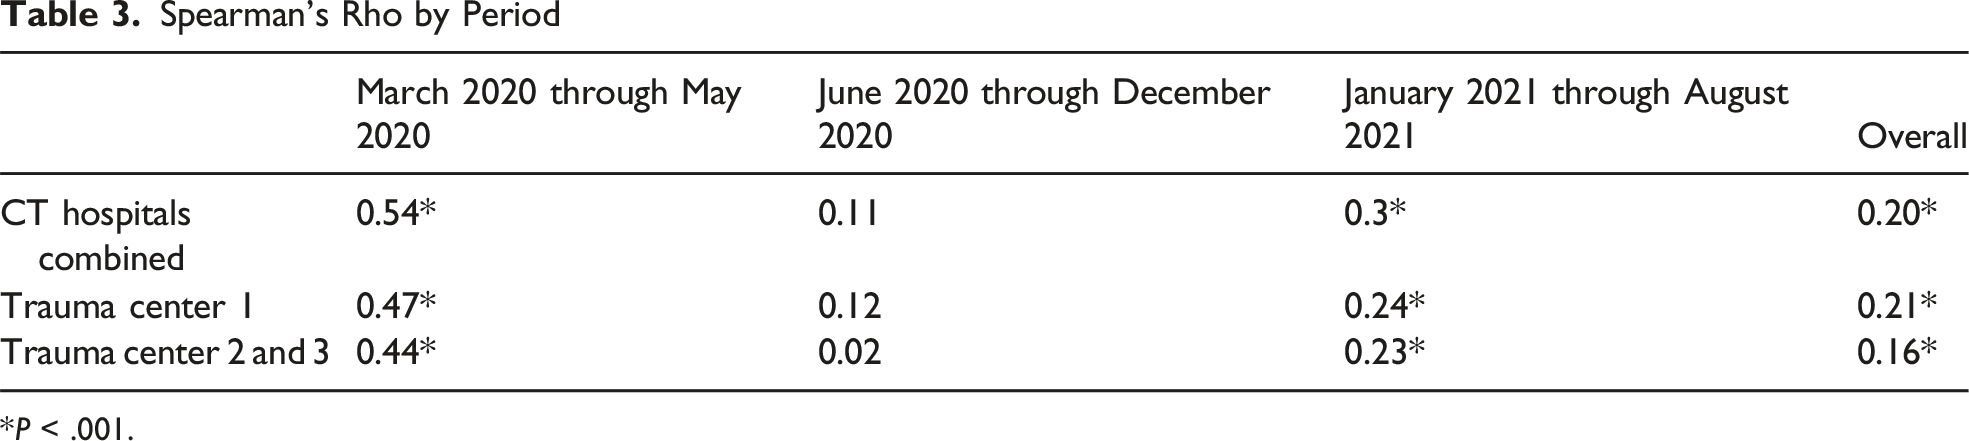
*P < .001.
Device Exposure Index (DEX) vs Daily Trauma Admissions
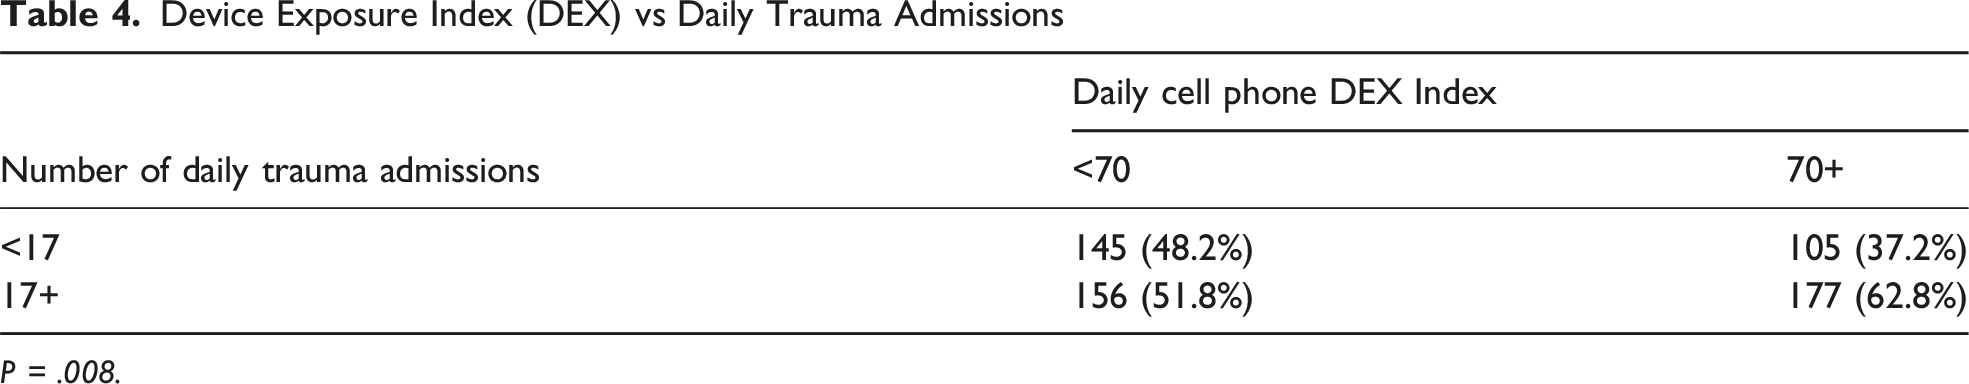
P = .008.
Regression of Trauma Admissions on Categorized and Continuous Device Exposure Index (DEX), Adjusting for Season and Weekend
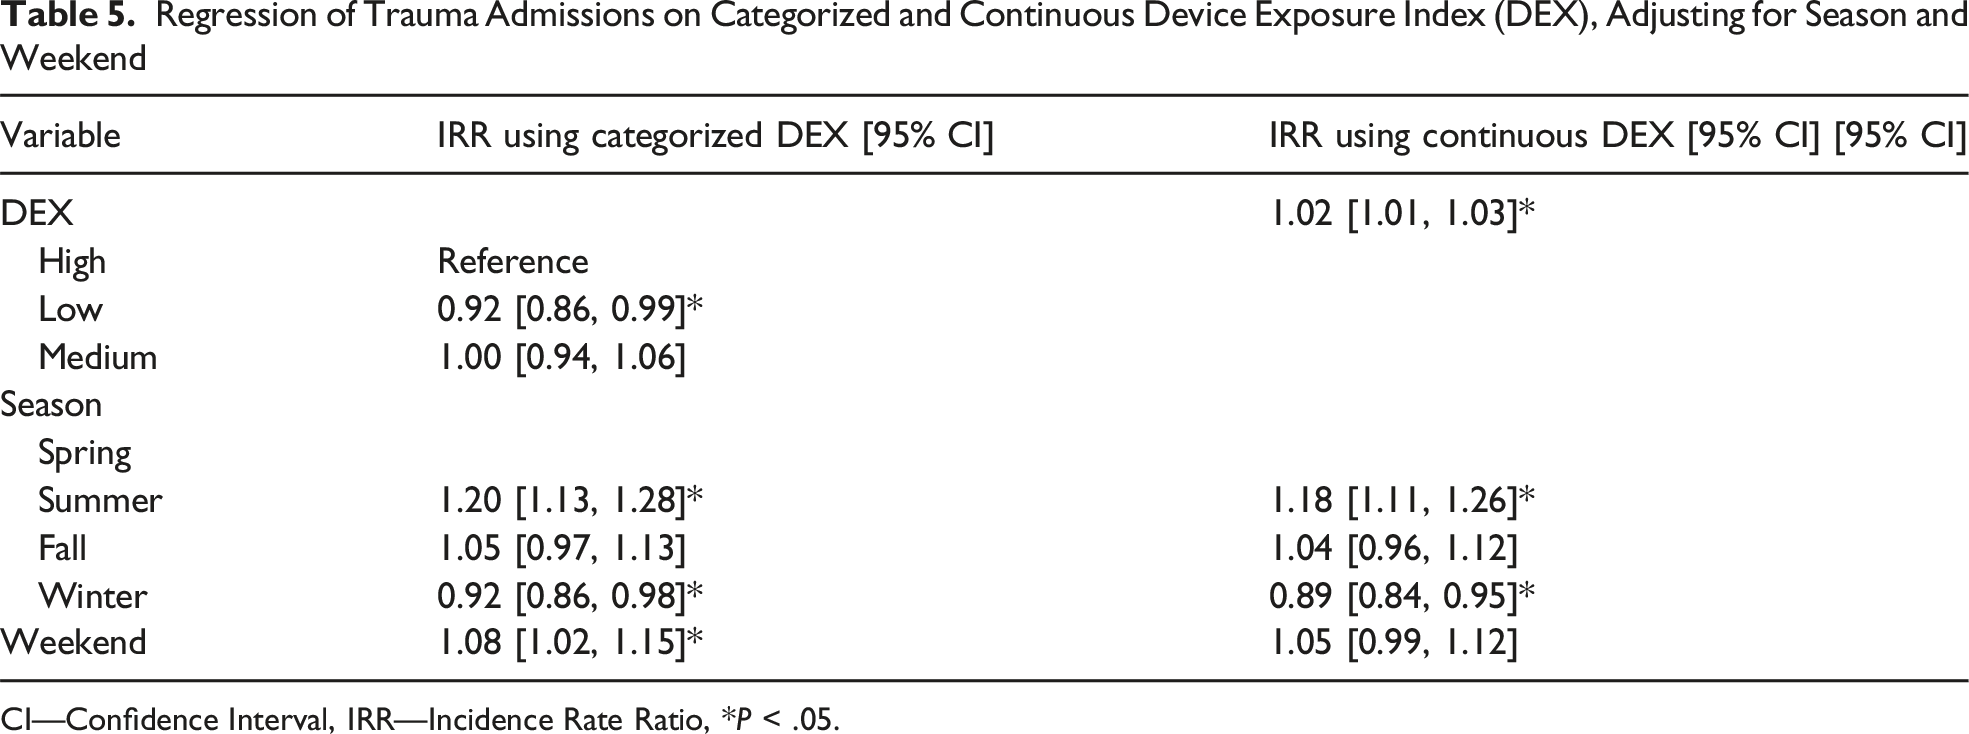
CI—Confidence Interval, IRR—Incidence Rate Ratio, *P < .05.
Discussion
We identified a significant correlation between DEX and TA (Spearman’s rho = 0.2, P < .001) and noted that the correlation was strongest at the start of the pandemic (Spearman’s rho = 0.54, P < .001), highlighting that larger shifts in activity as measured by the DEX correlate more strongly with trauma admissions. This correlation between DEX and TA is further supported by the chi-square analysis, whereby low DEX days (DEX <70) were associated with nearly half of the low TA days (TA <17), while higher DEX days were more associated with high TA days. These results suggest a relationship between device exposure and trauma admissions, particularly during periods of population shifts. The simultaneous occurrence of high DEX and high trauma admissions suggests that this may be an opportunity for further investigation. Using DEX alongside other established predictors of trauma volume to better predict increased volume on a given day would be of value to trauma centers.
The regression models further highlight the dynamics between DEX and trauma admissions. In both the categorical and continuous DEX models, lower DEX was associated with a lower rate of trauma admissions. The 2% increase in TA for every 10-unit increase in DEX suggests that DEX may provide additional and complementary data for understanding variation in trauma volume. Trauma volumes are well known to vary by season, day of the week, and time of day. 10 Trauma volumes are also known to be influenced by social and structural determinants of health. 11 DEX has the potential to augment these predictions. The weekend and seasonal trends observed in our study provide additional insights into the factors influencing trauma admissions. Trauma volumes were 8% higher on weekends compared to weekdays, which is consistent with previous studies showing increased injury rates on weekends due to various factors such as higher levels of recreational activity and alcohol consumption.12,13 The observed seasonal trends, with a 18% rise in trauma admissions during the summer and an 11% reduction in the winter, align with established seasonal patterns in trauma epidemiology.14,15 These established temporal predictors such as season, day of week, and time of day remain central to trauma volume forecasting.10,16 Recent studies continue to demonstrate the importance of these patterns for trauma system planning and resource allocation.12,13 These studies are in the setting of changes in trauma mechanism, severity, and volume during the COVID pandemic, including an increase in penetrating trauma.17-21 Recent literature also notes demographic changes in trauma admissions during the COVID pandemic.22,23 At the same time, existing approaches to predicting trauma center need remain limited, 24 and these changes observed during the pandemic underscore the need for improved methods to anticipate trauma admissions. In this context, population-level activity metrics derived from smartphone data should be viewed as complementary rather than substitutive.
While DEX and TA are correlated, it is uncertain if DEX will add additional predictive capacity beyond other predictors. Regardless, we identified large shifts in activity which mirrored trauma volume. The lack of complete data on all trauma centers and the broader population may have limited the strength of the observed correlation. The practical significance of our findings for trauma system management lies in providing a real-time, predictive indicator (DEX) correlated with trauma admission volumes. By offering insights into community-level social interactions through smartphone-based location data, trauma system leaders may be able to anticipate periods of increased trauma demand using DEX alongside already established predictors of trauma volume. Such anticipation enables more precise staffing, optimized resource allocation, and improved operational efficiency. Integrating DEX into trauma system planning—particularly during extraordinary circumstances like pandemics, mass gatherings, or rapidly changing community dynamics—may enhance preparedness and allow trauma systems to adapt, complementing traditional forecasting methods. Overall, while our study does not demonstrate causal relationships between smartphone device co-locations and trauma admissions, these analyses suggest that DEX is a potentially valuable predictor of TA and could serve as a useful adjunct tool for trauma center planning and staffing. If privacy concerns can be overcome, these results suggest that DEX may warrant further evaluation as a potential real-time signal to help inform trauma center preparedness during periods of changing population activity.
Limitations
This study has several limitations. First, the sample size was limited to three level I trauma centers within a single geographic region. This small sample size potentially restricts generalizability. It also limited our ability to examine possible temporal variability in blunt vs penetrating injuries or specific mechanism of injury. There is also the possibility that inclusion of all patients across all hospitals may have further strengthened the relationship between DEX and trauma admissions. Second, the study analyzed the relationship between DEX and TA over a relatively short time frame. Future research should explore longer periods to better assess the predictive utility of DEX. Specifically, investigating the long-term effects of pandemic-related changes on trauma and device utilization patterns could offer valuable insights for post-pandemic health care planning. Third, we approximated trauma center catchment areas using county boundaries, which may not fully capture the populations served by each center. A more precise delineation of catchment areas and inclusion of all hospitals could improve the accuracy of our findings. Fourth, while we controlled for certain confounders in our regression model, namely, season and the effect of weekday vs weekend, there may be other variables including holidays, sporting events, and concert sales which could correspond to cell phone activity or could further improve model fit. Accordingly, any role for DEX in real-time forecasting should be considered hypothesis-generating and requires validation before routine use in trauma system operations. Potentially the most important limitation is the DEX data. Although the data is inclusive, it is also processed data that point to increased population activity and interactions. Raw data from cell phone activity may result in stronger correlations or improved insights into the relationship between population activity as captured by cell phone movement and TA.
Conclusion
This pilot study demonstrated the feasibility of assessing variability in TA in the context of population mobility measured through cellular telephone location tracking during the COVID pandemic. Overall, these results underscore the potential to use DEX as an informative metric in trauma care. The correlations and trends identified suggest that DEX may reflect overall population mobility, especially during dramatic shifts in population behavior, and these trends are correlated with trends in trauma admissions. Further research is needed to determine whether and how DEX might complement established predictors in informing trauma system preparedness, including its role in daily staffing decisions, in non-pandemic conditions.
Supplemental Material
Supplemental Material - Cell Phone Measured Population Mobility and Interactions as a Predictor of Trauma Volume and Trauma Center Need
Supplemental Material for Cell Phone Measured Population Mobility and Interactions as a Predictor of Trauma Volume and Trauma Center Need by Pawan J. Mathew, Elena Graet, Adrian Maung, Jane Keating, Manuel A. Moutinho, Eric Schneider, Kimberly Davis, Kevin M. Schuster in The American Surgeon™
Supplemental Material
Supplemental Material - Cell Phone Measured Population Mobility and Interactions as a Predictor of Trauma Volume and Trauma Center Need
Supplemental Material for Cell Phone Measured Population Mobility and Interactions as a Predictor of Trauma Volume and Trauma Center Need by Pawan J. Mathew, Elena Graet, Adrian Maung, Jane Keating, Manuel A. Moutinho, Eric Schneider, Kimberly Davis, and Kevin M. Schuster in The American Surgeon™
Footnotes
Ethical Considerations
There are no human participants in this article and informed consent is not required.
Author Contributions
Conception and study design: PM, EG, ES, and KS.
Literature review: PM and KS.
Data acquisition: EG and ES.
Data analysis and interpretation: PM, EG, AM, JK, MM, ES, KD, and KS.
Drafting of the manuscript: PM, EG, and KS.
Critical revision: PM, EG, AM, JK, MM, ES, KD, and KS.
Funding
The authors received no financial support for the research, authorship, and/or publication of this article.
Declaration of Conflicting Interests
The authors declared no potential conflicts of interest with respect to the research, authorship, and/or publication of this article.
Data Availability Statement
The data supporting the findings of this study include both publicly available and restricted datasets. Publicly available data were obtained from the smartphone-based mobility and social contact dataset described by Couture et al. (2022). Data derived from the American College of Surgeons are not publicly available due to data use agreements and restrictions on patient-level information but may be accessed through the American College of Surgeons upon reasonable request and approval.
Supplemental Material
Supplemental material for this article is available online.