
Abstract
Competition between social units has long been central to sociological theories of change. Understanding it has become particularly important in the sociology of religion with the theory of religious economies, a market model of religious change. Existing empirical tests of the theory are limited by (1) ambiguity regarding which religious groups are expected to compete with which other groups, and/or (2) a neglect of the local level (competition among congregations). Using an original compilation of the life histories of religious congregations in Manhattan from 1949 to 1999, I conduct event-history analyses that avoid those limitations. The chief results are the following: (1) the more congregations there were near a given congregation that were theologically dissimilar to that congregation, the less likely that congregation was to advertise; (2) when there was an increase over time in the number of nearby congregations that were theologically similar to the focal congregation, that congregation became more likely to advertise; and (3) when there was an increase over time in the number of nearby congregations that were theologically dissimilar to the focal congregation, that congregation became less likely to advertise. Implications for the study of religion include modifications of religious-economies theory; broader implications speak to understanding the social units that compete and what drives competition.
A key dynamic in various social arenas is competition for resources between social units, be they households, clans, businesses, states, or other units. An early formulation—drawn from the then-emerging Darwinian and Spencerian writings about evolution—was the Chicago School’s human ecology (Park 1952; Park and Burgess 1925), which defined ethnic groups as the units in competition and urban space as the resource. Another formulation describes the changing industrial landscape as firms take actions to acquire their competitors’ market share (Ferrier, Smith, and Grimm 1999; Porter 2008).
With that industrial mindset, Stark and colleagues developed the theory of religious economies (Bainbridge and Iannaccone 2010; Finke and Stark 2005; Stark and Bainbridge 1985, 1987; Stark and Finke 2000; Stark and Iannaccone 1994), which has been abbreviated as RET (religious-economies theory). This broad, highly influential theory of religion makes competition for adherents key to explaining religious affiliation and participation, essentially positing that religious organizations behave as firms do and that potential adherents behave like consumers. Inspired by Warner’s (1993) influential article, scholars began referring to RET as the “new paradigm” and to the secularization thesis—the theory that modernity undercuts religion (Bruce 2011; Martin 2005; Wilson 1966)—as the “old paradigm.” Some prior work has found empirical evidence for RET (Finke and Stark 2005; Stark and McCann 1993), but other empirical studies criticize the theory (Chaves and Gorski 2001; Koçak and Carroll 2008; Montgomery 2003; Olson et al. 2020; Wilde et al. 2010).
The basic question raised in the present analysis is whether congregations act like competing business establishments, specifically by advertising strategically. I used the yellow pages and many other sources to identify and then describe the religious congregations of the Manhattan borough of New York City from 1949 to 1999. I conducted event-history analyses to test whether congregations were more likely to advertise when they had more potential competitors nearby. The analyses reveal three chief results. First, the more congregations there were nearby a given congregation that were theologically dissimilar to that congregation, the less likely the congregation was to advertise. Second, consistent with RET expectations, when there was an increase over time in the number of nearby congregations that were theologically similar to the congregation in question, that congregation became more likely to advertise. Third, when there was an increase over time in the number of nearby congregations that were theologically dissimilar to the focal congregation, that congregation became less likely to advertise. The chief conclusion is that congregations compete with theologically similar congregations but not with those which are theologically dissimilar. I argue that it is time to lay to rest doubts (Hill and Olson 2009) about whether competition is relevant to religious organizations.
Along with testing RET, this article also addresses two major limitations of the existing research on RET. First, prior work focuses mostly on competition between denominations. Almost no studies test RET at the level of the congregation, 1 which I argue is a more relevant level of analysis. For example, churchgoers generally speak of “church shopping,” not “denomination shopping.” Second, RET is ambiguous about whether a given religious organization is expected to compete against religious organizations of all religious stripes, or whether it is expected to compete only against organizations that are theologically similar to it. That ambiguity is unfortunate given the centrality of competition to the theory.
The additional clarity achieved by the results of this article challenges the original conception of RET while confirming the relevance of competition, a core tenet of RET, at the level of the congregation. The results also challenge wholesale rejections of RET (Bruce 2011; Koçak and Carroll 2008). Article titles such as “Sacred Canopies or Religious Markets?” (Olson et al. 2020) exemplify a long-running assumption that there must be a stark choice between different paradigms. I argue that adopting a more nuanced conception of religious competition and avoiding yes-or-no choices is likely to improve understanding of religious change.
The present study of competition among congregations not only advances our understanding of religious change, but also raises three broad questions for sociology more generally: (1) What are the specific social units that actually compete? (2) With what other units do they compete? (3) How is competitive pressure amplified? Competition has been an important theme in social science for more than a century, but the triggers of competition between groups are rarely pondered (Arora-Jonsson, Brunsson, and Hasse 2020).
Competition Among Organizations And Other Social Units
The Chicago School emphasized competition in accounting for the distribution of ethnic groups and urban institutions across space (Park 1952; Park and Burgess 1925). In a classic article, White (1981) argued that firms base their competitive actions on the actions they observe their competitors taking, an argument echoed in later work (e.g., DiMaggio and Powell 1983; Haveman 1993). Scholars of organizations have not only described firms competing for market share (Ferrier et al. 1999; Porter 2008), but also other kinds of organizations competing for funding (Barman 2002), members (McPherson and Rotolo 1996; Popielarz and McPherson 1995), attention, and the like (Hall and Hall 1996).
Competition arises when at least two actors understand that another actor can choose between them (Simmel 1950), it escalates as scarcity intensifies (Prediger, Vollan, and Herrmann 2014) or as geographic distances decrease (Mascia, Palloti, and Angeli 2016), and it can be influenced by third parties (Cattani, Porac, and Thomas 2017). Yet, beyond a few basic facts such as these, as Arora-Jonsson and colleagues (2020) note, organizational scholars rarely investigate the drivers of competition, despite their voluminous research on the effects of competition.
Nor have scholars clarified which organizations compete. Despite a general understanding that organizations compete more fiercely the more their niches overlap (Baum and Shipilov 2006; Baum and Singh 1994), it is not immediately clear what makes two organizations and their niches similar enough to compete. Critically, for multilevel organizations, it is not clear at what level the key competition occurs (Chiambaretto and Dumez 2016; Sadeghi, Talan, and Clayton 2016). For example, do Burger King and McDonald’s compete globally as international firms or neighborhood by neighborhood between specific franchisees? The current article adds to our understanding of organizational competition by examining, in the case of religious congregations, these concerns—what drives competition in which niches between what levels of organization.
Religious-Economies Theory
Religious competition generally occurs when religious groups strive to increase the size of their own group, which can lead to a decrease in the size of other groups when people switch from one group to another (Olson 2002). In the sociology of religion, no theory has focused more on competition than RET has. RET is built on social-exchange theory (Homans 1974) and rational-choice theory, which generally hold that social action is explained by the rational calculations individual people make in their own self-interest (Scott 2000). Becker (1964) has argued that “the economic approach . . . is applicable to all human behavior” (Becker 1986:112). Stark and Bainbridge (1985, 1987) took that idea to heart, and Iannaccone (1988, 1990, 1992, 1994) and Finke joined them in refining RET (Finke and Stark 2005; Stark and Finke 2000; Stark and Iannaccone 1994).
According to RET, while people pursue many rewards in life, they will always demand religion because it provides compensators, which are promises of future rewards—often not obtainable until after death. Religion provides additional rewards by creating community and other social benefits (Stark and Bainbridge 1987). People make rational choices based on their own preferences about which religion or denomination to affiliate with and which congregation to join. In turn, congregations and denominations make rational marketing decisions (Bainbridge and Iannaccone 2010).
According to the long-standing secularization thesis, modernity undermines religion (Berger 1967; Bruce 2011; Martin 2005; Wilson 1966). 2 RET was at least partly a reaction to secularization theory. Whereas the secularization thesis holds that societal demand for religion has been declining, RET postulates that the demand for religion is constant and that therefore fluctuations in religious activity are explained by changes in the supply of religion (Finke and Iannaccone 1993; Iannaccone 1995). By supply-side logic, religious-service attendance is lower in Europe than in the United States because national churches in European countries historically have been state-supported monopolies that need not work hard to recruit new adherents, whereas competition has flourished in the U.S. free market for religion (Stark and Iannaccone 1994). The extent to which RET reflects reality is thus crucial to any consideration of the future of religion in a modern, diverse country such as the United States.
Unbounded Ret Versus Within-Traditions Ret
I contend that a tension exists within RET between a strand I call “unbounded RET” and a strand I call “within-traditions RET,” with “traditions” referring to individual denominations or groups of similar denominations. In distinguishing between these two strands of RET, I am referring to denominations as sets of beliefs and practices; I am not referring to denominations as organizations or as social movements. This contention of two strands stems from the RET literature written by Stark and colleagues as well as other scholars’ interpretations of that literature. As I will explain, this distinction should help advance research on religious change. I have not come across this specific distinction anywhere in the literature, although Bruce (2011) argues that RET is so vague that almost any result can be interpreted as support for the theory.
However vague RET may be, competition clearly is central to the theory. According to unbounded RET, religious organizations compete intensely with one another for adherents of virtually all religious stripes. According to within-traditions RET, intense competition among religious organizations (be they congregations or other types of religious organizations) exists within denominations and among similar denominations, but one would not expect Catholic and Protestant churches, for example, to compete with each other for members.
Note that the distinction between unbounded RET and within-traditions RET is separate from distinctions among levels of religious organizations. Any reading of the RET literature implies that religious competition exists at various levels: for example, between the national headquarters of one denomination and the national headquarters of another denomination (a higher level), or between two congregations in the same neighborhood (a lower level). A discussion of the different levels at which competition exists is distinct from a discussion of unbounded RET versus within-traditions RET. The next two subsections briefly point to the confusion in the literature between unbounded RET and within-traditions RET. Again, the basic idea is that within-traditions RET holds that religious organizations generally compete only within religious traditions, whereas unbounded RET holds that religious organizations generally compete within and across religious traditions.
Unbounded RET
The social-exchange and rational-choice theories underpinning RET imply the unbounded version of the theory. “Rational choice theory assumes that people approach religion in the same way that they approach other objects of choice. They evaluate its costs and benefits and act to maximize their net benefits. Hence they choose what religion (if any) they will accept and how extensively they will participate in it” (Iannaccone 1992:124, emphasis in original). Stark and Bainbridge (1987:133) argue, “If multiple suppliers of general compensators exist, then the ability to exchange general compensators will depend upon their relative ability and perceived exchange ratios. . . . Only when consumers disagree about which distributor offers a better deal, will there be a schism.” That is, religious adherents are consumers, and sometimes they will create their own religious group when they think doing so will get them a better deal. Stark and Finke (2000:223) boldly claim, “It is obvious to all American denominations that they are as subject to market forces as any commercial firm.”
Some prior work that interprets RET as what I call unbounded RET apparently agrees with that viewpoint: “Buyers (the individuals) and sellers (the religious organizations) meet in a marketplace in which supply and demand dictate allocations of adherents across religions” (Iyer, Velu, and Mumit 2014:60). Other scholars seem to interpret RET as the unbounded version but disagree with it; Zuckerman (2003:45), for example, exclaims, “Iannaccone seems to think that people will choose their religious identity the same way they choose their toothpaste!”
Within-Traditions RET
Some critics of RET have argued that RET fails to understand the nature of religious belief because of its focus on investment and exchange (Bruce 1993). Whether or not that criticism is accurate, RET certainly does not ignore religious belief completely: “When a person believes in a particular explanation, the person is unlikely to invest in competing explanations in which the person does not believe” (Stark and Bainbridge 1987:130). Stark and Finke (2000:137) state, “We do not suggest that doctrine is not important. . . . Doctrine matters a great deal when it comes to generating and sustaining commitment.” 3
If belief and doctrine matter, one would not expect that people constantly scan the religious offerings available in the “market” to try to find a religion that offers a better “deal.” In fact, multiple facets of RET seem to militate against the idea that people do that. For example, Stark and colleagues repeatedly emphasize that the primary reason people join a new religion is because one or more people they are close to are already members of that religion (Stark and Bainbridge 1985; Stark and Finke 2000). Importantly, Stark and Finke (2000) admit that the vast majority of people never convert from a religion to a completely different religion.
Yet, even if such conversions are rare, that would not preclude religious organizations from competing for that slice of the market. In summary, for all the emphasis on competition in RET, it is unclear which religious groups can be expected to compete with one another and to what extent they may compete.
Tests Of Ret
Issues with Tests of RET
A relatively small literature tests RET empirically. Many of these tests have been enlightening, but each of these studies suffers from one or more of the following two problems (and most suffer from both): (1) a conception of competition that does not distinguish between unbounded RET and within-traditions RET, and (2) a high-level conception of religious competition (e.g., nationwide competition among denominations) that neglects the local level: generally, competition among nearby congregations.
The general neglect of the local level in most empirical tests of RET is unfortunate considering scholars’ exhortations about the importance of congregations for understanding religion in general (Ammerman 1997; Blanchard, Stroope, and Tolbert 2014; Chaves 2004). The congregational level, I argue, is more relevant to RET than the denominational level. For one thing, denominations generally are more insulated from competition than are congregations. A given Methodist church, for instance, is at greater risk of demise than the Methodist denomination.
Importantly, worshippers become official members of congregations, not denominations. People speak of “church shopping,” not “denomination shopping.” When adults do identify with a denomination, they tend to identify either with the same denomination they were raised in or with a similar denomination (Kluegel 1980). Yet, most people do not attend the same congregation they attended in childhood. Even when people remain faithful to a particular denomination throughout their lives, they still must choose a new congregation any time they move too far away from their old congregation to continue attending there. Even people who do not move sometimes switch congregations for other reasons, such as disapproving of recently hired clergy.
Furthermore, denominations are diffuse organizations that generally do not give many orders from the top down. (Roman Catholicism and state churches are notable exceptions.) With most denominations generally having little centralized power, it is questionable how relevant their actions (as organizations in and of themselves) are for understanding religious change in society. Because of the decentralized nature of most religious power, the majority of congregations have considerable autonomy concerning whether to change their marketing strategy or whether they even have a marketing strategy in the first place. (This is true to some extent for Catholic parishes as well.)
An analogous comparison is nations versus firms. Porter ([1990] 1998) argues that nations do not truly compete with one another: firms do. Governments do attempt to help their domestic firms, but the main story of business is competition between firms. Similarly, a Pentecostal church seeking new members typically does not take orders from the denominational headquarters on specific marketing strategies; if it is competing, the competition is against other congregations in the locality.
Pluralism and Participation
If the religious marketplace is like the markets for goods and services, then a larger array of choices should stimulate consumer interest. In general, studies testing RET view individuals as choosing among denominations as opposed to choosing among congregations. Early studies found church membership to be higher in cities or counties with more religious pluralism (Finke, Guest, and Stark 1996; Finke and Stark 1988), suggesting that a more diverse mix of denominations fosters competition, which in turn leads to higher levels of religious service attendance. However, those findings were later discovered to be statistical artifacts (Voas, Crockett, and Olson 2002).
More recent studies have found that religious pluralism is associated with less religious participation (Koçak and Carroll 2008; Olson et al. 2020) and essentially have pronounced the triumph of the secularization thesis over RET. Koçak and Carroll (2008) used the broad categories of Protestant, Catholic, Jewish, and other, whereas Olson and colleagues (2020) considered individual denominations. Neither study investigated pluralism within closely related families of denominations. In other words, a mix of disparate faiths in a given area does not appear to stimulate religious participation, but that says nothing about competition that potentially could stem from theologically similar religious organizations operating in a given area (nor does it say anything about competition specifically among congregations).
Other Tests of RET
Goldstein and Haveman (2013) examined magazines affiliated with specific denominations in antebellum America. Their results indicate that interdenominational competition at the state and national levels helps explain growth in religious magazines, as does resource availability. Yet, given that religion is an intensely local experience for most people, it is unclear to what extent competition on the state or national level matters for individual participation. In addition, the finding of competition between magazines of varying denominations is based on data from centuries ago, before there were nearly as many adherents of any faith outside Protestantism.
In her study of the Second Vatican Council, Wilde (2007) found that bishops and other highly ranked clergy from countries where Catholic market share was relatively stable tended not to prioritize marketing, regardless of whether that market share was low or high. In contrast, she found that clergy from countries where Catholic market share was declining or was very unpredictable were much more in favor of marketing efforts. Using the same data, Wilde and colleagues (2010) found that Catholic Church officials, while influenced by religious competition, also were influenced by concerns about legitimacy in the eyes of Protestants. These findings on Vatican II are intriguing, but the Catholic Church is rare in its degree of top-down control. In most U.S. denominations, and even within Catholicism to some degree, congregations have considerable autonomy that they sometimes take advantage of to innovate (Chaves 2004).
Hill and Olson (2009) did aim to study congregational competition. They tested whether congregations from denominations with a small market share in their county make greater marketing efforts, whether congregations in counties with more religious pluralism make more efforts, and whether congregations in counties with more congregations of the same denomination make more efforts. They did not find evidence of greater marketing efforts on the basis of any of these variables. However, the tests of market share and religious pluralism are tests of whether congregations respond to denominational dynamics, not whether they respond to congregational dynamics. As for congregational dynamics, the measure of intradenominational competition—the number of congregations of the same denomination in the same county—suffers from the limitation that the data were aggregated at the county level. Most Americans do not search all over the county for a house of worship to attend: about one-fifth of Americans who attend religious services spend 5 minutes or less getting to their house of worship, and almost half spend between 6 minutes and 15 minutes (Dougherty 2017). What is needed are tests for competition among congregations that are nearby one another, and tests that distinguish between unbounded RET and within-traditions RET.
Hypotheses
Businesses compete more intensely with businesses that are closer in physical space than with those farther away (Baum and Mezias 1992; Degryse and Ongena 2005). Regions of fierce competition emerge because organizations face perverse incentives to cluster together to a degree considerably beyond the optimal (Hotelling 1929). If competition in the religious sphere is analogous to competition in the economic sphere, then one should expect congregations, ceteris paribus, to compete more fiercely with congregations that are geographically nearby than with congregations that are far away. Therefore, one could expect that a congregation with many nearby potential competitors is more likely to advertise than is a similar congregation with few potential competitors nearby.
I test this hypothesis with respect to within-traditions RET and unbounded RET. However, perhaps it is not the number of nearby competitors, but instead how that number has been changing, that matters. Recall Wilde’s (2007) finding that changes in the competitive landscape predicted whether high-ranking Church officials prioritized marketing at Vatican II. Therefore, in the present study of congregations, one may expect an increase in the propensity to advertise to accompany an increase in the number of nearby competitors.
Within-Traditions RET
Hypothesis 1: At any point in time, the more congregations that were near a given congregation and were of the same religious tradition 4 as that congregation, the greater the probability that the congregation advertised.
Hypothesis 2: The greater the increase during the previous 10 years in the number of congregations that were near a given congregation and were of the same religious tradition as that congregation, the greater the probability that the congregation advertised.
Unbounded RET
To show that competition existed among theologically similar congregations would clearly be insufficient to support unbounded RET, which leads to two additional hypotheses.
Hypothesis 3: At any point in time, the more congregations that were near a given congregation and were of a different religious tradition, the greater the probability that the congregation advertised.
Hypothesis 4: The greater the increase during the previous 10 years in the number of congregations that were nearby a given congregation and were of a different religious tradition, the greater the probability that the congregation advertised.
Data
Congregations
Using the yellow pages telephone directories and many other data sources, I constructed a dataset of the religious congregations in the Manhattan borough of New York City from 1939 to 1999. 5 This time series starts at 1939 mainly because the microfilm of the yellow pages from before that year is of poor quality.
Chaves (2004:1) defines congregations as organizations that “gather people, usually every week, for collective religious activity.” I use that definition but restrict it further to congregations that in principle are open to the general public. I thus do not include hospital chapels, chapels on military bases, and so forth, because they are not intended to be community organizations and cannot be conceived as competing for members with other congregations. Very few congregations are actually excluded because of this restriction.
Note that congregations are groups of people, not the buildings where those people worship. For instance, if a congregation closes and a different group of people forms a new congregation, purchases the recently vacated building, and starts worshipping there, the first congregation has died and a new congregation has been born; the fact that the same building continues to be used for worship does not mean there is continuity.
Sources of Data on Congregations
I chose Manhattan as the location to study primarily because the numerous data sources about Manhattan allow me to mitigate the problem of missing data. My initial data sources were the 1925 city directory that includes Manhattan 6 and the microdata from the 1926 Census of Religious Bodies, which was conducted by the U.S. Census Bureau. 7 The vast majority of congregations in the 1925 city directory appear in the 1926 census and vice versa, suggesting these are reliable sources. Even though 1939 is the starting point for the time series in the present study, the data sources from before 1939 were still helpful.
The chief data source in this study is the yellow pages, where establishments could be listed free of charge. 8 I used a large number of other data sources as well. Specifically, I utilized a book focused on architecture and containing basic information about more than 1,000 congregations (Dunlap 2004); hundreds of official websites and Facebook pages of individual extant congregations; websites dedicated to church organs, 9 architecture, 10 denominational histories, and other topics; news articles; and other historical sources. 11 Google Street View was useful as well, especially for confirming the existence or location of congregations. The congregations included in my sample 12 are (1) the Manhattan congregations that are in the 1925 city directory or 1926 Census of Religious Bodies and whose existence through at least 1939 can be confirmed with at least one source, and (2) congregations that appear in the yellow pages anytime from 1939 onward. 13
I visited the New York Public Library and the New York Historical Society to take photos of the “congregations” section of each edition of the yellow pages and to obtain microfilm/microfiche images when no hard copy was available. In addition to noting each congregational advertisement, I compared each year of the yellow pages with the previous year line by line to identify congregations that were new to the telephone listings as of a given year, to note the denominations listed for those congregations, and to document any address changes among congregations. Research assistants aided in coding for 27 years of the yellow pages. 14
This permits an assessment of reliability: I checked the work of each research assistant until I was confident the person was doing accurate work. Little of the work I assigned to the research assistants required interpretation. Either a congregation advertised or did not, either it was a new listing or was not, and so forth. Another check is made possible by an outside source: from 1966 to 1973, a photographer walked every street in Manhattan taking a picture of every house of worship he could find. (See the Herman N. Liberman photo collection at the New York Historical Society.) He counted 889 houses of worship. For 1970, my congregational dataset has 858 unique addresses (housing 892 distinct congregations), thus capturing about 97 percent of the houses of worship that he counted.
Yet another check comes from comparing the 1925 city directory, which was the foundation for phone directories in later years, with the Manhattan congregations in the 1926 Census of Religious Bodies. The 1925 city directory contains 116 congregations that were missing from the census, which is about 18 percent of the total estimated number of congregations in Manhattan at that time (estimated by combining the two sources). The census contains 43 congregations that were missing from the city directory, about 7 percent of the total. Thus, the directory was considerably more comprehensive than the Census of Religious Bodies, whose data have been used in well-regarded studies (e.g., Christiano 1987; Koçak and Carroll 2008).
Census Data
I downloaded historical U.S. census data (Manson et al. 2018) and linked them to congregations on the basis of 2010 census tracts. I then used established weighting procedures to make historical estimates based on 2010 tract boundaries (Lee and Lin 2018; Logan, Xu, and Stults 2014). 15
Measures
Dependent Variable
The dependent variable is whether a given congregation advertised in the yellow pages during a given year. This study is not the first to use yellow-pages advertising to study competition (Busse and Rysman 2005), but it is the first to my knowledge to study religious competition in this way. A listing in the yellow pages was free, but organizations could pay to make themselves stand out: one could pay for bold font or a box advertisement. Very few congregations paid for a box advertisement. The variable is coded zero for a normal listing and 1 for either bold font or a box advertisement.
Religious Tradition
I use a religious-tradition measure abbreviated as RELTRAD (Steensland et al. 2000) to assign a religious category to each congregation; the measure pools faiths and denominations with similar religious beliefs and practices. The original RELTRAD categories are mainline Protestant, evangelical Protestant, Black Protestant, Roman Catholic, Jewish, and “other,” but I stripped Eastern Orthodox churches out of the “other” category and placed them in their own category because they were substantially numerous in Manhattan.
Key Independent Variables
Distance-based measures play a key role in this study given that competition is more intense among businesses that are closer in physical space than among businesses that are farther away (Baum and Mezias 1992; Degryse and Ongena 2005). The first set of key independent variables is the number of other congregations of the same religious tradition as the congregation in question during a given year within the following radii: 1 mile, 0.5 mile, and 0.25 mile. 16 The second set of measures is the number of congregations from any religious tradition other than that of the congregation in question within the same radii: 1 mile, 0.5 mile, and 0.25 mile. The third set of measures is the percent change during the previous 10 years in the number of other congregations of the same religious tradition within the following radii: 2 miles, 1.5 miles, 1 mile, and 0.5 mile. 17 The fourth set of measures is the percent change during the previous 10 years in the number of congregations from any religious tradition other than that of the congregation in question, with the same radii. 18 (Not all these distance-based variables are included in the same regressions; see the Results section for details on how the variables are used.)
Other Independent Variables from the Congregational Data
The two largest statistical models in this article (explained in detail later) include an additional radius-based measure as a control. For the model focused on the 1-mile radius, I control for percentage-point change over the previous 10 years in the proportion of congregations within 1 mile of the focal congregation that were of the same religious tradition as that congregation, and I use an analogous 0.5-mile radius variable for the model focused on that radius.
Moving beyond radius-based variables, I include an indicator variable for each year to eliminate confounding that could be caused by changes in religiosity, the economy, or any other variable whose effects change over time. I also control for age of congregation. Founding years were identified on extant congregations’ websites or Facebook pages or in other sources. 19 The indicator variables for age are younger than 15 years, 15–19, 20–29, 30–49, 50–99, 100–149, and 150 or older.
The predominant racial or ethnic identity of each congregation also serves as a control variable. I identify congregations as either “White,” “White ethnic”—meaning White but associated with a specific ethnic group or foreign nation 20 —“Black,” “Latin American,” “Asian,” or “multiracial.” 21 In most cases, the race or ethnicity of a congregation is obvious. For example, a church from a historically White denomination that was in a White neighborhood in 1939 can be assumed to have been White in 1939. In the minority of cases where the racial/ethnic identity of a congregation is not obvious, I impute it by using census data at the tract level (which can be assumed to be a reliable method given how highly segregated both congregations and Manhattan neighborhoods have been historically). I define the racial/ethnic identity throughout a congregation’s lifespan as whatever it was at the time of entry into the time series (either 1939 or later). Most congregations do not see their racial makeup change much over time, and even those whose racial makeup does change are likely to continue to be influenced by the mold in which they were formed (Marquis and Tilcsik 2013; Stinchcombe 1965).
Control Variables from Census Data
The use of census tracts to proxy neighborhoods is a common practice (Logan 2018). In Manhattan, almost all census tracts are smaller than neighborhoods, so one can expect census-tract data to be at least as fine-grained as neighborhood data. Assigning a census-tract ID to each congregation–year, I control for the population density of the census tract and percent change in the population density of the census tract during the previous 10 years. I also control for level and percentage-point change during the previous 10 years for the following variables based on census tract: the proportion Black, the proportion neither Black nor White, the proportion foreign born, the proportion unemployed, the vacancy rate, and the ratio of rent in the tract to rent in Manhattan. 22
Method
I use logistic regression to estimate discrete-time event-history models, with the dependent variable being whether a given congregation advertised in the yellow pages during a given year. Event-history analysis is especially well known as a method for studying the survival of entities over time. However, event-history analysis can also be used to study repeatable events (Allison 2014), such as advertising. In addition to the covariates mentioned already, I control for the number of years that had passed during which a given congregation had not advertised (Allison 2014:75).
Unlike cross-sectional logit models, event-history analysis accounts for time-varying covariates and right censoring. When a congregation is right censored, that means it still existed at the end of the time series but we do not know how long it survived past that point. Researchers choose between continuous-time event-history models and discrete-time models. A discrete-time model is more appropriate for the present study because there is only one observation of each congregation per year. Here, the unit of analysis is the congregation–year: there is one record of data for each congregation during every year that it existed during the period in question.
The dependent variable, denoted as A, is whether a particular congregation advertised during a given year. That is, Ait = 1 if congregation i advertised at time t, and Ait = 0 if congregation i did not advertise at time t. Because advertising is a repeatable event, I include a control variable for the number of years as of t – 1 that a congregation had not advertised (Allison 2014). The probability of advertising during a given year can be represented as P(Ait = 1 | Xit, ti – 1), where P refers to probability, X is a vector of independent variables regarding congregation i at time t, and t – 1 is the duration variable. That probability is calculated as
As noted in the Measures section, some of the key independent variables are measures of percent change in numbers of nearby congregations during the previous 10 years. Therefore, to analyze the data from a particular year, we need data from 10 years before that. The full dataset goes from 1939 to 1999, so the congregation–years featured in the analyses are from 1949 to 1999. For example, to calculate the percent change during the previous 10 years in the number of synagogues within a 1-mile radius of a particular synagogue that existed in 1949, I drew on the 1939 data. I subtracted the number that existed in that area in 1939 from the number that existed in that area in 1949 and then divided the result by the number in that area in 1939.
Originally, 1,468 congregations and 44,164 congregation–years existed any time during the 1949 to 1999 period. I deleted observations from 1951 because no edition of the yellow pages was available for that year and therefore no ad data were available. After list-wise deletion, 1,455 congregations and 41,302 congregation–years remained.
Results
Descriptive statistics
Figure 1 is a line graph of the percentage of congregations that advertised each year. On average, from 1949 to 1999, 4.6 percent of congregations advertised during a given year. Yellow-pages advertising grew in popularity and peaked in 1965, with 7.4 percent of congregations advertising that year. Despite the decline in advertising after that point and the rise of the internet in the 1990s, congregations advertised more in the yellow pages in the late 1990s than they had in the early 1950s.
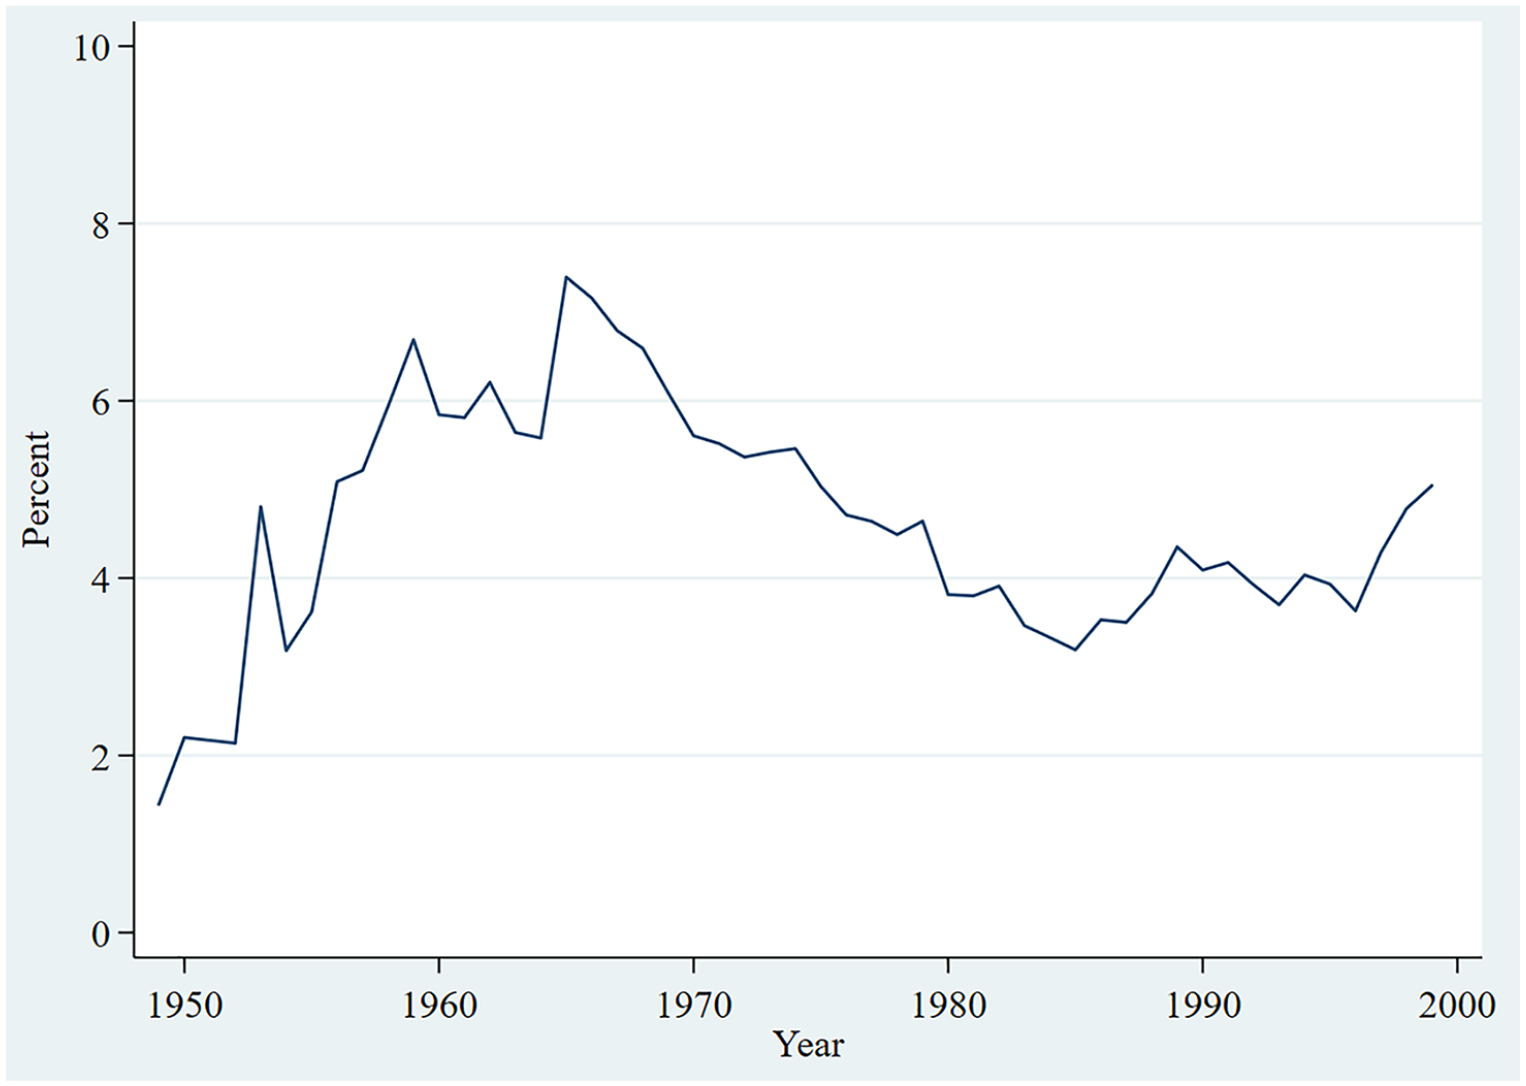
Percent of Congregations in the Manhattan Yellow Pages with Either Bold Font or a Box Advertisement, 1949 to 1999
Table 1 is a cross-tabulation of the number of congregations by religious tradition and race/ethnicity. These are congregations that existed at any point from 1949 to 1999. Evangelical Protestant was the largest religious-tradition category (378 congregations), and Black congregations were the largest category by race/ethnicity (518 congregations).
Number of Congregations by Religious Tradition and Race/Ethnicity of Congregation, Manhattan, 1949 to 1999
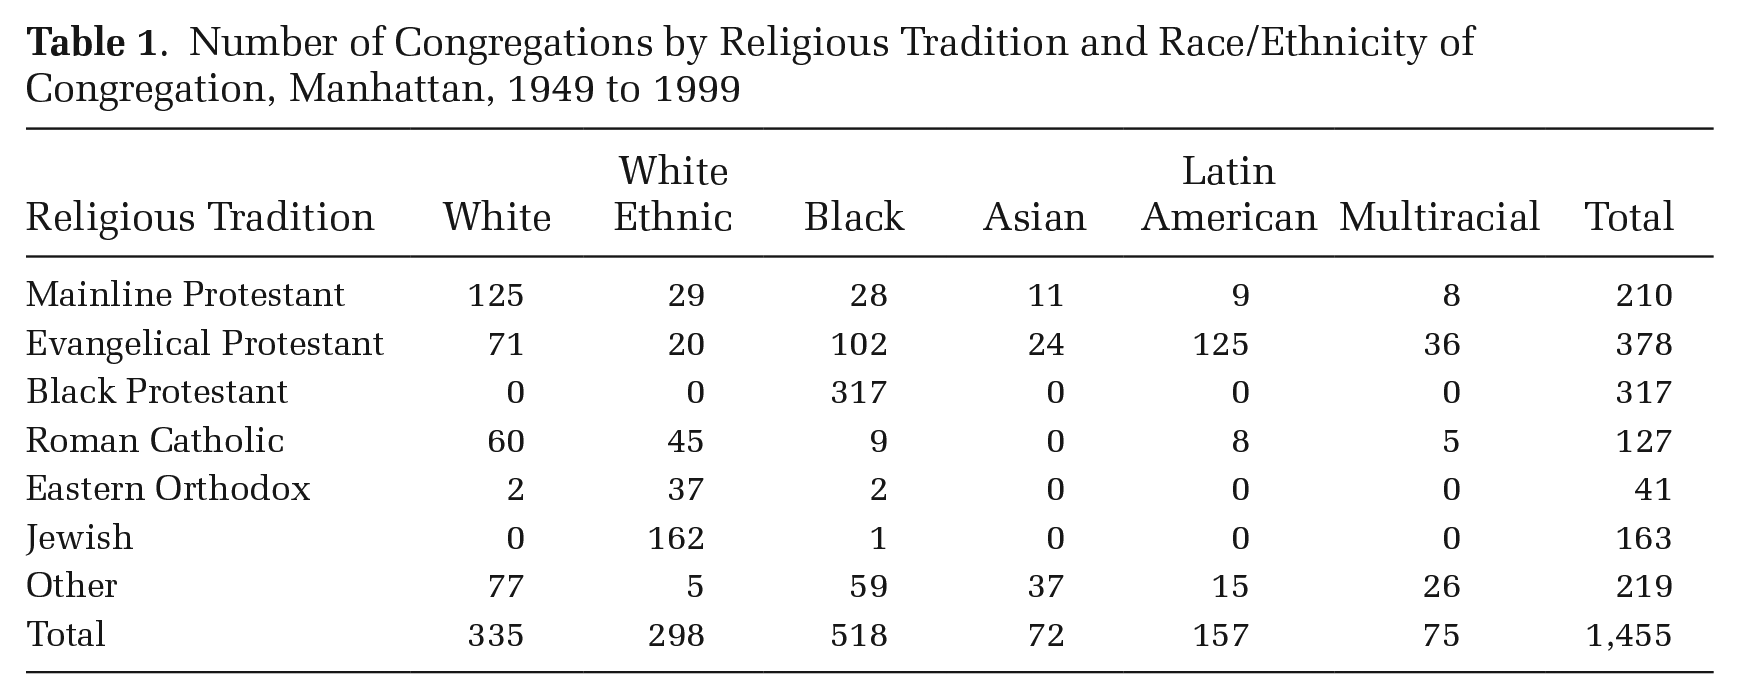
Table 2 displays the mean, standard deviation, and range for the measures that are based on numbers of nearby congregations, with the congregation–year as the unit of analysis. Houses of worship in Manhattan varied widely on the number of congregations near them. For example, congregations had as few as zero or as many as 177 congregations of the same religious tradition within a 1-mile radius, with the mean being 41 nearby congregations. Similarly, the largest decrease in the number of other congregations of the same religious tradition within a 1-mile radius was a 100 percent decrease, and the largest increase was a 900 percent increase.
Basic Statistics on Radius-Based Variables for Manhattan Congregations, 1949 to 1999
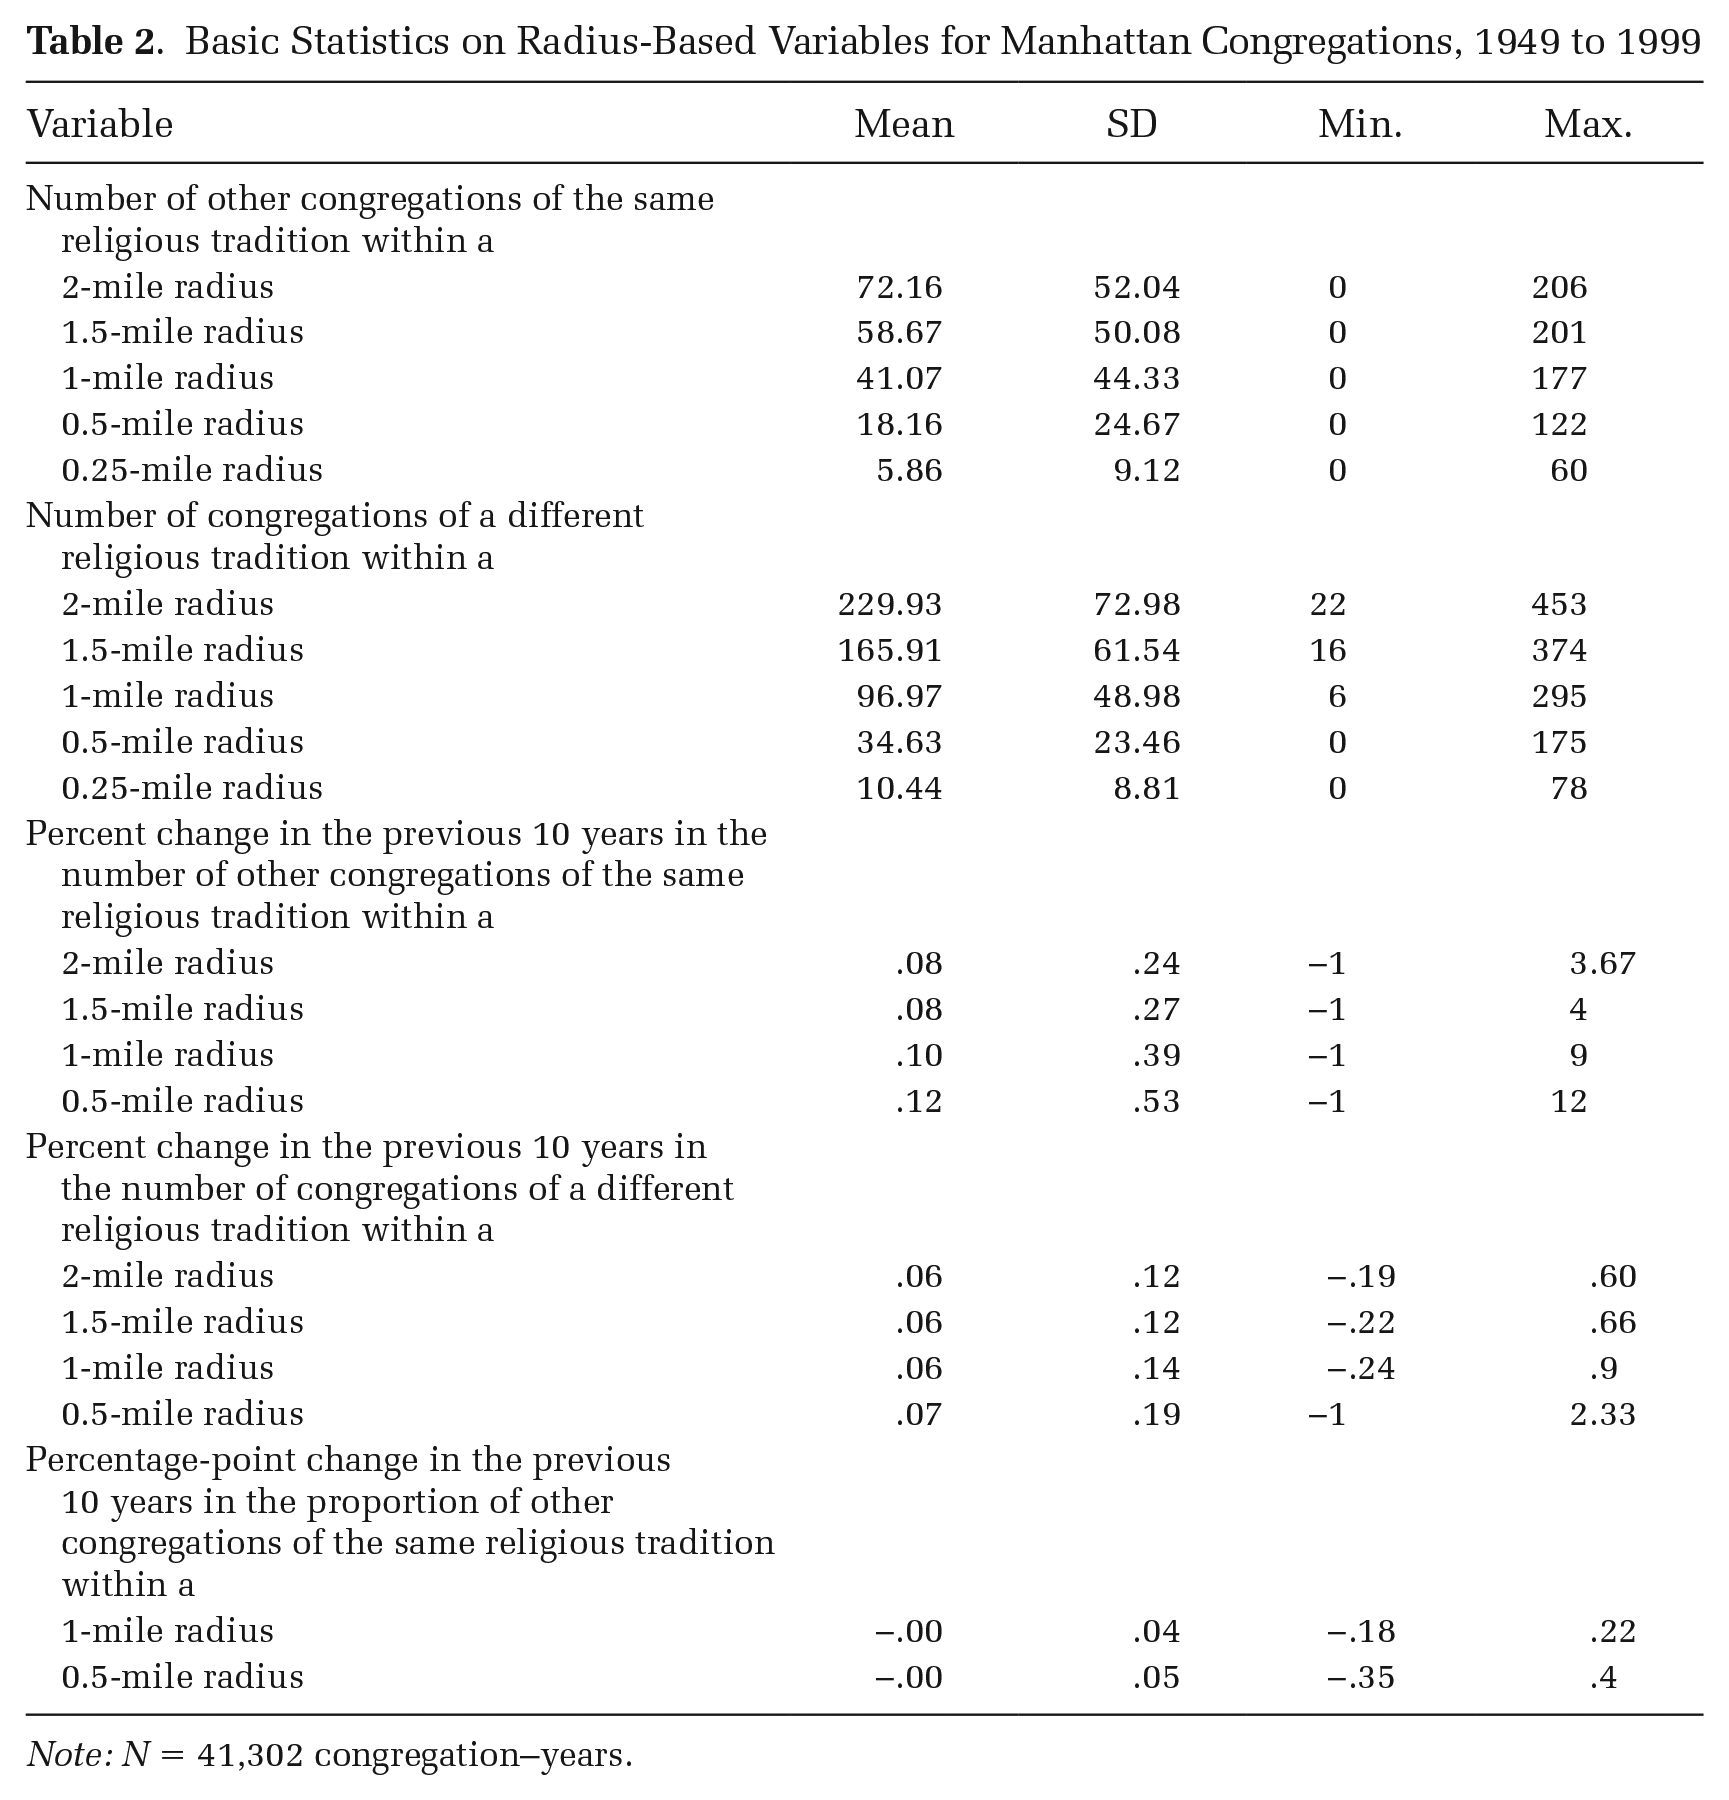
Note: N = 41,302 congregation–years.
Table 3 presents basic statistics on the other variables in the study. As discussed earlier, I used census data to construct variables representing snapshots at a given year as well as change over the previous 10 years. For instance, the average percent change in number of people per square mile in a given tract during a 10-year period was a 2 percent decrease. The average percentage-point change in the Black population of a given tract during a 10-year period was an increase of 1 percentage point.
Basic Statistics on Census-Based Variables and Other Variables for Manhattan Congregations, 1949 to 1999
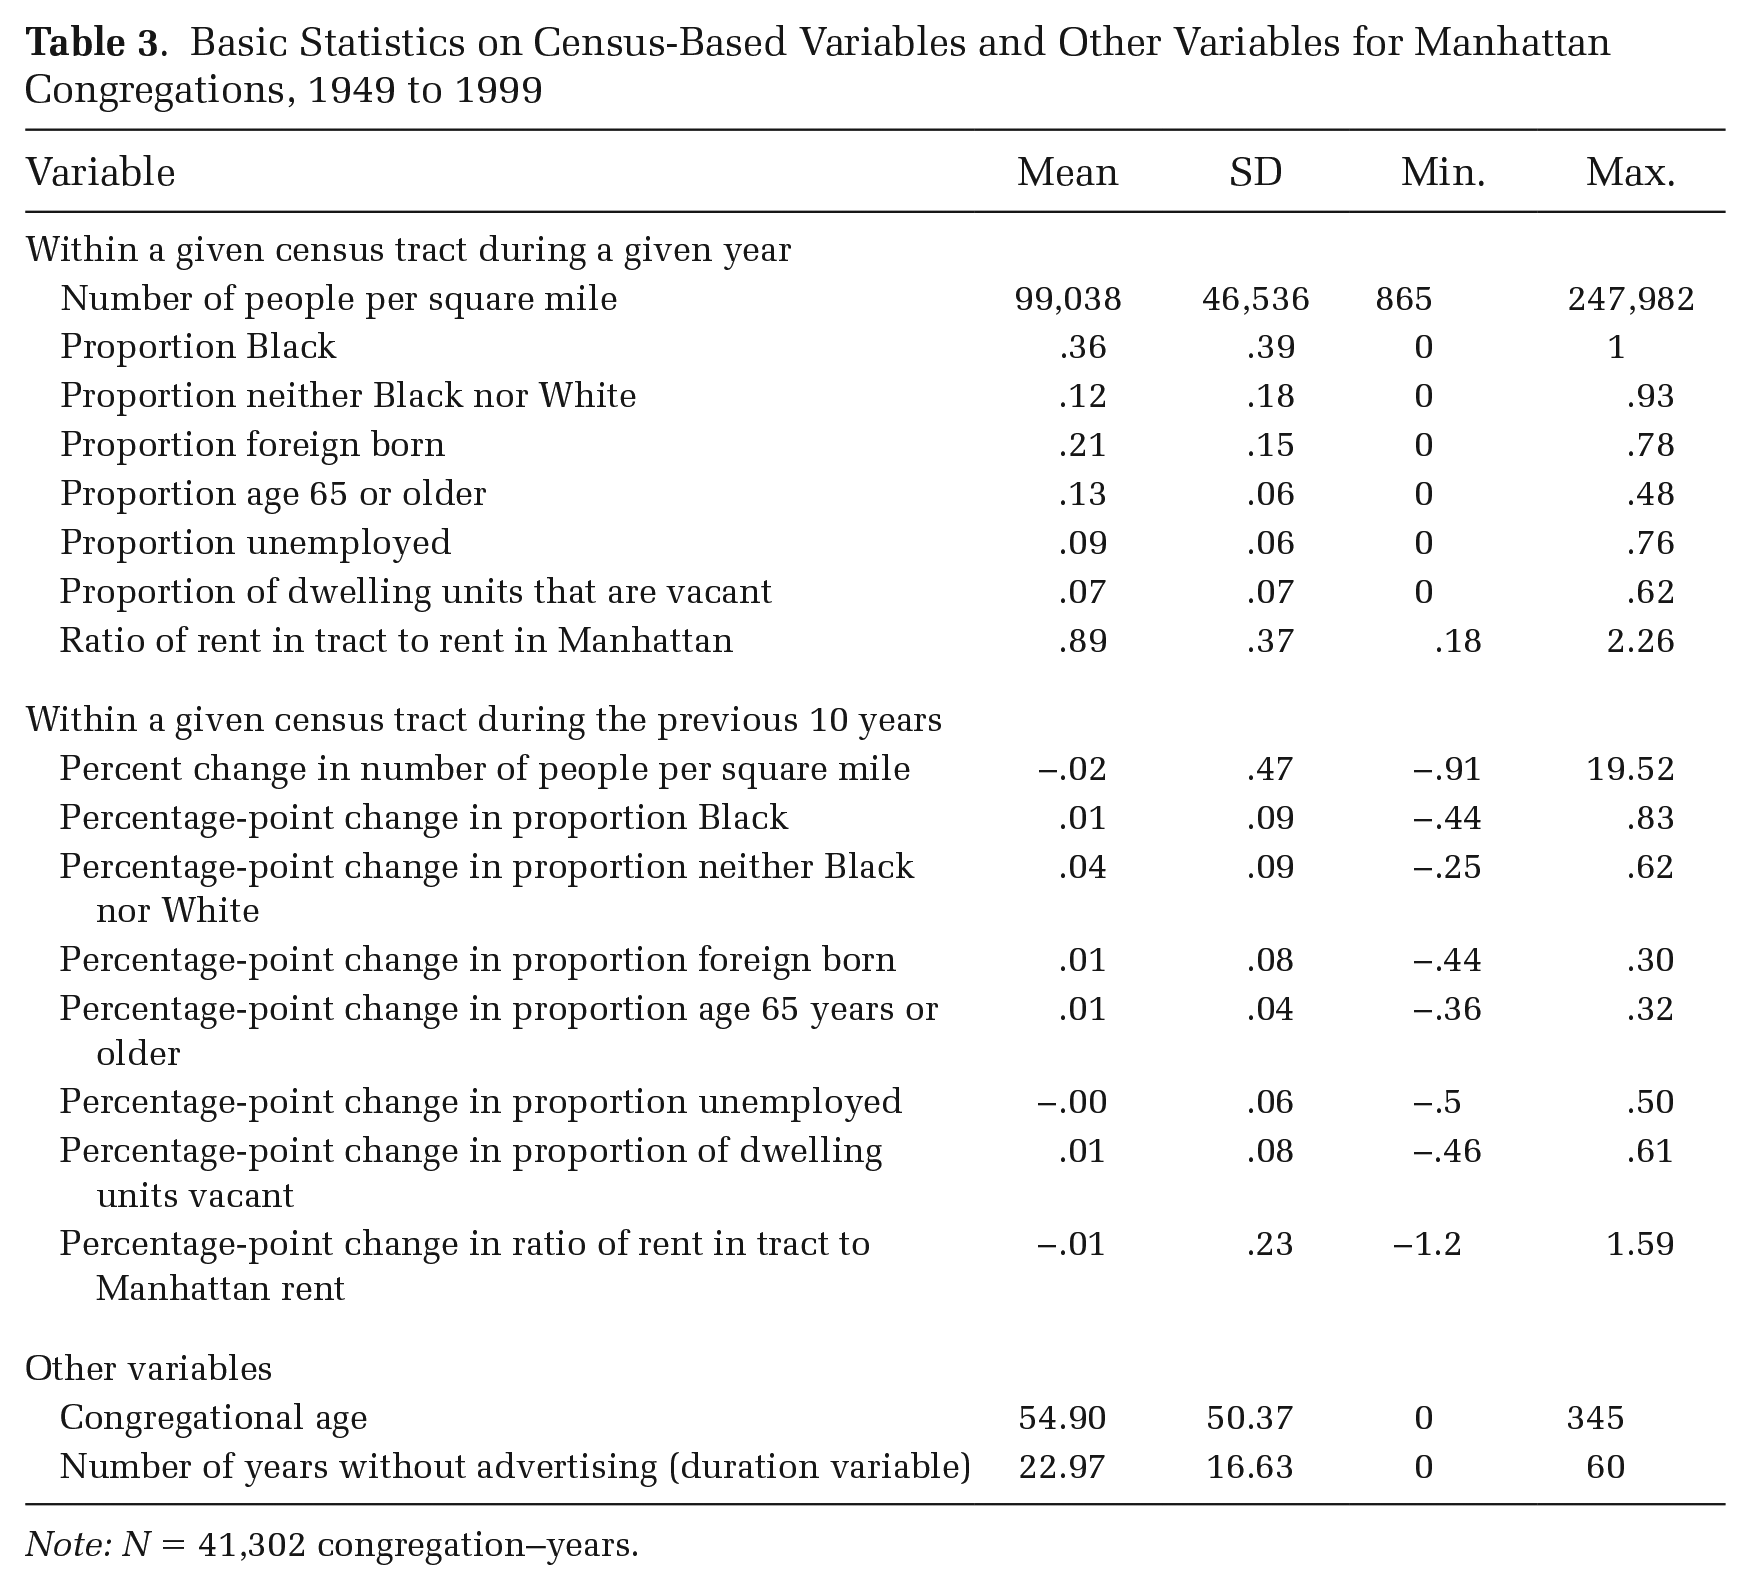
Note: N = 41,302 congregation–years.
Multiple-Regression Analyses
I conducted several discrete-time event-history analyses using logit regression. To avoid excessive length, the regression tables omit the results of many control variables. (See the note with each table listing the control variables whose results are not shown.) Table 4 reports results from a set of regressions with measures of numbers of nearby religious congregations during a given year. 23 The 2-mile and 1.5-mile measures are not included because they were too collinear with other variables. As Table 4 shows, none of the measures of nearby congregations of the same religious tradition are statistically significant at p < 0.05. These regressions thus show no evidence for Hypothesis 1. As for congregations of different religious traditions, all three distance variables are statistically significant—the 1-mile radius variable at p < 0.01 and the 0.5-mile and 0.25-mile variables at p < 0.001—but in the opposite direction from what Hypothesis 3 predicts. 24 That is, the more congregations nearby that were not of the same religious tradition as a given congregation, the less likely that congregation was to advertise.
Binary Advertising Variable Regressed on Numbers of Nearby Congregations and on Other Covariates, Manhattan, 1949 to 1999
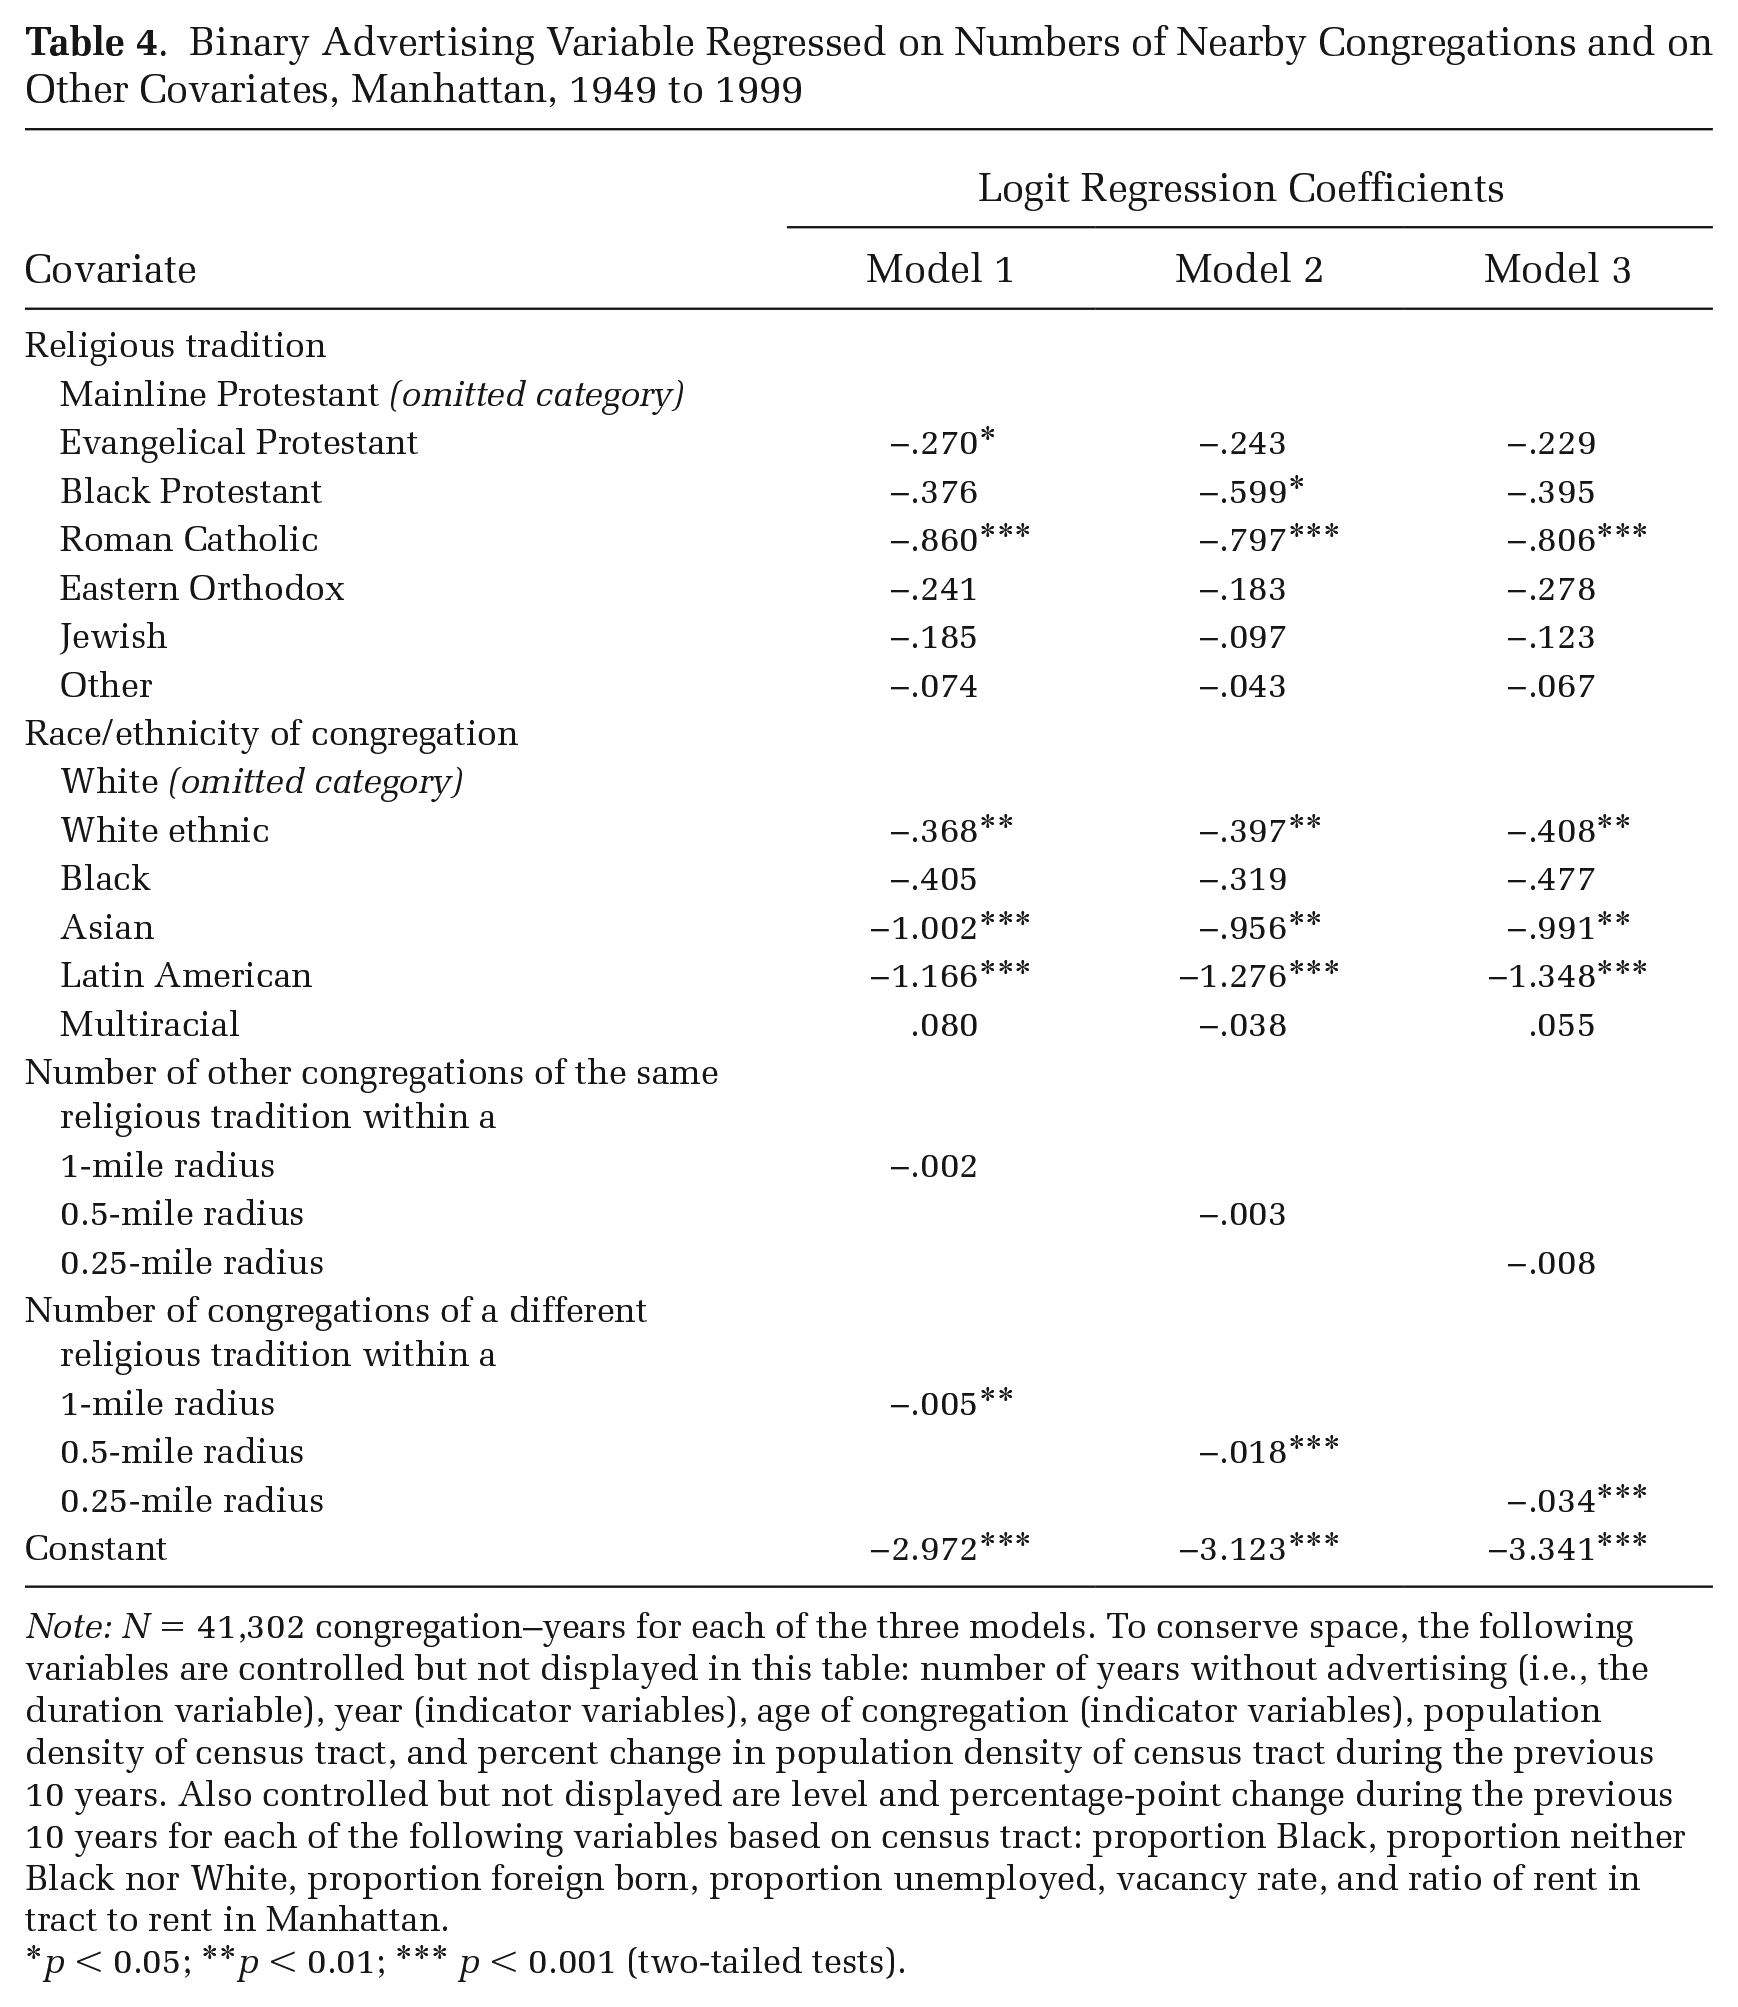
Note: N = 41,302 congregation–years for each of the three models. To conserve space, the following variables are controlled but not displayed in this table: number of years without advertising (i.e., the duration variable), year (indicator variables), age of congregation (indicator variables), population density of census tract, and percent change in population density of census tract during the previous 10 years. Also controlled but not displayed are level and percentage-point change during the previous 10 years for each of the following variables based on census tract: proportion Black, proportion neither Black nor White, proportion foreign born, proportion unemployed, vacancy rate, and ratio of rent in tract to rent in Manhattan.
p < 0.05; **p < 0.01; *** p < 0.001 (two-tailed tests).
Table 5 displays results from a set of regressions with measures of percent change in numbers of nearby congregations during the previous 10 years. 25 As noted earlier, in many cases, the number of congregations of either the same or a different religious tradition within a 0.25-mile radius changed from zero to one, two, or three, creating a calculation of percent change that involves dividing by zero. Dividing by zero would cause many data to be ignored in a nonrandom manner, so I do not include the 0.25-mile measures.
Binary Advertising Variable Regressed on Percent Change over Previous 10 Years in Numbers of Nearby Congregations and on Other Covariates, Manhattan, 1949 to 1999
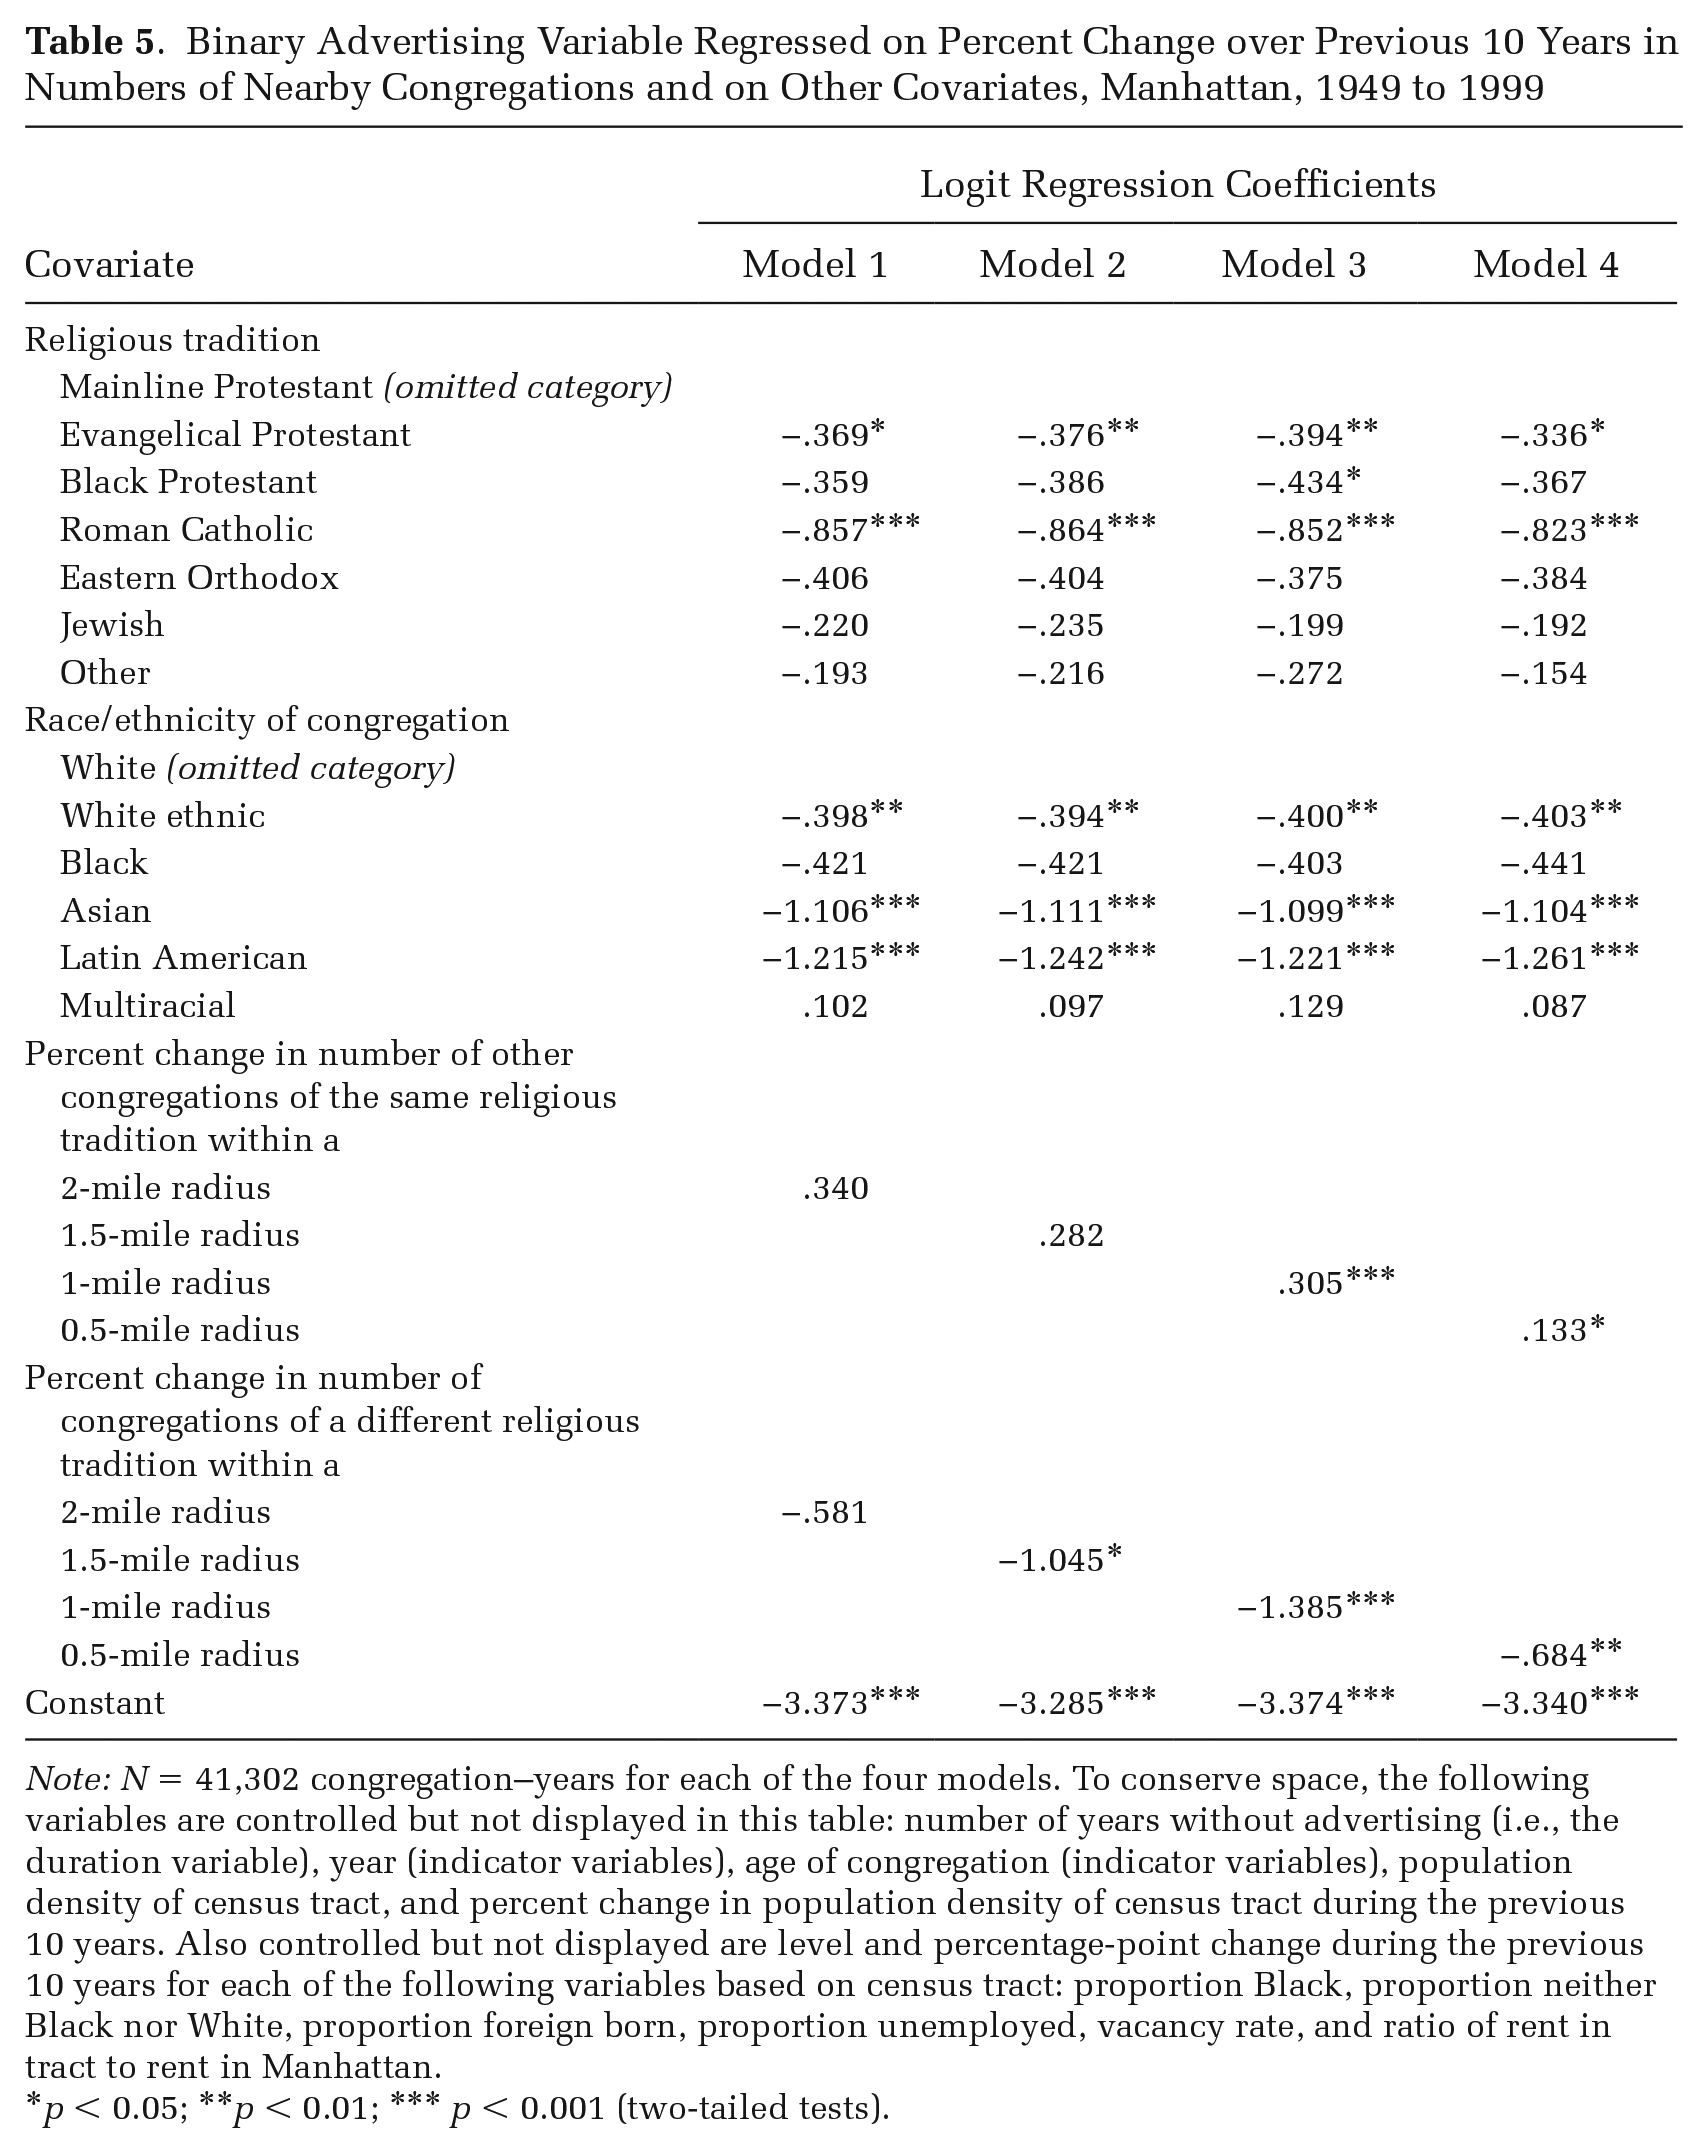
Note: N = 41,302 congregation–years for each of the four models. To conserve space, the following variables are controlled but not displayed in this table: number of years without advertising (i.e., the duration variable), year (indicator variables), age of congregation (indicator variables), population density of census tract, and percent change in population density of census tract during the previous 10 years. Also controlled but not displayed are level and percentage-point change during the previous 10 years for each of the following variables based on census tract: proportion Black, proportion neither Black nor White, proportion foreign born, proportion unemployed, vacancy rate, and ratio of rent in tract to rent in Manhattan.
p < 0.05; **p < 0.01; *** p < 0.001 (two-tailed tests).
Regarding percent change in the number of nearby congregations of the same religious tradition, the 2-mile radius and 1.5-mile radius variables are not significant at p < 0.05, but the 1-mile radius and 0.5-mile radius variables are—at p < 0.001 and p < 0.05, respectively. Thus, Table 5 reveals evidence for Hypothesis 2: an increase in the number of nearby congregations of the same religious tradition as a given congregation is associated with an increase in the probability the congregation advertised. The regression coefficient for the 1-mile radius variable is 2.3 times as large as the coefficient for the 0.5-mile variable, suggesting the 1-mile radius is the more relevant distance.
Hypothesis 4 predicted that an increase in the number of nearby congregations not of the same religious tradition as a given congregation would be associated with a greater probability of that congregation advertising. In actuality, the coefficients for the relevant 1.5-mile, 1-mile, and 0.5-mile radius variables are negative and significant at p < 0.05, p < 0.001, and p < 0.01, respectively. As with the tests of Hypothesis 2, the statistically significant results of the tests of Hypothesis 4 have negative coefficients even though positive coefficients were hypothesized.
Table 6 includes static measures of numbers of nearby congregations and measures of percent change over the previous 10 years in numbers of nearby congregations. As noted earlier, Table 4 does not include the 2-mile and 1.5-mile static measures because of collinearity, and Table 5 does not include the 0.25-mile dynamic measures because of the problem of dividing by zero. Therefore, Table 6 includes only the 1-mile and 0.5-mile measures. For these radii, the models in Table 6 also control for percentage-point change during the previous 10 years in the proportion of nearby congregations that were of the same religious tradition as the focal congregation.
Binary Advertising Variable Regressed on Numbers of Nearby Congregations, Percent Change over Previous 10 Years in Numbers of Nearby Congregations, and Other Covariates, Manhattan, 1949 to 1999
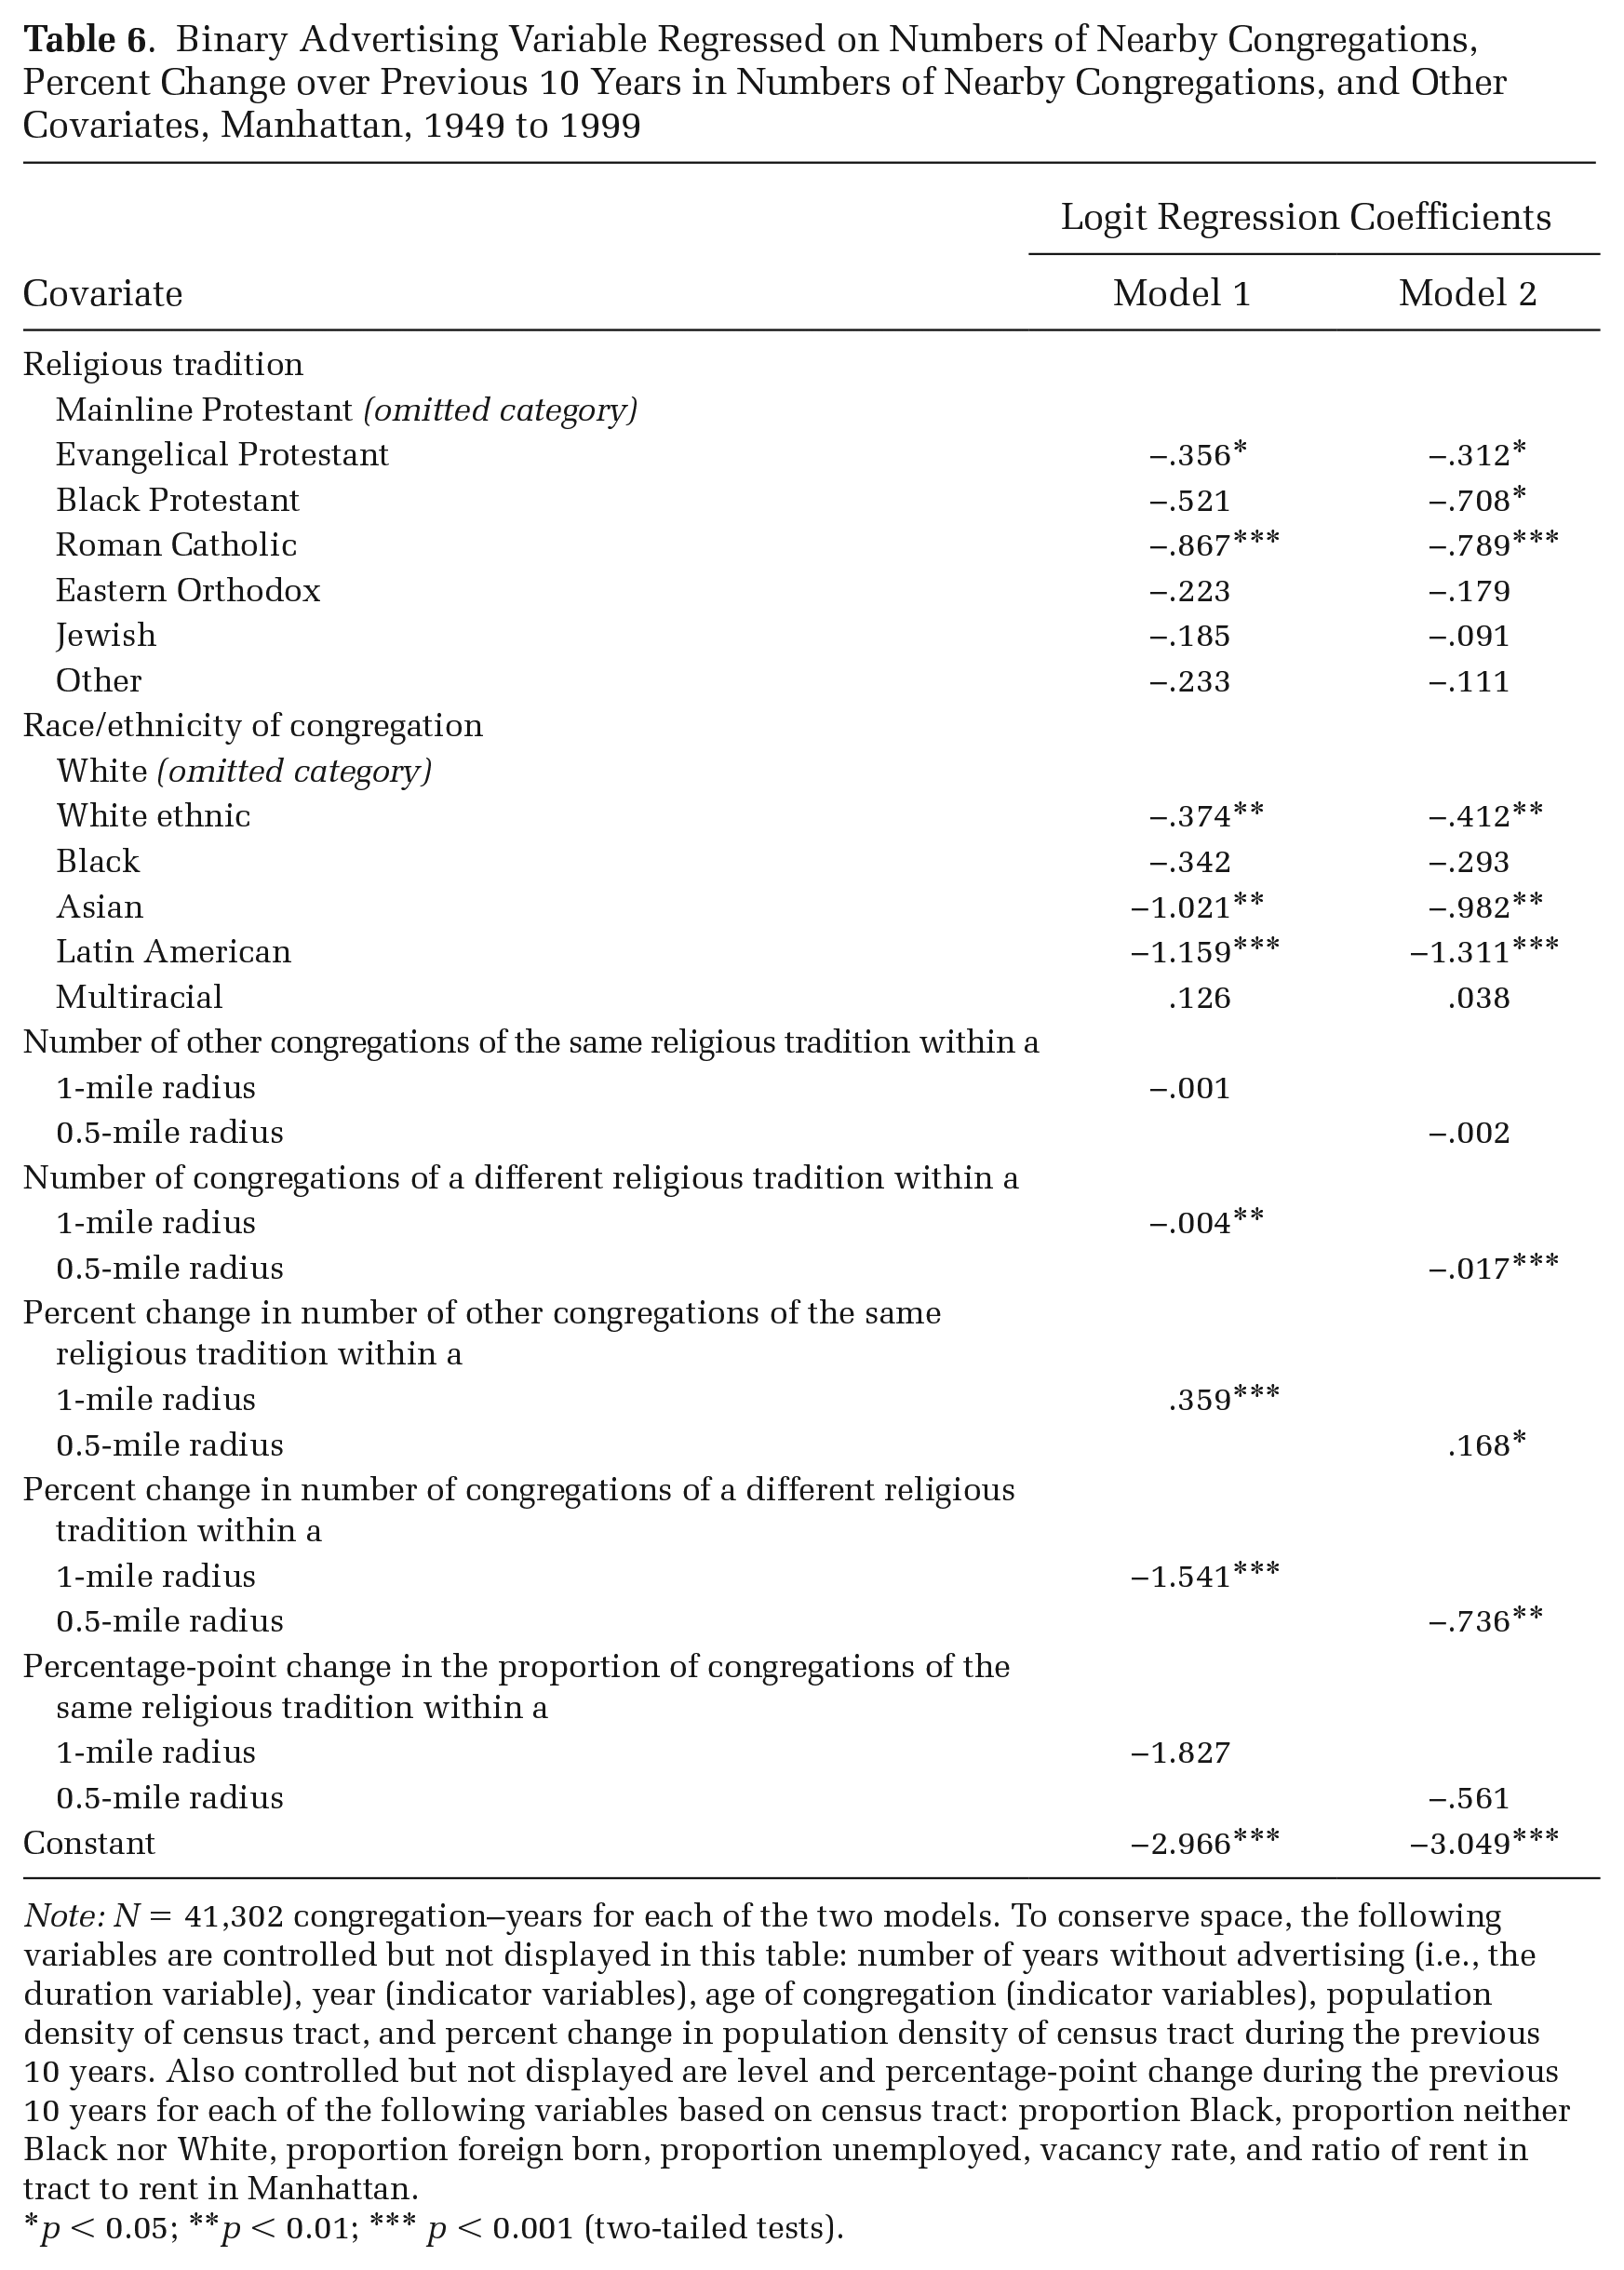
Note: N = 41,302 congregation–years for each of the two models. To conserve space, the following variables are controlled but not displayed in this table: number of years without advertising (i.e., the duration variable), year (indicator variables), age of congregation (indicator variables), population density of census tract, and percent change in population density of census tract during the previous 10 years. Also controlled but not displayed are level and percentage-point change during the previous 10 years for each of the following variables based on census tract: proportion Black, proportion neither Black nor White, proportion foreign born, proportion unemployed, vacancy rate, and ratio of rent in tract to rent in Manhattan.
p < 0.05; **p < 0.01; *** p < 0.001 (two-tailed tests).
The two regressions in Table 6, by accounting for both static and dynamic measures, confirm the general results of Tables 4 and 5. I find no evidence for or against Hypothesis 1, which predicted that a congregation would be more likely to advertise when there were more congregations of its own religious tradition nearby. There is strong evidence in favor of Hypothesis 2, which predicted that an increase in the number of nearby congregations of the same religious tradition as the focal congregation would be associated with an increase in the probability the congregation advertised.
26
(For a 1-mile radius,
Hypothesis 3 predicted that a congregation would be more likely to advertise when there were more congregations not of its own religious tradition nearby. As Table 6 shows, the results are significant in the opposite direction from what Hypothesis 3 predicted. (For a 1-mile radius,
Table 6 also shows that Roman Catholic churches were less likely than mainline Protestant churches to advertise, even with a large number of other variables controlled (p < 0.001). Mainline Protestant congregations appear to compete with one another, whereas Roman Catholic congregations, all considered part of the overall Roman Catholic Church, might not compete much with one another. Because of the parish model of the Catholic Church, many Catholics have tended to attend the closest Catholic congregation, rather than shopping around for churches. Most of Catholic churches’ advertising seems more likely to have been an attempt to reach out to lapsed Catholics. 27
The clearest basic finding of Table 6 is that, for a given congregation, an increase over time in the number of nearby congregations of the same religious tradition is associated with an increase in the probability of advertising, whereas an increase over time in the number of congregations of other religious traditions is associated with a decrease in the probability of advertising. Compared with the relevant 0.5-mile radius coefficients, the relevant 1-mile radius coefficients are larger and are statistically significant at a higher threshold.
Given that the logit coefficients in the tables are not easily interpretable, it is helpful to see graphs of the predicted probability of advertising. In Figures 2 and 3, the y-axis is the predicted probability of advertising. In Figure 2, the x-axis is the percent change over the previous 10 years in the number of congregations within a 1-mile radius that were of the same religious tradition as the focal congregation. In Figure 3, the x-axis is the percent change over the previous 10 years in the number of congregations within a 1-mile radius that were not of the same religious tradition as the focal congregation. In both figures, the span of the x-axis is from approximately two standard deviations below the mean to approximately two standard deviations above the mean.
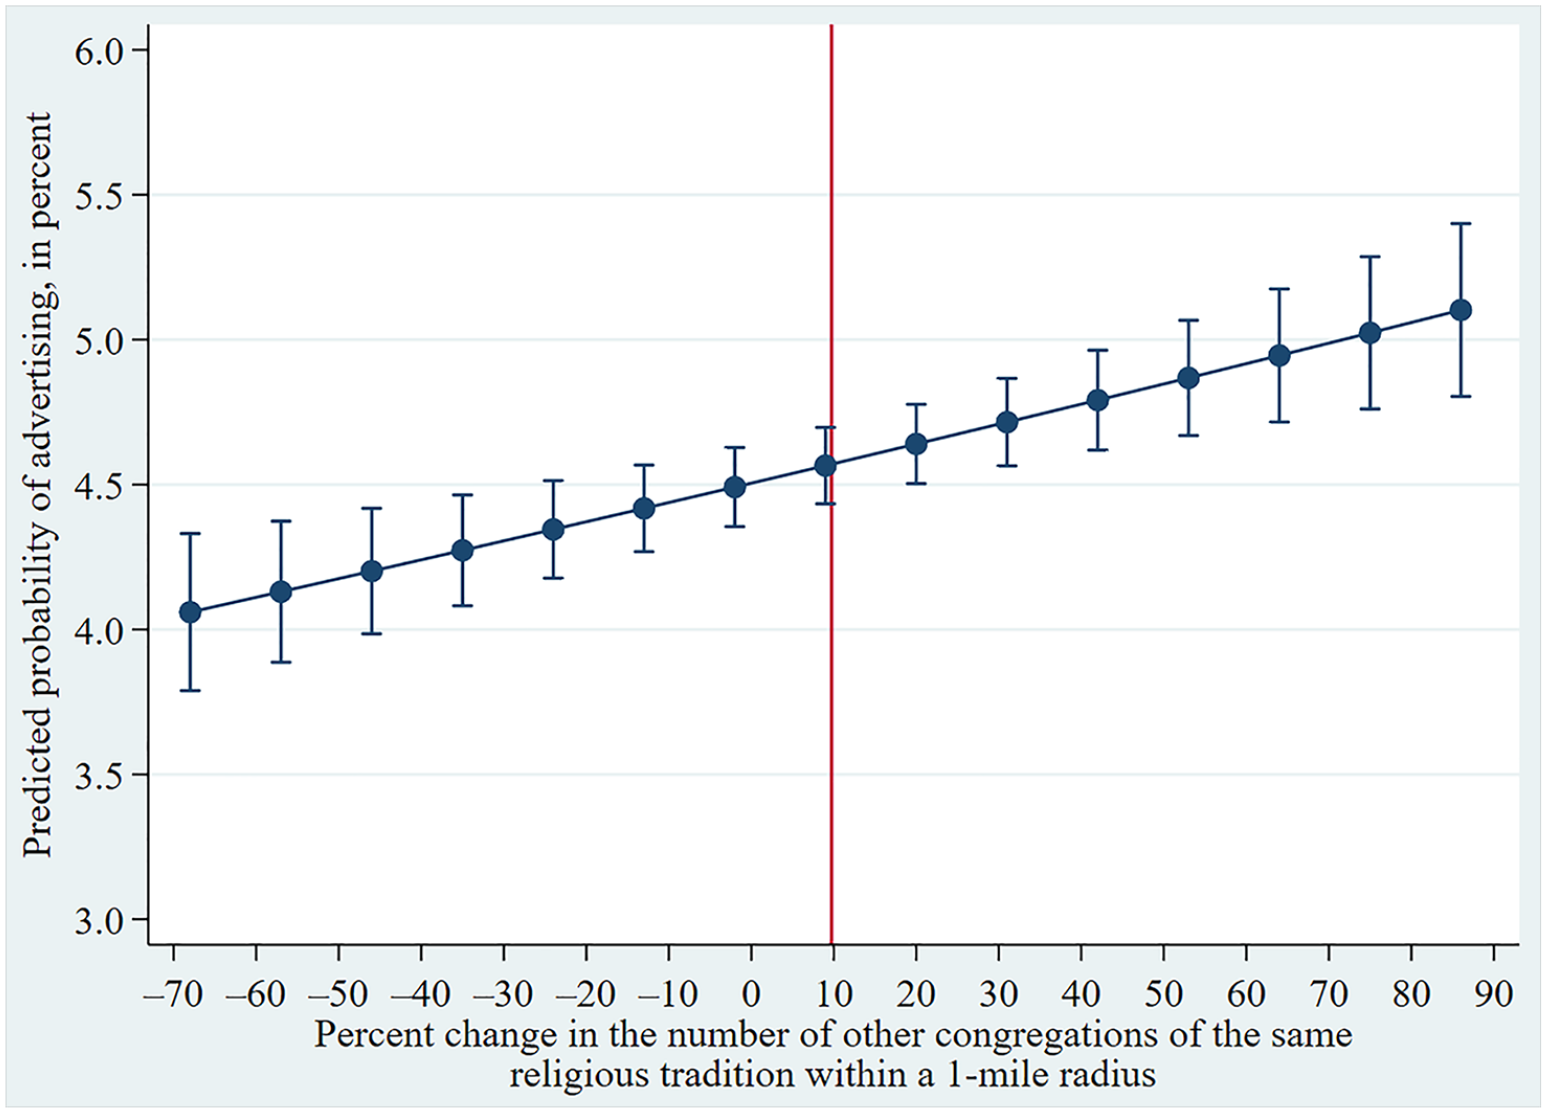
Probability of Advertising for Manhattan Congregations, by Percent Change during Previous 10 Years in Number of Nearby Congregations of the Same Religious Tradition, 1949 to 1999
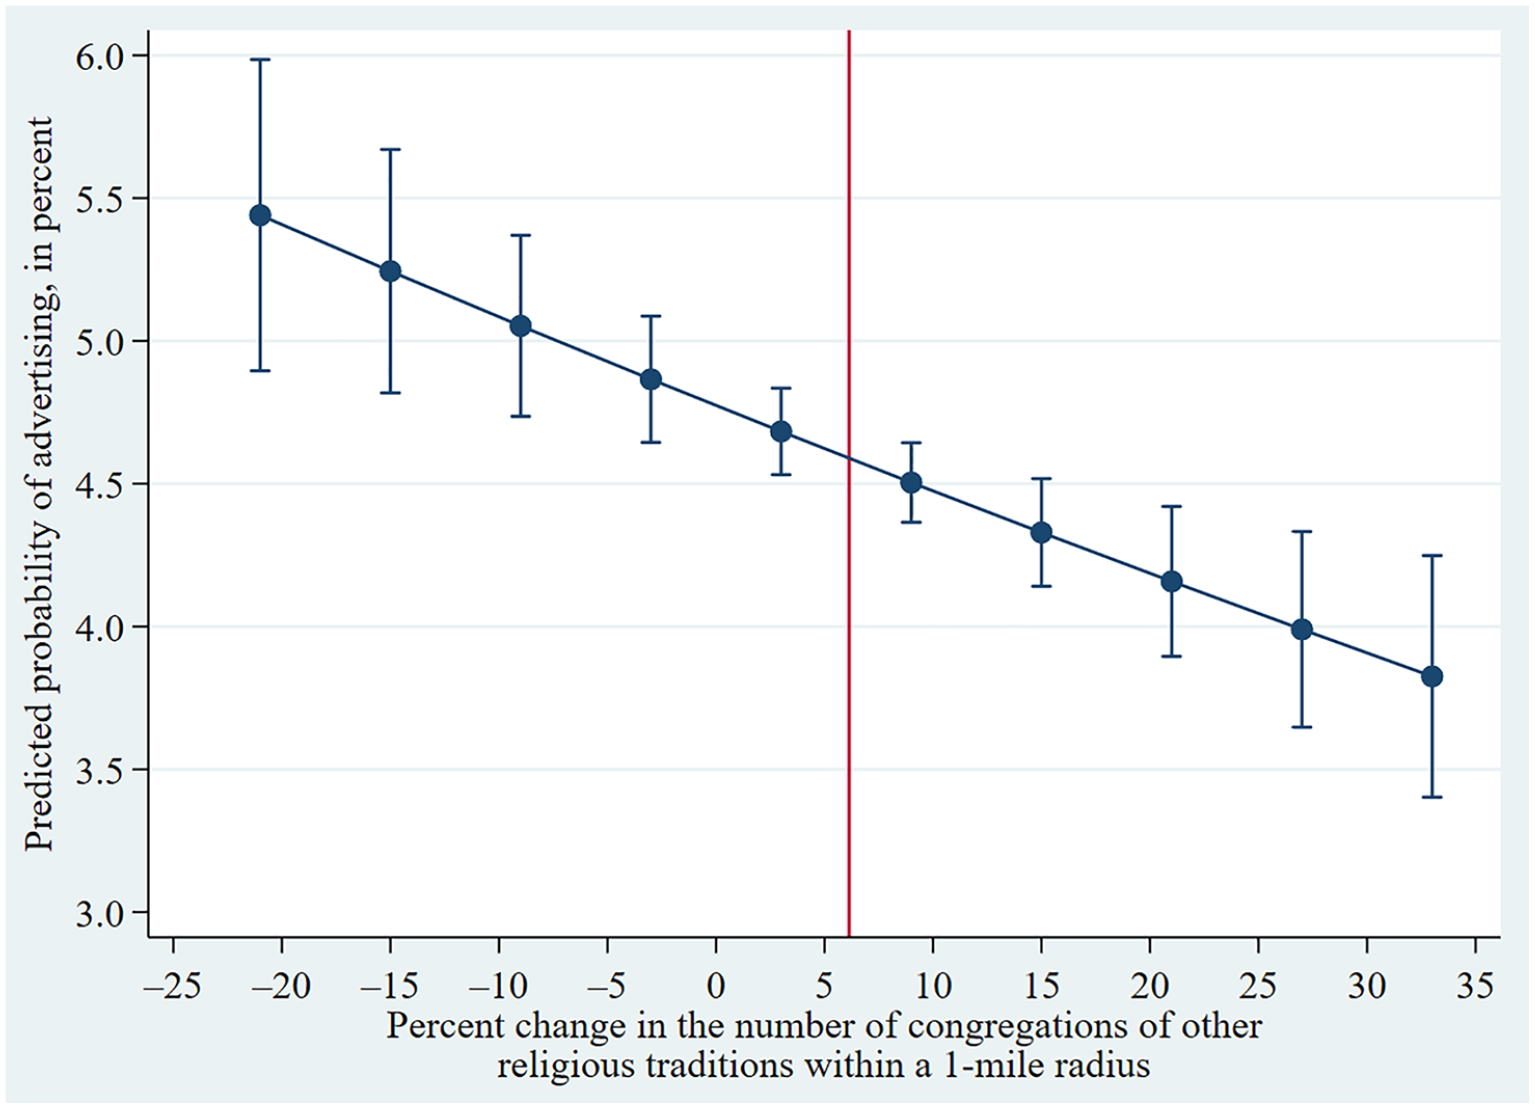
Probability of Advertising for Manhattan Congregations, by Percent Change during Previous 10 Years in Number of Nearby Congregations of Other Religious Traditions, 1949 to 1999
With the exception of a shorter range of values on the x-axis and a slightly steeper slope in Figure 3 compared with Figure 2, 28 the two graphs are essentially mirror images of each other. As shown in Figure 2, if the percent change over the previous 10 years in the number of congregations of the same religious tradition as the congregation in question was a 68 percent decrease (two standard deviations below the mean), the probability of advertising during a given year was 4.1 percent. If the percent change was an 87 percent increase (two standard deviations above the mean), the probability of advertising was 5.1 percent. In percentage-point terms, a congregation whose value on the independent variable was two standard deviations above the mean had a probability of advertising 1.0 percentage point higher than a congregation whose value on the independent variable was two standard deviations below the mean. In percent-difference terms, the latter congregation’s probability of advertising was 26 percent larger than the former congregation’s probability of advertising.
As shown in Figure 3, if the percent change over the previous 10 years in the number of congregations that were not of the same religious tradition as the focal congregation was a 21 percent decrease (two standard deviations below the mean), the probability of advertising was 5.4 percent. If the percent change was a 34 percent increase (two standard deviations above the mean), the probability of advertising was 3.8 percent. In percentage-point terms, a congregation whose value on the independent variable was two standard deviations above the mean had a probability of advertising 1.6 percentage points higher than a congregation whose value on the independent variable was two standard deviations below the mean. In percent-difference terms, the latter congregation’s probability of advertising was 30 percent smaller than the former congregation’s probability of advertising.
Discussion
This study examined several decades of data on the religious congregations of Manhattan to address crucial questions in the sociology of religion and to consider broader sociological implications regarding competition. Competition is central to religious-economies theory (RET) (Stark and Bainbridge 1985, 1987). Yet, much has been written arguing in favor of RET (Finke and Stark 2005; Stark and Finke 2000) or against it (Bruce 2011; Olson et al. 2020) with (1) an implicit assumption of denominations (as opposed to congregations) as the most relevant players, and with (2) great ambiguity regarding which groups are expected to compete against which other groups. Those two issues have contributed substantially to muddling the debate, with neither side conceding much (if anything).
To address the first issue, I argue for the importance of congregations as units of analysis for studying competition, and I examine whether competitive pressure incites advertising among congregations. To address the second issue, I distinguish between two latent strands of thought in the RET literature that I call “unbounded RET” and “within-traditions RET.” If unbounded RET is the correct model, congregations of all faiths and denominations compete for all types of potential congregants, including people from disparate faiths. If within-traditions RET is the correct model, competition exists among theologically similar congregations but not among theologically dissimilar congregations.
I find evidence in favor of within-traditions RET as well as strong evidence against unbounded RET. Serving as evidence for within-traditions RET, when there was an increase over time in the number of nearby congregations of the same religious tradition as the focal congregation, that congregation’s probability of advertising increased. 29 The following results were contrary to expectations and militate against unbounded RET: (1) the more congregations there were near a given congregation that were not of the same religious tradition as that congregation, the less likely that congregation was to advertise, and (2) when there was an increase over time in the number of nearby congregations that were not of the same religious tradition as the focal congregation, that congregation’s probability of advertising decreased. Some studies have made arguments about congregations’ reactions, or lack thereof, to various changes in the broader environment (e.g., Ammerman 1997; Dougherty and Mulder 2009), but until now it has been unclear whether congregations compete with one another at all.
On the one hand, relatively drastic differences in competitive pressure are associated with arguably small differences in the propensity to advertise in the yellow pages. On the other hand, yellow-pages advertising is only one type of congregational marketing (along with changing the style of services, adding programs, recruiting new clergy, and so forth), so we may consider yellow-pages advertising to be indicative of broader marketing efforts. 30 Furthermore, a relatively small increase in the probability of advertising during one year can result in a much more substantial probability of advertising during a longer period. For example, a congregation with a 4 percent chance of advertising during a given year has a 34 percent chance of advertising at least once during a 10-year period; in comparison, a congregation with a 6 percent chance of advertising during a given year has a 46 percent chance of advertising at least once during a 10-year period.
Why has the debate over RET been enduring and robust? For one thing, the theory is unusual in that it aims to explain religion as a whole—that is, from the roots of religion to its manifestations in modern society, and from the micro to the macro. Because RET is a comprehensive theory that opposes the secularization thesis, the extent to which it reflects reality has major implications for explaining and predicting religious change and vitality.
The evidence against unbounded RET in the present study corresponds to some findings from outside the sociology of religion. For example, Barnett and Woywode (2004:1483) find no evidence for competition between right-wing and left-wing newspapers despite competition between centrist newspapers and each of the other two groups. Indeed, the general idea that some niches do not overlap has been theorized in the organizations literature (Baum and Singh 1994; Hannan, Carroll, and Pólos 2003). If unbounded RET were a confirmed phenomenon, then all groups would be competing against all other groups, and religious competition would have more space for shaping religious change. If competition exists only within religious traditions, then competition may still be a potent force overall but likely would be irrelevant in a town with one synagogue, one Presbyterian church, and one Pentecostal church. Clearly, some people do switch to a much different religious tradition, but most advertising funds may be better spent reaching out to individuals from similar religious backgrounds.
Recall that there is no discernible relationship between the number of nearby congregations theologically similar to a given congregation and whether that congregation advertised, whereas there is a discernible positive association between the change in the number of theologically similar nearby congregations and whether the focal congregation advertised. These results resemble those of Wilde’s (2007) study of the votes of high-ranking Roman Catholic Church officials at Vatican II. Applying field theory (Fligstein and McAdam 2012), which views (in)stability as a key variable, Wilde argues that bishops from countries where religious competition was intensifying were more likely than bishops from stable “religious fields” to prioritize marketing; whatever the Church’s market share was in a given country at the time was unrelated to the prioritization of marketing. If congregations ignore levels of competitive pressure despite responding to changes in competitive pressure, that supports the competition tenet of RET, but it appears to deal another blow to RET’s conception of religious organizations as highly rational actors.
It is also notable that both the number of nearby congregations of other religious traditions and the increase in that number are negatively associated with advertising, not simply uncorrelated with advertising. A possible interpretation stems from the literature on ethnic competition: for a given group of people, both the nearby presence of other groups and an increase in that presence heighten awareness of those other groups (Ma et al. 2020; Olzak, Shanahan, and West 1994). Perhaps observing large numbers of organizations that are not a competitive threat makes an organization more confident it has successfully found a niche, or perhaps seeing evidence of worship from disparate traditions makes advertising seem less worthwhile, as the people from those disparate traditions are not likely to cross traditions. However, advertising less in these circumstances does not seem truly rational either, because both the number of congregations from one’s own tradition and the change in that number already are accounted for in the models. An important task for future research is to gauge how competition compares with other influences in motivating the actions of religious organizations.
One limitation of this study is that there is no control for the size of congregations. Absent detailed congregational histories, it is not possible to know how many members each of the 1,455 congregations had at the start, much less track changes in those figures over time. Another obvious limitation is that the study is limited to Manhattan. Manhattan clearly is not a representative selection of any state, region, or country. However, there is reason to believe Manhattan to be similar to other densely populated areas in the United States.
Conclusions
Additional Implications for the Sociology of Religion
RET initially was proposed as a rebuttal to the secularization thesis. Is modernity causing demand for religion, and consequently religious participation, to decline over time (as the secularization thesis predicts)? Or is religion fully alive and well, with varying levels of supply and religious competition driving differences in religious adherence? Framed this way, RET and the secularization thesis are certainly at odds with each other; indeed, scholars generally continue to view them as two completely different paradigms. However, if RET is clarified and modified, there need not be a stark choice between the two theories.
Much of the RET-versus-secularization debate has revolved around the empirical question of whether religious pluralism increases religious participation or decreases it. In the first case, competition provides incentives for suppliers of religion to work harder; those suppliers then produce more and better “products,” bringing more adherents into the fold (Stark and Finke 2000). In the second case, people’s faith erodes when they encounter different theologies—Berger’s (1967) “sacred canopy” argument—and religious participation consequently declines. After years of methodological challenges (Voas et al. 2002), Koçak and Carroll (2008) and Olson and colleagues (2020) found that pluralism—at least as they define it—is associated with lower religious participation. To add to that, religious-service attendance continues to decline in the Western world—including in the United States (Bruce 2011; Voas and Chaves 2016). To many, it seemed as if RET had completely failed.
But how does one define “pluralism”? Koçak and Carroll (2008) used the broad categories of Protestant, Catholic, Jewish, and other, whereas Olson and colleagues (2020) considered individual denominations. Either way, potential competition specifically within closely related families of denominations or within individual denominations is not examined. Perhaps the individual worldviews of Baptists and Buddhists tend to erode a bit when the two groups come into contact, as proponents of the secularization thesis maintain. Regardless, it is plausible that the faith of Baptists and of Church of God members tends to remain intact upon intergroup contact, given the groups’ strong similarities; moreover, it is plausible that having the option of a nearby theologically similar group to switch to would lead many people to keep attending religious services instead of ceasing to attend if they become dissatisfied.
Consider, for example, a 95 percent Protestant community in Koçak and Carroll’s (2008) study, and assume either that the great majority of Protestants in this particular community are mainline or that they are evangelical. The Sacred Canopy interpretation of the high religious participation of that community would be that people’s beliefs are reinforced by their neighbors’ similar beliefs. While that might be true, an alternative interpretation is that most people in that community have many suitable congregations to choose from that are essentially substitutable (Olson 2002) for one another—and that these people therefore benefit from religious competition and end up participating more. Of course, these two interpretations are not mutually exclusive. Similarly, a portion of the effects assumed to be driven by “sacred canopies” in other studies (Lim and de Graaf 2021; Olson et al. 2020) might in fact be driven by religious competition.
Thus, if modernity does engender secularization and if “canopy fraying” is an important mechanism as some scholars claim it to be (Berger 1967; Koçak and Carroll 2008; Lim and de Graaf 2021; Olson et al. 2020), then it is possible that much of religious stasis and dynamism could be explained by the interplay of two countervailing forces: (1) secularization caused by forces of modernity, including collisions among disparate religious groups; and (2) religious pluralism, competition, and vitality within religious traditions. To be clear, the present analysis does not provide evidence that pluralism within religious traditions increases religious participation. Nevertheless, this study does distinguish between unbounded RET and within-traditions RET and does provide the first quantitative evidence that congregations compete. In addition, examining competition within religious traditions may elucidate some previous results that appear contradictory. For example, pluralism is positively associated with participation in 1865 data on New York towns but negatively associated with participation in 1990 data on U.S. counties (Montgomery 2003). A possible explanation is that most New York towns in 1865 contained a mix of relatively similar Protestant denominations, whereas many U.S. counties in 1990 were far more diverse.
In summary, we need not dismiss RET’s insights about religious competition whatever the verdict on secularization. An obvious task for future research is to test whether pluralism within theologically similar religious groups promotes religious participation. A larger task for future research is to construct a multi-tiered model of religious competition, examining national and local levels as well as interactions among levels. Obviously, such a theory is beyond the scope of the present analysis, but this study has added key building blocks.
Broader Implications
This study surfaces three critical issues for understanding competition between social units in any ecological space. One is specifying the proper unit that is competing. In the present case, it was not religions; Judaism did not compete with Catholicism. Nor was it denominations as organizational and doctrinal bodies. It was specific congregations. Applied to the Chicago School, we can ask whether the proper unit was the ethnic group, or perhaps more properly whether it was particular ethnic networks or immigrant households that actually competed. In studies of businesses, we can ask whether large conglomerates compete, whether it is particular divisions that compete against comparable divisions in other conglomerates, or whether competition exists chiefly at the local establishment level.
Second, identifying the proper unit of analysis goes along with determining what is being competed for. In the present study, congregations competed for adherents from their own general religious traditions, not for adherents of very different traditions. Today’s corporate marketing managers try hard to identify the specific type of consumer who might be drawn to their own rather than their competitors’ products, not wasting effort on converting the improbable. Political managers do the same in their search for the mobilizable and the convertible. It is thus important across many sociological subfields to precisely identify the “field” of competition (Fligstein and McAdam 2012).
Third, scholars must continue investigating potential sources of competition, which organizational sociologists rarely do (Arora-Jonsson et al. 2020). For congregations in this study, changes over time in the numbers of similar congregations in a given local area are a key driver of competition, a finding that fits with White’s (1981) argument that firms base their competitive actions on their observations of their competitors’ behavior. To my knowledge, this finding is unique in the organizations literature, and it is conceivable that it generalizes to other types of organizations. For example, like congregations, business establishments’ marketing efforts might be influenced more by changes in the number of similar establishments nearby than by the number that are nearby at any given time. In addition, scholars of social movements and nonprofits have studied populations of organizations (Miner, Amburgey, and Stearns 1990; Minkoff 1993), but to my knowledge the present analysis is the first study of advertising in a population of non-business entities in close geographic proximity to one another. Thus, my results imply that non-business organizations do respond to incentives to advertise.
These three analytic concerns turned out to be important in understanding religious competition among Manhattan’s congregations of the twentieth century, and they are present in the many sociological analyses that rely on a mechanism of competition.
Footnotes
Acknowledgements
The author thanks Robert Braun, Jason Ferguson, Claude Fischer, Heather Haveman, Matty Lichtenstein, Trond Petersen, Sophia Rabe-Hesketh, Ann Swidler, and the members of the former MAX-Soc workshop at UC-Berkeley for their crucial advice, and also thanks all research assistants for their hard work.
Author’s Note
Casey P. Homan wrote this article before his current employment at the U.S. Census Bureau. The views expressed are the author’s alone and not those of the U.S. Census Bureau.
Funding
This research was supported by grants from the Institute for Humane Studies and the Mercatus Center.